Introduction
Hepatitis B virus (HBV) infection remains a severe
clinical issue worldwide, particularly in China (1), despite the number of prophylactic
vaccines and effective anti-viral medicines that are available to
treat HBV. The social and economic burden remains serious, but no
concerted efforts have been made by communities to increase
awareness and improve access to care (2–4). In
China, the rates of HBV infection vary greatly across different
regions and populations (5), and the
incurred liver damage also varies in each individual due to
physical differences.
HBV leads to a variety of clinical symptoms, ranging
from the affected individual being an asymptomatic carrier to
hepatocellular carcinoma (HCC). Progression of HBV infection is as
a consequence of combined factors, including the host immune
response, as well as age, sex, viral genotypes and environmental
factors (6–8). According to a statistical survey, male
and female patients present with different responses to HBV
infection and males have a greater risk of developing HCC than
females (9). This may be due to the
opposite effects of the sex hormones androgen and estrogen
(8). In addition, age appears to
serve an important role in predicting significant fibrosis
progression in patients and in chronic hepatitis B treatment
(10,11). It was therefore hypothesized that the
host's characteristics may be critical regarding the progression of
HBV infection, which should be taken into consideration by
physicians when selecting the correct treatment and prevention
strategy.
The progression of HBV infection may be detected by
histological observation of the accumulation of fibrosis and
physiologically by liver function injury (12). Certain studies have demonstrated that
liver function markers, including albumin (ALB), bilirubin, alanine
aminotransferase (ALT), aspartate aminotransferase (AST) and
AST/ALT exhibited a marked variation among different patients
infected with HBV (13). In
addition, HBV DNA serves a central role in maintaining persistent
infection (14). A number of
previous studies have revealed that the HBV DNA levels are
associated with the extent of liver damage and liver fibrosis
severity (15,16). It may be used as an independent
factor to predict the response to anti-viral treatment (17–19). In
addition, HBV DNA is a virological marker that reflects HBV
replication levels.
Hepatic fibrosis is the pathological change caused
by chronic liver damage. It is a necessary developmental stage from
chronic liver disease to liver cirrhosis (20). The early stage of hepatic fibrosis is
reversible, and therefore the prevention and control of early liver
fibrosis are of great significance. Although numerous anti-viral
drugs have been introduced to control HBV replication, the
subsequent emergence of HBV drug resistance has made it harder to
control HBV infection and prevent liver fibrosis (21). The exploration of biomarkers of early
liver fibrosis remains a feasible strategy to identify and possibly
prevent disease progression in chronic HBV infection in the
future.
Hepatitis B e antigen (HBeAg) is a critical
indicator to determine the severity of the disease and it is
associated with the activity of viral replication and infectivity
(22). In addition, HBeAg analysis
is useful for predicting seroconversion and disease progression
(23). However, how HBeAg expression
influences HBV DNA levels, liver function and hepatic fibrosis
remains elusive.
The present study investigated the potential role of
sex and age in HBV infection depending on different HBeAg statuses,
providing a further reference for clinical treatment strategies in
different patients. A total of 478 patients were enrolled and were
then divided into 2 groups according to their HBeAg serum levels.
The serum biomarkers of liver function, HBV DNA levels and hepatic
fibrosis indices were then analyzed and compared between different
subgroups. In addition, the roles of the HBeAg expression status in
HBV infection progression were explored. The correlation between
HBeAg expression status and either HBV DNA levels, liver function
biomarkers or fibrosis index values were also determined. The
results demonstrated that sex, age and HBeAg expression status
markedly influenced the progression of the HBV infection as well as
the viral load represented by HBV DNA.
Materials and methods
Study population
A total of 478 patients admitted to Gansu Provincial
Hospital (Gansu, China) between March 2015 and July 2016 were
enrolled in the present study. Participants were permanent
residents of Gansu province, recruited from rural and urban areas.
The diagnostic criteria used were based on the Guidelines for the
Prevention and Treatment of Chronic Hepatitis B from 2015, which
was issued by Chinese Society of Hepatology of Chinese Medical
Association and the Society of Infectious Diseases from the Chinese
Medical Association (24). The
present study was approved by the Ethics Review Committee of Gansu
Provincial Hospital (Lanzhou, China) and all patients provided
their written informed and consent.
All of the patients exhibited impaired liver
function or extremely high viral load and had been serum hepatitis
B surface antigen (HBsAg)-positive for >6 months without
hepatitis C virus or human immunodeficiency virus coinfection.
Patients exhibited no evidence of alcohol abuse at the time of
diagnosis and initiation of the study. The baseline values of each
patient was collected and analyzed. There were no differences
between age/sex either for the duration of treatment or that of
infection. However, there may be some errors in data due to
patients incorrectly recalling the time of infection. Blood samples
were obtained from all of the patients following treatment, and the
majority of the enrolled patients had received entecavir (ETV)
and/or tenofovir (TDF) therapy, the first-line drugs according to
the abovementioned guidelines. The number of patients treated with
different drugs to ETV and TDF was relatively small. Demographic
characteristics, including gender and age, were recorded during
interviews.
Virological and serological marker
tests
Quantitation of HBV DNA and 13 liver function
biomarkers, as well as determination of the HBsAg and HBeAg status,
were performed in all of the patients. The detection of HBV DNA was
performed by using real-time fluorescent-quantitative (q)PCR on a
Roche Light Cycler 480II (Roche Diagnostics). The HBV DNA
PCR-Fluorescence Quantitative Diagnostic kit (Shenzhen Qiagen
Bio-Engineering, Shenzhen, China) was used for HBV DNA extraction.
The reaction volume was 50 µl. The thermocycling conditions were as
follows: 37°C for 5 min, then 95°C for 5 min, followed by 45 cycles
of 95°C for 15 sec and 60°C for 40 sec, and then a final extension
at 72°C for 5 min.
Liver function biomarkers, including total protein
(TP), ALB, globulin (GLB), total bilirubin (TBIL), direct bilirubin
(DBIL), indirect bilirubin (IBIL), ALT, AST, γ-glutamyl
transpeptidase (GGT), alkaline phosphatase (ALP) and total biliary
acid (TBA) were measured using an Olympus AU5400 auto biochemical
analyzer (Olympus Corp.) using the manufacturer's reagents. The ALB
vs. GLB ratio (A/G) and AST/ALT were calculated according to the
values of ALB, GLB, ALT and AST. The hepatic fibrosis indexes were
quantified using chemiluminescence (AutoLumo A2000; AutoBio
Diagnostics Co., Ltd.). The experimental methods and reference
range of each parameter are summarized in Table I. HBsAg and HBeAg levels were
detected by I2000 immunoassay (Abbott Pharmaceutical Co., Ltd.) in
accordance with the manufacturer's protocols. All serological
markers were tested by the Clinical Laboratory Center of Gansu
Provincial Hospital (Lanzhou, China).
 | Table I.Summary of test methods and reference
ranges for each parameter. |
Table I.
Summary of test methods and reference
ranges for each parameter.
| Parameter | Method | Reference
range |
|---|
| TP (g/l) | Biuret method | 65.0–85.0 |
| ALB (g/l) | Bromocresol green
method | 40.0–55.0 |
| TBIL (µmol/l) | Diazonium salt
method |
5.1–29.6 |
| DBIL (µmol/l) | Diazonium salt
method | 0.0–6.8 |
| ALT (U/l) | Alanine substrate
method |
9.0–50.0 |
| AST (U/l) | Aspartic acid
substrate method | 15.0–40.0 |
| GGT (U/l) | GCANA substrate
method | 10.0–60.0 |
| ALP (U/l) | NPP substrate-AMP
buffer method |
45.0–125.0 |
| TBA (µmol/l) | Enzyme
colorimetry | 0–15.0 |
| HA (ng/ml) | Magnetic particle
chemiluminescence | <120.0 |
| LN (ng/ml) | Magnetic particle
chemiluminescence | <130.0 |
| PCIIINP
(ng/ml) | Magnetic particle
chemiluminescence | <15.0 |
| IV-C (ng/ml) | Magnetic particle
chemiluminescence | <95.0 |
Statistical analysis
SPSS statistical software (version 19.0; IBM Corp.)
was used for statistical analysis. Descriptive statistics,
including the mean, standard deviation, frequency and rate were
used. All values are expressed as the mean ± standard deviation.
Furthermore, the Chi-square test and independent-samples Student's
t-test were used to compare parameters among different groups.
Spearman correlation coefficient analysis was employed to explore
the correlation between different DNA levels and the patients'
liver function. One-way analysis of variance and an
independent-samples Student's t-test were used to analyze the
differences between two groups following correction via the
Bonferroni method in various age groups. The 95% confidence
intervals were determined for all results. P<0.05 was considered
to indicate a statistically significant difference.
Results
Population characteristics
A total of 478 HBsAg-positive patients were selected
for the present study. The baseline demographic data of the cohort
were obtained through patient interviews, written records and the
hospital's electronic database. Laboratory data were obtained from
the database of Gansu Province Hospital (Lanzhou, China). As
summarized in Table II, of the 478
patients aged from 4 to 90 years (mean age, 41.01±14.31 years), 254
were male (53.1%) and 224 were female (46.9%). Furthermore, 254
patients (53.1%) were HBeAg-negative and 224 (46.9%) were
HBeAg-positive. All patients donated blood samples and had
undergone HBV DNA detection. The mean peripheral HBV viral load in
log10 was 4.45±1.87 IU/ml. HBV DNA levels were
undetectable in 32.6% (156/478) of patients.
| Table II.Characteristics of the patients with
hepatitis B virus (n=478). |
Table II.
Characteristics of the patients with
hepatitis B virus (n=478).
| Characteristic | Value |
|---|
| Sex |
|
Male | 254
(53.1) |
|
Female | 224
(46.9) |
| Age (years) | 41.01±14.31
(4–90) |
| HBeAg |
|
Negative | 254
(53.1) |
|
Positive | 224
(46.9) |
| HBV-DNA |
|
Negative | 156
(32.6) |
|
Positive | 322
(67.4) |
|
(log10IU/ml) | 4.45±1.87
(2.77–8.00) |
The laboratory parameters of all patients and the
proportion of patients beyond the normal range were calculated and
are presented in Table III. The
majority of patients in the present study exhibited reduced liver
function and the rates of hepatic fibrosis abnormalities were also
lower. Only procollagen III N-terminal peptide (PCIIINP) was
observed to be increased in 62.4% of patients infected with
HBV.
| Table III.Comparison of hepatic fibrosis and
liver function parameters between HBeAg-positive and -negative
groups. |
Table III.
Comparison of hepatic fibrosis and
liver function parameters between HBeAg-positive and -negative
groups.
| Parameter | Value | Ratio of patients
beyond the normal range (%) | HBeAg-negative
(n=254) | HBeAg-positive
(n=224) | P-value |
|---|
| Sexa |
|
|
|
| 0.044 |
| Male
(n=254) | N/A | N/A | 124 (49) | 130 (51) |
|
| Female
(n=224) | N/A | N/A | 130 (58) | 94 (42) |
|
| Age
(years)b | N/A | N/A |
44.37±14.78 |
37.21±12.75 | <0.001 |
|
| HBV
DNAa |
|
|
|
| <0.001 |
|
Negative | N/A | N/A | 125 (49.2) | 31 (13.8) |
|
Positive | N/A | N/A | 129 (50.8) | 193 (86.2) |
|
(log10IU/ml) | N/A | N/A |
3.50±1.22 |
5.53±1.90 | <0.001 |
| Liver function
parametersb |
| TP
(g/l) | 69.07±7.14
(37–86) | 22.6 | 68.26±7.77 | 70.00±6.24 | 0.007 |
| ALB
(g/l) | 42.40±6.54
(4.0–52.8) | 29.9 | 42.46±6.30 | 42.34±6.82 | 0.837 |
| GLB
(g/l) | 26.58±5.01
(15.0–49.5) | 8.8 | 24.33±3.37 | 28.19±4.89 | <0.001 |
|
A/G | 1.66±0.41
(0.57–3.46) | 16.9 |
1.79±0.36 |
1.56±0.38 | <0.001 |
| TBIL
(µmol/l) | 25.60±44.41
(4.7–627.2) | 17.4 |
24.52±45.15 |
26.83±43.62 | 0.573 |
| DBIL
(µmol/l) | 8.64±25.54
(0.3–385.2) | 23.8 |
8.25±27.06 |
9.09±23.74 | 0.722 |
| IBIL
(µmol/l) | 16.96±20.69
(2.3–242.0) | 13.6 |
16.27±18.83 |
17.74±22.63 | 0.440 |
| ALT
(U/l) | 83.93±233.27
(7–3404) | 34.5 |
65.73±189.82 |
104.58±273.35 | 0.070 |
| AST
(U/l) | 76.74±225.06
(8–2360) | 37.7 |
55.85±175.61 |
102.55±272.62 | 0.081 |
|
AST/ALT | 1.05±1.01
(0.18–15.1) | NA |
1.04±0.68 |
1.06±1.30 | 0.801 |
| GGT
(U/l) | 51.49±73.18
(6.5–718.3) | 27.8 |
41.92±62.20 |
63.45±83.65 | 0.012 |
| ALP
(U/l) | 104.38±65.23
(3–755) | 21.4 |
97.28±43.73 |
113.21±84.05 | 0.044 |
| TBA
(µmol/l) | 15.08±38.30
(0.1–331) | 18.8 | 9.71±21.41 |
21.74±51.48 | 0.011 |
| Hepatic
fibrosisb |
| HA
(ng/ml) | 178.50±171.47
(15–725) | 47.1 |
159.83±143.02 |
220.32±220.23 | 0.216 |
| LN
(ng/ml) | 106.25±69.11
(19–520) | 23.5 | 101.64±51.77 |
115.64±95.72 | 0.474 |
| PCIIINP
(ng/ml) | 58.16±60.04
(5–295) | 62.4 |
57.69±52.44 |
59.11±74.25 | 0.919 |
| IV-C
(ng/ml) | 87.68±67.46
(16–362) | 27.1 |
75.51±52.62 |
112.46±86.40 | 0.044 |
Clinical measurements based on the
expression of HBeAg
In general, HBeAg is a critical serological marker
used to assess the infectivity and prognosis of a patient (23). To investigate whether qualitative
HBeAg may serve as a marker to indicate the degree of liver injury
in HBV carriers, all of the 478 patients were divided into 2 groups
according to their HBeAg status (Table
III), and the association between HBeAg and HBV replication
levels, as well as parameters of liver function, were analyzed.
First, the population demographics were analyzed
based on gender and age. Of note, it was indicated that a larger
proportion of male patients were HBeAg-positive when compared with
female patients, while more female than male patients were
HBeAg-negative (χ2=4.061, P=0.044; Table III). The average age of
HBeAg-positive patients was 37.21±12.75 years, which was
significantly lower than that in patients with undetectable HBeAg
in their peripheral blood (P<0.05; Table III). In the HBeAg-positive group,
193 patients (86.2%) were HBV DNA-positive, with log10
values ranging from 2.97 to 8.00 IU/ml (the mean log10
of the viral load was 5.53±1.90 IU/ml). The cutoff for HBV DNA
replication was defined as 500 IU/ml in all patients. Only 50.8% of
patients had viral replication in the HBeAg-negative group, and the
viral load (mean viral load, 3.50±1.22 log10IU/ml) was
significantly lower than that in the HBeAg-positive group
(P<0.05).
Regardless of whether any statistically significant
differences were observed, all of the patients with seropositive
HBeAg had increased liver functional proteins and higher levels of
hepatic fibrosis indexes in their serum than those in the
seronegative HBeAg group, except for ALB and A/G. In particular,
the levels of TP, GLB, GGT, ALP and TBA were significantly higher
in the HBeAg-positive group compared with those in the
HBeAg-negative group (P<0.05). In addition, the ratios of
patients with abnormal liver function were calculated in the two
groups (data not shown), and the proportion of patients with
hepatic fibrosis and liver function values above the normal range
was higher in the HBeAg-positive group than that in the
HBeAg-negative group, following blood tests for ALT, AST, GGT and
TBA. However, the abnormality rates of TP, ALB and GLB were much
higher in the HBeAg-negative patients compared with those in
HBeAg-positive individuals.
Different responses to chronic HBV
infection in female and male patients
The sex disparity of HBV-associated liver diseases
has been noted for a number of years (19). This may be due to the different
effects of sex hormones (25). In
order to evaluate the contribution of sex to the progression of
chronic HBV infection, the patients were divided into two groups by
gender in the HBeAg seronegative and seropositive groups (Table IV). There was no age difference
between males and females in the seropositive and seronegative
HBeAg groups (P=0.723 in the HBeAg-negative group and P=0.353 the
HBeAg-positive group). The male patients exhibited increased ALB
and A/G levels when compared with females, regardless of their
HBeAg status. By contrast, GLB and AST/ALT values were higher in
females than in males (GLB, P<0.001 in the HBeAg-negative group
and P=0.027 in the HBeAg-positive group; AST/ALT, P=0.001 in the
HBeAg-negative group and P=0.031 in the HBeAg-positive group).
| Table IV.Differences in liver function markers
between males and females in the HBeAg-positive and -negative
groups. |
Table IV.
Differences in liver function markers
between males and females in the HBeAg-positive and -negative
groups.
|
| HBeAg-negative
(n=254) | HBeAg-positive
(n=224) |
|---|
|
|
|
|
|---|
| Parameter | Males (n=124) | Females
(n=130) | P-value | Males (n=130) | Females (n=94) | P-value |
|---|
| Age (years) | 44.03±14.55 | 44.69±15.03 | 0.723 | 37.90±11.59 | 36.24±14.20 | 0.353 |
| HBV DNA
(log10IU/ml) | 3.68±1.36 | 3.32±1.04 | 0.019 | 5.21±1.88 | 5.97±1.85 | 0.003 |
| Liver function
parameters |
| TP
(g/l) | 68.03±7.92 | 68.46±7.65 | 0.663 | 69.96±5.69 | 70.05±6.93 | 0.918 |
| ALB
(g/l) | 43.33±6.37 | 41.64±6.14 | 0.033 | 43.15±6.55 | 41.23±7.05 | 0.038 |
| GLB
(g/l) | 24.70±4.65 | 26.83±4.45 | <0.001 | 26.81±5.41 | 28.38±4.85 | 0.027 |
|
A/G | 1.81±0.42 | 1.59±0.34 | <0.001 | 1.69±0.44 | 1.51±0.34 | 0.001 |
| TBIL
(µmol/l) | 23.67±21.74 | 25.32±59.54 | 0.773 | 25.82±32.63 | 28.18±55.27 | 0.692 |
| DBIL
(µmol/l) | 7.18±11.52 | 9.27±36.15 | 0.540 | 8.75±17.54 | 9.54±30.27 | 0.809 |
| IBIL
(µmol/l) | 16.49±11.27 | 16.05±23.95 | 0.851 | 17.06±15.63 | 18.64±29.64 | 0.609 |
| ALT
(U/l) | 73.44±131.59 | 58.42±232.17 | 0.530 | 120.90±326.13 | 82.18±176.34 | 0.297 |
| AST
(U/l) | 58.18±187.88 | 53.84±165.32 | 0.872 | 117.13±319.67 | 85.23±204.36 | 0.492 |
|
AST/ALT | 0.86±0.45 | 1.19±0.80 | 0.001 | 0.85±0.44 | 1.32±1.84 | 0.031 |
| GGT
(U/l) | 47.96±40.02 | 36.58±76.45 | 0.228 | 85.28±102.63 | 37.51±40.46 | <0.001 |
| ALP
(U/l) | 97.04±34.88 | 97.51±50.58 | 0.944 | 126.05±103.63 | 98.16±49.33 | 0.051 |
| TBA
(µmol/l) | 10.81±25.26 | 8.75±17.48 | 0.534 | 24.70±57.58 | 18.26±43.44 | 0.467 |
| Hepatic
fibrosis |
| HA
(ng/ml) | 171.77±132.36 | 178.71±158.17 | 0.888 | 317.36±340.44 | 238.56±236.65 | 0.592 |
| LN
(ng/ml) | 94.83±50.48 | 106.24±54.00 | 0.420 | 145.18±137.02 | 96.53±52.32 | 0.194 |
| PCIIINP
(ng/ml) | 56.69±43.78 | 59.16±64.18 | 0.863 | 65.36±83.64 | 61.06±69.89 | 0.727 |
| IV-C
(ng/ml) | 71.98±37.00 | 80.72±70.32 | 0.588 | 136.27±84.50 | 97.06±86.56 | 0.248 |
Among the HBeAg-negative patients, males had higher
HBV DNA copies than females (t=−2.368, P=0.019) and a greater
number of male patients had increased abnormal ratios of liver
function biomarkers (TP, GLB, A/G, ALT, GGT, TBA, TBIL, DBIL and
IBIL) than females (data not shown). By contrast, female patients
with seropositive HBeAg had higher HBV DNA copies than males
(t=3.017, P=0.003), and a greater number of male patients had
abnormal levels of GLB, A/G, ALT, AST, GGT, ALP and TBA than female
patients, even if the differences were not statistically
significant (data not shown). Regarding hepatic fibrosis, female
patients also had higher levels of the majority of fibrosis
indicators than male patients in the HBeAg-negative group. In
addition, among the HBeAg-positive patients, males exhibited more
severe liver damage than females, as indicated by the levels of
hyaluronic acid (HA), laminin (LN), PCIIINP and serum IV collagen
(IV-C; Table III).
Age is closely associated with the
patients' response to chronic HBV infection
Age has been reported to be an important factor in
the progression of chronic HBV infection. The natural course of HBV
infection is complex, and is highly influenced by the age at
infection (26). Therefore, the
present study investigated the HBV clinical virological
characteristics and liver function parameters of 478 patients with
chronic HBV infection from Gansu province in different age groups
(≤30, 31–60 and ≥61 years of age). The majority of patients were
aged 31 to 60 years. Within the HBeAg-negative and -positive
groups, the difference in levels of certain biomarkers, including
HBV DNA, TP, ALB and A/G were significant in patients <30 years
old or between 31–60 years, when compared with those ≥61 years. The
values of the majority of biomarkers exhibited an evident
decreasing trend with increasing age, although the differences were
not statistically significant in certain cases, except for GLB
(Fig. 1).
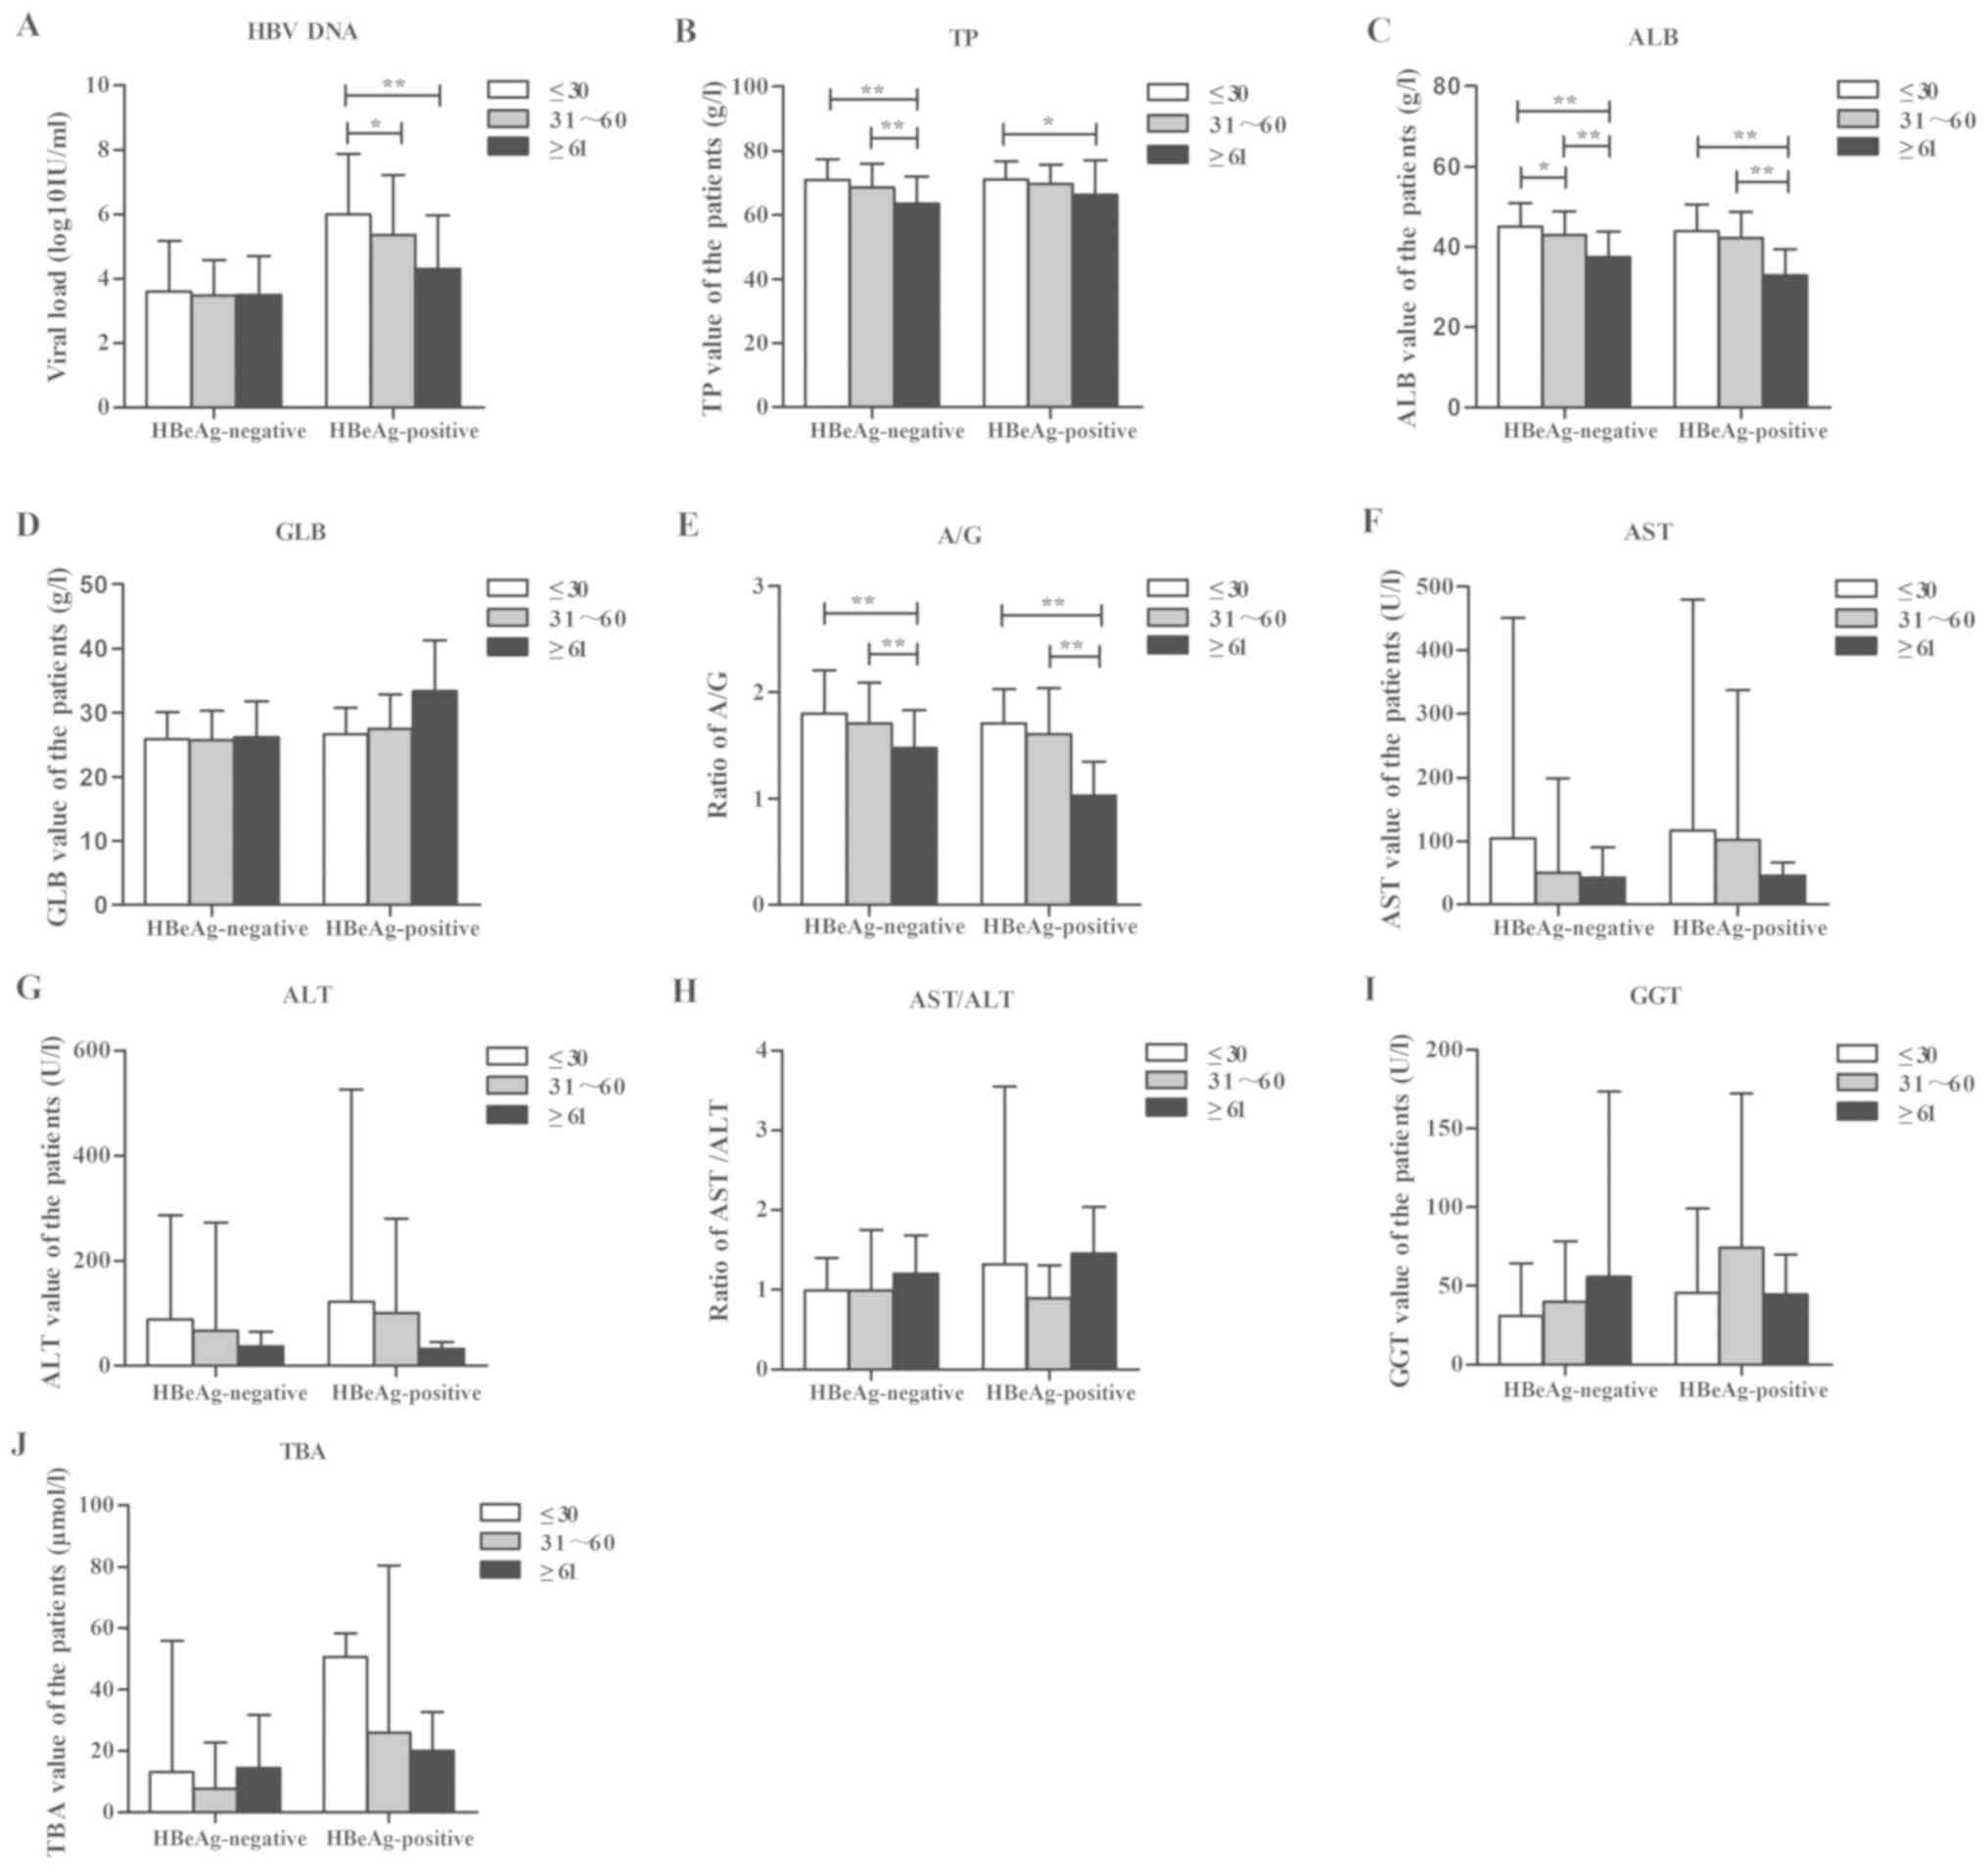 | Figure 1.Patients in different age groups
exhibit different reactions to HBV infection. A total of 478
patients were divided into 2 groups based on their HBeAg status
(negative or positive), which were further subdivided into 3 groups
according to their age (≤30, 31–60 or ≥61 years). The
HBeAg-negative group contained 43, 175 and 36 patients, while the
HBeAg-positive group contained 75, 139 and 10 patients in the
respective abovementioned age groups. The HBV clinical virological
characteristics and liver function indexes were compared among the
different age groups of HBeAg-positive and -negative subjects. (A)
Viral load of HBV in the different groups. (B-J) Liver function
biomarkers, including (B) TP, (C) ALB, (D) GLB, (E) the ratio of
A/G, (F) AST, (G) ALT, (H) the ratio of AST/ALT, (I) GGT and (J)
TBA. Statistical analysis between different groups was performed
using one-way analysis of variance, and an independent Student's
t-test was used to analyze the differences between two groups
following correction via the Bonferroni method. *P<0.05 and
**P<0.01. HBV, hepatitis B virus; HBeAg, hepatitis B e antigen;
TP, total protein; ALB, albumin; GLB, globulin; ALT, alanine
aminotransferase; AST, aspartate aminotransferase; GGT, γ-glutamyl
transpeptidase; TBA, total biliary acid. |
DNA replication levels are associated
with HBeAg expression
To further identify the association of DNA
replication levels with HBeAg expression, the patients were divided
into 3 groups (≤5.00×10²,
5.01×10²−104 and
105−1.0×10⁸ IU/ml), according to HBV DNA
levels. Low levels of viral load
(5.01×10²−104 IU/ml) were predominantly
observed in HBeAg-negative patients who had less viral replication,
while patients with seropositive HBeAg had a higher number of viral
copies (105−108 IU/ml;
(χ2=117.302, P<0.001; data not shown). Furthermore,
to investigate how different levels of DNA replication affected the
patients' liver function, the present study explored the liver
function indexes that were closely associated with HBV DNA levels
using Spearman correlation coefficient analysis (Table V). The results revealed that, in all
of the patients, HBV DNA levels were positively associated with
GLB, ALT, AST, GGT and TBA, and negatively associated with A/G and
AST/ALT. The patients were then divided into different groups
according to sex and age based on the different HBeAg status. The
ALT and AST values increased with rising HBV DNA levels in all male
and female patients with negative HBeAg status and decreased in
female patients with HBeAg positivity. Of note, in the
HBeAg-negative group, numerous parameters (e.g. TBA), exhibited a
positive correlation with HBV DNA levels in female patients,
whereas in HBeAg-positive female patients, TBA had a negative
association with HBV DNA levels, as presented in Table VI. Finally, the same analysis was
also performed for different age groups in the HBeAg seronegative
and -positive groups. The results revealed no marked correlation
between liver function indexes and HBV DNA when the patients were
aged ≥61 years (Tables VII and
VIII). Furthermore, in
HBeAg-negative patients, the liver function parameters were
affected the most by the HBV DNA replication levels in the age
groups of ≤30 and 31–60 years, while this result was not observed
in the HBeAg-positive patients.
| Table V.Correlation of HBV DNA and liver
function parameters in all patients. |
Table V.
Correlation of HBV DNA and liver
function parameters in all patients.
| Liver function
parameter | r | P-value |
|---|
| TP | 0.078a | 0.090 |
| ALB | −0.080b | 0.083 |
| GLB | 0.161a | <0.001 |
| A/G | −0.130b | 0.005 |
| TBIL | 0.029a | 0.534 |
| DBIL | 0.025a | 0.589 |
| IBIL | 0.036a | 0.438 |
| ALT | 0.305a | <0.001 |
| AST | 0.307a | <0.001 |
| AST/ALT | −0.115b | 0.043 |
| GGT | 0.166a | 0.003 |
| ALP | 0.035a | 0.537 |
| TBA | 0.147a | 0.010 |
| Table VI.Correlation of HBV DNA and liver
function parameters in different groups. |
Table VI.
Correlation of HBV DNA and liver
function parameters in different groups.
|
| HBeAg-negative | HBeAg-positive |
|---|
|
|
|
|
|---|
|
| Males (n=124) | Females
(n=130) | Males (n=130) | Females (n=94) |
|---|
|
|
|
|
|
|
|---|
| Parameter | r | P-value | r | P-value | r | P-value | r | P-value |
|---|
| TP | −0.120a | 0.187 | 0.169b | 0.056 | 0.118b | 0.187 | 0.026b | 0.803 |
| ALB | −0.203a | 0.024 | 0.050b | 0.577 | −0.136a | 0.127 | 0.067b | 0.521 |
| GLB | 0.050b | 0.583 | 0.210b | 0.017 | 0.153b | 0.085 | −0.165a | 0.111 |
| A/G | −0.128a | 0.157 | −0.094a | 0.292 | −0.159a | 0.074 | 0.172b | 0.098 |
| TBIL | −0.153a | 0.092 | 0.180b | 0.041 | −0.119a | 0.184 | −0.106a | 0.308 |
| DBIL | 0.166b | 0.066 | 0.161b | 0.069 | −0.127a | 0.156 | −0.228a | 0.027 |
| IBIL | 0.134b | 0.141 | 0.188b | 0.033 | −0.088a | 0.325 | −0.023a | 0.826 |
| ALT | 0.341b | <0.001 | 0.300b | 0.001 | 0.319b | <0.001 | −0.016a | 0.877 |
| AST | 0.395b | <0.001 | 0.317b | 0.002 | 0.337b | 0.003 | −0.168a | 0.186 |
| AST/ALT | 0.029b | 0.797 | −0.149a | 0.160 | −0.245a | 0.033 | −0.174a | 0.168 |
| GGT | 0.116b | 0.298 | 0.192b | 0.065 | 0.281b | 0.014 | −0.309a | 0.013 |
| ALP | 0.140b | 0.210 | 0.192b | 0.069 | −0.007a | 0.952 | −0.403a | 0.001 |
| TBA | 0.238b | 0.035 | 0.305b | 0.003 | −0.071a | 0.546 | −0.296a | 0.018 |
| Table VII.Correlation of HBV DNA and liver
function parameters in hepatitis B e antigen-negative patients in
different age groups. |
Table VII.
Correlation of HBV DNA and liver
function parameters in hepatitis B e antigen-negative patients in
different age groups.
|
| ≤30 years
(n=43) | 31–60 years
(n=175) | ≥61 years
(n=36) |
|---|
|
|
|
|
|
|---|
| Parameters | r | P-value | r | P-value | r | P-value |
|---|
| TP | −0.098a | 0.537 | 0.058b | 0.446 | 0.014b | 0.938 |
| ALB | −0.044a | 0.056 | −0.059a | 0.435 | −0.212a | 0.220 |
| GLB | −0.056a | 0.726 | 0.119b | 0.116 | 0.204b | 0.240 |
| A/G | 0.091b | 0.566 | −0.082a | 0.283 | −0.335a | 0.049 |
| TBIL | 0.280b | 0.260 | 0.159b | 0.035 | 0.107b | 0.540 |
| DBIL | 0.280b | 0.072 | 0.173b | 0.022 | 0.003b | 0.988 |
| IBIL | 0.260b | 0.096 | 0.154b | 0.042 | 0.154b | 0.377 |
| ALT | 0.385b | 0.012 | 0.318b | <0.001 | 0.277b | 0.102 |
| AST | 0.638b | 0.001 | 0.317b | 0.001 | 0.238b | 0.169 |
| AST/ALT | 0.112b | 0.619 | −0.113a | 0.232 | −0.204a | 0.239 |
| GGT | 0.213b | 0.329 | 0.188b | 0.042 | 0.233b | 0.179 |
| ALP | 0.476b | 0.022 | 0.187b | 0.045 | 0.008b | 0.962 |
| TBA | 0.523b | 0.010 | 0.317b | 0.001 | 0.043b | 0.808 |
| Table VIII.Correlation of HBV DNA and liver
function parameters in hepatitis B e antigen-positive patients of
different ages. |
Table VIII.
Correlation of HBV DNA and liver
function parameters in hepatitis B e antigen-positive patients of
different ages.
|
| ≤30 years
(n=75) | 31–60 years
(n=139) | ≥61 years
(n=10) |
|---|
|
|
|
|
|
|---|
| Parameter | r | P-value | r | P-value | r | P-value |
|---|
| TP | 0.068a | 0.569 | −0.035b | 0.683 | −0.153b | 0.672 |
| ALB | −0.160b | 0.176 | −0.199b | 0.019 | −0.362b | 0.304 |
| GLB | 0.161a | 0.174 | 0.104a | 0.224 | −0.399b | 0.254 |
| A/G | −0.142b | 0.230 | −0.166b | 0.051 | −0.055b | 0.880 |
| TBIL | 0.062a | 0.600 | −0.134b | 0.116 | −0.271b | 0.449 |
| DBIL | 0.020a | 0.866 | −0.199b | 0.019 | −0.431b | 0.214 |
| IBIL | 0.079a | 0.505 | −0.085b | 0.322 | −0.215b | 0.551 |
| ALT | 0.245a | 0.034 | 0.110a | 0.198 | 0.252a | 0.483 |
| AST | −0.017b | 0.913 | 0.207a | 0.055 | 0.239a | 0.506 |
| AST/ALT | −0.268b | 0.082 | −0.004b | 0.973 | −0.018b | 0.960 |
| GGT | −0.214b | 0.169 | 0.070a | 0.520 | 0.632a | 0.050 |
| ALP | −0.400b | 0.008 | −0.166b | 0.126 | −0.362b | 0.304 |
| TBA | 0.041a | 0.795 | −0.121b | 0.268 | −0.067b | 0.853 |
Discussion
HBV infection has been a great public health concern
for a number of years. It may develop into cirrhosis and HCC if it
is not treated in a timely and effective manner. The natural course
of HBV infection is complex and is highly influenced by the host
and virological factors. In the present study, it was observed that
HBV progression and liver damage were not only associated with
HBeAg expression patterns and HBV activity, but also host
characteristics, including gender and age at diagnosis.
HBeAg is a soluble protein in the core particles of
HBV, which is processed from the precore protein (27). A number of studies have reported that
HBeAg serves a critical role in chronic HBV infection treatment,
prognosis and disease progression (28,29).
Patients with seropositive HBeAg have an increased risk to develop
cirrhosis and HCC. Therefore, HBeAg has been regarded as an
important indicator of disease severity; it also contributes to
disease diagnosis and the formulation of treatment strategies.
However, the results of the present and other studies have
demonstrated that serum HBeAg patterns are not always positively
associated with HBV DNA levels (23). To be more precise, several factors,
including patients' demographic characteristics, should be
considered in the treatment, prognostication and assessment of
disease progression. In the present study, gender and age were
critical in the diagnosis, selection of therapeutic options and
determination of liver injury. Of note, the present results
revealed that more male patients expressed HBeAg, while less female
patients had detectable HBeAg in the serum. However, females with
seropositive HBeAg had higher HBV DNA copies than male patients. It
is possible that an unhealthy lifestyle, including smoking
(30), alcohol consumption and a
nocturnal daily rhythm, which have been noted to be more common in
men than in women, may have a negative effect resulting in active
hepatitis and the promotion of liver disease progression. Females
may present with an increased activity of HBV infection as a result
of the different effects of estrogen and androgen on the host's
immune response (25,31,32). In
addition, males and females exhibited a difference in HBV DNA
levels, indicators of hepatic fibrosis and abnormal ratios of liver
function parameters in the HBeAg-negative and -positive groups. In
the HBeAg-positive group, the differences between male and female
patients were much greater regarding HBV DNA levels and liver
function parameters. When considering age, the present study
confirmed that HBV DNA levels decreased with advanced age, but
there was no evident correlation between liver function indexes and
HBV DNA in patients aged ≥61 years. Certain previous studies have
indicated that liver regeneration and cellular maintenance may be
impaired with advanced age (33,34).
Furthermore, in another study, a senior population exhibited
impaired endocytosis of the liver sinusoidal endothelial cells and
increased leukocyte adhesion, which may reduce hepatic perfusion
(35). All of these factors probably
contribute to the changes in liver function in the older
population. HBV replication may be restrained at the same time.
Therefore, the HBeAg serum level should not be considered as a
sole, independent indicator for disease diagnosis and treatment. It
is necessary to determine more effective treatment strategies by
considering a variety of factors in patients, e.g., gender and age,
in addition to DNA replication levels and liver function
parameters.
Hepatic fibrosis indexes, including HA, LN, PCIIINP
and IV-C, are considered to have a better correlation with liver
fibrosis severity when compared with other available tests
(35). In the present study, all
HBeAg-positive patients had higher levels of hepatic fibrosis
indexes and higher abnormal ratios of hepatic fibrosis values in
their serum when compared with HBeAg-negative patients,
particularly with regard to IV-C. However, gender had no marked
effect on liver fibrosis. Thus, HBeAg may be considered as an
independent and effective factor for the prognosis and early
diagnosis of liver fibrosis.
HBeAg expression is closely associated with the
activity of the virus and may be further influence liver disease
progression. For the majority of the HBeAg seropositive patients of
the present study, the liver function values exhibited an
increasing trend, regardless of the viral replication levels.
However, ~87% of HBeAg-negative patients had low-level viral
replication, while the abnormal ratios of TP, ALB and GLB were
higher than those in HBeAg-positive patients. This may be due to
different host immune responses being activated by a varied viral
load (36), and low-level viral
replication not activating effective immune responses, and thereby,
the virus may not be cleared in time, resulting in more severe
injury of liver cells when compared with that in patients with
higher replication levels of HBV DNA. In addition, the patients
with lower HBV DNA levels had a higher abnormal ratio regarding
PCIIINP compared with the patients with higher HBV DNA levels,
which was closely associated with the activity of inflammation and
the formation of liver fibrosis; the possible reasons may be
associated with insufficient immune responses and the lack of
effective virus elimination. A larger cohort study is underway to
verify this hypothesis.
As a complicated and chronic disease, hepatitis B
treatment efficacy is also affected by many additional factors,
including the type of drug treatment, duration of drug treatment
and the time of hepatitis B infection (37–40). In
the present study, perhaps due to the limitation of patient cohort
size, no differences between age, sex, duration of treatment or the
time of infection were observed between patients. According to the
Guidelines for the Prevention and Treatment of Chronic Hepatitis B
from 2015 (24), the inpatients were
treated with ETV and/or TDF, and only a small number were treated
with other drugs, including LAM, FTC, LDT and ADV. Besides the
different responses to viral infection, patients may respond
differently to the various drugs administered, which may also
affect disease progression. Although the current authors detected
the gene mutations that cause resistance/sensitization to different
drug treatments within a previous study with more detail, the
association between drug treatment and liver function requires
further investigation.
In conclusion, the present study explored the
importance of host factors, including sex and age, and viral
factors, including HBeAg expression pattern and HBV DNA levels, in
chronic HBV infection and progression. All of the results provide a
foundation for clinical management strategies for HBV infection,
promote the future development of precise medicine and be conducive
to the selection of individual treatment schemes.
Acknowledgements
Not applicable.
Funding
The present study was supported by the Human
Resources and Social Security Institute as Special funding for
Educated Abroad Scholar in Science and Technology Activities (grant
no. 2016-176).
Availability of data and materials
The datasets used during the present study are
available from the corresponding author on reasonable request.
Authors' contributions
JJ performed most of the experiments. YL and CW
performed the statistical analysis. RG, HX and YJ contributed to
the study design and drafting of the manuscript. YW, YL, ZW, XQ and
ZL performed the qPCR analyses. XG critically revised the
manuscript for important intellectual content.
Ethics approval and consent to
participate
The present study was approved by the Ethics Review
Committee of Gansu Provincial Hospital (Lanzhou, China) and written
informed consent was obtained from all patients.
Patient consent for publication
All patients informed and signature for all
conditions in informed consent.
Competing interests
The authors declare that they have no competing
interests.
Glossary
Abbreviations
Abbreviations:
|
HBV
|
hepatitis B virus
|
|
HCC
|
hepatocellular carcinoma
|
|
HBeAg
|
hepatitis B e antigen
|
|
HBsAg
|
hepatitis B surface antigen
|
|
TP
|
total protein
|
|
ALB
|
albumin
|
|
GLB
|
globulin
|
|
A/G
|
albumin/globulin
|
|
TBIL
|
total bilirubin
|
|
DBIL
|
direct bilirubin
|
|
IBIL
|
indirect bilirubin
|
|
ALT
|
alanine aminotransferase
|
|
AST
|
aspartate aminotransferase
|
|
GGT
|
γ-glutamyl transpeptidase
|
|
ALP
|
alkaline phosphatase
|
|
TBA
|
total biliary acid
|
|
HA
|
hyaluronic acid
|
|
LN
|
laminin
|
|
PCIIINP
|
procollagen III N-terminal peptide
|
|
IV-C
|
serum IV collagen
|
References
|
1
|
Liu J, Zhang S, Wang Q, Shen H, Zhang M,
Zhang Y, Yan D and Liu M: Seroepidemiology of hepatitis B virus
infection in 2 million men aged 21–49 years in rural China: A
population-based, cross-sectional study. Lancet Infect Dis.
16:80–86. 2016. View Article : Google Scholar : PubMed/NCBI
|
|
2
|
Liang X, Bi S, Yang W, Wang L, Cui G, Cui
F, Zhang Y, Liu J, Gong X, Chen Y, et al: Reprint of:
Epidemiological serosurvey of Hepatitis B in China-declining HBV
prevalence due to Hepatitis B vaccination. Vaccine. 31 (Suppl
9):J21–J28. 2013. View Article : Google Scholar : PubMed/NCBI
|
|
3
|
Wang Y, Zhou H, Zhang L, Zhong Q, Wang Q,
Shen H, Zhang M, Huang Y, Wang A, Nelson K, et al: Prevalence of
chronic hepatitis B and status of HBV care among rural women who
planned to conceive in China. Sci Rep. 7:120902017. View Article : Google Scholar : PubMed/NCBI
|
|
4
|
Trépo C, Chan HL and Lok A: Hepatitis B
virus infection. Lancet. 384:2053–2063. 2014. View Article : Google Scholar : PubMed/NCBI
|
|
5
|
Lu F, Li T, Liu S and Zhuang H:
Epidemiology and prevention of hepatitis B virus infection in
China. J Viral Hepat. 17 (Suppl 1):S4–S9. 2010. View Article : Google Scholar
|
|
6
|
Biswas A, Panigrahi R, Pal M, Chakraborty
S, Bhattacharya P, Chakrabarti S and Chakravarty R: Shift in the
hepatitis B virus genotype distribution in the last decade among
the HBV carriers from eastern India: Possible effects on the
disease status and HBV epidemiology. J Med Virol. 85:1340–1347.
2013. View Article : Google Scholar : PubMed/NCBI
|
|
7
|
Moura IF, Lopes EP, Alvarado-Mora MV,
Pinho JR and Carrilho FJ: Phylogenetic analysis and subgenotypic
distribution of the hepatitis B virus in Recife, Brazil. Infect
Genet Evol. 14:195–199. 2013. View Article : Google Scholar : PubMed/NCBI
|
|
8
|
Wang SH, Chen PJ and Yeh SH: Gender
disparity in chronic hepatitis B: Mechanisms of sex hormones. J
Gastroenterol Hepatol. 30:1237–1245. 2015. View Article : Google Scholar : PubMed/NCBI
|
|
9
|
Zheng B, Zhu Y, Wang H and Chen L: Gender
disparity in hepatocellular carcinoma (HCC): Multiple underlying
mechanisms. Sci China Life Sci. 60:575–584. 2017. View Article : Google Scholar : PubMed/NCBI
|
|
10
|
Tan Y, Ye Y, Zhou X, Chen L and Wen D: Age
as a predictor of significant fibrosis features in HBeAg-negative
chronic hepatitis B virus infection with persistently normal
alanine aminotransferase. PLoS One. 10:e01234522015. View Article : Google Scholar : PubMed/NCBI
|
|
11
|
Zhang H, Huo M, Chao J and Liu P:
Application of bayesian approach to cost-effectiveness analysis of
antiviral treatments in chronic Hepatitis B. PLoS One.
11:e01619362016. View Article : Google Scholar : PubMed/NCBI
|
|
12
|
Everson GT, Shiffman ML, Hoefs JC, Morgan
TR, Sterling RK, Wagner DA, Lauriski S, Curto TM, Stoddard A and
Wright EC; HALT-C Trial Group, : Quantitative liver function tests
improve the prediction of clinical outcomes in chronic hepatitis C:
Results from the Hepatitis C antiviral long-term treatment against
cirrhosis trial. Hepatology. 55:1019–1029. 2012. View Article : Google Scholar : PubMed/NCBI
|
|
13
|
Ghany MG, Lok AS, Everhart JE, Everson GT,
Lee WM, Curto TM, Wright EC, Stoddard AM, Sterling RK, Di Bisceglie
AM, et al: Predicting clinical and histologic outcomes based on
standard laboratory tests in advanced chronic hepatitis C.
Gastroenterology. 138:136–146. 2010. View Article : Google Scholar : PubMed/NCBI
|
|
14
|
Qi Y, Gao Z, Xu G, Peng B, Liu C, Yan H,
Yao Q, Sun G, Liu Y, Tang D, et al: DNA polymerase kappa is a key
cellular factor for the formation of covalently closed circular DNA
of Hepatitis B virus. PLoS Pathog. 12:e10058932016. View Article : Google Scholar : PubMed/NCBI
|
|
15
|
Zhang Z, Li A and Xiao X: Risk factors for
intrauterine infection with hepatitis B virus. Int J Gynaecol
Obstet. 125:158–161. 2014. View Article : Google Scholar : PubMed/NCBI
|
|
16
|
Chan H, Tse C, Mo F, Koh J, Wong VW, Wong
GL, Lam Chan S, Yeo W, Sung JJ and Mok TS: High viral load and
hepatitis B virus subgenotype ce are associated with increased risk
of hepatocellular carcinoma. J Clin Oncol. 26:177–182. 2008.
View Article : Google Scholar : PubMed/NCBI
|
|
17
|
Mommeja-Marin H, Mondou E, Blum M and
Rousseau F: Serum HBV DNA as a marker of efficacy during therapy
for chronic HBV infection: Analysis and review of the literature.
Hepatology. 37:1309–1319. 2003. View Article : Google Scholar : PubMed/NCBI
|
|
18
|
Sanai FM, Helmy A, Bzeizi KI, Babatin MA,
Al-Qahtani A, Al-Ashgar HA, Al-Mdani AS, Al-Akwaa A, Almutharea S,
Khan MQ, et al: Discriminant value of serum HBV DNA levels as
predictors of liver fibrosis in chronic hepatitis B. J Viral Hepat.
18:e217–e225. 2011. View Article : Google Scholar : PubMed/NCBI
|
|
19
|
Yuen MF, Tanaka Y, Fong DY, Fung J, Wong
DK, Yuen JC, But DY, Chan AO, Wong BC, Mizokami M and Lai CL:
Independent risk factors and predictive score for the development
of hepatocellular carcinoma in chronic hepatitis B. J Hepatol.
50:80–88. 2009. View Article : Google Scholar : PubMed/NCBI
|
|
20
|
Ozaki K, Matsui O, Gabata T, Kobayashi S,
Koda W and Minami T: Confluent hepatic fibrosis in liver cirrhosis:
Possible relation with middle hepatic venous drainage. Jpn J
Radiol. 31:530–537. 2013. View Article : Google Scholar : PubMed/NCBI
|
|
21
|
Shirvani-Dastgerdi E, Winer BY,
Celià-Terrassa T, Kang Y, Tabernero D, Yagmur E, Rodríguez-Frías F,
Gregori J, Luedde T, Trautwein C, et al: Selection of the highly
replicative and partially multidrug resistant rtS78T HBV polymerase
mutation during TDF-ETV combination therapy. J Hepatol. 67:246–254.
2017. View Article : Google Scholar : PubMed/NCBI
|
|
22
|
Xiang Y, Chen P, Xia JR and Zhang LP: A
large-scale analysis study on the clinical and viral
characteristics of hepatitis B infection with concurrence of
hepatitis B surface or E antigens and their corresponding
antibodies. Genet Mol Res. 16:2017. View Article : Google Scholar : PubMed/NCBI
|
|
23
|
Chen P, Xie Q, Lu X, Yu C, Xu K, Ruan B,
Cao H, Gao H and Li L: Serum HBeAg and HBV DNA levels are not
always proportional and only high levels of HBeAg most likely
correlate with high levels of HBV DNA: A community-based study.
Medicine (Baltimore). 96:e77662017. View Article : Google Scholar : PubMed/NCBI
|
|
24
|
Chinese Society of Hepatology of Chinese
Medical Association, . The Guidelines for the Prevention and
Treatment of Chronic Hepatitis B (2015). Chinese Journal of
experimental and Clinical Infectious Diseases (Electronic Edition).
19:1–18. 2015.
|
|
25
|
Wang SH, Chen PJ and Yeh SH: Gender
disparity in chronic hepatitis B: Mechanisms of sex hormones. J
Gastroenterol Hepatol. 30:1237–1245. 2015. View Article : Google Scholar : PubMed/NCBI
|
|
26
|
Wu DL, Xu GH, Lu SM, Ma BL, Miao NZ, Liu
XB, Feng JH, Liu N, Zeng QL, Hou WK, et al: Age versus clinical
virological characteristics in chronic hepatitis B virus infection:
A case series study in China. Eur J Gastroenterol Hepatol.
24:406–413. 2012.PubMed/NCBI
|
|
27
|
Dong J, Ying J, Qiu X, Lu Y and Zhang M:
Advanced strategies for eliminating the cccDNA of HBV. Dig Dis Sci.
63:7–15. 2018. View Article : Google Scholar : PubMed/NCBI
|
|
28
|
Samal J, Kandpal M and Vivekanandan P:
HBeAg-induced miR-106b promotes cell growth by targeting the
retinoblastoma gene. Sci Rep. 7:143712017. View Article : Google Scholar : PubMed/NCBI
|
|
29
|
Yu Y, Wan P, Cao Y, Zhang W, Chen J, Tan
L, Wang Y, Sun Z, Zhang Q, Wan Y, et al: Hepatitis B virus e
antigen activates the suppressor of cytokine signaling 2 to repress
interferon action. Sci Rep. 7:17292017. View Article : Google Scholar : PubMed/NCBI
|
|
30
|
Wan DW, Tzimas D, Smith JA, Kim S, Araujo
J, David R, Lobach I and Sarpel U: Risk factors for early-onset and
late-onset hepatocellular carcinoma in Asian immigrants with
hepatitis B in the United States. Am J Gastroenterol.
106:1994–2000. 2011. View Article : Google Scholar : PubMed/NCBI
|
|
31
|
Lee SA, Kim H, Won YS, Seok SH, Na Y, Shin
HB, Inn KS and Kim BJ: Male-specific hepatitis B virus large
surface protein variant W4P potentiates tumorigenicity and induces
gender disparity. Mol Cancer. 14:232015. View Article : Google Scholar : PubMed/NCBI
|
|
32
|
Wong VW and Janssen HL: Can we use HCC
risk scores to individualize surveillance in chronic hepatitis B
infection? J Hepatol. 63:722–732. 2015. View Article : Google Scholar : PubMed/NCBI
|
|
33
|
Furrer K, Rickenbacher A, Tian Y, Jochum
W, Bittermann AG, Käch A, Humar B, Graf R, Moritz W and Clavien PA:
Serotonin reverts age-related capillarization and failure of
regeneration in the liver through a VEGF-dependent pathway. Proc
Natl Acad Sci USA. 108:2945–2950. 2011. View Article : Google Scholar : PubMed/NCBI
|
|
34
|
Zhang C and Cuervo AM: Restoration of
chaperone-mediated autophagy in aging liver improves cellular
maintenance and hepatic function. Nat Med. 14:959–965. 2008.
View Article : Google Scholar : PubMed/NCBI
|
|
35
|
LE Couteur D, Cogger V, McCuskey R, DE
Cabo R, Smedsrød B, Sorensen KK, Warren A and Fraser R: Age-related
changes in the liver sinusoidal endothelium: A mechanism for
dyslipidemia. Ann NY Acad Sci. 1114:79–87. 2007. View Article : Google Scholar : PubMed/NCBI
|
|
36
|
Dusséaux M, Masse-Ranson G, Darche S,
Ahodantin J, Li Y, Fiquet O, Beaumont E, Moreau P, Rivière L,
Neuveut C, et al: Viral load affects the immune response to HBV in
mice with humanized immune system and liver. Gastroenterology.
153:1647–1661.e9. 2017. View Article : Google Scholar : PubMed/NCBI
|
|
37
|
Choi JW, Kim SH, Seo JH, Cho YS, Won SY,
Park BK, Jeon HH, Lee YK and Lee CK: Real world experience of
telbivudine versus entecavir in patients with chronic Hepatitis B,
including long-term outcomes after treatment modification. Yonsei
Med J. 59:383–388. 2018. View Article : Google Scholar : PubMed/NCBI
|
|
38
|
Wang ML, Chen EQ, Tao CM, Zhou TY, Liao J,
Zhang DM, Wang J and Tang H: Pronounced decline of serum HBsAg in
chronic hepatitis B patients with long-term effective nucleos(t)ide
analogs therapy. Scand J Gastroenterol. 52:1420–1426. 2017.
View Article : Google Scholar : PubMed/NCBI
|
|
39
|
Kang SH, Yim HJ, Kim HR, Kang K, Suh SJ,
Lee HJ, Yoon EL, Kim JH, Seo YS, Yeon JE and Byun KS: Comparison of
lamivudine plus adefovir therapy versus entecavir with or without
adefovir therapy for adefovir-resistant chronic hepatitis B. J Clin
Gastroenterol. 48:889–895. 2014.PubMed/NCBI
|
|
40
|
Marcellin P, Zoulim F, Hézode C, Causse X,
Roche B, Truchi R, Pauwels A, Ouzan D, Dumortier J, Pageaux GP, et
al: Effectiveness and safety of tenofovir disoproxil fumarate in
chronic Hepatitis B: A 3-year, prospective, real-world study in
france. Dig Dis Sci. 61:3072–3083. 2016. View Article : Google Scholar : PubMed/NCBI
|


