Introduction
Hepatocellular carcinoma (HCC) is the sixth most
common cancer type worldwide and the third most common cause of
cancer-associated death (1). Viral
hepatitis infection is the major cause of HCC (2). The prognosis of HCC is mainly dependent
on tumor size and staging (3).
Prognosis is typically poor as complete tumor resection only occurs
in 10–20% of cases (4).
Recently, considerable efforts have been made to
identify prognostic markers for HCC. It has been reported that the
expression of survivin mRNA correlates with poor prognosis in
patients with HCC (5). In addition,
Akt phosphorylation is a risk factor for early disease recurrence
and poor prognosis of HCC patients (6). Furthermore, Yes-associated protein was
identified as an independent prognostic marker in HCC (7) and the overexpression of pituitary tumor
transforming gene 1 (PTTG1) was reported to be associated with
angiogenesis and poor prognosis in patients with HCC (8). Furthermore, the downregulation of
phosphatidylethanolamine binding protein 1 is associated with
aggressive tumor behavior and unfavorable clinical outcomes in HCC
patients with hepatitis B infection (9). In addition, HCC patients overexpressing
T-cell lymphoma invasion and metastasis 1 displayed a significantly
shorter overall survival time (10).
Finally, high expression of epidermal growth factor-like repeats
and discoidin domains 3 also predicts poor prognosis in HCC
patients (11).
Numerous novel prognostic models for HCC have been
reported. Yamashita et al (12) proposed a classification system
defined by epithelial cell adhesion molecule and α-fetoprotein,
revealing novel prognostic subtypes of HCC. Calvisi et al
(13) indicated that genome-wide
hypomethylation and CpG hypermethylation are associated with
biological features and the clinical outcome of HCC. The
intratumoral balance of regulatory and cytotoxic T cells is a
promising independent predictor for recurrence and survival of HCC
after resection (14). Budhu et
al (15) reported that a unique
immune response signature (a refined 17-gene signature) of the
liver microenvironment may be used to predict venous metastases,
recurrence and prognosis in HCC. A Met-regulated expression
signature significantly correlated with an increased vascular
invasion rate, microvessel density and decreased mean survival of
HCC patients (16). However,
improved prognostic prediction systems are required to guide
clinical treatments for HCC patients (17).
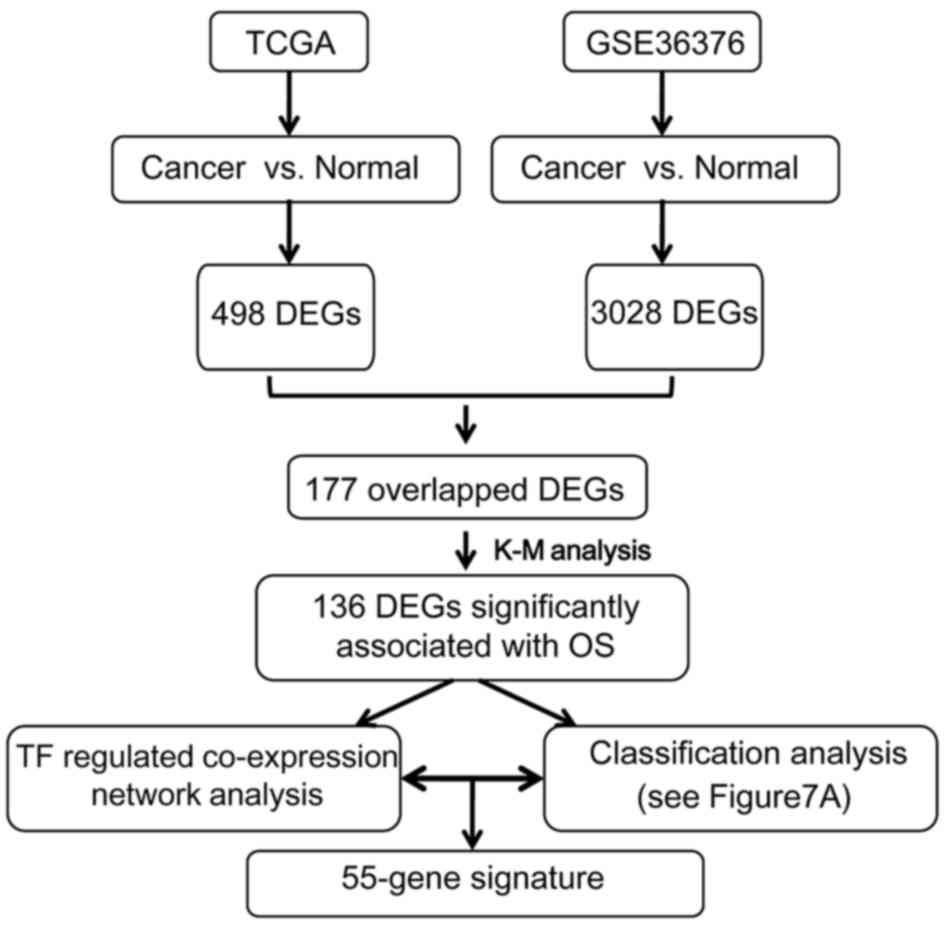
In the present study, a multi-step strategy was used
to identify prognostic gene signatures in HCC (Fig. 1). Gene expression data from HCC
datasets were analyzed and differentially expressed genes (DEGs)
were identified. Furthermore, the prognostic genes were used to
construct a gene co-expression network and a prognostic prediction
system was established. In addition, functional and module analyses
were performed for the gene co-expression network. The prediction
model was further validated in another independent gene expression
dataset. The created prognostic prediction system may be applied to
predict the prognosis of HCC.
Materials and methods
Raw data and pre-treatment
The mRNA expression profiles of 421 samples (371
samples from patients with HCC and 50 samples from normal
controls), along with their corresponding clinical information
(contained in TXT files) were downloaded from The Cancer Genome
Atlas (TCGA; gdc-portal.nci.nih.gov). These gene expression
profiles had been generated by using the Illumina HiSeq 2000 RNA
Sequencing platform (Illumina, Inc., San Diego, CA, USA). The genes
in the TCGA dataset were annotated using information retrieved from
the Human Genome Organization Gene Nomenclature Committee (HGNC;
www.genenames.org), which establishes unique
symbols and names for human loci.
The inclusion and exclusion criteria for the
selection of microarray datasets were as follows: Human HCC; number
of tumor samples, >100; number of control samples, >100;
total number of tumor and control samples larger than that of the
samples in TCGA dataset. Finally, the mRNA expression dataset
GSE36376 was retrieved and raw data (TXT files) were downloaded
from the Gene Expression Omnibus repository (GEO; www.ncbi.nlm.nih.gov/geo). This GEO dataset
contained gene expression profiles of tumor liver tissues (n=240)
and adjacent non-tumorous liver tissues (n=193). Data had been
acquired based on the platform GPL10558 Illumina HumanHT-12 V4.0
expression bead chip (Illumina, Inc.). Probes were annotated to
genes according to platform annotation profiles. Furthermore, the
average expression value of a gene symbol mapped with multiple
probes was calculated. The genes with low abundance (expression
value <5) were removed and Log 2 conversion was applied for data
using the R limma package (18). The microarray data were normalized by
the quantile method (19).
Identification of DEGs and clustering
analysis
The differences in gene expression levels between
tumor and control samples in TCGA and GSE36376 datasets were
analyzed using the limma package (18) of R. The false discovery rate
(FDR) was calculated with the multtest package (20) of R. An FDR <0.05 and a
|log2 (fold change)| >0.585 (i.e., absolute fold
change >1.5) (21–23) were selected as the cut-off thresholds
to identify DEGs. The overlapping DEGs between the TCGA and
GSE36376 datasets were used for further analysis. The top 25
downregulated and upregulated DEGs in the latter subset were used
for hierarchical clustering analysis by the pheatmap package
(version 1.0.8; cran.r-project.org/package=pheatmap) (24) in R, based on the Encyclopedia of
Distances (25), to intuitively
identify the differences in gene expression levels among
samples.
Screening of prognostic genes
In the TCGA dataset, the mRNA expression profiles
and survival information were available for 330 patients. These
data were used to screen prognostic genes from the overlapping DEGs
using Cox regression (26) from the
survival package of R. The genes with a log-rank
P-value of <0.05 were considered to be prognostic. The top 6
prognostic genes ranked by-logRank (P-value) were used for
stratification of patients in the Kaplan-Meier (K-M) survival
analysis.
Construction of gene co-expression
network
The expression data of prognostic genes were used to
calculate the correlation coefficients (r) and the
corresponding P-values between pairwise genes were determined using
the cor function of R. The gene pairs with the
|r|≥0.6 and P<0.05 were considered to be significantly
co-expressed. A gene co-expression network was constructed with
these co-expressed gene pairs and visualized by Cytoscape 2.8.0
(www.cytoscape.org) (27).
Functional annotation and functional
module analysis
Gene Ontology (GO) functional and Kyoto Encyclopedia
of Genes and Genomes (KEGG) pathway enrichment analyses were
performed for the prognostic genes in the co-expression network
using the cluster Profiler package of R (28).
After the enrichment analysis, the transcription
factors (TFs) significantly associated with genes in the
co-expression network were identified using the Database for
Annotation and the Visualization and Integrated Discovery platform
(DAVID; david.ncifcrf.gov) (29). The identified TFs were also
integrated into the co-expression network. Functional modules were
unveiled from the co-expression network using GraphWeb (biit.cs.ut.ee/graphweb) (30). Furthermore, GO functional enrichment
analyses were performed for the genes in the modules.
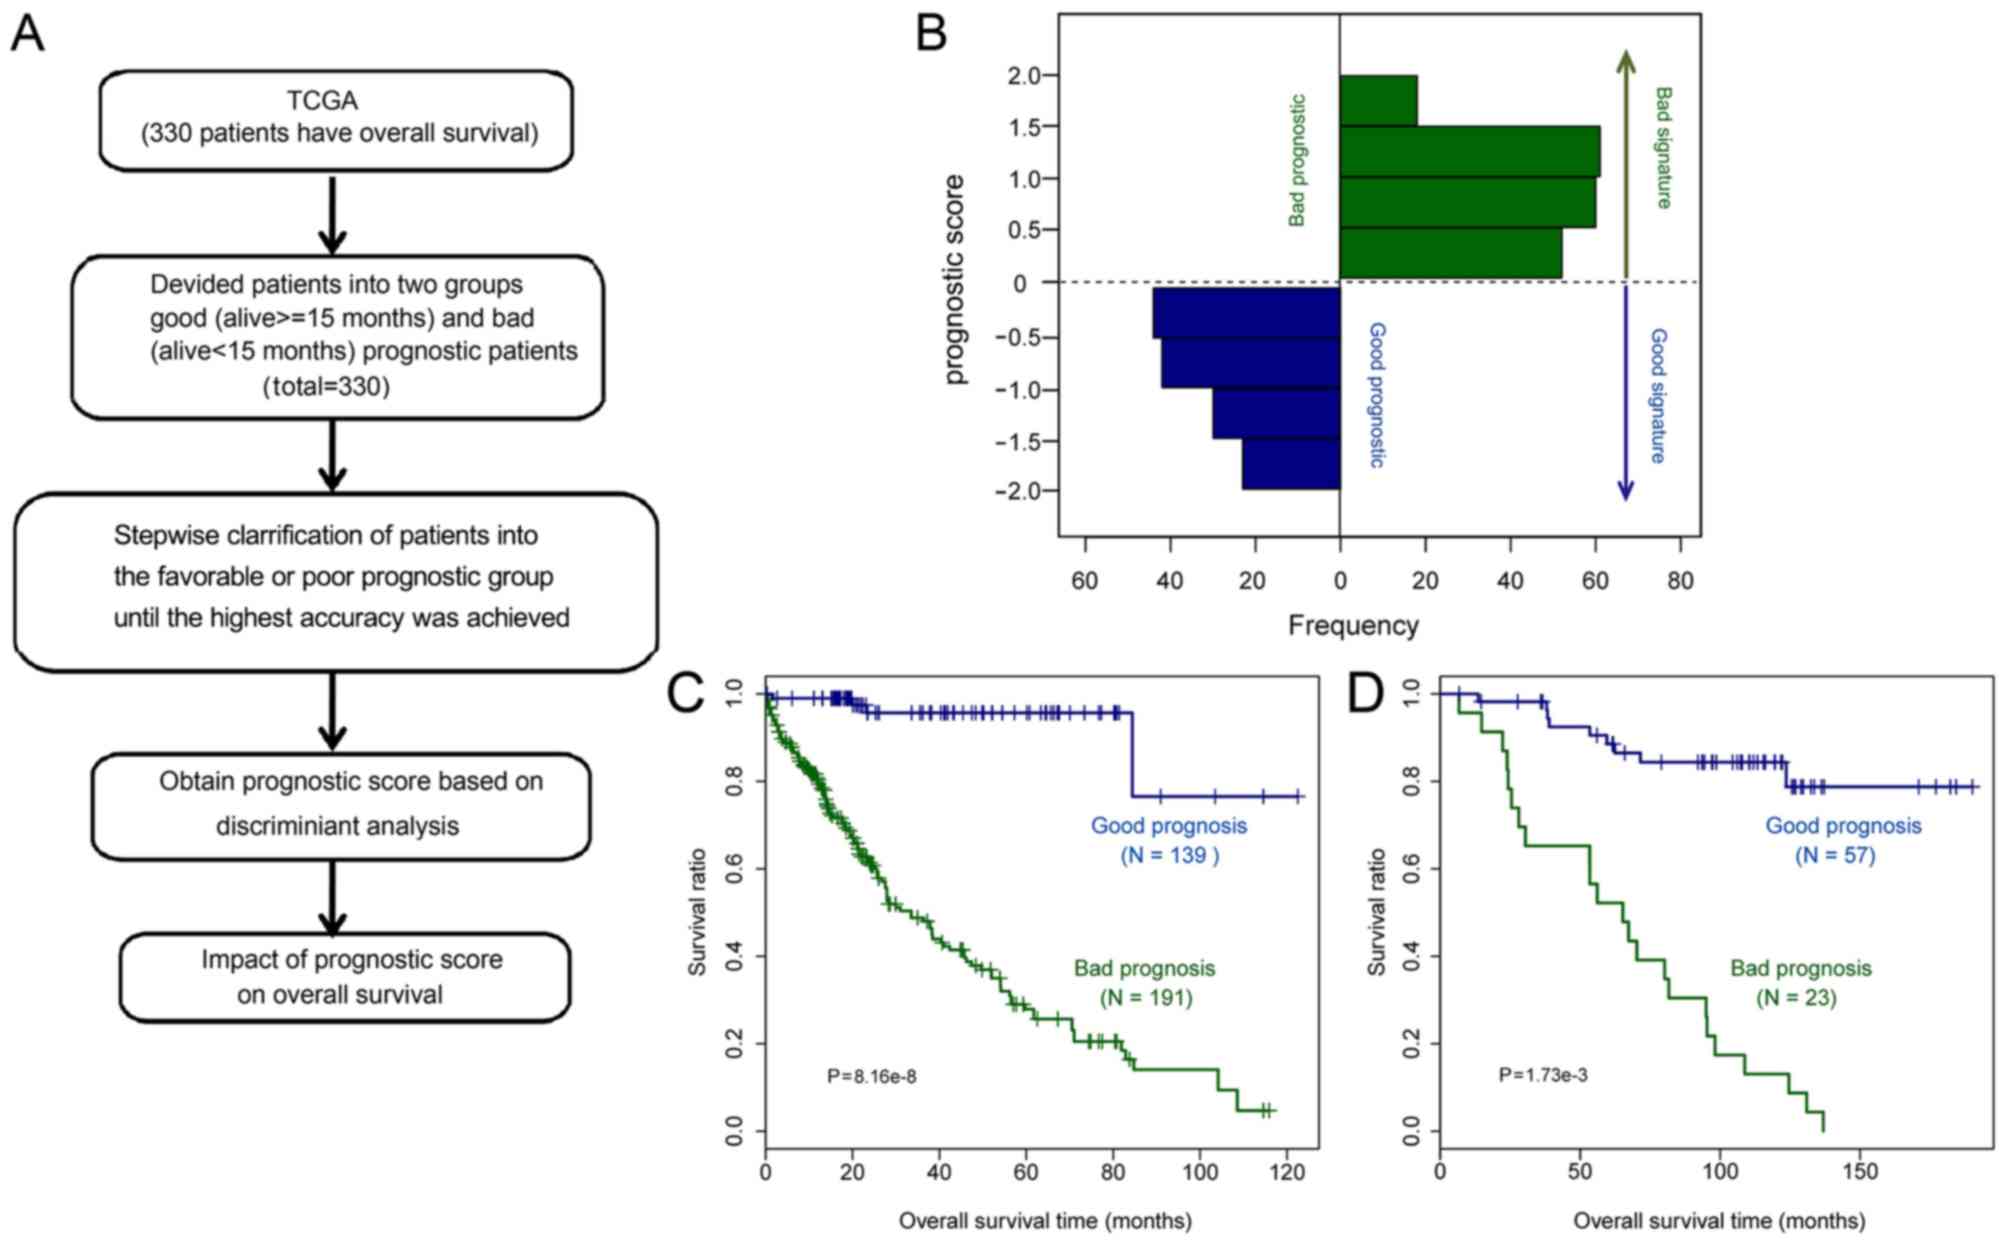
Prognostic prediction system
The 330 HCC samples with survival information in the
TCGA dataset were selected as a training set. These samples were
divided into two groups: A favorable prognostic group (status is
alive and time of follow-up ≥15 months; n=139) and a poor
prognostic group (status is deceased and the time of survival
<15 months; n=191) based on their survival status. Genes in the
co-expression network were ranked by logRank (P-value) and then
analyzed by Bayes discriminant analysis (31) using the discriminiant bayes
function from package e1071 (32) of R. The optimal combination of
genes with the highest discriminative ability between the favorable
and poor prognostic groups was defined as prognostic prediction
system. The K-M survival curves were plotted for samples from the
TCGA dataset to assess the prediction accuracy.
Validation of the prognostic
prediction system
The predictive value of the abovementioned
prognostic prediction system was further assessed using another
independent validation microarray dataset. The independent
validation microarray dataset was selected according to the
following inclusion and exclusion criteria: Human HCC; containing
prognostic information; number of tumor samples, >100; number of
tumor samples and control samples larger than that of samples in
the TCGA dataset. Finally, the mRNA expression dataset GSE20140 was
retrieved for validation and raw data (TXT files) were downloaded
from GEO. This independent validation dataset contained 80 HCC
samples and 540 hepatitis/cirrhotic liver samples with
corresponding survival information. This prognostic prediction
system was used to separate the GSE20140 samples into favorable and
poor prognostic groups based on the prognostic score. Furthermore,
the K-M survival curves were plotted for the GSE20140 samples to
examine the predictive accuracy.
Results
DEGs
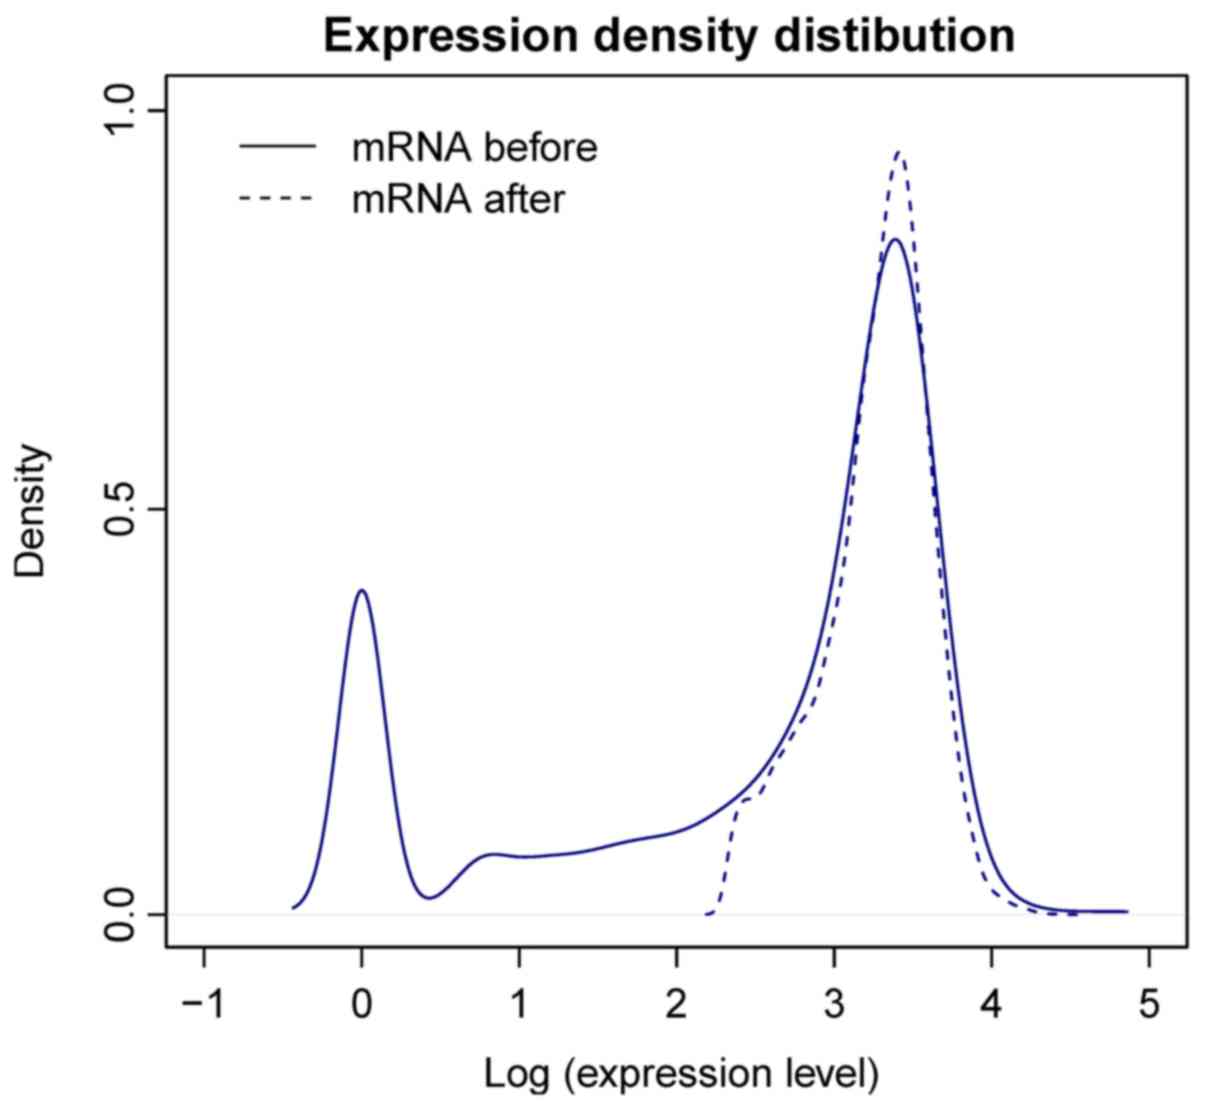
A total of 17,137 protein-coding mRNAs were
annotated in the TCGA dataset based on the information from HGNC.
After removal of low-abundance (expression value, <5) mRNAs,
12,370 mRNAs were retained and the expression density was
significantly improved (Fig. 2). A
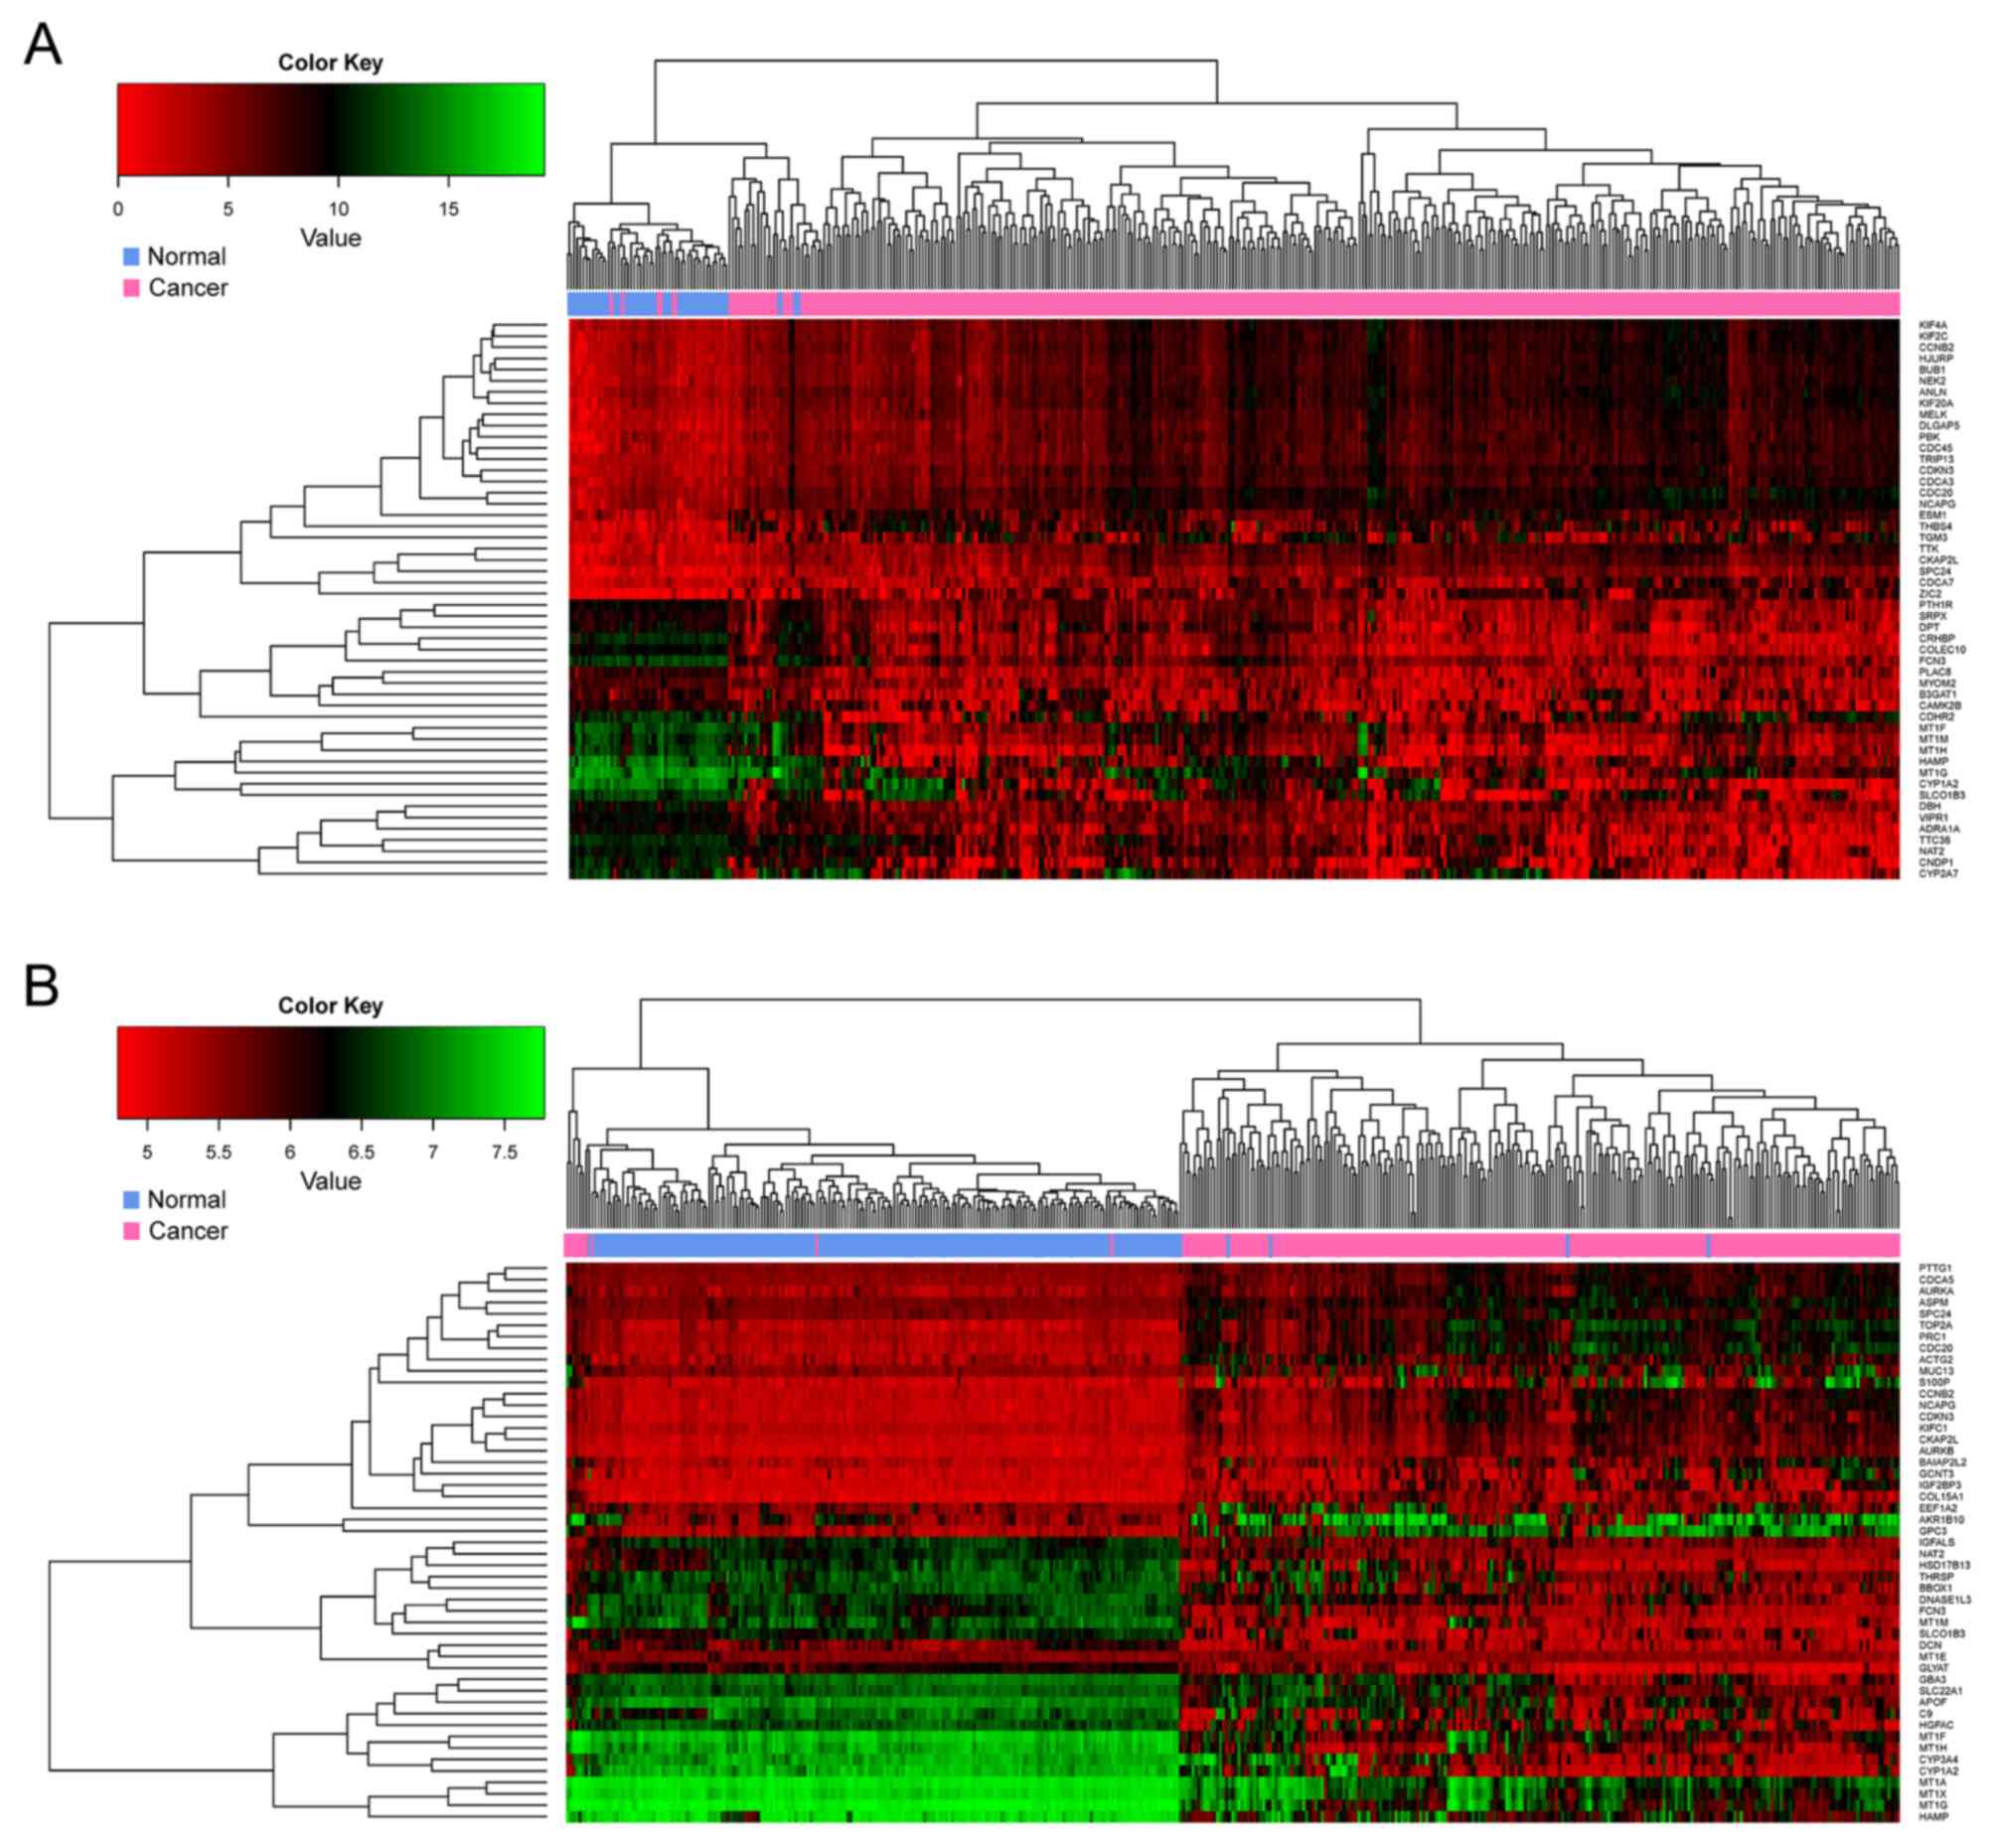
total of 498 and 3,028 DEGs were identified from the TCGA and the
GSE36376 dataset, respectively, and 177 of these were overlapping
DEGs. The hierarchical clustering analysis indicated that, among
these genes, the top 25 downregulated and upregulated DEGs were
able to discriminate between HCC and control samples (Fig. 3).
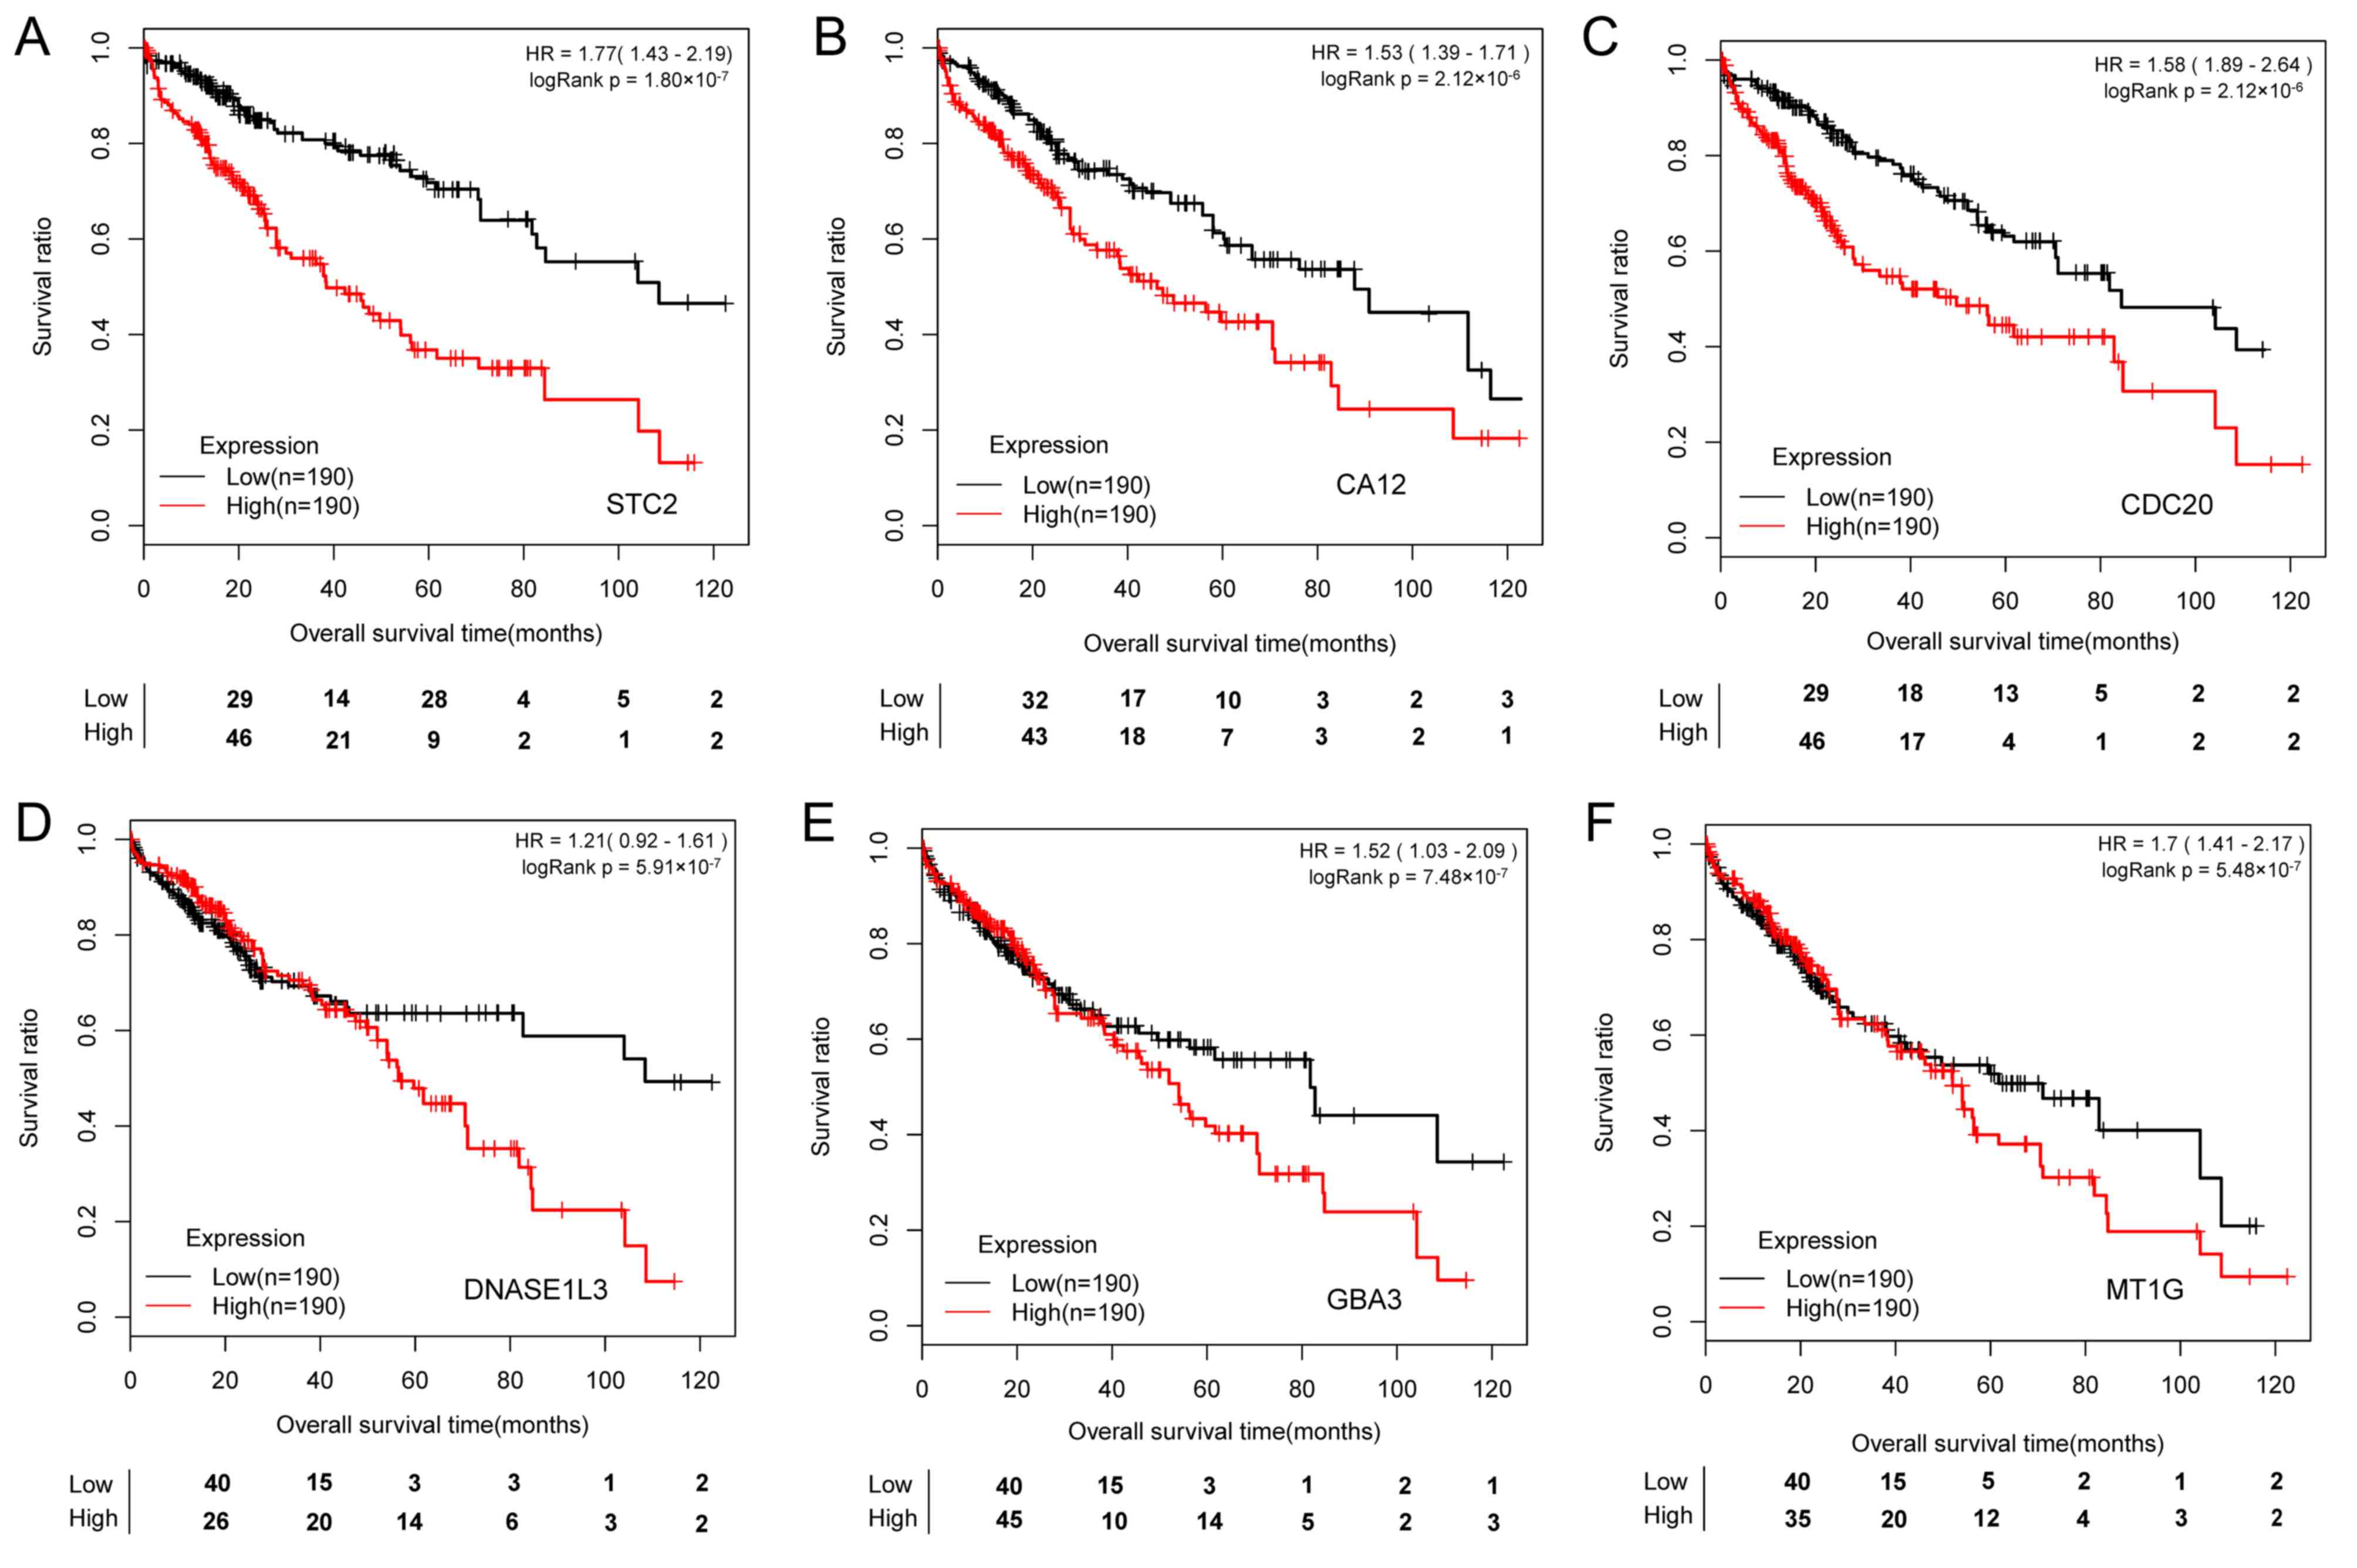
Prognostic genes
A total of 161 prognostic genes (P<0.05) were
identified. The top 6 prognostic mRNAs, ranked by -logRank in
descending order, were stanniocalcin 2 (STC2), carbonic anhydrase
12 (CA12), cell division cycle 20 (CDC20), deoxyribonuclease 1 like
3 (DNASE1L3), glucosylceramidase β3 (GBA3) and metallothionein 1G
(MT1G). The K-M survival curves of patients stratified by these 6
prognostic genes individually suggested that these molecular
markers may be used to predict the prognosis of HCC patients
(Fig. 4). Patients with high
expression levels of STC2, CA12, CDC20, DNASE1L3, GBA3 and MT1G had
a significantly shorter survival time.
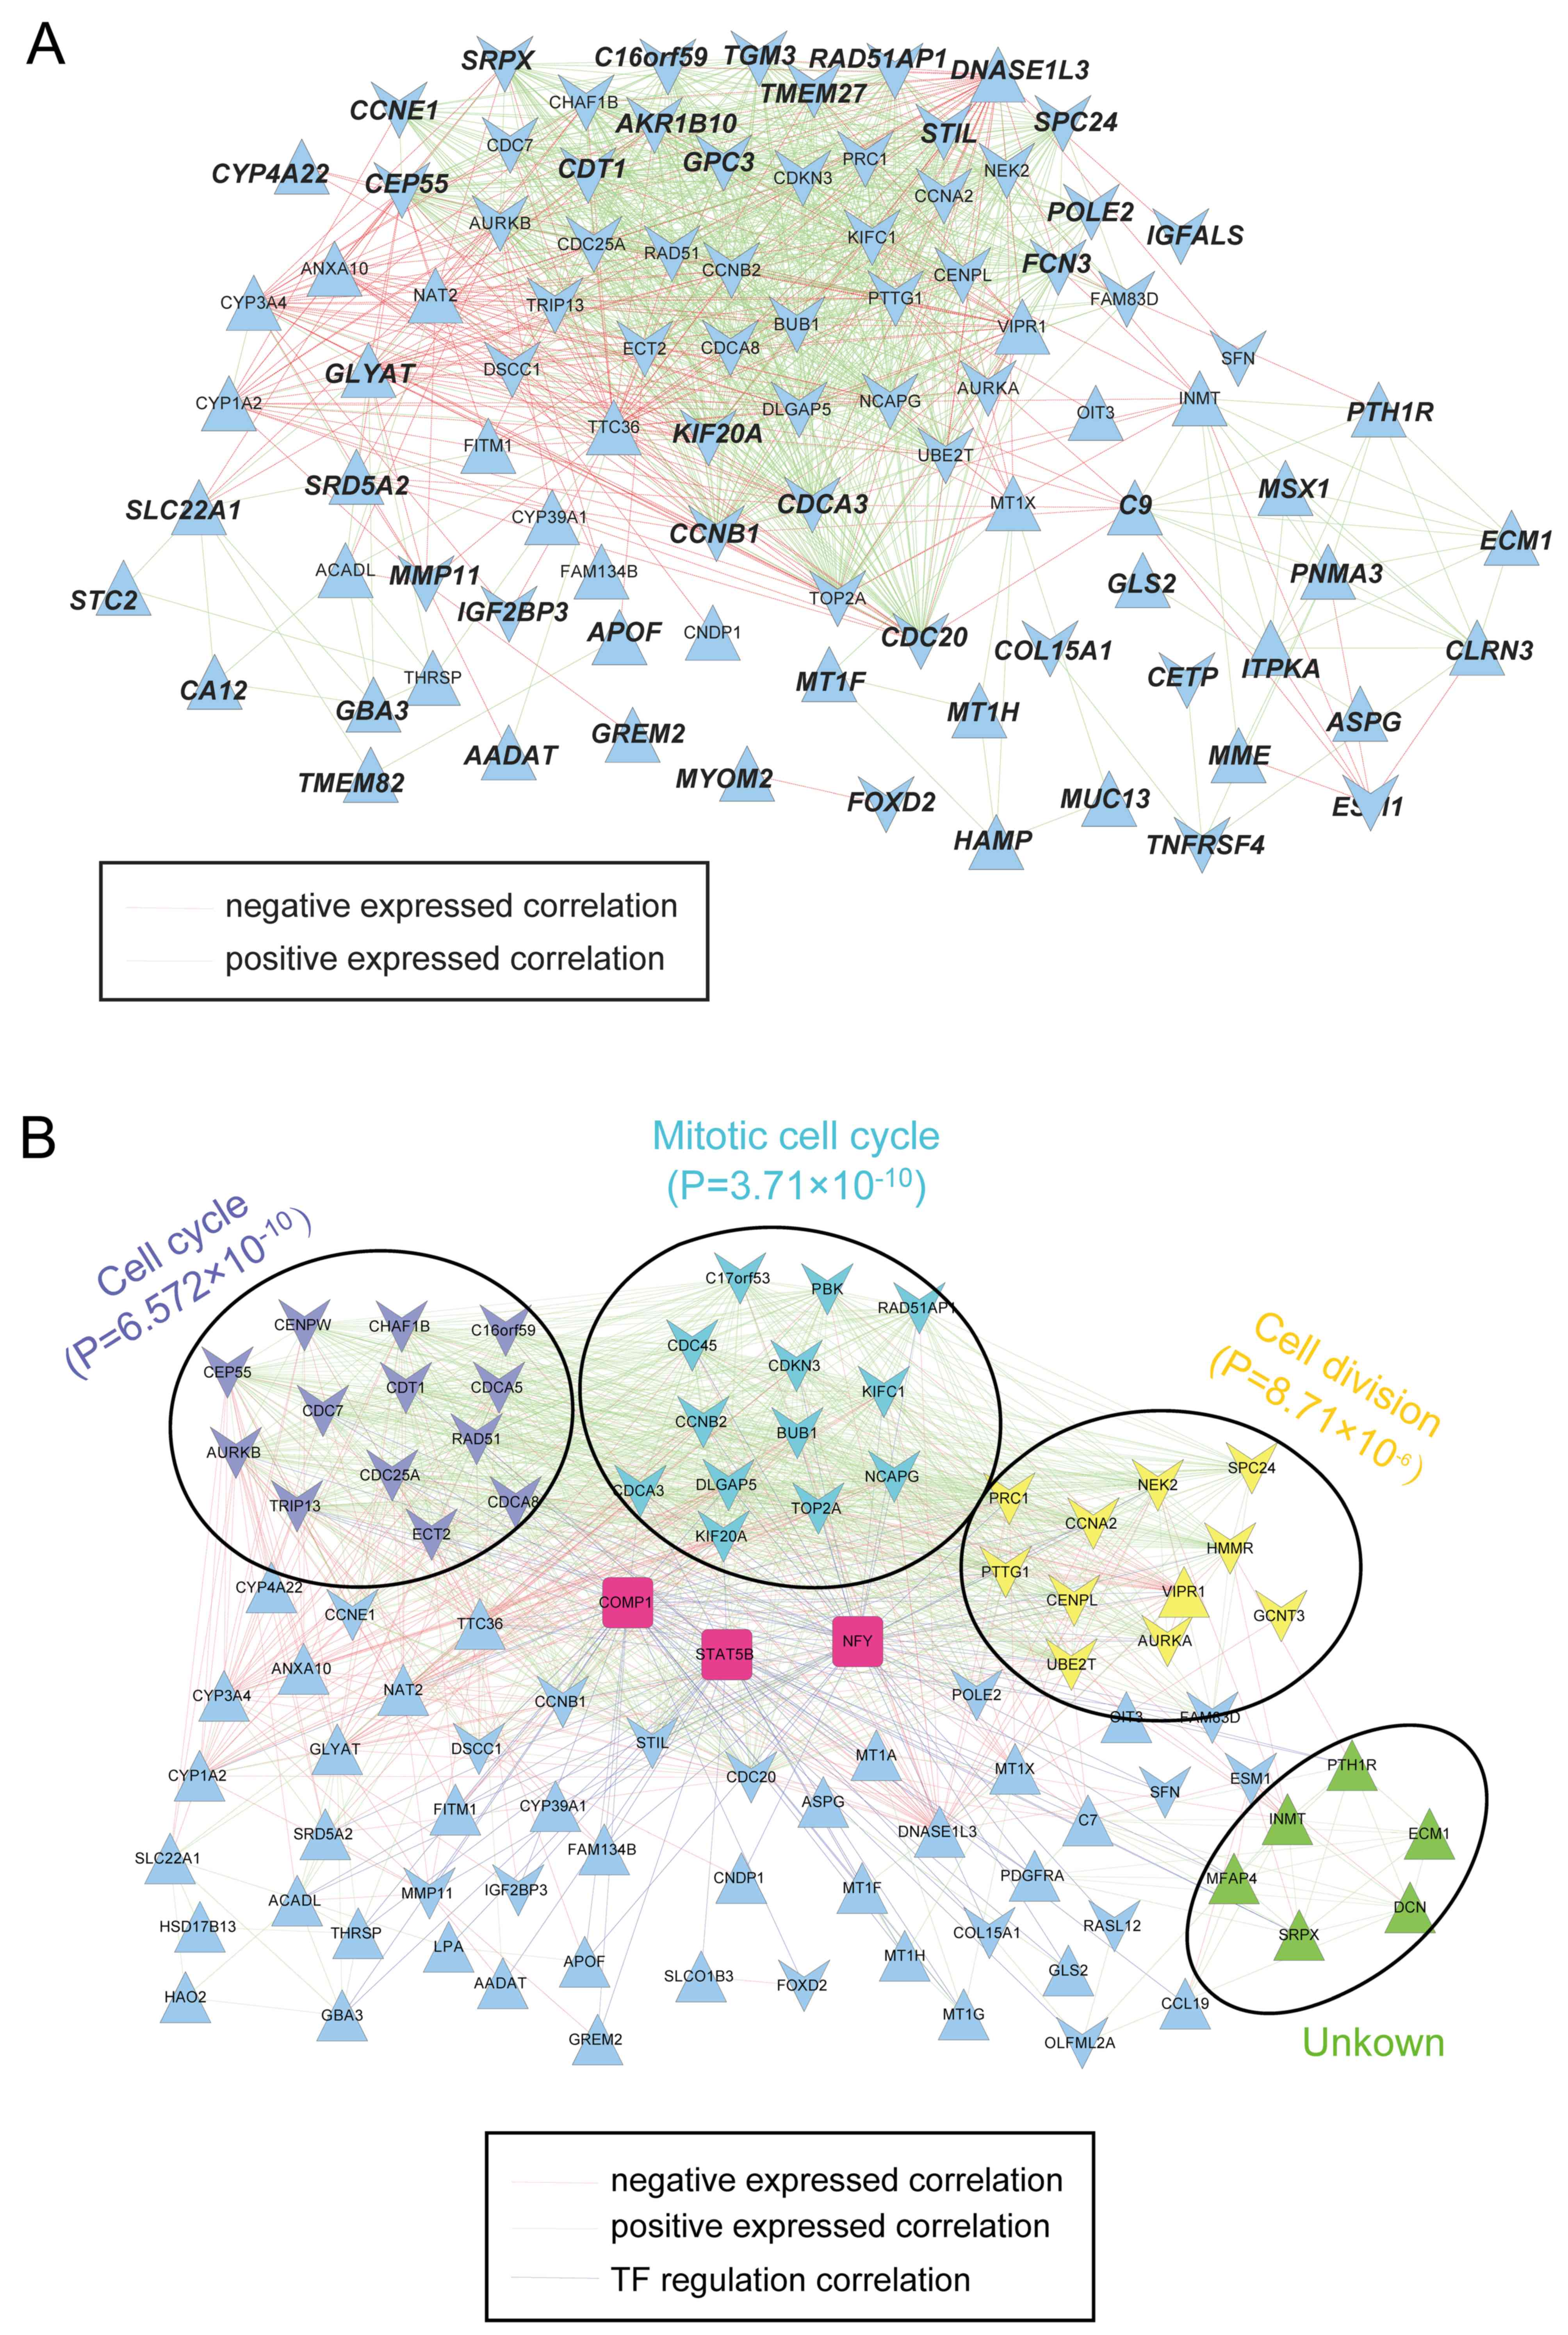
Gene co-expression network
The constructed co-expression network for prognostic
genes contained 1,017 edges and 93 nodes involving 41 upregulated
and 52 downregulated genes (Fig.
5A). A total of 3 TFs, i.e., nuclear transcription factor Y,
cooperates with myogenic proteins 1 and signal transducer and
activator of transcription 5B were identified and integrated into
the gene co-expression network (Fig.
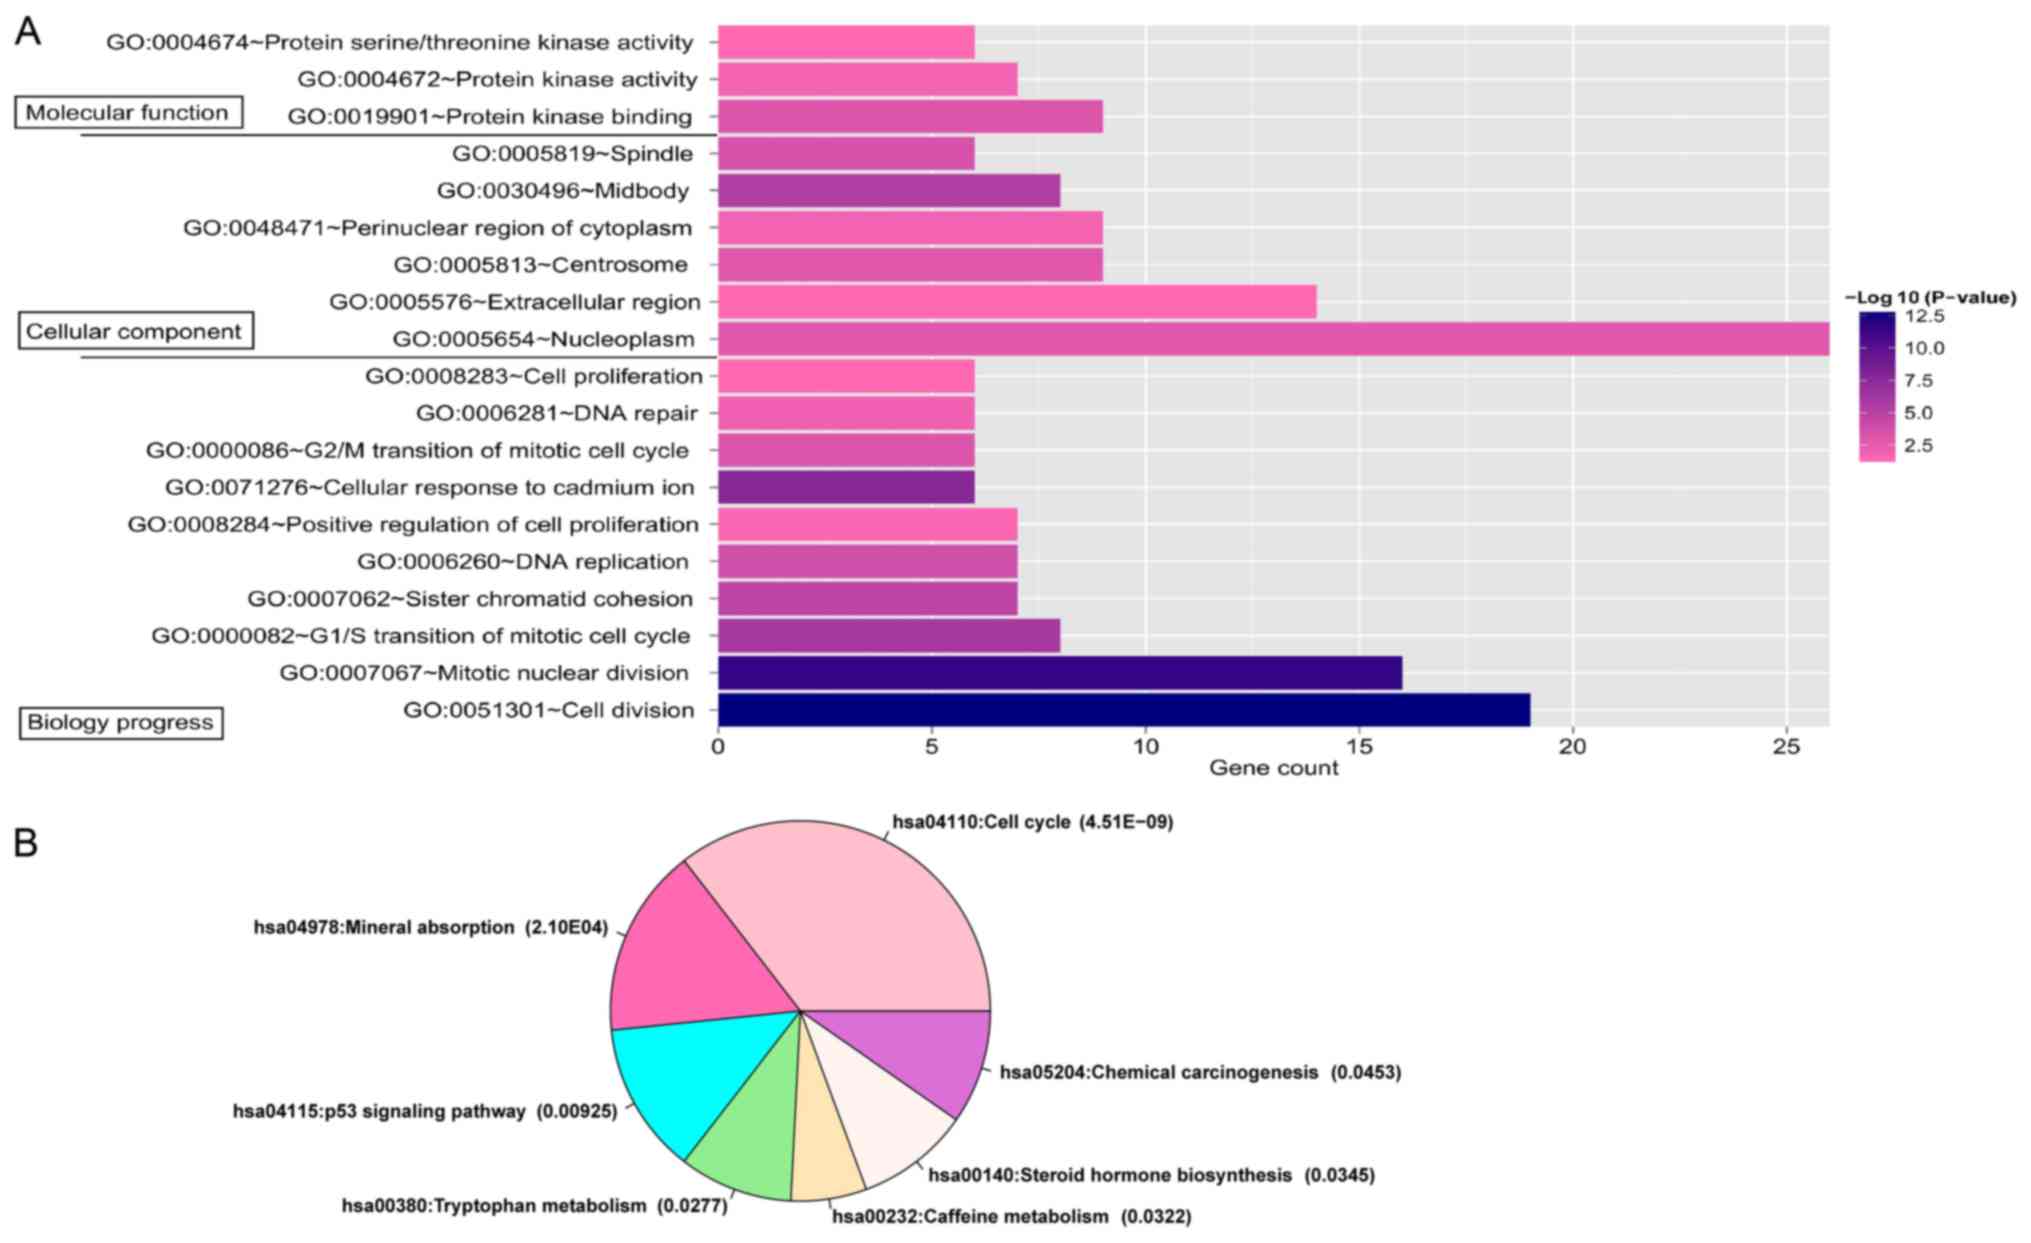
5B). A total of 18 significant GO terms and 7 KEGG pathways
were significantly enriched by the prognostic genes in the
co-expression network (Fig. 6). The
prognostic genes NIMA related kinase 2 (NEK2), cell division cycle
20 (CDC20), aurora kinase A (AURKA), pituitary tumor-transforming 1
(PTTG1), cell division cycle 25A (CDC25A), SPC24 component of NDC80
kinetochore complex (SPC24), family with sequence similarity 83
member D (FAM83D), cyclin B2 (CCNB2), BUB1 mitotic checkpoint
serine/threonine kinase (BUB1), centromere protein W (CENPW), cell
division cycle associated 5 (CDCA5), cyclin A2 (CCNA2) and cell
division cycle associated 3 (CDCA3) were significantly associated
with cell division (P=2.29×10⁻¹³) and mitotic nuclear
division (P=2.76×10⁻¹²; Table
I). A total of 7 prognostic genes, i.e. CDC7, PRC1, PTH1R,
PDGFRA, CDC20, endothelial cell specific molecule 1 (ESM1) and
VIPR1, were significantly associated with increased cell
proliferation (P=3.56×10⁻²). Furthermore, CCNB1, FAM83D,
CCNE1, PRC1, AURKA, stratifin (SFN), CCNA2, CDC25A and KIF20A were
significantly associated with protein kinase binding
(P=7.10×10⁻⁴). The pathway enrichment analysis revealed
that most of the prognostic genes in the co-expression network were
significantly involved in the cell cycle (P=4.51×10⁻⁹;
Table II), including CCNB1, CDC7,
CCNE1, CDC45, CCNB2, BUB1, CDC20, PTTG1, SFN, CCNA2 and CDC25A. The
four prognostic genes CCNB1, CCNE1, CCNB2 and SFN were
significantly associated with the p53 signaling pathway
(P=9.25×10⁻³).
 | Table I.GO functional terms enriched by the
prognostic genes in the co-expression network. |
Table I.
GO functional terms enriched by the
prognostic genes in the co-expression network.
| Category/term | Count | P-value | Genes |
|---|
| Biological
process |
|
GO:0051301~cell division | 19 |
2.29×10⁻¹³ | CDC7, KIFC1, NEK2,
AURKA, CDC20, PTTG1, CDC25A, SPC24, FAM83D, CCNB1, CCNE1, CDCA8,
CCNB2, NCAPG, BUB1, CENPW, CDCA5, CCNA2, CDCA3 |
|
GO:0007067~mitotic nuclear
division | 16 |
2.760×10⁻¹² | NEK2, CDC20, AURKA,
PBK, AURKB, CEP55, PTTG1, CDC25A, SPC24, FAM83D, CCNB2, BUB1,
CENPW, CDCA5, CCNA2, CDCA3 |
|
GO:0000082~G1/S transition of
mitotic cell cycle | 8 |
1.05×10⁻⁶ | CDC7, CCNE1, CDC45,
POLE2, CDKN3, CDCA5, CDC25A, CDT1 |
|
GO:0007062~sister chromatid
cohesion | 7 |
1.66×10⁻⁵ | SPC24, CDCA8,
CENPL, BUB1, CDC20, AURKB, CDCA5 |
|
GO:0006260~DNA
replication | 7 |
1.63×10⁻⁴ | CDC7, CDC45, POLE2,
CHAF1B, CDC25A, DSCC1, CDT1 |
|
GO:0008284~positive regulation
of cell proliferation | 7 |
3.56×10⁻² | CDC7, PRC1, PTH1R,
PDGFRA, CDC20, ESM1, VIPR1 |
|
GO:0071276~cellular response
to cadmium ion | 6 |
2.07×10⁻⁸ | MT1A, CYP1A2, MT1H,
MT1X, MT1G, MT1F |
|
GO:0000086~G2/M transition of
mitotic cell cycle | 6 |
7.65×10⁻⁴ | CCNB1, CCNB2, NEK2,
AURKA, CDC25A, HMMR |
|
GO:0006281~DNA repair | 6 |
7.87×10⁻³ | RAD51AP1, POLE2,
PTTG1, CHAF1B, UBE2T, RAD51 |
|
GO:0008283~cell proliferation
Cellular component | 6 |
4.32×10⁻² | FAM83D, STIL,
DLGAP5, BUB1, AURKB, CDC25A |
|
GO:0005654~nucleoplasm | 26 |
1.40×10⁻³ | PRC1, AURKA, AURKB,
CDT1, CCNE1, CDC45, CDCA8, POLE2, BUB1, THRSP, CCNA2, CDCA5, TOP2A,
CDC7, RAD51AP1, CENPL, CDC20, CDC25A, RAD51, CCNB1, CCNB2, CENPW,
CHAF1B, UBE2T, DSCC1, KIF20A |
|
GO:0005576~extracellular
region | 14 |
4.86×10⁻² | C7, CNDP1,
HSD17B13, COL15A1, CCL19, DCN, ESM1, ECM1, GREM2, DNASE1L3, MMP11,
LPA, APOF, MFAP4 |
|
GO:0005813~centrosome | 9 |
1.13×10⁻³ | CCNB1, STIL, CDC45,
CCNB2, NCAPG, NEK2, AURKA, CDC20, CEP55 |
|
GO:0048471~perinuclear region
of cytoplasm | 9 |
1.09×10⁻² | MT1A, AURKA, CDC20,
CDKN3, MT1H, MT1X, MT1G, RAD51, MT1F |
|
GO:0030496~midbody | 8 |
3.22×10⁻⁶ | CDCA8, PRC1, NEK2,
AURKA, CEP55, AURKB, ECT2, KIF20A |
|
GO:0005819~spindle | 6 |
3.16×10⁻⁴ | KIFC1, PRC1, AURKA,
CDC20, AURKB, KIF20A |
| Molecular
function |
|
GO:0019901~protein kinase
binding | 9 |
7.10×10⁻⁴ | CCNB1, FAM83D,
CCNE1, PRC1, AURKA, SFN, CCNA2, CDC25A, KIF20A |
|
GO:0004672~protein kinase
activity | 7 |
1.06×10⁻² | CDC7, NEK2, PDGFRA,
BUB1, AURKA, PBK, AURKB |
|
GO:0004674~protein
serine/threonine kinase activity | 6 |
4.48×10⁻² | CDC7, NEK2, BUB1,
AURKA, PBK, AURKB |
| Table II.Significantly enriched pathways for
the prognostic genes in the co-expression network. |
Table II.
Significantly enriched pathways for
the prognostic genes in the co-expression network.
| Term | Count | P-value | Genes |
|---|
| hsa04110:Cell
cycle | 11 |
4.51×10⁻⁹ | CCNB1, CDC7, CCNE1,
CDC45, CCNB2, BUB1, CDC20, PTTG1, SFN, CCNA2, CDC25A |
| hsa04978:Mineral
absorption | 5 |
2.10×10⁻⁴ | MT1A, MT1H, MT1X,
MT1G, MT1F |
| hsa04115:p53
signaling pathway | 4 |
9.25×10⁻³ | CCNB1, CCNE1,
CCNB2, SFN |
| hsa00380:Tryptophan
metabolism | 3 |
2.77×10⁻² | AADAT, CYP1A2,
INMT |
| hsa00232:Caffeine
metabolism | 2 |
3.22×10⁻² | NAT2, CYP1A2 |
| hsa00140:Steroid
hormone biosynthesis | 3 |
3.45×10⁻² | CYP3A4, SRD5A2,
CYP1A2 |
| hsa05204:Chemical
carcinogenesis | 3 |
4.53×10⁻² | CYP3A4, NAT2,
CYP1A2 |
A total of 4 functional modules were revealed by
GraphWeb (Fig. 5B). The prognostic
genes in the purple module [chromatin licensing and DNA replication
factor 1 (CDT1), CHAF1B, RAD51, CDCA5, CDCA8, CDC7, TRIP13, CDC25A,
AURKB and CEP55] were mainly associated with the cell cycle
(P=6.57×10⁻¹⁰). The prognostic genes in the blue module
(CDC20, CCNB2, CDCA3, KIFC1, PBK, NCAPG, BUB1, DLGAP5 and CDKN3)
were significantly associated with the mitotic cell cycle
(P=3.71×10⁻¹⁰). Furthermore, the prognostic genes in the
yellow module (CCNA2, PTTG1, PRC1, NEK2, SPC24 and AURKA) were
significantly involved in cell division
(P=8.71×10⁻⁶).
Prognostic prediction system
The prognostic prediction system was established
based on Bayes discriminant analysis (Fig. 7A). Finally, a prognostic prediction
system consisting of 55 signature genes and represented by 29
upregulated genes (including SPC24, TGM3, KIF20A, ESM1, CDC20,
CDCA3, CCNE1, TNFRSF4, COL15A1, and CELSR3) and 26 downregulated
genes (including CYP4A22, TMEM82, GLYAT, GBA3, APOF, SLC22A1,
DNASE1L3, ECM1, CETP, and GLS2; Table
III) was obtained. This system exhibited the highest
discriminative ability to predict the survival of 330 samples in
the TCGA dataset. The prognostic scoring system was established
following the Bayes discriminant analysis method as previously
described (33).
| Table III.The 55 signature genes involved in
the prognostic prediction system. |
Table III.
The 55 signature genes involved in
the prognostic prediction system.
| A, Upregulated
genes |
|---|
|
|---|
| Gene | logFC | P-value | FDR |
|---|
| SPC24 | 1.777 |
8.57×10⁻³³ |
2.66×10⁻³⁰ |
| TGM3 | 1.396 |
4.38×10⁻³⁵ |
1.96×10⁻³² |
| KIF20A | 1.173 |
2.42×10⁻³⁰ |
5.74×10⁻²⁸ |
| ESM1 | 1.162 |
6.50×10⁻³⁰ |
1.40×10⁻²⁷ |
| CDC20 | 1.106 |
1.51×10⁻³⁰ |
3.88×10⁻²⁸ |
| CDCA3 | 1.018 |
3.84×10⁻²³ |
4.22×10⁻²¹ |
| CCNE1 | 0.964 |
4.97×10⁻¹⁹ |
3.47×10⁻¹⁷ |
| TNFRSF4 | 0.949 |
8.28×10⁻¹⁹ |
5.59×10⁻¹⁷ |
| COL15A1 | 0.942 |
2.28×10⁻²⁵ |
3.00×10⁻²³ |
| CELSR3 | 0.921 |
1.59×10⁻¹⁹ |
1.16×10⁻¹⁷ |
| CEP55 | 0.920 |
1.99×10⁻¹⁷ |
1.19×10⁻¹⁵ |
| CDT1 | 0.860 |
4.43×10⁻²⁰ |
3.41×10⁻¹⁸ |
| C16orf59 | 0.846 |
1.13×10⁻¹⁶ |
6.18×10⁻¹⁵ |
| MUC13 | 0.800 |
1.07×10⁻¹⁹ |
7.93×10⁻¹⁸ |
| GPC3 | 0.778 |
9.91×10⁻²⁶ |
1.36×10⁻²³ |
| MMP11 | 0.723 |
2.34×10⁻¹⁶ |
1.24×10⁻¹⁴ |
| IGF2BP3 | 0.702 |
2.73×10⁻¹² |
1.04×10⁻¹⁰ |
| STC2 | 0.687 |
1.29×10⁻¹³ |
5.67×10⁻¹² |
| RAD51AP1 | 0.672 |
3.06×10⁻¹¹ |
1.05×10⁻⁹ |
| CCNB1 | 0.653 |
1.50×10⁻¹⁴ |
7.08×10⁻¹³ |
| STIL | 0.622 |
1.95×10⁻¹⁰ |
6.11×10⁻⁹ |
| CA12 | 0.615 |
9.69×10⁻¹¹ |
3.15×10⁻⁹ |
| PNMA3 | 0.550 |
8.68×10⁻⁷ |
1.55×10⁻⁵ |
| POLE2 | 0.540 |
4.99×10⁻⁸ |
1.07×10⁻⁶ |
| FOXD2 | 0.534 |
3.59×10⁻⁷ |
6.83×10⁻⁶ |
| MSX1 | 0.531 |
4.53×10⁻⁷ |
8.45×10⁻⁶ |
| ITPKA | 0.525 |
1.77×10⁻⁸ |
4.16×10⁻⁷ |
| ACTG2 | 0.525 |
3.01×10⁻⁸ |
6.78×10⁻⁷ |
| AKR1B10 | 0.514 |
7.73×10⁻¹³ |
3.14×10⁻¹¹ |
|
| B, Downregulated
genes |
|
| Gene | logFC | P-value | FDR |
|
| CYP4A22 | −0.492 |
2.25×10⁻¹² |
8.69×10⁻¹¹ |
| TMEM82 | −0.519 |
5.69×10⁻¹³ |
2.36×10⁻¹¹ |
| GLYAT | −0.536 |
1.39×10⁻¹⁶ |
7.57×10⁻¹⁵ |
| GBA3 | −0.546 |
1.40×10⁻¹⁵ |
7.17×10⁻¹⁴ |
| APOF | −0.555 |
1.52×10⁻¹⁸ |
1.00×10⁻¹⁶ |
| SLC22A1 | −0.565 |
1.50×10⁻²⁰ |
1.23×10⁻¹⁸ |
| DNASE1L3 | −0.580 |
4.07×10⁻¹⁷ |
2.31×10⁻¹⁵ |
| ECM1 | −0.591 |
7.68×10⁻¹⁷ |
4.26×10⁻¹⁵ |
| CETP | −0.602 |
1.68×10⁻¹⁵ |
8.57×10⁻¹⁴ |
| GLS2 | −0.603 |
6.99×10⁻²⁰ |
5.35×10⁻¹⁸ |
| GREM2 | −0.614 |
1.99×10⁻¹⁶ |
1.06×10⁻¹⁴ |
| AADAT | −0.615 |
2.46×10⁻¹⁷ |
1.42×10⁻¹⁵ |
| MME | −0.616 |
6.41×10⁻¹⁷ |
3.57×10⁻¹⁵ |
| SRD5A2 | −0.650 |
5.30×10⁻¹⁹ |
3.64×10⁻¹⁷ |
| C9 | −0.655 |
7.70×10⁻²⁸ |
1.33×10⁻²⁵ |
| CLRN3 | −0.701 |
2.09×10⁻²⁰ |
1.68×10⁻¹⁸ |
| IGFALS | −0.716 |
7.36×10⁻²⁶ |
1.03×10⁻²³ |
| TMEM27 | −0.730 |
5.13×10⁻²¹ |
4.37×10⁻¹⁹ |
| ASPG | −0.735 |
1.68×10⁻²⁵ |
2.26×10⁻²³ |
| SRPX | −0.763 |
7.97×10⁻²¹ |
6.69×10⁻¹⁹ |
| MYOM2 | −0.784 |
3.33×10⁻¹⁸ |
2.13×10⁻¹⁶ |
| MT1F | −0.846 |
1.21×10⁻³⁴ |
5.04×10⁻³² |
| PTH1R | −0.866 |
3.18×10⁻²⁸ |
5.82×10⁻²⁶ |
| FCN3 | −0.978 |
1.24×10−42 |
9.37×10−40 |
| HAMP | −1.052 |
2.53×10−55 |
2.78×10−52 |
| MT1H | −1.425 |
5.74×10−76 |
6.94×10−72 |
The samples were stratified into favorable and poor
prognostic groups based on the score. If the prognostic score was
between 0 and 3, the patient was defined as having a favorable
prognosis, whereas a prognostic score between −3 and 0 was
indicative of a poor prognosis. The distribution of the prognostic
scores indicated that the prognostic scores of samples in the
favorable and poor prognostic groups were obviously different
(Fig. 7B). The survival ratio of
patients in the favorable prognostic group was significantly higher
than that of patients in the poor prognostic group, according to
the K-M survival curves (Fig. 7C,
P=8.16×10⁻⁸).
Validation of the prognostic
prediction system
The predictive value of the identified prognostic
scoring system was further validated using another independent GEO
dataset, GSE20140. The samples in GSE20140 were divided into
favorable and poor prognostic groups based on the prognostic score.
The K-M survival curve indicated that patients in the favorable
prognostic group survived significantly longer than those in the
poor prognostic group (Fig. 7D;
P=1.73×10⁻³).
Discussion
In the present study, 177 overlapping DEGs were
identified from the gene expression data from the TCGA and GEO
dataset (GSE36376). Of these, 161 genes were identified as being
prognostic based on the analysis of survival. Of note, according to
the K-M survival curves, the top 6 prognostic genes (STC2, CA12,
CDC20, DNASE1L3, GBA3 and MT1G) were able to predict the prognosis
of the HCC patients from the TCGA dataset. It was revealed that
patients with high expression levels of STC2, CA12, CDC20,
DNASE1L3, GBA3 and MT1G have a significantly shorter survival time.
The STC2 protein, encoded by the STC2 gene, is an extracellular
matrix protein involved in a number of physiological processes,
including bone development, wound healing, angiogenesis and
modulation of the inflammatory response (34). Previous studies have reported that
HCC patients with expression of STC2 had a poorer prognosis
according to the K-M survival curves, suggesting that STC2
expression may be a useful indicator of poor prognosis in HCC
patients (35,36). CDC20 is a regulatory protein
interacting with the anaphase-promoting complex cyclosome in the
cell cycle and has important roles in the progression of multiple
tumors (37,38). It has also been demonstrated that
increased expression of CDC20 is associated with the development
and progression of HCC (39). The
expression of MT1G was reported to be negatively associated with
aberrant promoter hypermethylation, and the data from TCGA
suggested that hypermethylation of MT1G is linked with favorable
survival of HCC patients (40).
Therefore, the prognostic predictive value of STC2, CDC20 and MT1G
in the present study was consistent with the results of previous
studies. CA12 is a transmembrane enzyme that hydrates extracellular
CO2, leading to the generation of membrane-impermeable
H+ and HCO3− (41). It has been revealed that inhibition
of CA12 with sulphonamide- or coumarin-based small-molecule
inhibitors reversed the effects of tumor acidification, thereby
inhibiting primary or metastatic tumor cell growth (42). CA12 may affect the capability of
invasion and migration of breast cancer cells through the
p38/mitogen-activated protein kinase pathway (43). DNase1l3 is an endonuclease encoded by
DNASE1L3, and is necessary for cytokine secretion following
inflammasome activity (44). GBA3 is
a cytosolic β-glycosidase produced by mammals and has broad
substrate specificity (45).
However, few studies have reported on the roles of CA12, DNASE1L3
and GBA3 in the prognosis of HCC patients. Therefore, the
associations of CA12, DNASE1L3 and GBA3 with HCC and their
prognostic value require to be further studied.
Next, significantly co-expressed pairs were selected
for the prognostic genes and a gene co-expression network involving
93 prognostic genes was constructed. From these, a prognostic
prediction system consisting of 55 signature genes was established
based on Bayes discriminant analysis. These 55 signature genes
comprised 29 upregulated genes (including SPC24, TGM3, KIF20A,
ESM1, CDC20, CDCA3, CCNE1, TNFRSF4, COL15A1, CELSR3 and CDT1) and
26 downregulated genes (including CYP4A22, TMEM82, GLYAT, GBA3,
APOF, SLC22A1, DNASE1L3, ECM1, CETP and GLS2). The functional and
module analysis of the co-expression network indicated that SPC24,
ESM1, CDC20, CDCA3, CCNE1 and CDT1 were significantly associated
with cell division, mitotic cell cycle and positive regulation of
cell proliferation. SPC24 is an important component of the nuclear
division cycle 80 kinetochore complexes. It has been reported that
SPC24 is significantly upregulated in HCC and may be a prognostic
biomarker for patients with HCC (46). ESM1 is a secreted protein that is
mainly expressed in endothelial cells. The expression of ESM1 in
HCC tissues is positively correlated with venous invasion (47). Upregulation of CDC20 is associated
with the progression of HCC and may be a promising therapeutic
target (39). Suppression of
oncogene CCNE1, an important mediator in the G1/S-phase transition,
exerts tumor-suppressive effects in HCC (48). CDT1 is involved in the formation of
the pre-replication complex that is necessary for DNA replication.
It has been reported that the expression of CDT1 in HCC tissue is
clearly attenuated as compared with that in normal hepatic tissue
(49). Taking all this into
consideration, it may be speculated that SPC24, ESM1, CDC20, CDCA3,
CCNE1 and CDT1 may have important roles in HCC by regulating
functions associated with the cell cycle and cell
proliferation.
Kinesin family member 20A (KIF20A) is significantly
associated with protein kinase binding; it is a downstream target
of glioma-associated oncogene 2, which is important for HCC
proliferation and tumor growth. KIF20A has been reported to be
upregulated in HCC and to be a predictor of poor prognosis
(50). Therefore, KIF20A may promote
HCC progression by protein kinase binding. A total of 4 prognostic
genes, i.e., CCNB1, CCNE1, CCNB2 and SFN, were associated with p53
signaling. p53 is mostly known for its tumor suppressor properties
and is also a major regulator of cell metabolism (51). Of note, the p53 signaling pathway was
reported to be significantly dysregulated in HCC (52). Thus, CCNB1, CCNE1, CCNB2 and SFN may
participate in the molecular mechanisms of HCC by regulating the
p53 signaling pathway.
The predictive value of the prognostic prediction
system was also validated in another independent GEO dataset,
GSE20140. The K-M survival analysis suggested that the survival
ratio of patients in the favorable prognostic group, based on the
prognostic prediction score, was significantly larger than that of
the patients in the poor prognostic group. Therefore, this
prognostic prediction system may be applied to predict the
prognosis of HCC. As a limitation of the present study, the
expression levels of the important signature genes in the clinical
samples were not detected by any experimental methods.
In conclusion, a predictive gene signature for HCC
prognosis was identified via a multi-step strategy. The significant
functions and pathways enriched by the genes in the co-expression
network of the prognostic genes were also determined. A novel
prognostic prediction system, consisting of 55 signature genes,
that was able to predict the prognosis of HCC patients was
established. In future studies, the expression levels of the
important signature genes will be validated in clinical samples by
experimental methods.
Acknowledgements
Not applicable.
Funding
No funding was received.
Availability of data and materials
The datasets used and/or analyzed during the present
study are available from the corresponding author on reasonable
request.
Authors' contributions
HL conceived and designed the study. LG performed
data analyses and prepared the manuscript. QL and NL contributed
significantly to the data analyses and manuscript revision. All
authors read and approved the final manuscript.
Ethics approval and patient consent
Not applicable.
Patient consent for publication
Not applicable.
Competing interests
The authors declare that they have no competing
interests.
References
|
1
|
Zhu RX, Seto WK, Lai CL and Yuen MF:
Epidemiology of hepatocellular carcinoma in the asia-pacific
region. Gut and liver. 10:332–339. 2016. View Article : Google Scholar : PubMed/NCBI
|
|
2
|
McGlynn KA and London WT: Epidemiology and
natural history of hepatocellular carcinoma. Best Pract Res Clin
Gastroenterol. 19:3–23. 2005. View Article : Google Scholar : PubMed/NCBI
|
|
3
|
Ayuso C, Rimola J, Vilana R, Burrel M,
Darnell A, García-Criado Á, Bianchi L, Belmonte E, Caparroz C,
Barrufet M, et al: Diagnosis and staging of hepatocellular
carcinoma (HCC): Current guidelines. Eur J Radiol. 101:72–81. 2018.
View Article : Google Scholar : PubMed/NCBI
|
|
4
|
Laca L, Dedinska I, Miklusica J, Janik J,
Palkoci B and Pindura M: Surgical treatment of hepatocellular
carcinoma. Bratisl Lek Listy. 116:539–541. 2015.PubMed/NCBI
|
|
5
|
Ikeguchi M, Ueda T, Sakatani T, Hirooka Y
and Kaibara N: Expression of survivin messenger RNA correlates with
poor prognosis in patients with hepatocellular carcinoma. Diagn Mol
Pathol. 11:33–40. 2002. View Article : Google Scholar : PubMed/NCBI
|
|
6
|
Nakanishi K, Sakamoto M, Yamasaki S, Todo
S and Hirohashi S: Akt phosphorylation is a risk factor for early
disease recurrence and poor prognosis in hepatocellular carcinoma.
Cancer. 103:307–312. 2005. View Article : Google Scholar : PubMed/NCBI
|
|
7
|
Xu MZ, Yao TJ, Lee NP, Ng IO, Chan YT,
Zender L, Lowe SW, Poon RT and Luk JM: Yes-associated protein is an
independent prognostic marker in hepatocellular carcinoma. Cancer.
115:4576–4585. 2009. View Article : Google Scholar : PubMed/NCBI
|
|
8
|
Fujii T, Nomoto S, Koshikawa K, Yatabe Y,
Teshigawara O, Mori T, Inoue S, Takeda S and Nakao A:
Overexpression of pituitary tumor transforming gene 1 in HCC is
associated with angiogenesis and poor prognosis. Hepatology.
43:1267–1275. 2006. View Article : Google Scholar : PubMed/NCBI
|
|
9
|
Xu YF, Yi Y, Qiu SJ, Gao Q, Li YW, Dai CX,
Cai MY, Ju MJ, Zhou J, Zhang BH and Fan J: PEBP1 downregulation is
associated to poor prognosis in HCC related to hepatitis B
infection. J Hepatol. 53:872–879. 2010. View Article : Google Scholar : PubMed/NCBI
|
|
10
|
Ding Y, Chen B, Wang S, Zhao L, Chen J,
Ding Y, Chen L and Luo R: Overexpression of Tiam1 in hepatocellular
carcinomas predicts poor prognosis of HCC patients. Int J Cancer.
124:653–658. 2009. View Article : Google Scholar : PubMed/NCBI
|
|
11
|
Sun JC, Liang XT, Pan K, Wang H, Zhao JJ,
Li JJ, Ma HQ, Chen YB and Xia JC: High expression level of EDIL3 in
HCC predicts poor prognosis of HCC patients. World J Gastroenterol.
16:4611–4615. 2010. View Article : Google Scholar : PubMed/NCBI
|
|
12
|
Yamashita T, Forgues M, Wang W, Kim JW, Ye
Q, Jia H, Budhu A, Zanetti KA, Chen Y, Qin LX, et al: EpCAM and
alpha-fetoprotein expression defines novel prognostic subtypes of
hepatocellular carcinoma. Cancer Res. 68:1451–1461. 2008.
View Article : Google Scholar : PubMed/NCBI
|
|
13
|
Calvisi DF, Ladu S, Gorden A, Farina M,
Lee JS, Conner EA, Schroeder IS, Factor VM and Thorgeirsson SS:
Molecular pathogenesis of human hepatocellular carcinoma:
Mechanistic and prognostic significance of aberrant methylation.
Cancer Res. 66:7632006.PubMed/NCBI
|
|
14
|
Gao Q, Qiu SJ, Fan J, Zhou J, Wang XY,
Xiao YS, Xu Y, Li YW and Tang ZY: Intratumoral balance of
regulatory and cytotoxic T cells is associated with prognosis of
hepatocellular carcinoma after resection. J Clin Oncol.
25:2586–2593. 2007. View Article : Google Scholar : PubMed/NCBI
|
|
15
|
Budhu A, Forgues M, Ye QH, Jia HL, He P,
Zanetti KA, Kammula US, Chen Y, Qin LX, Tang ZY and Wang XW:
Prediction of venous metastases, recurrence, and prognosis in
hepatocellular carcinoma based on a unique immune response
signature of the liver microenvironment. Cancer Cell. 10:99–111.
2006. View Article : Google Scholar : PubMed/NCBI
|
|
16
|
Kaposi-Novak P, Lee JS, Gòmez-Quiroz L,
Coulouarn C, Factor VM and Thorgeirsson SS: Met-regulated
expression signature defines a subset of human hepatocellular
carcinomas with poor prognosis and aggressive phenotype. J Clin
Invest. 116:1582–1595. 2006. View
Article : Google Scholar : PubMed/NCBI
|
|
17
|
Bruix J and Llovet JM: Prognostic
prediction and treatment strategy in hepatocellular carcinoma (p
519–524). Hepatology. 35:519–524. 2010. View Article : Google Scholar
|
|
18
|
Smyth GK: Limma: Linear models for
microarray data. Bioinformatics Comput Biol Solut Using R
Bioconductor. pp397–420. 2005. View Article : Google Scholar
|
|
19
|
Rao Y, Lee Y, Jarjoura D, Ruppert AS, Liu
CG, Hsu JC and Hagan JP: A comparison of normalization techniques
for microRNA microarray data. Stat Appl Genet Mol Biol.
7:Article222008. View Article : Google Scholar : PubMed/NCBI
|
|
20
|
Pollard KS, Gilbert HN, Ge Y, Taylor S and
Dudoit S: multtest: Resampling-based multiple hypothesis testing.
2018.
|
|
21
|
Liu H, Xu R, Liu X, Sun R and Wang Q:
Bioinformatics analysis of gene expression in peripheral blood
mononuclear cells from children with type 1 diabetes in 3 periods.
Exp Clin Endocrinol Diabetes. 122:477–483. 2014. View Article : Google Scholar : PubMed/NCBI
|
|
22
|
Wang X, Xu S, Chen L, Shen D, Cao Y, Tang
R, Wang X, Ji C, Li Y, Cui X and Guo X: Profiling analysis reveals
the potential contribution of peptides to human adipocyte
differentiation. Proteomics Clin Appl. 16:e17001722018. View Article : Google Scholar
|
|
23
|
Varešlija D, Priedigkeit N, Fagan A,
Purcell S, Cosgrove N, O'Halloran PJ, Ward E, Cocchiglia S,
Hartmaier R, Castro CA, et al: Transcriptome characterization of
matched primary breast and brain metastatic tumors to detect novel
actionable targets. J Natl Cancer Inst. 28:2018.
|
|
24
|
Wang L, Cao C, Ma Q, Zeng Q, Wang H, Cheng
Z, Zhu G, Qi J, Ma H, Nian H and Wang Y: RNA-seq analyses of
multiple meristems of soybean: Novel and alternative transcripts,
evolutionary and functional implications. BMC Plant Biol.
14:1692014. View Article : Google Scholar : PubMed/NCBI
|
|
25
|
Gosling C: Encyclopedia of Distances. Ref
Rev. 24:342010.
|
|
26
|
Wang P, Wang Y, Hang B, Zou X and Mao JH:
A novel gene expression-based prognostic scoring system to predict
survival in gastric cancer. Oncotarget. 7:55343–55351.
2016.PubMed/NCBI
|
|
27
|
Smoot ME, Ono K, Ruscheinski J, Wang PL
and Ideker T: Cytoscape 2.8: New features for data integration and
network visualization. Bioinformatics. 27:431–432. 2011. View Article : Google Scholar : PubMed/NCBI
|
|
28
|
Yu G, Wang LG, Han Y and He QY:
ClusterProfiler: An R package for comparing biological themes among
gene clusters. OMICS. 16:284–287. 2012. View Article : Google Scholar : PubMed/NCBI
|
|
29
|
Huang da W, Sherman BT and Lempicki RA:
Systematic and integrative analysis of large gene lists using DAVID
bioinformatics resources. Nat Protoc. 4:44–57. 2009. View Article : Google Scholar : PubMed/NCBI
|
|
30
|
Reimand J, Tooming L, Peterson H, Adler P
and Vilo J: GraphWeb: Mining heterogeneous biological networks for
gene modules with functional significance. Nucleic Acids Res 36
(Web Server Issue). W452–W459. 2008. View Article : Google Scholar
|
|
31
|
Joutsijoki H, Haponen M, Rasku J,
Aalto-Setälä K and Juhola M: Error-correcting output codes in
classification of human induced pluripotent stem cell colony
images. Biomed Res Int. 2016:30250572016. View Article : Google Scholar : PubMed/NCBI
|
|
32
|
Dimitriadou E, Hornik K, Leisch F and
Meyer D: The e1071 package. Ethnos J Anthropol. 23:55–56. 2006.
|
|
33
|
Sun J and Zhao H: The application of
sparse estimation of covariance matrix to quadratic discriminant
analysis. BMC Bioinformatics. 16:482015. View Article : Google Scholar : PubMed/NCBI
|
|
34
|
Jellinek DA, Chang AC, Larsen MR, Wang X,
Robinson PJ and Reddel RR: Stanniocalcin 1 and 2 are secreted as
phosphoproteins from human fibrosarcoma cells. Biochem J.
350:453–461. 2000. View Article : Google Scholar : PubMed/NCBI
|
|
35
|
Wu F, Li TY, Su SC, Yu JS, Zhang HL, Tan
GQ, Liu JW and Wang BL: STC2 as a novel mediator for
Mus81-dependent proliferation and survival in hepatocellular
carcinoma. Cancer Lett. 388:177–186. 2017. View Article : Google Scholar : PubMed/NCBI
|
|
36
|
Zhang ZH, Wu YG, Qin CK, Rong ZH, Su ZX
and Xian GZ: Stanniocalcin 2 expression predicts poor prognosis of
hepatocellular carcinoma. Oncol Lett. 8:2160–2164. 2014. View Article : Google Scholar : PubMed/NCBI
|
|
37
|
Fung TK and Poon RY: A roller coaster ride
with the mitotic cyclins. Semin Cell Dev Biol. 16:335–342. 2005.
View Article : Google Scholar : PubMed/NCBI
|
|
38
|
Weinstein J, Jacobsen FW, Hsu-Chen J, Wu T
and Baum LG: A novel mammalian protein, p55CDC, present in dividing
cells is associated with protein kinase activity and has homology
to the Saccharomyces cerevisiae cell division cycle proteins Cdc20
and Cdc4. Mol Cell Biol. 14:3350–3363. 1994. View Article : Google Scholar : PubMed/NCBI
|
|
39
|
Li J, Gao JZ, Du JL, Huang ZX and Wei LX:
Increased CDC20 expression is associated with development and
progression of hepatocellular carcinoma. Int J Oncol. 45:1547–1555.
2014. View Article : Google Scholar : PubMed/NCBI
|
|
40
|
Zeng JD, Zhang N, Zhao GJ, Xu LX, Yang Y,
Xu XY, Chen MK, Wang HY, Zheng SX and Li XX: MT1G is silenced by
DNA methylation and contributes to the pathogenesis of
hepatocellular carcinoma. J Cancer. 9:2807–2816. 2018. View Article : Google Scholar : PubMed/NCBI
|
|
41
|
Kroemer G and Pouyssegur J: Tumor cell
metabolism: Cancer's Achilles' heel. Cancer Cell. 13:472–482. 2008.
View Article : Google Scholar : PubMed/NCBI
|
|
42
|
Neri D and Supuran CT: Interfering with pH
regulation in tumours as a therapeutic strategy. Nat Rev Drug
Discov. 10:767–777. 2011. View Article : Google Scholar : PubMed/NCBI
|
|
43
|
Hsieh MJ, Chen KS, Chiou HL and Hsieh YS:
Carbonic anhydrase XII promotes invasion and migration ability of
MDA-MB-231 breast cancer cells through the p38 MAPK signaling
pathway. Eur J Cell Biol. 89:598–606. 2010. View Article : Google Scholar : PubMed/NCBI
|
|
44
|
Shi G, Abbott KN, Wu W, Salter RD and
Keyel PA: Dnase1L3 regulates inflammasome-dependent cytokine
secretion. Front Immunol. 8:5222017. View Article : Google Scholar : PubMed/NCBI
|
|
45
|
Wang L, Seino J, Tomotake H, Funakoshi Y,
Hirayama H and Suzuki T: Co-expression of NEU2 and GBA3 causes a
drastic reduction in cytosolic sialyl free N-glycans in human MKN45
stomach cancer cells-evidence for the physical interaction of NEU2
and GBA3. Biomolecules. 5:1499–1514. 2015. View Article : Google Scholar : PubMed/NCBI
|
|
46
|
Zhu P, Jin J, Yan L, Li J, Yu XZ, Liao W
and He S: A novel prognostic biomarker SPC24 up-regulated in
hepatocellular carcinoma. Oncotarget. 6:41383–41397. 2015.
View Article : Google Scholar : PubMed/NCBI
|
|
47
|
He J, Ding C, He G and Huang Q:
Relationship between expression of ESM-1 and MMP-3 and invasion and
metastasis of human hepatocellular carcinoma. Med Sci J Central
South China. 40:368–372. 2012.(In Chinese).
|
|
48
|
Zhang X, Hu S, Zhang X, Wang L, Zhang X,
Yan B, Zhao J, Yang A and Zhang R: MicroRNA-7 arrests cell cycle in
G1 phase by directly targeting CCNE1 in human hepatocellular
carcinoma cells. Biochem Biophys Res Commun. 443:1078–1084. 2014.
View Article : Google Scholar : PubMed/NCBI
|
|
49
|
Karavias D, Maroulis I, Papadaki H, Gogos
C, Kakkos S, Karavias D and Bravou V: Overexpression of CDT1 Is a
Predictor of Poor Survival in Patients with Hepatocellular
Carcinoma. J Gastrointest Surg. 20:568–579. 2016. View Article : Google Scholar : PubMed/NCBI
|
|
50
|
Shi C, Huang D, Lu N, Chen D, Zhang M, Yan
Y, Deng L, Lu Q, Lu H and Luo S: Aberrantly activated Gli2-KIF20A
axis is crucial for growth of hepatocellular carcinoma and predicts
poor prognosis. Oncotarget. 7:26206–26219. 2016.PubMed/NCBI
|
|
51
|
Tennant DA, Durán RV and Gottlieb E:
Targeting metabolic transformation for cancer therapy. Nat Rev
Cancer. 10:267–277. 2010. View Article : Google Scholar : PubMed/NCBI
|
|
52
|
Jin B, Wang W, Du G, Huang GZ, Han LT,
Tang ZY, Fan DG, Li J and Zhang SZ: Identifying hub genes and
dysregulated pathways in hepatocellular carcinoma. Eur Rev Med
Pharmacol Sci. 19:592–601. 2015.PubMed/NCBI
|