Introduction
Lung cancer is one of the most prevalent types of
cancer, with a mean 5-year survival rate of <15% (1). This is mainly due to the lack of
diagnostic technology able to detect the disease during its early
stages. The 5-year survival rate may increase up to 60% when lung
cancer is detected prior to metastasizing to lymph nodes or distant
sites (1). Therefore, there is an
urgent need to identify biomarkers for early diagnosis. The
development of metabolomics, genomics and proteomics has produced
promising novel methods for the early detection of cancer (2,3).
Metabolomics may measure low molecular weight metabolites
(<1,000 amu), including amino acids, lipids, fatty acids and
carbohydrates, which are the end products of biochemical pathways
involved in cellular physiology, structure and signal transduction
(4). As alterations in the levels of
these metabolites may indicate an abnormal status of the cells
(5), metabolomics may be a useful
approach to screening patients with different diseases (6,7).
Of all metabolites, amino acids and acylcarnitines
are potential biomarkers for diagnosing cancer as they serve an
essential role in cell physiology as basic metabolites and
metabolic regulators. Amino acid profiles in association with lung
cancer have been studied previously (8–16).
However, inconsistent results were reported. Maeda et al
(11) demonstrated that the levels
of 8 amino acids (alanine, tyrosine, proline, glycine, isoleucine,
phenylalanine, ornithine and lysine) were increased, whereas
histidine was decreased in the plasma of patients with non-small
cell lung cancer, compared with age-, sex- and smoking
status-matched controls using liquid chromatography-mass
spectrometry (LC-MS). Rocha et al (12) reported that the plasma levels of
amino acids (including alanine, glutamine, valine, tyrosine and
histidine) in patients with cancer were lower compared with the
healthy controls. Wen et al (14), using a combination of gas
chromatography-mass spectrometry and LC-MS, revealed that the
levels of five amino acids (alanine, glutamine, glycine, threonine
and 5-hydroxytryptophan) were significantly decreased in the plasma
of patients with stage I human lung adenocarcinoma compared with
the healthy controls. Therefore, no consistency was obtained on the
association of amino acids with lung cancer. The inconsistency may
be due to various factors, including the differences in
Tumor-Node-Metastasis (TNM) stages, pathological types and
genotypes. In a previous study, a liquid chromatography-tandem mass
spectrometry (LC-MS/MS) method was developed in order to measure 13
types of amino acids and 8 types of acylcarnitines in the serum of
patients with lung cancer with ideal accuracy and precision
(17). This method was successfully
used in 40 patients with lung cancer and healthy controls, and the
results revealed that a number of metabolites were significantly
different between the patients with lung cancer and the healthy
controls (17). In the present
study, a group of patients with lung cancer with detailed clinical
characteristics were recruited, and screening for potential
biomarkers for lung cancer from two data sets was attempted. Two
data sets from different time periods were used to ensure
reliability of the results. Hence, the aim of the present study was
to build a model using amino acids and acylcarnitines for lung
cancer screening.
Materials and methods
Ethical approval
The Regional Committee for Medical and Health
Research Ethics approved the study protocol, and all patients
provided written informed consent for participation in the study.
All procedures performed in the present study involving human
participants were in accordance with 1964 Helsinki declaration and
its later amendments, or comparable ethical standards.
Subjects
Two data sets were obtained in the present study.
The data sets were recruited between January and October 2015, and
between May and September 2017 at the Department of Thoracic
Surgery of Guang'anmen Hospital (Beijing, China) and the Department
of Thoracic Surgery of China-Japan Friendship Hospital (Beijing,
China), respectively. Patients diagnosed with lung cancer were
prospectively recruited, and the control group included subjects
with no evidence of lung cancer. The inclusion criteria for
patients with lung cancer were as follows: Participants
pathologically confirmed to have malignant tumor types were
consecutively recruited from the two sites at their regular
appointments. The exclusion criteria for the patients with lung
cancer were as follows: Diagnosis of diseases other than lung
disease, other cancer types and a history of any thoracic surgery
within 30 days prior to enrolment. In the two data sets,
participants in the control groups matched the patient groups in
terms of age and sex. The inclusion criteria for control groups
were as follows: Participants without discomfort in the respiratory
system, and diagnosed with no abnormality under X-ray analysis. The
exclusion criteria for control groups were as follows: A diagnosis
of any cancer type and a history of any thoracic surgery within 30
days prior to enrolment. The demographic characteristics were
summarized in Table I for the 2015
data set and Table II for the 2017
data set. The 2017 data set presented information on body mass
index (BMI), smoking status, hypertension, diabetes, TNM stage and
histology.
 | Table I.Demographic characteristics of
subjects in 2015 data set. |
Table I.
Demographic characteristics of
subjects in 2015 data set.
| Characteristic | Lung cancer
patients | Controls | P-value |
|---|
| Patients, n | 40 | 100 |
|
| Age, years |
|
| 0.216a |
|
Mean | 66.7 | 64.1 |
|
|
Median | 66 | 62 |
|
|
Minimum | 49 | 41 |
|
|
Maximum | 83 | 90 |
|
| Sex, n (%) |
|
|
>0.999b |
|
Male | 26 (65) | 65 (65) |
|
|
Female | 14 (35) | 35 (35) |
|
| Table II.Demographic and clinical
characteristics of subjects in 2017 data set. |
Table II.
Demographic and clinical
characteristics of subjects in 2017 data set.
| Characteristic | Lung cancer
patients | Controls |
P-valueb |
|---|
| Patients, n | 17 | 30 |
|
| Age, years |
|
| 0.176 |
|
Mean | 66.3 | 62.8 |
|
|
Median | 65 | 62 |
|
|
Minimum | 53 | 34 |
|
|
Maximum | 77 | 85 |
|
| Sex, n (%) |
|
| >0.999 |
|
Male | 13 (76.5) | 23 (76.7) |
|
|
Female | 4
(23.5) | 7
(23.3) |
|
| BMI |
|
| 0.563 |
|
Mean | 22.78 | 23.86 |
|
|
Median | 23.24 | 22.99 |
|
|
Minimum | 20.20 | 18.03 |
|
|
Maximum | 25.06 | 35.92 |
|
| Smoking status, n
(%) |
|
| 0.787 |
|
Current | 4 (23.53) | 7
(23.33) |
|
|
Previous | 5 (29.41) | 6
(20.00) |
|
|
Never | 8 (47.06) | 16 (53.33) |
|
| Missing
data | 0 (0) | 1 (0.33) |
|
| Hypertension, n
(%) |
|
| 0.343 |
|
Yes | 4 (23.53) | 13 (43.33) |
|
| No | 8 (47.06) | 15 (50.00) |
|
| Missing
data | 5 (29.41) | 2 (6.67) |
|
| Diabetes, n
(%) |
|
| 0.866 |
|
Yes | 4 (23.53) | 13 (43.33) |
|
| No | 5 (29.41) | 13 (43.33) |
|
| Missing
data | 8 (47.06) | 4
(13.33) |
|
| Stagea, n (%) |
|
|
|
| I | 0 | 0 |
|
| II | 1 (5.88) | 0 |
|
|
III | 2
(11.76) | 0 |
|
| IV | 14 (82.35) | 0 |
|
| Histology, n
(%) |
|
|
|
|
Adenocarcinoma | 4 (23.53) | 0 |
|
|
Squamous cell carcinoma | 5 (29.41) | 0 |
|
| Small
cell lung cancer | 5 (29.41) | 0 |
|
| Other
types of NSCLC | 3 (17.65) | 0 |
|
Sample collection and preparation
Blood samples (5 ml) were collected from the forearm
veins into vacuum tubes subsequent to overnight fasting. Serum was
prepared by centrifugation at 3,512 × g for 10 min at 25°C, and
then stored at −80°C until further analysis. All serum samples were
prepared within 48 h of blood collection.
LC-MS/MS measurement
A total of 13 types of amino acids and 8 types of
acylcarnitines were measured using the LC-MS/MS method as described
previously (17). Glutamine and
asparagine were unstable in the serum, and were transformed into
glutamate and aspartate on a large scale when stored at 4°C for 4
h. In the present study, glutamine, glutamate, aspartate and
asparagine were measured simultaneously using a fast LC-MS/MS
method. The serum samples were deproteinized using methanol at a
final concentration of 20% prior to measurement. The total
concentrations of glutamate + glutamine or aspartate + asparagine
were calculated as one variable. Detailed parameters of this method
are presented in Table III. In
order to reduce any potential bias introduced prior to analysis,
all serum samples were analyzed within 3 months. The stability of
fresh serum that was preserved at 4°C for 2, 4, 7, 24, 48 and 72 h,
and at −80°C for 10, 20, 30, 60 and 90 days were investigated.
| Table III.Parameters of liquid
chromatography-tandem mass spectrometry method for measuring
glutamate, aspartate, glutamine and asparagine. |
Table III.
Parameters of liquid
chromatography-tandem mass spectrometry method for measuring
glutamate, aspartate, glutamine and asparagine.
| Parameter | Value |
|---|
| Mobile phase | Water containing
0.05% (v/v) formic acid |
| Column | Phenomenex Kinetex
F5 column (4.6×100 mm, 2.6 µm) |
| Column temperature
(°C) | 30 |
| Flow rate
(ml/min) | 0.3 |
| Capillary voltage
(kV) | 3.5 |
| Drying gas
temperature (°C) | 350 |
| Drying gas flow
(l/min) | 10 |
| Nebulizer pressure
(psi) | 40 |
| MRM transition
(m/z) |
|
|
Glu | 148→84 |
|
Gln | 147→83 |
|
Asp | 134→88 |
|
Asn | 133→87 |
|
Glu-IS | 151→87 |
|
Asp-IS | 137→91 |
| Dwell (msec) |
|
|
Glu | 100 |
|
Gln | 100 |
|
Asp | 100 |
|
Asn | 100 |
|
Glu-IS | 100 |
|
Asp-IS | 100 |
| Fragmentor (V) |
|
|
Glu | 80 |
|
Gln | 80 |
|
Asp | 50 |
|
Asn | 50 |
|
Glu-IS | 80 |
|
Asp-IS | 50 |
| CE (eV) |
|
|
Glu | 18 |
|
Gln | 5 |
|
Asp | 7 |
|
Asn | 4 |
|
Glu-IS | 18 |
|
Asp-IS | 7 |
Statistical analysis
Statistical analyses were performed using SPSS
software (version 17.0; SPSS, Inc., Chicago, IL, USA) and SIMCA-P
11 software (Sartorius Stedim Data Analytics AB, Umeå, Sweden).
Demographic and clinical characteristics of subjects in the two
data sets were analyzed. Age and BMI between lung cancer patients
and healthy controls in the two data sets were analyzed by
Mann-Whitney U-tests. Sex, smoking status, hypertension and
diabetes between lung cancer patients and healthy controls in the
two data sets were analyzed using χ2 tests. The mean ±
standard deviations of amino acid and acylcarnitine concentrations
were calculated for patients with lung cancer and healthy controls
in the two data sets. Metabolomic data from the two data sets were
analyzed using univariate [Mann-Whitney U test, Student's t-test,
Welch's F test and receiver operating characteristics (ROC) curve
analysis] and multivariate logistic regression analyses to screen
for biomarkers in lung cancer. The metabolites, which were
significantly (P<0.05) different in patients with lung cancer
compared with healthy controls in the two data sets, were screened
to be potential biomarkers. In the univariate analyses, the
Shapiro-Wilk test of normality was used to examine the shape of the
distribution of each variable. A Mann-Whitney U test was used to
compare the variables without normal distribution between the
patients and control groups. For variables with a normal
distribution, Levene's test and the Brown-Forsythe test were used
to examine the equality of variances. To examine the differences
between patients and controls, a Student's t-test was applied for
variables with equal variances, and Welch's F test was used for
variables with unequal variances. A logistic regression model was
used to calculate the relevance of variables in patients with lung
cancer. P<0.05 was considered to indicate a statistically
significant difference.
Partial least squares-discriminant
analysis (PLS-DA)
PLS-DA was performed using the screened potential
biomarkers based on the 2017 data set to determine if patients with
lung cancer and healthy controls could be separated. The 2017 data
set was selected for PLS-DA analysis as there were no significant
differences identified in the confounding factors (including age,
sex, BMI, smoking status, hypertension and diabetes) between the
patients with lung cancer and the healthy controls. PLS-DA was
performed on log10-transformed normalized concentrations that
accounted for the non-normal distribution of the concentration data
and reduced the chance of skewed variables. In order to avoid
over-optimization, 10-fold cross validation was performed to
generate an unbiased analysis. Two parameters, R2
(‘goodness-of-fit’) and Q2 (‘goodness-of-prediction’) were
calculated in the PLS-DA models.
Verification for PLS-DA Spearman's correlation
analysis and ROC curve analysis were performed to verify the
robustness of the established PLS-DA model. Spearman's correlation
analysis was used to investigate the correlation of the first
principal component from the PLS-DA model with lung cancer. ROC
curve analysis was used to assess the ability of discrimination of
the first principal component.
Physiological function analysis
The discriminated metabolites were queried in two
databases. The human metabolomics pathway was queried using the
Kyoto Encyclopedia of Genes and Genomes database (https://www.genome.jp/kegg/) and the Small Molecule
Pathway Database (http://smpdb.ca/).
Results
LC-MS/MS analyses of serum
samples
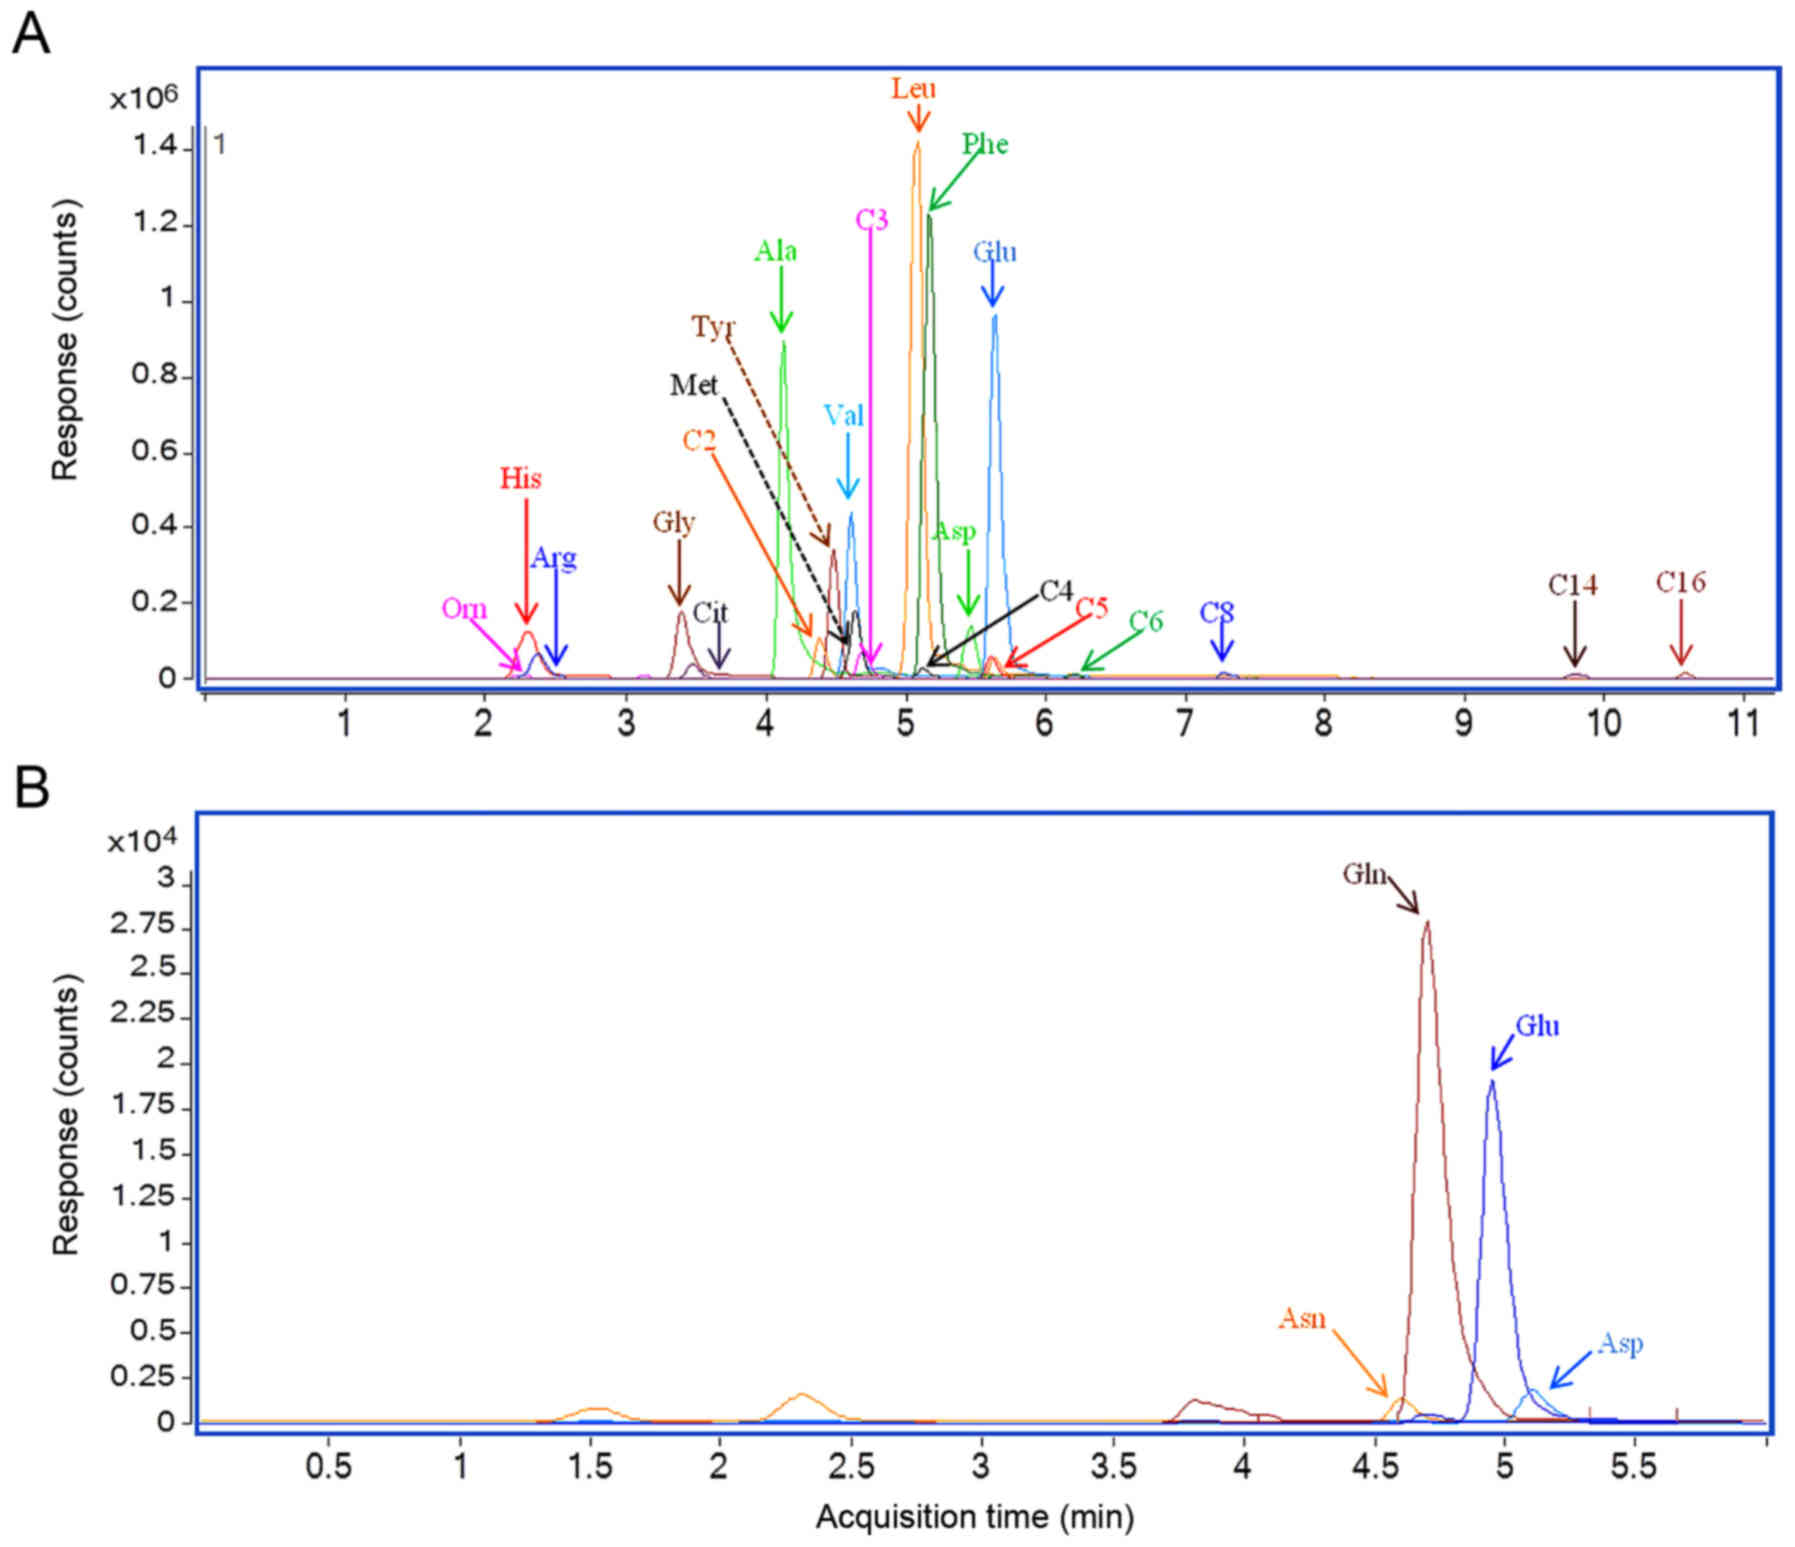
Multiple-reaction monitoring chromatography results
of serum samples from two representative patients with lung cancer
are presented in Fig. 1. The results
revealed a substantial chromatographic separation of the
metabolites. The serum concentrations for metabolites in the 2015
and 2017 data sets are presented in Tables IV and V, respectively. The total concentrations of
glutamate+glutamine or aspartate+asparagine were calculated as one
variable.
| Table IV.Quantified amino acids and
acylcarnitine in serum samples in 2015 data set. |
Table IV.
Quantified amino acids and
acylcarnitine in serum samples in 2015 data set.
|
| Concentration in
serum samples (µM) |
|
|
|
|---|
|
|
|
|
|
|
|---|
|
| Lung cancer group
(n=40) | Control group
(n=100) | Univariate
analysis | analysis |
|---|
|
|
|
|
|
|
|---|
| Analytes | Mean | Median | Range | Median | Mean | Range | P-value | AUC | Logistic
(P-value) |
|---|
| Glycine | 408.80 | 411.19 | 157.90–690.20 | 420.01 | 407.44 | 284.57–677.37 | 0.605 | 0.467 | 0.033 |
| Alanine | 146.50 | 138.68 | 43.11–330.21 | 141.98 | 135.48 | 84.12–266.31 | 0.934 | 0.505 | 0.340 |
| Valine | 136.60 | 132.27 | 73.40–280.72 | 165.62 | 165.03 | 79.80–244.38 | <0.001 | 0.183 | 0.378 |
| Leucine | 129.40 | 127.56 | 49.07–254.14 | 116.60 | 115.71 | 62.80–205.75 | 0.009 | 0.642 | 0.920 |
| Ornithine | 197.29 | 153.49 | 56.83–580.43 | 152.53 | 145.11 | 31.25–438.65 | 0.043 | 0.603 | 0.194 |
| Methionine | 21.02 | 20.37 | 11.33–47.82 | 33.09 | 32.55 | 15.74–53.06 | <0.001 | 0.076 | 0.067 |
| Histidine | 122.48 | 131.10 | 35.36–176.75 | 96.47 | 98.00 | 29.96–148.03 | <0.001 | 0.754 | 0.097 |
| Phenylalanine | 97.25 | 95.64 | 34.91–208.23 | 68.00 | 67.13 | 46.19–118.44 | <0.001 | 0.841 | 0.931 |
| Arginine | 224.94 | 213.79 | 107.76–490.61 | 123.76 | 119.51 | 42.20–271.55 | <0.001 | 0.907 | 0.015 |
| Citrulline | 23.41 | 23.03 | 9.38–61.59 | 42.14 | 40.80 | 13.68–75.45 | <0.001 | 0.103 | 0.039 |
| Tyrosine | 114.95 | 117.24 | 41.64–212.89 | 88.03 | 86.28 | 50.00–130.74 | <0.001 | 0.766 | 0.941 |
|
Aspartate+Asparagine | 52.23 | 44.32 | 23.45–112.38 | 54.89 | 54.80 | 24.52–98.12 | 0.022 | 0.375 | 0.119 |
|
Glutamate+Glutamine | 584.76 | 576.56 | 211.89–949.40 | 629.54 | 632.39 | 370.14–899.90 | 0.060 | 0.350 | 0.181 |
| C2-carnitine | 8.52 | 7.75 | 1.49–23.52 | 8.76 | 8.31 | 2.08–18.04 | 0.243 | 0.437 | 0.652 |
| C3-carnitine | 1.30 | 1.23 | 0.21–4.59 | 0.58 | 0.55 | 0.22–1.60 | <0.001 | 0.869 | 0.844 |
| C4-carnitine | 0.54 | 0.51 | 0.08–2.68 | 0.22 | 0.20 | 0.07–0.54 | <0.001 | 0.879 | 0.446 |
| C5-carnitine | 0.18 | 0.18 | 0.04–0.51 | 0.10 | 0.09 | 0.03–0.26 | <0.001 | 0.818 | 0.734 |
| C6-carnitine | 0.06 | 0.04 | 0.01–0.60 | 0.06 | 0.04 | 0.01–0.41 | 0.291 | 0.444 | 0.713 |
| C8-carnitine | 0.06 | 0.04 | 0.01–0.71 | 0.08 | 0.05 | 0.00–0.61 | 0.003 | 0.340 | 0.780 |
| C14-carnitine | 0.04 | 0.04 | 0.01–0.10 | 0.02 | 0.02 | 0.00–0.12 | <0.001 | 0.761 | 0.795 |
| C16-carnitine | 0.38 | 0.34 | 0.06–1.13 | 0.19 | 0.17 | 0.08–0.73 | <0.001 | 0.858 | 0.395 |
| Table V.Quantified amino acids and
acylcarnitine in serum samples in the 2017 data set. |
Table V.
Quantified amino acids and
acylcarnitine in serum samples in the 2017 data set.
|
| Concentration in
serum samples (µM) |
|
|
|
|---|
|
|
|
|
|
|
|---|
|
| Lung cancer group
(n=17) | Control group
(n=35) | Univariate
analysis | Multivariate
analysis |
|---|
|
|
|
|
|
|
|---|
| Analytes | Mean | Median | Mean | Median | Mean | Median | P-value | AUC | Logistic
(P-value) |
|---|
| Glycine | 324.88 | 318.82 | 236.80–462.49 | 368.74 | 364.36 | 233.65–638.02 | 0.007 | 0.267 | 0.078 |
| Alanine | 126.29 | 124.49 | 92.67–179.81 | 138.50 | 127.90 | 81.16–370.99 | 0.704 | 0.467 | 0.591 |
| Valine | 150.73 | 156.72 | 105.34–198.82 | 175.24 | 171.69 | 126.45–250.55 | 0.009 | 0.299 | 0.675 |
| Leucine | 101.11 | 102.92 | 64.08–130.80 | 122.97 | 120.30 | 79.02–177.04 | 0.001 | 0.250 | 0.851 |
| Ornithine | 139.60 | 119.32 | 65.12–287.56 | 129.93 | 133.13 | 66.21–198.69 | 0.822 | 0.481 | 0.158 |
| Methionine | 27.22 | 26.52 | 15.90–43.24 | 31.19 | 30.24 | 23.19–44.06 | 0.027 | 0.316 | 0.590 |
| Histidine | 84.06 | 78.88 | 56.96–120.87 | 101.46 | 104.19 | 39.50–125.26 | 0.003 | 0.242 | 0.030 |
| Phenylalanine | 95.76 | 92.73 | 61.10–139.59 | 101.53 | 102.74 | 63.02–133.56 | 0.261 | 0.398 | 0.955 |
| Arginine | 139.89 | 128.43 | 103.06–209.80 | 117.79 | 119.89 | 76.37–215.69 | 0.012 | 0.716 | 0.016 |
| Citrulline | 32.00 | 30.00 | 14.80–68.00 | 39.25 | 37.12 | 15.06–65.81 | 0.010 | 0.277 | 0.377 |
| Tyrosine | 92.47 | 93.04 | 59.02–126.55 | 94.74 | 94.31 | 58.02–130.75 | 0.647 | 0.481 | 0.509 |
|
Aspartate+Asparagine | 45.93 | 43.01 | 30.01–79.38 | 44.03 | 42.03 | 34.36–69.63 | 0.647 | 0.461 | 0.974 |
|
Glutamate+Glutamine | 636.09 | 616.63 | 464.70–831.08 | 656.83 | 659.85 | 504.48–795.23 | 0.375 | 0.402 | 0.526 |
| C2-carnitine | 8.69 | 7.92 | 3.64–17.50 | 7.32 | 6.80 | 2.99–19.12 | 0.205 | 0.609 | 0.760 |
| C3-carnitine | 0.77 | 0.69 | 0.28–1.90 | 0.78 | 0.77 | 0.12–1.53 | 0.429 | 0.432 | 0.363 |
| C4-carnitine | 0.27 | 0.22 | 0.11–0.92 | 0.29 | 0.27 | 0.15–0.53 | 0.059 | 0.338 | 0.167 |
| C5-carnitine | 0.09 | 0.09 | 0.04–0.19 | 0.12 | 0.12 | 0.05–0.22 | 0.018 | 0.285 | 0.219 |
| C6-carnitine | 0.05 | 0.04 | 0.01–0.09 | 0.05 | 0.04 | 0.02–0.04 | 0.728 | 0.471 | 0.693 |
| C8-carnitine | 0.06 | 0.05 | 0.01–0.10 | 0.07 | 0.06 | 0.02–0.22 | 0.382 | 0.425 | 0.689 |
| C14-carnitine | 0.03 | 0.03 | 0.01–0.05 | 0.03 | 0.02 | 0.00–0.06 | 0.805 | 0.520 | 0.420 |
| C16-carnitine | 0.28 | 0.28 | 0.15–0.41 | 0.24 | 0.25 | 0.12–0.37 | 0.080 | 0.644 | 0.011 |
Univariate analyses
The results of the univariate analyses were
presented in Table IV (2015 data
set) and Table V (2017 data set). As
presented in Tables IV and V, three metabolites (valine, methionine and
citrulline) were decreased in the patients with lung cancer
compared with the healthy controls in the two data sets. However,
one metabolite (arginine) was increased in the patients with lung
cancer compared with the healthy controls in the two data sets. The
four metabolites (valine, methionine, citrulline and arginine) were
altered significantly in the patients with lung cancer in the two
data sets, and these results suggested their potential to
distinguish the metabolites in patients with lung cancer.
Compared with the controls, three metabolites
(histidine, leucine and C5-carnitine) were increased in the
patients with lung cancer in the 2015 data set, but decreased in
the 2017 data set. In addition, the levels of 9 metabolites
(ornithine, phenylalanine, tyrosine, aspartate + asparagine,
C3-carnitine, C4-carnitine, C8-carnitine, C14-carnitine and
C16-carnitine) were significantly altered in the patients with lung
cancer only in the 2015 data set. This discrepancy may be caused by
data set differences or the limitations of the statistical methods
used. Multivariate analyses were further used to screen for the
potential to identify metabolites in patients with lung cancer.
Multivariate analyses
The results of the logistic regression analyses are
provided in Tables IV and V. Glycine was observed to be significantly
decreased in the patients with lung cancer in the two data sets.
The results revealed that the difference in the levels of glycine
between the patients and the healthy controls was significant in
the 2015 data set under multivariate statistical analyses, and
significant in the 2017 data set under univariate analyses.
C16-carnitine was revealed to be significantly different between
the patients with lung cancer and the healthy controls for the 2017
data set under multivariate statistical analyses, and for the 2015
data set under univariate analyses.
Therefore, glycine and C16-carnitine were considered
to be potential biomarkers for lung cancer. In total, six
metabolites (glycine, valine, methionine, citrulline, arginine and
C16-carnitine) were considered to be potential biomarkers for lung
cancer.
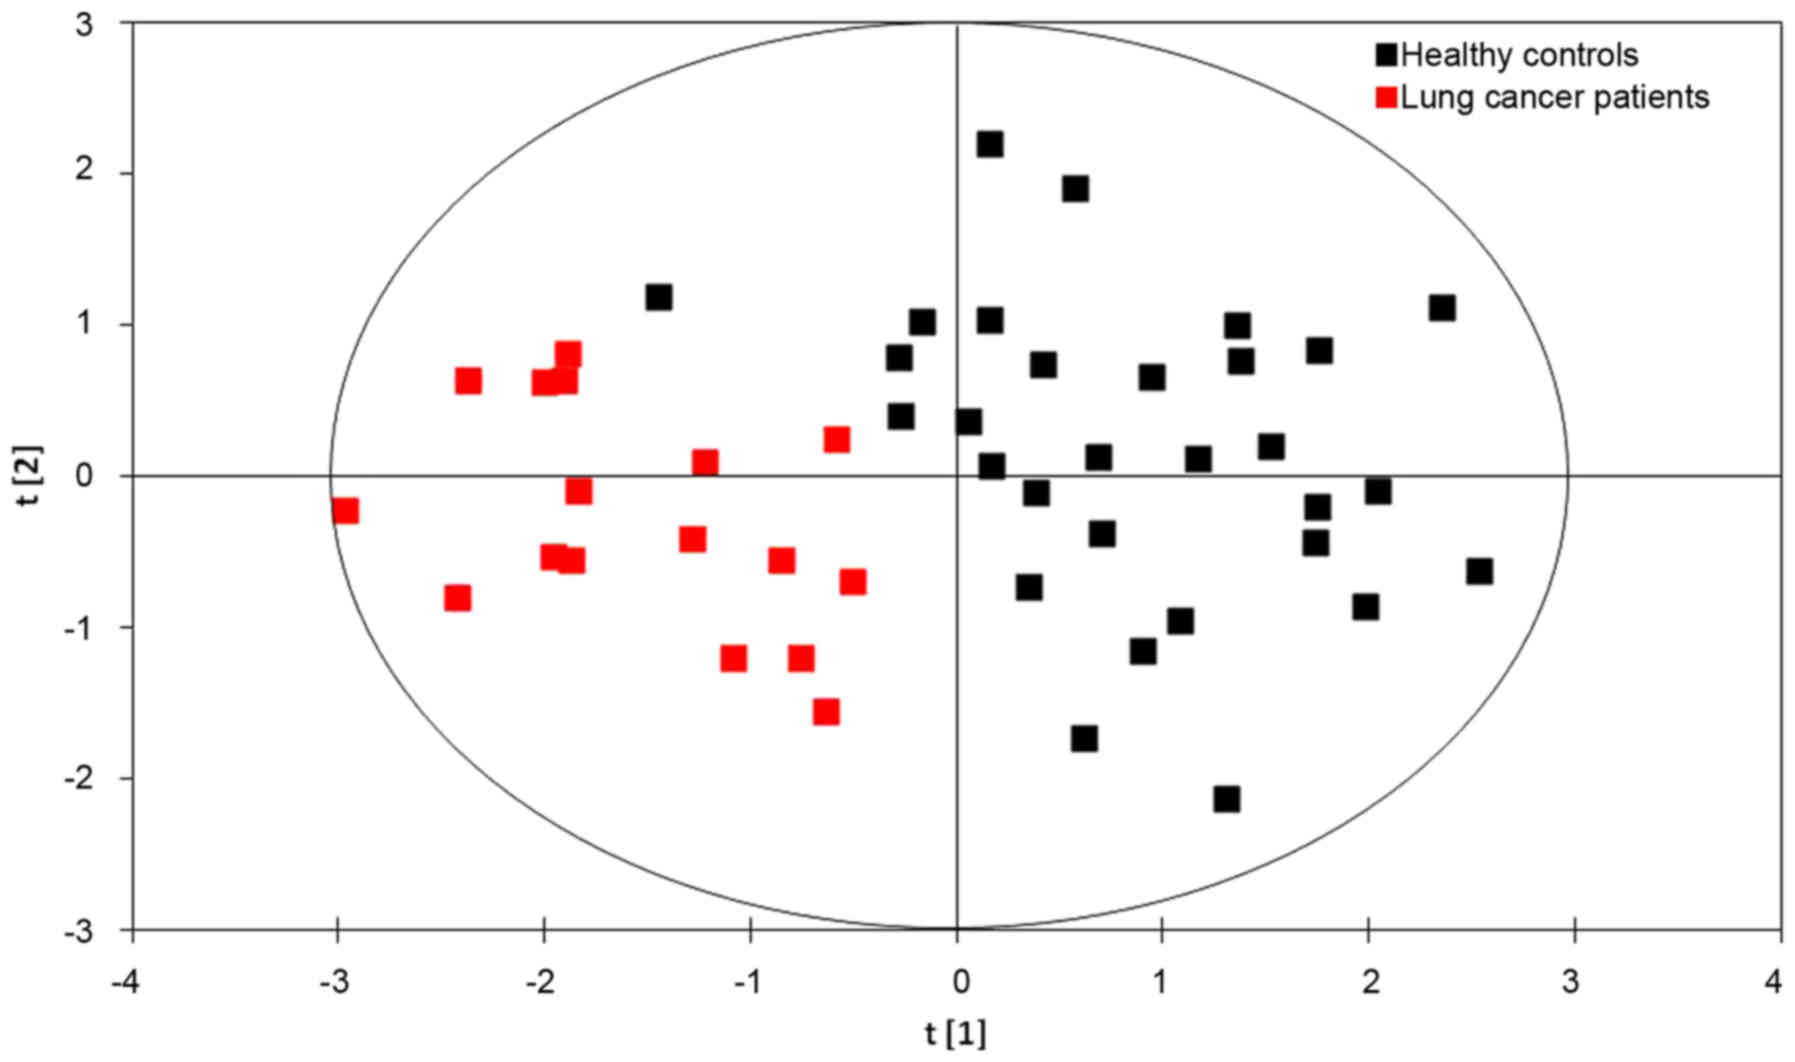
PLS-DA models
The results of the PLS-DA model using six
metabolites (glycine, valine, methionine, citrulline, arginine and
C16-carnitine) identified from the 2017 data set are presented in
Fig. 2. The first principal
component [t(1)], is a distinguishing parameter for lung cancer
based on the concentrations of the six metabolites. The formula of
the first principal component was as follows:
t[1]=0.2523× concentration (Gly) + 0.6087×
concentration (Val) + 0.6351× concentration (Met) + 0.0341×
concentration (Agr) + 0.3084× concentration (Cit) + 0.3033×
concentration (C16).
The formula represents the score of each lung cancer
patient or healthy control in the PLS-DA model. In the model, the
scores of the healthy controls were usually much lower compared
with that of lung cancer patients. The above concentrations in the
formula were referred to as the log10-transformed normalized
concentrations.
A substantial ability to distinguish the patients
with lung cancer from the healthy controls was observed with
R2=71.9% and Q2=66.2% (Fig. 2). The
results demonstrated that the PLS-DA model was effective for
identifying patients with lung cancer. Therefore, serum
concentrations of glycine, valine, methionine, citrulline, arginine
and C16-carnitine may be integrated into the current method for
screening for lung cancer.
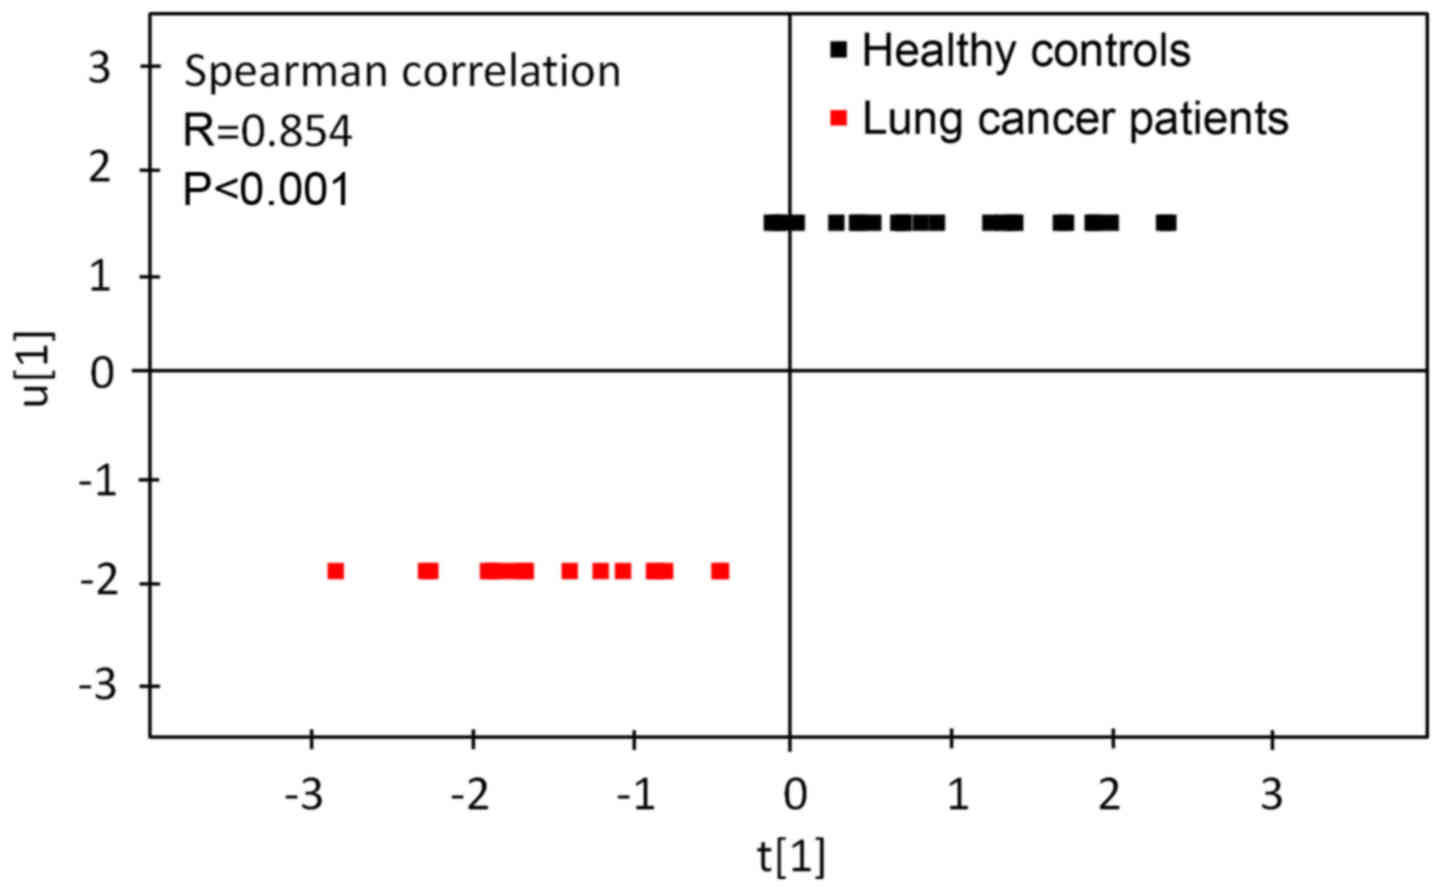
Verification for PLS-DA
Results of the Spearman's correlation analysis used
to assess the correlation between the first principal component
from the PLS-DA model and lung cancer are presented in Fig. 3. Spearman's correlation analysis
revealed that the first principal component from the PLS-DA model
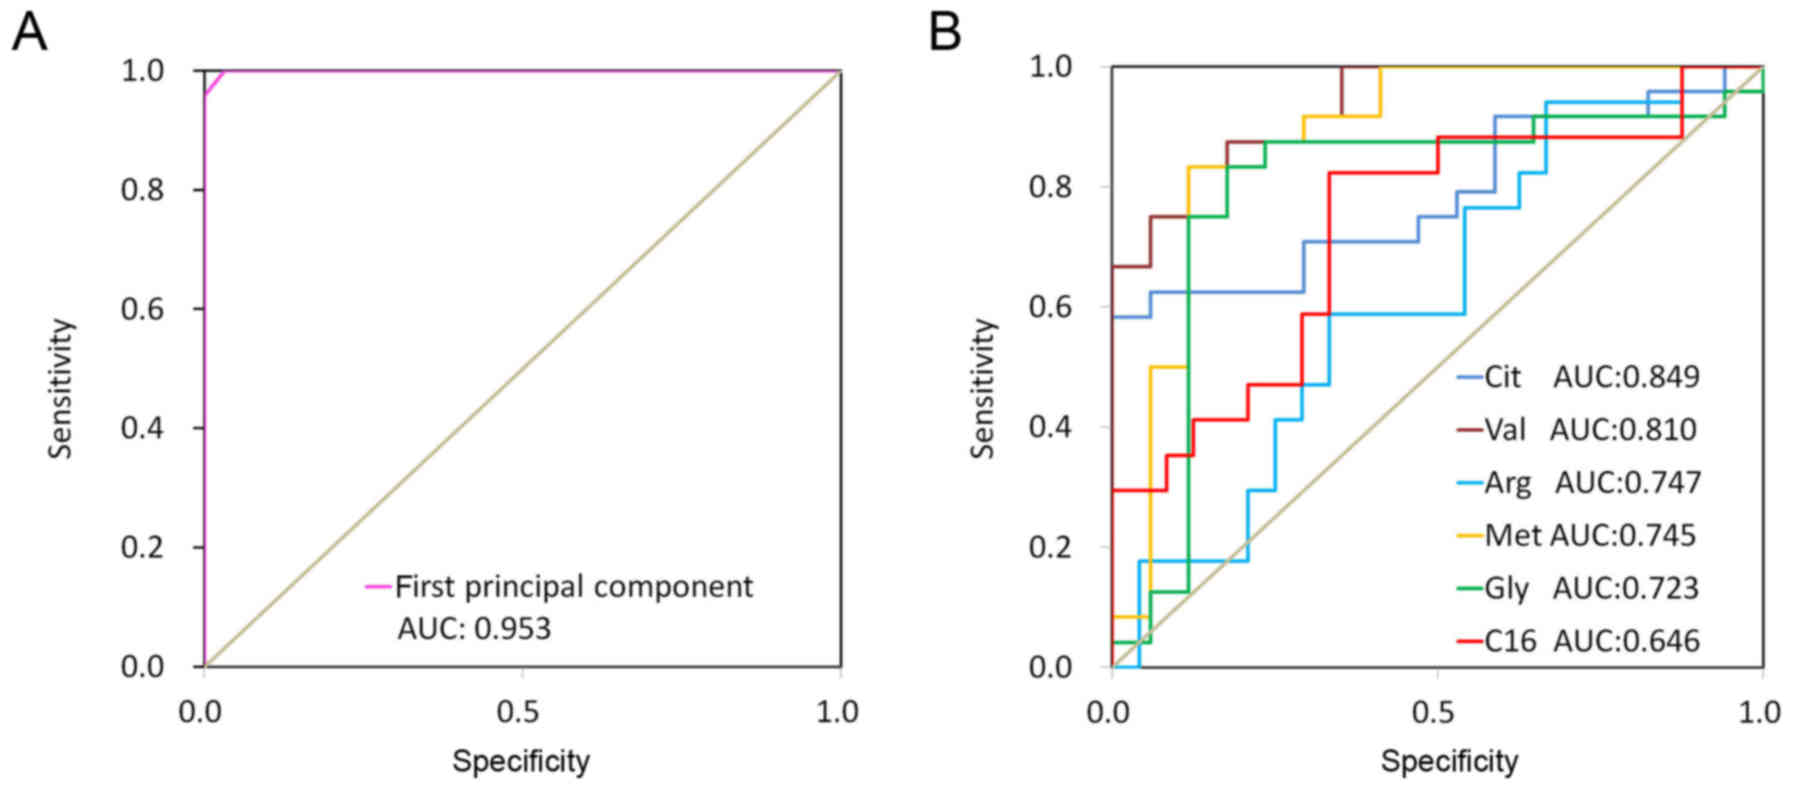
was significantly correlated with lung cancer. Fig. 4 revealed ROC curves for the first
principal component from the PLS-DA model and 6 discriminate
metabolites (glycine, valine, methionine, citrulline, arginine and
C16-carnitine). The ROC curve using first principal component
resulted in a high area under the curve (AUC) of 0.997, which was
substantially higher compared with those using a single metabolite
(citrulline, AUC=0.849; valine, AUC=0.810; arginine, AUC=0.747;
methionine, AUC=0.745; glycine, AUC=0.723; and C16-carnitine,
AUC=0.646). These results indicated that the first principal
component from the PLS-DA model demonstrated a strong ability to
distinguish lung cancer.
Physiological function analysis
Physiological functions of arginine (18–32),
glycine (33–41), methionine (42–48),
valine (49–51), citrulline (21,22) and
C16-carnitine (52–54) were summarized in Table VI. The discriminating metabolites
described in the table were essential for homeostasis, and the
physiological disorders that occurred due to the aforementioned
metabolites, including the over-biosynthesis of protein, DNA
damage, hypermethylation of DNA and fatty acids β-oxidation were
consistent with the tumor status. These results suggested that the
discriminating metabolites may be functional substances and
contribute to cancer initiation or progression.
| Table VI.Physiological Functions of
discriminate metabolites. |
Table VI.
Physiological Functions of
discriminate metabolites.
|
| Physiological
functions |
|
|---|
|
|
|
|
|---|
| Discriminate
metabolites | Targets | Function | Physiological state
in tumor |
|---|
| Arginine | Small molecule | Amino acid
metabolism (18–20), Trehalose degradation, urea cycle
(21,22) |
|
|
| Protein | Protein
biosynthesis (23–26) | Over biosynthesis
of protein (27,28) |
|
| DNA | DNA damage through
nitric oxide (NO) (29–30) | DNA damage
(31,32) |
| Glycine | Small molecule | Amino acid
metabolism (33,34) |
|
|
| Protein | Protein
biosynthesis (35,36) | Over biosynthesis
of protein (37) |
|
| DNA | Antioxidant damage
for DNA through uric acid | DNA damage
(38,39) |
| Methionine | Small molecule | Amino acid
metabolism (33), folate metabolism
(40,41), betaine metabolism, spermidine and
spermine biosynthesis, phosphatidylcholine biosynthesis (42–44) |
|
|
| Protein | Protein
biosynthesis (35,36), histone methylation | Over biosynthesis
of protein, Histone abnormal methylation (45–47) |
|
| DNA | DNA
methylation | DNA abnormal
methylation (45–48) |
| Valine | Small molecule | Amino acid
metabolism (49), propanoate
metabolism |
|
|
| Protein | Protein
biosynthesis (35,36) | Over biosynthesis
of protein (50,51) |
| Citrulline | Small molecule | Amino acid
metabolism, urea cycle (21,22) |
|
|
| Protein | Cyclic
citrullinated peptide synthesis |
|
| C16-carnitine | Small molecule | Fatty acids
β-oxidation (52) | Increased oxidation
(53,54) |
Discussion
To the best of our knowledge, the present study is
the first to build models for lung cancer screening using amino
acids and acylcarnitines. The PLS-DA models using glycine, valine,
methionine, citrulline, arginine and C16-carnitine exhibited a
positive ability to identify lung cancer, and may function as a
novel screening tool for lung cancer.
The serum concentrations of acylcarnitines from
patients with lung cancer were determined using a relative
quantitative method according to the peak areas, while any matrix
effects may have caused deviation. In the present study, a standard
curve with an isotope internal standard was performed to minimize
the matrix effect. The stability study demonstrated a strong
instability for glutamic acid and aspartic acid. The concentrations
of glutamic acid and aspartic acid were increased subsequent to
being stored at 4°C for 4 h due to the hydrolysis of glutamine and
asparagine under the catalysis of metabolic enzymes (15). As the concentrations of glutamic
acid, glutamine, aspartic acid and asparagine were not
significantly altered subsequent to being stored at 4°C for 72 h or
−80°C for 3 months, the total concentration of glutamic acid +
glutamine or aspartic acid + asparagine was calculated as one
variable. To reduce the analytical bias caused by sample
instability, the sample preparation and preservation were performed
under strictly controlled conditions. All serum samples were
prepared within 48 h of blood collection, and analyzed within 3
months.
Four metabolites (glycine, valine, methionine and
citrulline) were demonstrated to be significantly decreased in the
serum of patients with lung cancer compared with the healthy
controls in the present study. Glycine, valine and methionine are
considered to be important amino acids for protein biosynthesis
(35,36), and are required in the development of
primary tumor types (37,50,51).
Decreased serum levels of these metabolites may be associated with
the increased uptake of circulating glycine, valine, methionine and
citrulline for the rapid biosynthesis of proteins (37,50,51).
Glycine is a precursor for the formation of purine (55). Uric acid, a potent antioxidant in
plasma (55), is a breakdown product
of purine nucleotides. Therefore, the levels of uric acid present
in serum are associated with the levels of glycine present. The
decreased levels of glycine and uric acid may result in oxidative
stress, which in turn induce oxidative damage for DNA (56) and initiate carcinogenesis. On the
other hand, glycine is a crucial substrate of the deoxycholic acid
glycine conjugate, which is a secondary bile acid functioning as a
detergent to solubilize fats for absorption (15). The decreased levels of glycine may
represent a digestive system disorder, which is a common symptom
observed among patients with cancer (15).
Abnormal DNA methylation is a hallmark of lung
cancer cells (57). Methionine may
affect DNA methylation by regulating the levels of
S-adenosyl-L-methionine, a methyl group donor, in addition to
S-adenosyl-L-homocysteine, an inhibitor of enzymes catalyzing the
DNA methylation reaction (46). The
abnormal DNA methylation reaction may be associated with the
decreased level of methionine. Citrulline is a key substance for
citrullinated proteins, which may cause rheumatoid arthritis
(58). Although the association
between citrulline and cancer has yet to be well established, it
may be inferred that rheumatoid arthritis is associated with cancer
pathogenesis. Increased levels of arginine and C16-carnitine were
observed in the serum of patients with lung cancer compared with
the controls in the present study. Arginine is involved in the
metabolism of nitric oxide (NO), a type of vasodilator and free
radical that participates in the inflammatory process and
carcinogenesis through nitro-oxidative stress, apoptosis, cell
cycle, angiogenesis, invasion and metastasis (59). Increased arginine levels have been
assumed to be the cause of increased NO (31). Therefore, arginine deprivation may
offer a potential treatment method for lung cancer. Wheatley
(28) demonstrated that cancer may
be controlled by restricting arginine availability through
inhibiting arginine-catabolizing enzymes, which function as
anticancer agents. C16-carnitine may regulate β-oxidation, which
was abnormally increased in non-small cell lung cancer (53). The increased β-oxidation may be
associated with the high levels of C16-carnitine. Therefore,
reducing C16-carnitine concentration may be a novel approach to
cancer therapy (54). Limitations of
the present study include a small sample size. Notable results were
produced despite using a small sample size. However, replication is
required in larger studies to confirm the present results. The
other limitations were a lack of detailed demographic
characteristics for the 2015 data set, and that the majority of
patients in the 2017 cohort had advanced cancer. In further
studies, lung cancer patients at early stages will be recruited to
validate the model.
The present study is, to the best of our knowledge,
the first to target the approach of metabolomics for serum amino
acids and acylcarnitines in patients with lung cancer. The present
research provides supporting evidence that six metabolites
(glycine, valine, methionine, citrulline, arginine and
C16-carnitine) may be considered to be valuable biomarkers for lung
cancer. The PLS-DA model using glycine, valine, methionine,
citrulline, arginine and C16-carnitine exhibited a strong ability
to distinguish patients with lung cancer from healthy controls. The
aforementioned six metabolites may be considered to be important
functional substances involved in the pathogenesis of lung cancer.
In summary, these six metabolites are effective in differentiating
patients with lung cancer from healthy controls, and the PLS-DA
model using glycine, valine, methionine, citrulline, arginine and
C16-carnitine may become a novel screening tool for lung
cancer.
Acknowledgements
Not applicable.
Funding
No funding received.
Availability of data and materials
The data sets used and/or analyzed during the
present study are available from the corresponding author on
reasonable request.
Authors' contributions
JN drafted the manuscript. JN and LW contributed to
the conception and design of the study. JN and LX performed the
experiments and analyzed the data. WL and CZ contributed to the
analysis of clinical information. All authors read and approved the
final manuscript.
Ethics approval and consent to
participate
The Regional Committee for Medical and Health
Research Ethics approved the study protocol, and all patients
provided written informed consent for participation in the study.
All procedures performed in the present study involving human
participants were in accordance with 1964 Helsinki declaration and
its later amendments, or comparable ethical standards.
Patient consent for publication
Not applicable.
Competing interests
The authors declare that they have no competing
interests.
References
|
1
|
Vachani A, Sequist LV and Spira A: AJRCCM:
100-year anniversary. The shifting landscape for lung cancer: Past,
present, and future. Am J Resp Crit Care. 195:1150–1160. 2017.
View Article : Google Scholar
|
|
2
|
An Z, Chen Y, Zhang R, Song Y, Sun J, He
J, Bai J, Dong L, Zhan Q and Abliz Z: Integrated ionization
approach for RRLC-MS/MS-based metabonomics: Finding potential
biomarkers for lung cancer. J Proteome Res. 9:4071–4081. 2010.
View Article : Google Scholar : PubMed/NCBI
|
|
3
|
Beger RD: A review of applications of
metabolomics in cancer. Metabolites. 3:552–574. 2013. View Article : Google Scholar : PubMed/NCBI
|
|
4
|
Deberardinis RJ and Thompson CB: Cellular
metabolism and disease: What do metabolic outliers teach us? Cell.
148:1132–1144. 2012. View Article : Google Scholar : PubMed/NCBI
|
|
5
|
Lin HM, Barnett MP, Roy NC, Joyce NI, Zhu
S, Armstrong K, Helsby NA, Ferguson LR and Rowan DD: Metabolomic
analysis identifies inflammatory and noninflammatory metabolic
effects of genetic modification in a mouse model of Crohn's
disease. J Proteome Res. 9:1965–1975. 2010. View Article : Google Scholar : PubMed/NCBI
|
|
6
|
Dutta M, Joshi M, Srivastava S, Lodh I,
Chakravarty B and Chaudhury K: A metabonomics approach as a means
for identification of potential biomarkers for early diagnosis of
endometriosis. Mol Biosyst. 8:3281–3287. 2012. View Article : Google Scholar : PubMed/NCBI
|
|
7
|
Xu J, Chen Y, Zhang R, Song Y, Cao J, Bi
N, Wang J, He J, Bai J, Dong L, et al: Global and targeted
metabolomics of esophageal squamous cell carcinoma discovers
potential diagnostic and therapeutic biomarkers. Mol Cell
Proteomics. 12:1306–1318. 2013. View Article : Google Scholar : PubMed/NCBI
|
|
8
|
Cascino A, Muscaritoli M, Cangiano C,
Conversano L, Laviano A, Ariemma S, Meguid MM and Rossi Fanelli F:
Plasma amino acid imbalance in patients with lung and breast
cancer. Anticancer Res. 15:507–510. 1995.PubMed/NCBI
|
|
9
|
Kubota A, Meguid MM and Hitch DC: Amino
acid profiles correlate diagnostically with organ site in three
kinds of malignant tumors. Cancer. 69:2343–2348. 1992. View Article : Google Scholar : PubMed/NCBI
|
|
10
|
Lai HS, Lee JC, Lee PH, Wang ST and Chen
WJ: Plasma free amino acid profile in cancer patients. Semin Cancer
Biol. 15:267–276. 2005. View Article : Google Scholar : PubMed/NCBI
|
|
11
|
Maeda J, Higashiyama M, Imaizumi A,
Nakayama T, Yamamoto H, Daimon T, Yamakado M, Imamura F and Kodama
K: Possibility of multivariate function composed of plasma amino
acid profiles as a novel screening index for non-small cell lung
cancer: A case control study. BMC Cancer. 10:6902010. View Article : Google Scholar : PubMed/NCBI
|
|
12
|
Rocha CM, Carrola J, Barros AS, Gil AM,
Goodfellow BJ, Carreira IM, Bernardo J, Gomes A, Sousa V, Carvalho
L and Duarte IF: Metabolic signatures of lung cancer in biofluids:
NMR-based metabonomics of blood plasma. J Proteome Res.
10:4314–4324. 2011. View Article : Google Scholar : PubMed/NCBI
|
|
13
|
Miyamoto S, Taylor SL, Barupal DK, Taguchi
A, Wohlgemuth G, Wikoff WR, Yoneda KY, Gandara DR, Hanash SM, Kim K
and Fiehn O: Systemic metabolomic changes in blood samples of lung
cancer patients identified by gas chromatography time-of-flight
mass spectrometry. Metabolites. 5:192–210. 2015. View Article : Google Scholar : PubMed/NCBI
|
|
14
|
Wen T, Gao L, Wen Z, Wu C, Tan CS, Toh WZ
and Ong CN: Exploratory investigation of plasma metabolomics in
human lung adenocarcinoma. Mol Biosyst. 9:2370–2378. 2013.
View Article : Google Scholar : PubMed/NCBI
|
|
15
|
Miyagi Y, Higashiyama M, Gochi A, Akaike
M, Ishikawa T, Miura T, Saruki N, Bando E, Kimura H, Imamura F, et
al: Plasma free amino acid profiling of five types of cancer
patients and its application for early detection. PLoS One.
6:e241432011. View Article : Google Scholar : PubMed/NCBI
|
|
16
|
Zhao Q, Cao Y, Wang Y, Hu C, Hu A, Ruan L,
Bo Q, Liu Q, Chen W, Tao F, et al: Plasma and tissue free amino
acid profiles and their concentration correlation in patients with
lung cancer. Asia Pac J Clin Nutr. 23:429–436. 2014.PubMed/NCBI
|
|
17
|
Ni J, Xu L, Li W and Wu L: Simultaneous
determination of thirteen kinds of amino acid and eight kinds of
acylcarnitine in human serum by LC-MS/MS and its application to
measure the serum concentration of lung cancer patients. Biomed
Chromatog. 30:1796–1806. 2016. View
Article : Google Scholar
|
|
18
|
Haake P and Allen GW: Studies on
phosphorylation by phosphoroguanidinates. The mechanism of action
of creatine: ATP transphosphorylase (creatine kinase). Proc Natl
Acad Sci USA. 68:2691–2693. 1971. View Article : Google Scholar : PubMed/NCBI
|
|
19
|
Kurihara S, Oda S, Kumagai H and Suzuki H:
Gamma-glutamyl-gamma-aminobutyrate hydrolase in the putrescine
utilization pathway of Escherichia coli K-12. FEMS Microbiol Lett.
256:318–323. 2006. View Article : Google Scholar : PubMed/NCBI
|
|
20
|
Kurihara S, Oda S, Kato K, Kim HG,
Koyanagi T, Kumagai H and Suzuki H: A novel putrescine utilization
pathway involves gamma-glutamylated intermediates of Escherichia
coli K-12. J Biol Chem. 280:4602–4608. 2005. View Article : Google Scholar : PubMed/NCBI
|
|
21
|
Lehninger AL: SMPDB: Lehninger principles
of biochemistry. 4th. New York: WH Freeman; 2005
|
|
22
|
Salway JG: Metabolism at a glance. 3rd
edition. Blackwell Pub; Alden, MA: 2004
|
|
23
|
Dalbey RE and Robinson C: Protein
translocation into and across the bacterial plasma membrane and the
plant thylakoid membrane. Trends Biochem Sci. 24:17–22. 1999.
View Article : Google Scholar : PubMed/NCBI
|
|
24
|
Berks BC, Sargent F and Palmer T: The Tat
protein export pathway. Mol Microbiol. 35:260–274. 2000. View Article : Google Scholar : PubMed/NCBI
|
|
25
|
Wexler M, Sargent F, Jack RL, Stanley NR,
Bogsch EG, Robinson C, Berks BC and Palmer T: TatD is a cytoplasmic
protein with DNase activity. No requirement for TatD family
proteins in sec-independent protein export. J Biol Chem.
275:16717–16722. 2000. View Article : Google Scholar : PubMed/NCBI
|
|
26
|
Jongbloed JD, Martin U, Antelmann H,
Hecker M, Tjalsma H, Venema G, Bron S, van Dijl JM and Müller J:
TatC is a specificity determinant for protein secretion via the
twin-arginine translocation pathway. J Biol Chem. 275:41350–41357.
2000. View Article : Google Scholar : PubMed/NCBI
|
|
27
|
Marini JC and Didelija IC: Arginine
depletion by arginine deiminase does not affect whole protein
metabolism or muscle fractional protein synthesis rate in mice.
PLoS One. 10:e01198012015. View Article : Google Scholar : PubMed/NCBI
|
|
28
|
Wheatley DN: Controlling cancer by
restricting arginine availability-arginine-catabolizing enzymes as
anticancer agents. Anticancer Drugs. 15:825–833. 2004. View Article : Google Scholar : PubMed/NCBI
|
|
29
|
Zhang B, Bailey WM, Kopper TJ, Orr MB,
Feola DJ and Gensel JC: Azithromycin drives alternative macrophage
activation and improves recovery and tissue sparing in contusion
spinal cord injury. J Neuroinflammation. 12:2182015. View Article : Google Scholar : PubMed/NCBI
|
|
30
|
Katusic ZS: Role of nitric oxide signal
transduction pathway in regulation of vascular tone. Int Angiol.
11:14–19. 1992.PubMed/NCBI
|
|
31
|
Grimm EA, Sikora AG and Ekmekcioglu S:
Molecular pathways: Inflammation-associated nitric-oxide production
as a cancer-supporting redox mechanism and a potential therapeutic
target. Clin Cancer Res. 19:5557–5563. 2013. View Article : Google Scholar : PubMed/NCBI
|
|
32
|
Morbidelli L, Donnini S and Ziche M: Role
of nitric oxide in tumor angiogenesis. Cancer Treat Res.
117:155–167. 2004. View Article : Google Scholar : PubMed/NCBI
|
|
33
|
Rees WD and Hay SM: The biosynthesis of
threonine by mammalian cells: Expression of a complete bacterial
biosynthetic pathway in an animal cell. Biochem J. 309:999–1007.
1995. View Article : Google Scholar : PubMed/NCBI
|
|
34
|
Jacques SL, Nieman C, Bareich D, Broadhead
G, Kinach R, Honek JF and Wright GD: Characterization of yeast
homoserine dehydrogenase, an antifungal target: The invariant
histidine 309 is important for enzyme integrity. Biochim Biophys
Acta. 1544:28–41. 2001. View Article : Google Scholar : PubMed/NCBI
|
|
35
|
Bröer S: Amino acid transport across
mammalian intestinal and renal epithelia. Physiol Rev. 88:249–286.
2008. View Article : Google Scholar : PubMed/NCBI
|
|
36
|
Bröer S; Apical transporters for neutral
amino acids, : Physiology and pathophysiology. Physiology
(Bethesda). 23:95–103. 2008.PubMed/NCBI
|
|
37
|
Hayden MR and Tyagi SC: Uric acid: A new
look at an old risk marker for cardiovascular disease, metabolic
syndrome, and type 2 diabetes mellitus: The urate redox shuttle.
Nutr Metab (Lond). 1:102004. View Article : Google Scholar : PubMed/NCBI
|
|
38
|
Itahana Y, Han R, Barbier S, Lei Z, Rozen
S and Itahana K: The uric acid transporter SLC2A9 is a direct
target gene of the tumor suppressor p53 contributing to antioxidant
defense. Oncogene. 34:1799–1810. 2015. View Article : Google Scholar : PubMed/NCBI
|
|
39
|
Dziaman T, Banaszkiewicz Z, Roszkowski K,
Gackowski D, Wisniewska E, Rozalski R, Foksinski M, Siomek A,
Speina E, Winczura A, et al: 8-Oxo-7,8-dihydroguanine and uric acid
as efficient predictors of survival in colon cancer patients. Int J
Cancer. 134:376–383. 2014. View Article : Google Scholar : PubMed/NCBI
|
|
40
|
Walling J: From methotrexate to pemetrexed
and beyond. A review of the pharmacodynamic and clinical properties
of antifolates. Invest New Drugs. 24:37–77. 2006. View Article : Google Scholar : PubMed/NCBI
|
|
41
|
Desmoulin SK, Hou Z, Gangjee A and
Matherly LH: The human proton-coupled folate transporter: Biology
and therapeutic applications to cancer. Cancer Biol Ther.
13:1355–1373. 2012. View Article : Google Scholar : PubMed/NCBI
|
|
42
|
Gallego-Ortega D, Ramirez de Molina A,
Ramos MA, Valdes-Mora F, Barderas MG, Sarmentero-Estrada J and
Lacal JC: Differential role of human choline kinase alpha and beta
enzymes in lipid metabolism: Implications in cancer onset and
treatment. PLoS One. 4:e78192009. View Article : Google Scholar : PubMed/NCBI
|
|
43
|
Alatorre-Cobos F, Cruz-Ramirez A, Hayden
CA, Pérez-Torres CA, Chauvin AL, Ibarra-Laclette E, Alva-Cortés E,
Jorgensen RA and Herrera-Estrella L: Translational regulation of
Arabidopsis XIPOTL1 is modulated by phosphocholine levels via the
phylogenetically conserved upstream open reading frame 30. J Exp
Bot. 63:5203–5221. 2012. View Article : Google Scholar : PubMed/NCBI
|
|
44
|
Henneberry AL, Wistow G and McMaster CR:
Cloning, genomic organization, and characterization of a human
cholinephosphotransferase. J Biol Chem. 275:29808–29815. 2000.
View Article : Google Scholar : PubMed/NCBI
|
|
45
|
Cellarier E, Durando X, Vasson MP, Farges
MC, Demiden A, Maurizis JC, Madelmont JC and Chollet P: Methionine
dependency and cancer treatment. Cancer Treat Rev. 29:489–499.
2003. View Article : Google Scholar : PubMed/NCBI
|
|
46
|
Stefanska B, Karlic H, Varga F,
Fabianowska-Majewska K and Haslberger A: Epigenetic mechanisms in
anti-cancer actions of bioactive food components-the implications
in cancer prevention. Br J Pharmacol. 167:279–297. 2012. View Article : Google Scholar : PubMed/NCBI
|
|
47
|
Guo HY, Herrera H, Groce A and Hoffman RM:
Expression of the biochemical defect of methionine depend in fresh
patient tumors in primary histoculture. Cancer Res. 53:2479–2483.
1993.PubMed/NCBI
|
|
48
|
Warnecke PM and Bestor TH: Cytosine
methylation and human cancer. Curr Opin Oncol. 12:68–73. 2000.
View Article : Google Scholar : PubMed/NCBI
|
|
49
|
Xu H, Zhang Y, Guo X, Ren S, Staempfli AA,
Chiao J, Jiang W and Zhao G: Isoleucine biosynthesis in Leptospira
interrogans serotype lai strain 56601 proceeds via a
threonine-independent pathway. J Bacteriol. 186:5400–5409. 2004.
View Article : Google Scholar : PubMed/NCBI
|
|
50
|
Komatsu H, Nishihira T, Chin M, Doi H,
Shineha R, Mori S and Satomi S: Effects of caloric intake on
anticancer therapy in rats with valine depleted amino acid
imbalance. Nutr Cancer. 28:107–112. 1997. View Article : Google Scholar : PubMed/NCBI
|
|
51
|
Zhang N, Li K, Sun X, Shou N and Jiang X:
Metabolism change of gastric cancer in L-leucine/L-valine
imbalance. Chin J Curr Adv Gen Surg. 4:148–151. 2001.
|
|
52
|
Parekh VR, Traxler RW and Sobek JM:
N-Alkane oxidation enzymes of a pseudomonad. Appl Environ
Microbiol. 33:881–884. 1977.PubMed/NCBI
|
|
53
|
Harris FT, Rahman SM, Hassanein M, Qian J,
Hoeksema MD, Chen H, Eisenberg R, Chaurand P, Caprioli RM, Shiota M
and Massion PP: Acyl-coenzyme A-binding protein regulates
beta-oxidation required for growth and survival of non-small cell
lung cancer. Cancer Prev Res (Phila). 7:748–757. 2014. View Article : Google Scholar : PubMed/NCBI
|
|
54
|
Ganti S, Taylor SL, Kim K, Hoppel CL, Guo
L, Yang J, Evans C and Weiss RH: Urinary acylcarnitines are altered
in human kidney cancer. Int J Cancer. 130:2791–2800. 2012.
View Article : Google Scholar : PubMed/NCBI
|
|
55
|
Ohshima H and Bartsch H: Chronic
infections and inflammatory processes as cancer risk factors:
Possible role of nitric oxide in carcinogenesis. Mutat Res.
305:253–264. 1994. View Article : Google Scholar : PubMed/NCBI
|
|
56
|
Ding Y, Wang H, Niu J, Luo M, Gou Y, Miao
L, Zou Z and Cheng Y: Induction of ROS overload by alantolactone
prompts oxidative DNA damage and apoptosis in colorectal cancer
cells. Int J Mol Sci. 17:5582016. View Article : Google Scholar : PubMed/NCBI
|
|
57
|
Greenberg AK, Rimal B, Felner K, Zafar S,
Hung J, Eylers E, Phalan B, Zhang M, Goldberg JD, Crawford B, et
al: S-adenosylmethionine as a biomarker for the early detection of
lung cancer. Chest. 132:1247–1252. 2007. View Article : Google Scholar : PubMed/NCBI
|
|
58
|
Sakkas LI, Bogdanos DP, Katsiari C and
Platsoucas CD: Anti-citrullinated peptides as autoantigens in
rheumatoid arthritis-relevance to treatment. Autoimmun Rev.
13:1114–1120. 2014. View Article : Google Scholar : PubMed/NCBI
|
|
59
|
Yang GY, Taboada S and Liao J: Induced
nitric oxide synthase as a major player in the oncogenic
transformation of inflamed tissue. Methods Mol Biol. 512:119–156.
2009. View Article : Google Scholar : PubMed/NCBI
|