Introduction
Hematopoietic stem cells (HSCs) are a specific type
of cell with multi-potency and self-renewal ability (1). It has been demonstrated that bone
marrow-reconstituting HSCs reside within a subpopulation of bone
marrow or blood-derived mononuclear cells of a few percents which
express the surface antigen CD34 (2). CD34 and CD38 surface antigens have long
been used as surface molecules for the identification of primitive
hematopoietic stem and progenitor cells. It has been reported that
Severe combined immunodeficient-repopulating cells were present
exclusively in the CD34+CD38− cell fraction
(3,4). Under the same conditions, recipients of
cord blood (CB) transplants experience a lower incidence of acute
and chronic graft-vs.-host disease than recipients of bone marrow
transplants (5). However, widespread
utilization of CB is limited by the relatively low number of HSCs
per unit, and most CB units provide insufficient stem cells for
adults (6). Multiple strategies for
overcoming these limitations are now being investigated. One
important strategy involves ex vivo expansion of the
umbilical CB unit prior to transplantation (7). However, the selection of the best
source of HSCs remains the first and most important challenge.
To date, the nucleated cell dose has been used to
select more suitable CB units for transplantation for a given
patient. However, Aroviita et al (8) reported that female infants have higher
median nucleated cell concentrations than male infants (13.9 vs.
13.3×10⁹/l) after investigating 1,999 units of CB. By
contrast, male infants had significantly higher median
CD34+ cell concentrations than female infants (31.8 vs.
30.2/µl), even after correcting for birth weight. Bijou et
al (9) also reported that male
neonatal CB was significantly richer in CD34+ cells than
female CB. From the above studies, it may be speculated that a
correlation exists between neonatal gender and HSCs derived from
CB. Therefore, in the present study, differences in the expansion
of CD34+ cells from male and female neonatal CB and
their gene expression were compared, and the underlying molecular
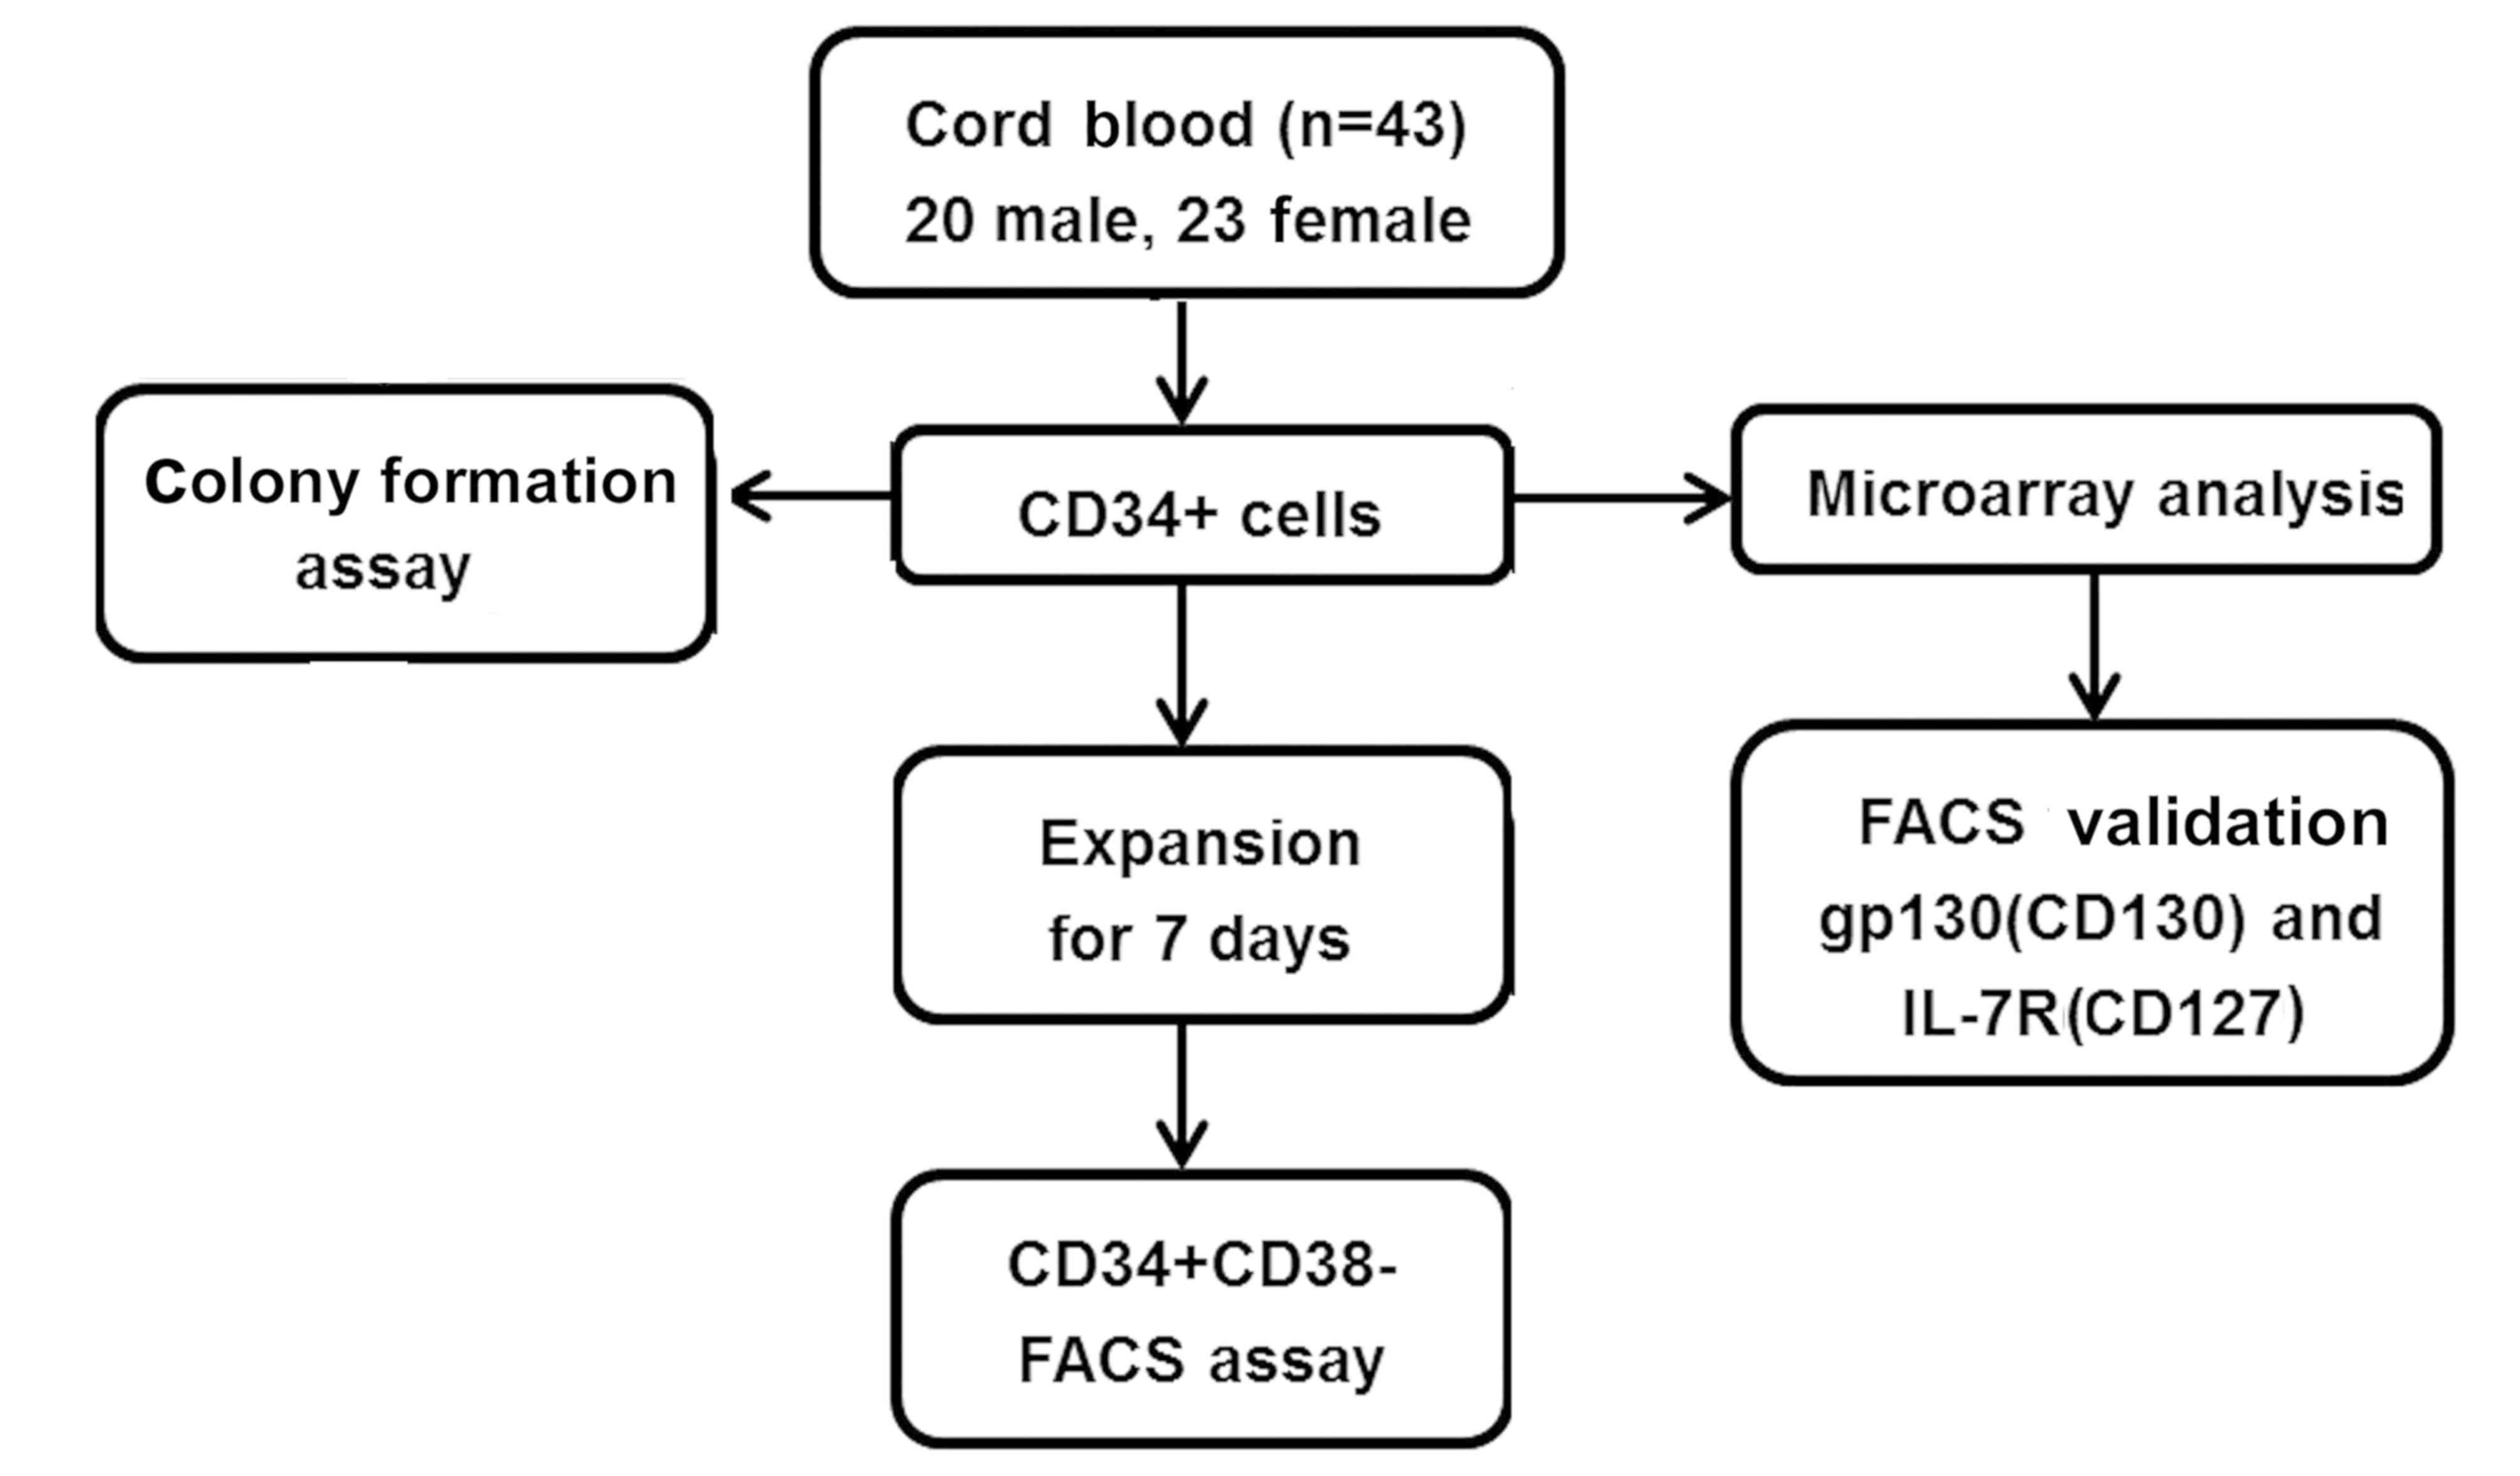
mechanisms were explored. The detailed experimental design of the
study is provided in the flow chart in Fig. 1.
Materials and methods
Collection and purification of CB
CD34+ cells
Human CB samples (n=43; 20 males and 23 females)
were obtained from mothers undergoing full-term deliveries between
January and May 2015 at the Department of Obstetrics at Qilu
Hospital of Shandong University (Jinan, China) after informed
written consent was obtained. The maternal age was between 20 and
40 years (mean, 26±2 years), and there was no history of acute,
chronic or infectious disease, neonatal apnea, edema or jaundice.
The use of CB was approved by the Ethics Committee of Shandong
University Qilu Hospital (Jinan, China). The birth weight was
3,000-4,000 g for the males and females considered for inclusion.
Among the CB units harvested, only those in which at least 70 ml CB
was collected and the total nucleated cell count exceeded
8×10⁸ per unit were considered for processing.
Mononuclear cells (MNCs) of each single CB unit were
separated using Ficollpaque medium (density, 1.077±0.001 g/ml;
HaoYang Co.) and centrifuged at 1,726 × g at 12°C for 25 min. CB
MNCs were incubated with 100 µl CD34+ micro beads
(Miltenyi Biotec GmbH) at 4°C for 30 min. Cells were subsequently
passed through an LS MACS column (Miltenyi Biotec GmbH) and
enriched CD34+ cells were collected by flushing the
column. Cells were subsequently suspended in 0.1 M PBS (pH 7.4).
The purity of the CD34+ cells was detected by a
fluorescence-assisted cell sorting (FACS) system (Guava easyCyte
6HT; EMD Millipore) and data were analyzed using Guava Incyte
(version 2. 8; EMD Millipore).
CB CD34+ colony formation
assay
CB CD34+ cells derived from male and
female newborns were divided into two groups. CD34+
cells were seeded into 24-well plates for culture with semisolid
medium (MethoCult GF H4434; Stem Cell Technologies) at a density of
1.0×10⁴ cells/well according to the manufacturer's
protocols. Cultures were maintained at 37°C in a humidified
atmosphere of 5% CO2 and 20% O2 (HF240; Heal
Force Tris-gas Incubator; Heal Force). After 2 weeks of culture,
the numbers CFUs were determined under an inverted microscope
(IX71; Olympus).
Amplification of CD34+
cells
CB CD34+ cells from CB from neonates of
different gender were cultured in HSC expansion medium (Stem Cell
Technologies, Inc.) containing 10% FBS (Gibco; Thermo Fisher
Scientific, Inc.), 70 ng/ml stem cell factor, 30 ng/ml interleukin
(IL)-3, 30 ng/ml FMS-like tyrosine kinase 3 ligand, 20 ng/ml IL-6,
20 ng/ml bone morphogenetic protein-2 and 20 ng/ml thrombopoietin
at 1.1×10⁵ cells/ml (R&D Systems, Inc.). Cytokine
concentrations were determined as described previously (10,11). The
medium was changed every 3–4 days. On day 7, the total suspension
of cells was harvested for further analysis.
Immunophenotypic analysis
On days 0 and 7, cells were suspended in 100 µl PBS
containing FITC-conjugated anti-CD34 (1:10; cat. no. 343604;
BioLegend) and phycoerythrin (PE)-conjugated anti-CD38 (1:10; cat.
no. 560981; BD Biosciences) for 30 min at 4°C, and were then washed
with PBS. Cells were analyzed using Guava Incyte, as outlined
above.
Microarray-based gene expression
analysis
Total RNA was extracted from purified and untreated
CD34+ cells from male and female UCB samples using
TRIzol (Ambion; Thermo Fisher Scientific, Inc.) according to the
manufacturer's protocols. Agilent Whole Genome Oligo Microarrays
(one-color; Agilent Technologies, Inc.) were used to analyze the
samples. The RNA was hybridized to the microarray, which was washed
and scanned. Finally, the data were extracted using Agilent Feature
Extraction Software (version 11.0.1.1; Agilent Technologies, Inc.).
Affymetrix GeneChip Human Genome U133 Plus 2.0 was used on an
Affymetrix 3000 instrument (fluidics station and scanner; Thermo
Fisher Scientific, Inc.) running Gene-Chip operating software
(version 11.0; Gene Spring Software; Agilent Technologies, Inc.) to
generate gene expression data. Through the Gene Ontology (GO;
www.geneontology.gov) function and Kyoto
Encyclopedia of Genes and Genomes (KEGG; www.genome.jp/kegg/pathway.html) pathway enrichment
analysis, significantly enriched pathways associated with
hematopoietic cell proliferation were identified in differentially
expressed genes (DEGs) with a fold change ≥two.
FACS validation of microarray
expression data
CB samples (100 µl) from males and females were
added to 2 ml red blood cell lysis buffer (BD Biosciences),
followed by incubation for 15 min at room temperature as
recommended by the manufacturer. Subsequently, samples were
centrifuged at 300 × g for 5 min at room temperature and
re-suspended in 100 µl PBS. Cells (1×10⁶) were stained
with FITC-conjugated anti-human CD34 10 µl (1:10; cat. no. 343604;
BioLegend) and PE-conjugated anti-human CD127 (1:10; cat. no.
557938; BD Biosciences) or PE-conjugated anti-human CD130 (1:10;
cat. no. 555757; BD Biosciences) for 15 min at room temperature,
according to the manufacturer's protocol. Analyses were performed
with Guava Incyte, as described above.
Statistical analysis
The data were analyzed using SPSS software (version
17.0; SPSS Inc.). Quantitative values are expressed as the mean ±
standard deviation unless otherwise specified. One-way analysis of
variance with Fisher's protected least-significant differences test
as a post-hoc analysis was used for multi-group comparisons.
P<0.05 was considered to indicate a statistically significant
difference.
Results
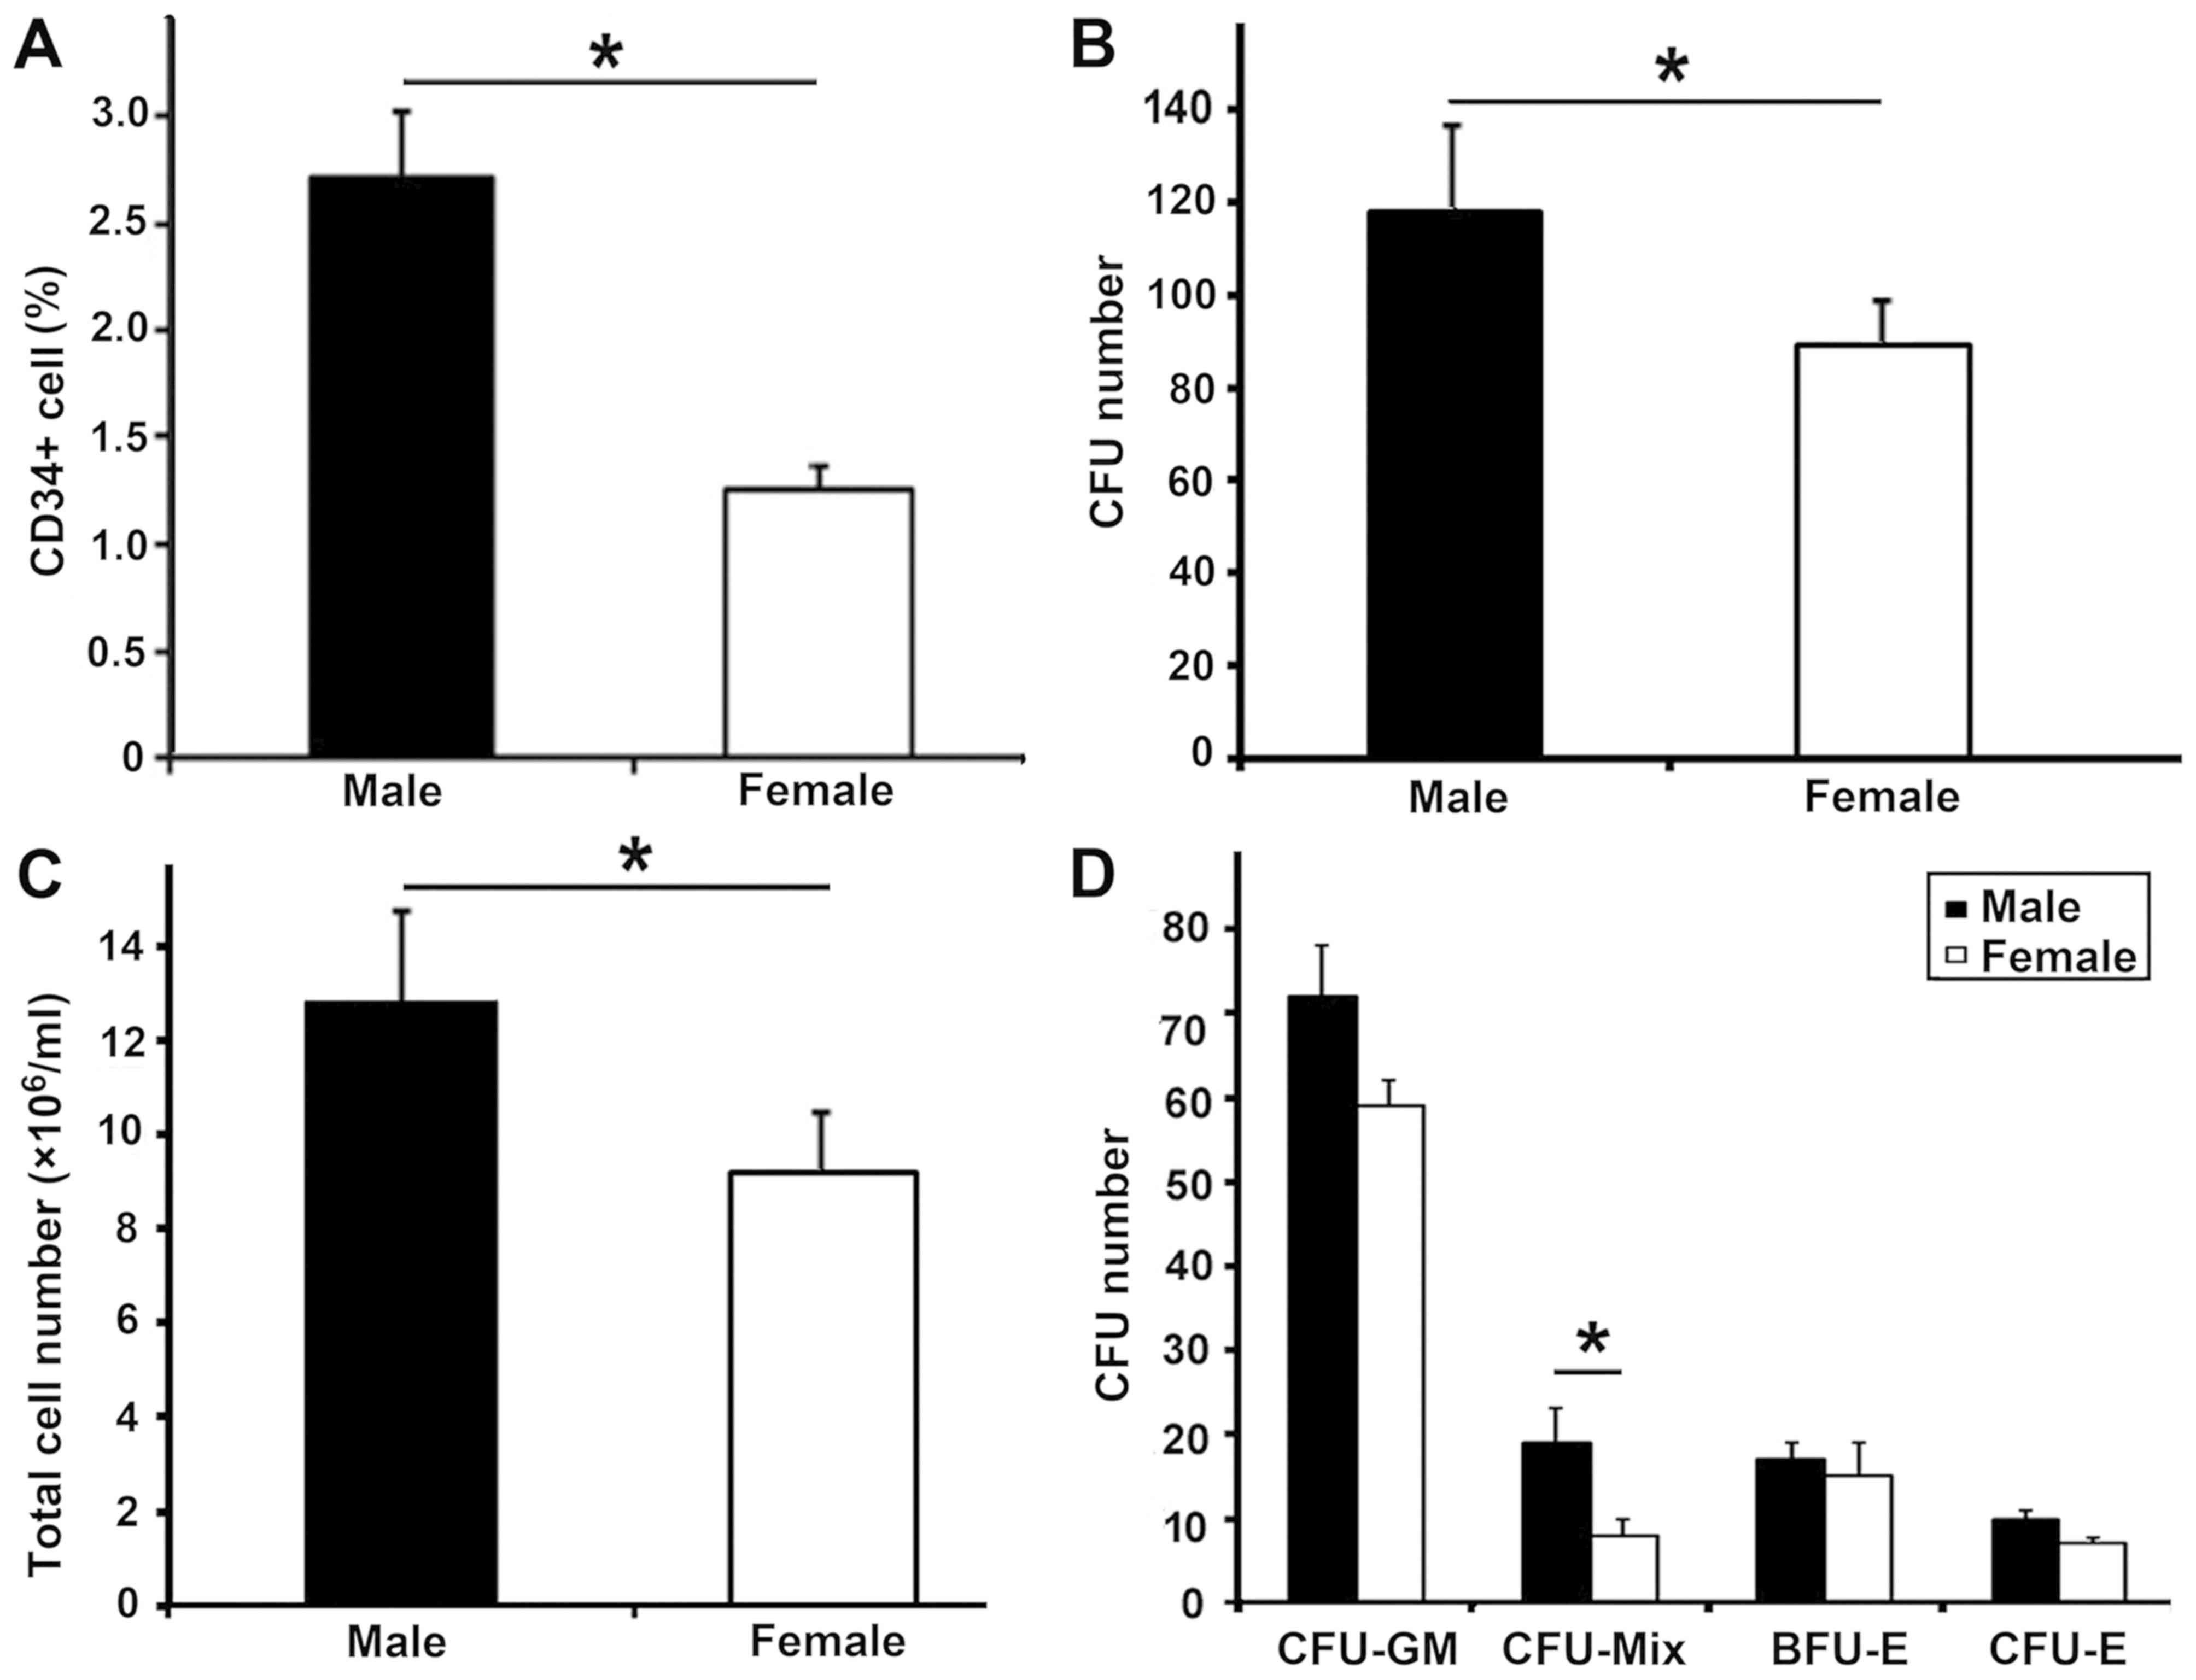
Higher CD34+ cell
populations in CB MNCs from male infants
The median birth weight of the male infants (3,508
g; n=20) was similar to that of the female infants (3,460 g; n=23;
P>0.05; Table I). However, the
concentration of CB MNCs was lower in the male group than that in
the female group (median, 2.04±0.20 vs.
2.52±0.38×10⁶/ml; P<0.05; Table I). The population of CB
CD34+ cells in MNCs from the male group was higher than
that in the female group (median, 2.72±0.17 vs. 1.26±0.09%;
P<0.05; Fig. 2A). The
concentration of CB CD34+ cells in the male group was
higher than that in the female group (median, 0.04±0.02 vs.
0.03±0.03×10⁶/ml; P<0.05).
 | Table I.Birth weight, number of
CD34+ cells, CB MNCs, and the percentage of CB
CD34+ cells/CB MNC. |
Table I.
Birth weight, number of
CD34+ cells, CB MNCs, and the percentage of CB
CD34+ cells/CB MNC.
| Sample | Sex | Weight (g) | CB MNC
(×106) | CB CD34+
cells (×106) | CB CD34+
cells/CB MNC (%) |
|---|
| 1 | M | 3,000 | 1.02 | 0.04 | 4.00 |
| 2 | M | 2,950 | 1.20 | 0.02 | 1.62 |
| 3 | M | 2,765 | 1.22 | 0.03 | 2.50 |
| 4 | M | 3,500 | 1.35 | 0.04 | 3.02 |
| 5 | M | 3,380 | 1.44 | 0.02 | 1.43 |
| 6 | M | 3,800 | 1.59 | 0.05 | 3.11 |
| 7 | M | 3,745 | 1.80 | 0.04 | 2.50 |
| 8 | M | 3,860 | 1.86 | 0.02 | 2.50 |
| 9 | M | 3,300 | 2.00 | 0.04 | 1.54 |
| 10 | M | 3,460 | 2.08 | 0.07 | 3.40 |
| 11 | M | 3,556 | 2.10 | 0.06 | 2.92 |
| 12 | M | 3,700 | 2.35 | 0.07 | 3.03 |
| 13 | M | 3,850 | 2.52 | 0.09 | 3.06 |
| 14 | M | 2,940 | 2.71 | 0.03 | 1.11 |
| 15 | M | 2,670 | 2.82 | 0.09 | 3.19 |
| 16 | M | 3,950 | 3.0 | 0.09 | 3.00 |
| 17 | M | 3,820 | 3.43 | 0.06 | 1.74 |
| 18 | M | 3,150 | 3.59 | 0.06 | 1.62 |
| 19 | M | 3,230 | 3.93 | 0.08 | 2.09 |
| 20 | M | 3,690 | 4.02 | 0.04 | 1.21 |
| 1 | F | 3,300 | 1.21 | 0.01 | 0.08 |
| 2 | F | 3,620 | 1.30 | 0.02 | 1.52 |
| 3 | F | 3,630 | 1.41 | 0.02 | 1.41 |
| 4 | F | 3,820 | 1.53 | 0.03 | 2.00 |
| 5 | F | 3,010 | 1.70 | 0.02 | 0.98 |
| 6 | F | 3,770 | 1.94 | 0.02 | 0.09 |
| 7 | F | 3,640 | 2.07 | 0.04 | 1.17 |
| 8 | F | 3,710 | 2.20 | 0.03 | 1.35 |
| 9 | F | 2,750 | 2.25 | 0.03 | 1.00 |
| 10 | F | 3,620 | 2.30 | 0.03 | 1.05 |
| 11 | F | 3,130 | 2.74 | 0.07 | 2.50 |
| 12 | F | 3,900 | 2.76 | 0.07 | 2.56 |
| 13 | F | 3,250 | 2.90 | 0.06 | 2.11 |
| 14 | F | 3,120 | 2.95 | 0.03 | 0.09 |
| 15 | F | 3,770 | 3.08 | 0.06 | 2.03 |
| 16 | F | 3,200 | 3.33 | 0.08 | 2.41 |
| 17 | F | 3,880 | 3.52 | 0.07 | 2.03 |
| 18 | F | 2,950 | 3.77 | 0.06 | 1.54 |
| 19 | F | 2,600 | 3.90 | 0.05 | 1.12 |
| 20 | F | 3,150 | 3.95 | 0.04 | 1.06 |
| 21 | F | 3,650 | 4.10 | 0.05 | 2.55 |
| 22 | F | 3,690 | 2.92 | 0.03 | 1.00 |
| 23 | F | 3,710 | 3.55 | 0.05 | 1.4 |
| Mean ± SEM | M | 3,416±88.72 | 2.30±0.21 | 0.052±0.005 | 2.43±0.19 |
|
| F | 3,429±79.03 | 2.67±0.19 | 0.042±0.004 | 1.44±0.16 |
| P-value |
| 0.911 | 0.196 | 0.148 | 0.0002 |
Enumeration of CFUs from sorted
CD34+ cells
For the 43 samples processed, the purity of
CD34+ cells after separation was >95%, as verified by
FACS. The number of CFUs and total cells produced in the male group
was higher than that in the female group (118±20 vs. 89±8 and
12.8±2.5 vs. 9.2±3.3×10⁶/ml, respectively; P<0.05;
Fig. 2B and C). It was observed that
the number of CFU-Mix in the male group was higher than that in the
female group (20±5 vs. 9±2; P<0.05). There were no significant
differences in the number of CFU-GM (colony forming
unit-granulocyte/macrophage), BFU-E (burst forming unit-erythroid)
or CFU-E (colony forming unit-erythroid) colonies formed between
the two groups (P>0.05; Fig.
2D).
Male CB CD34 +cells exhibit
better amplification
CB CD34+ cells in the male group
exhibited a better amplification efficiency than those in the
female group on day 7 (P<0.05; Fig.
3A). The forward vs. side scatter diagrams of the male and
female group were gated on the cell population (Fig. 3B). According to FACS analysis, there
were no significant differences in the fractions of
CD34+CD38− cells between the male and female
groups on day 0 (2.0±0.14 vs.1.5±0.07%; P>0.05) and day 7
(21.7±2.0 vs. 18.5±1.1%; P>0.05; Fig.
3C and D).
Microarray-based gene expression
analysis
GO enrichment analysis
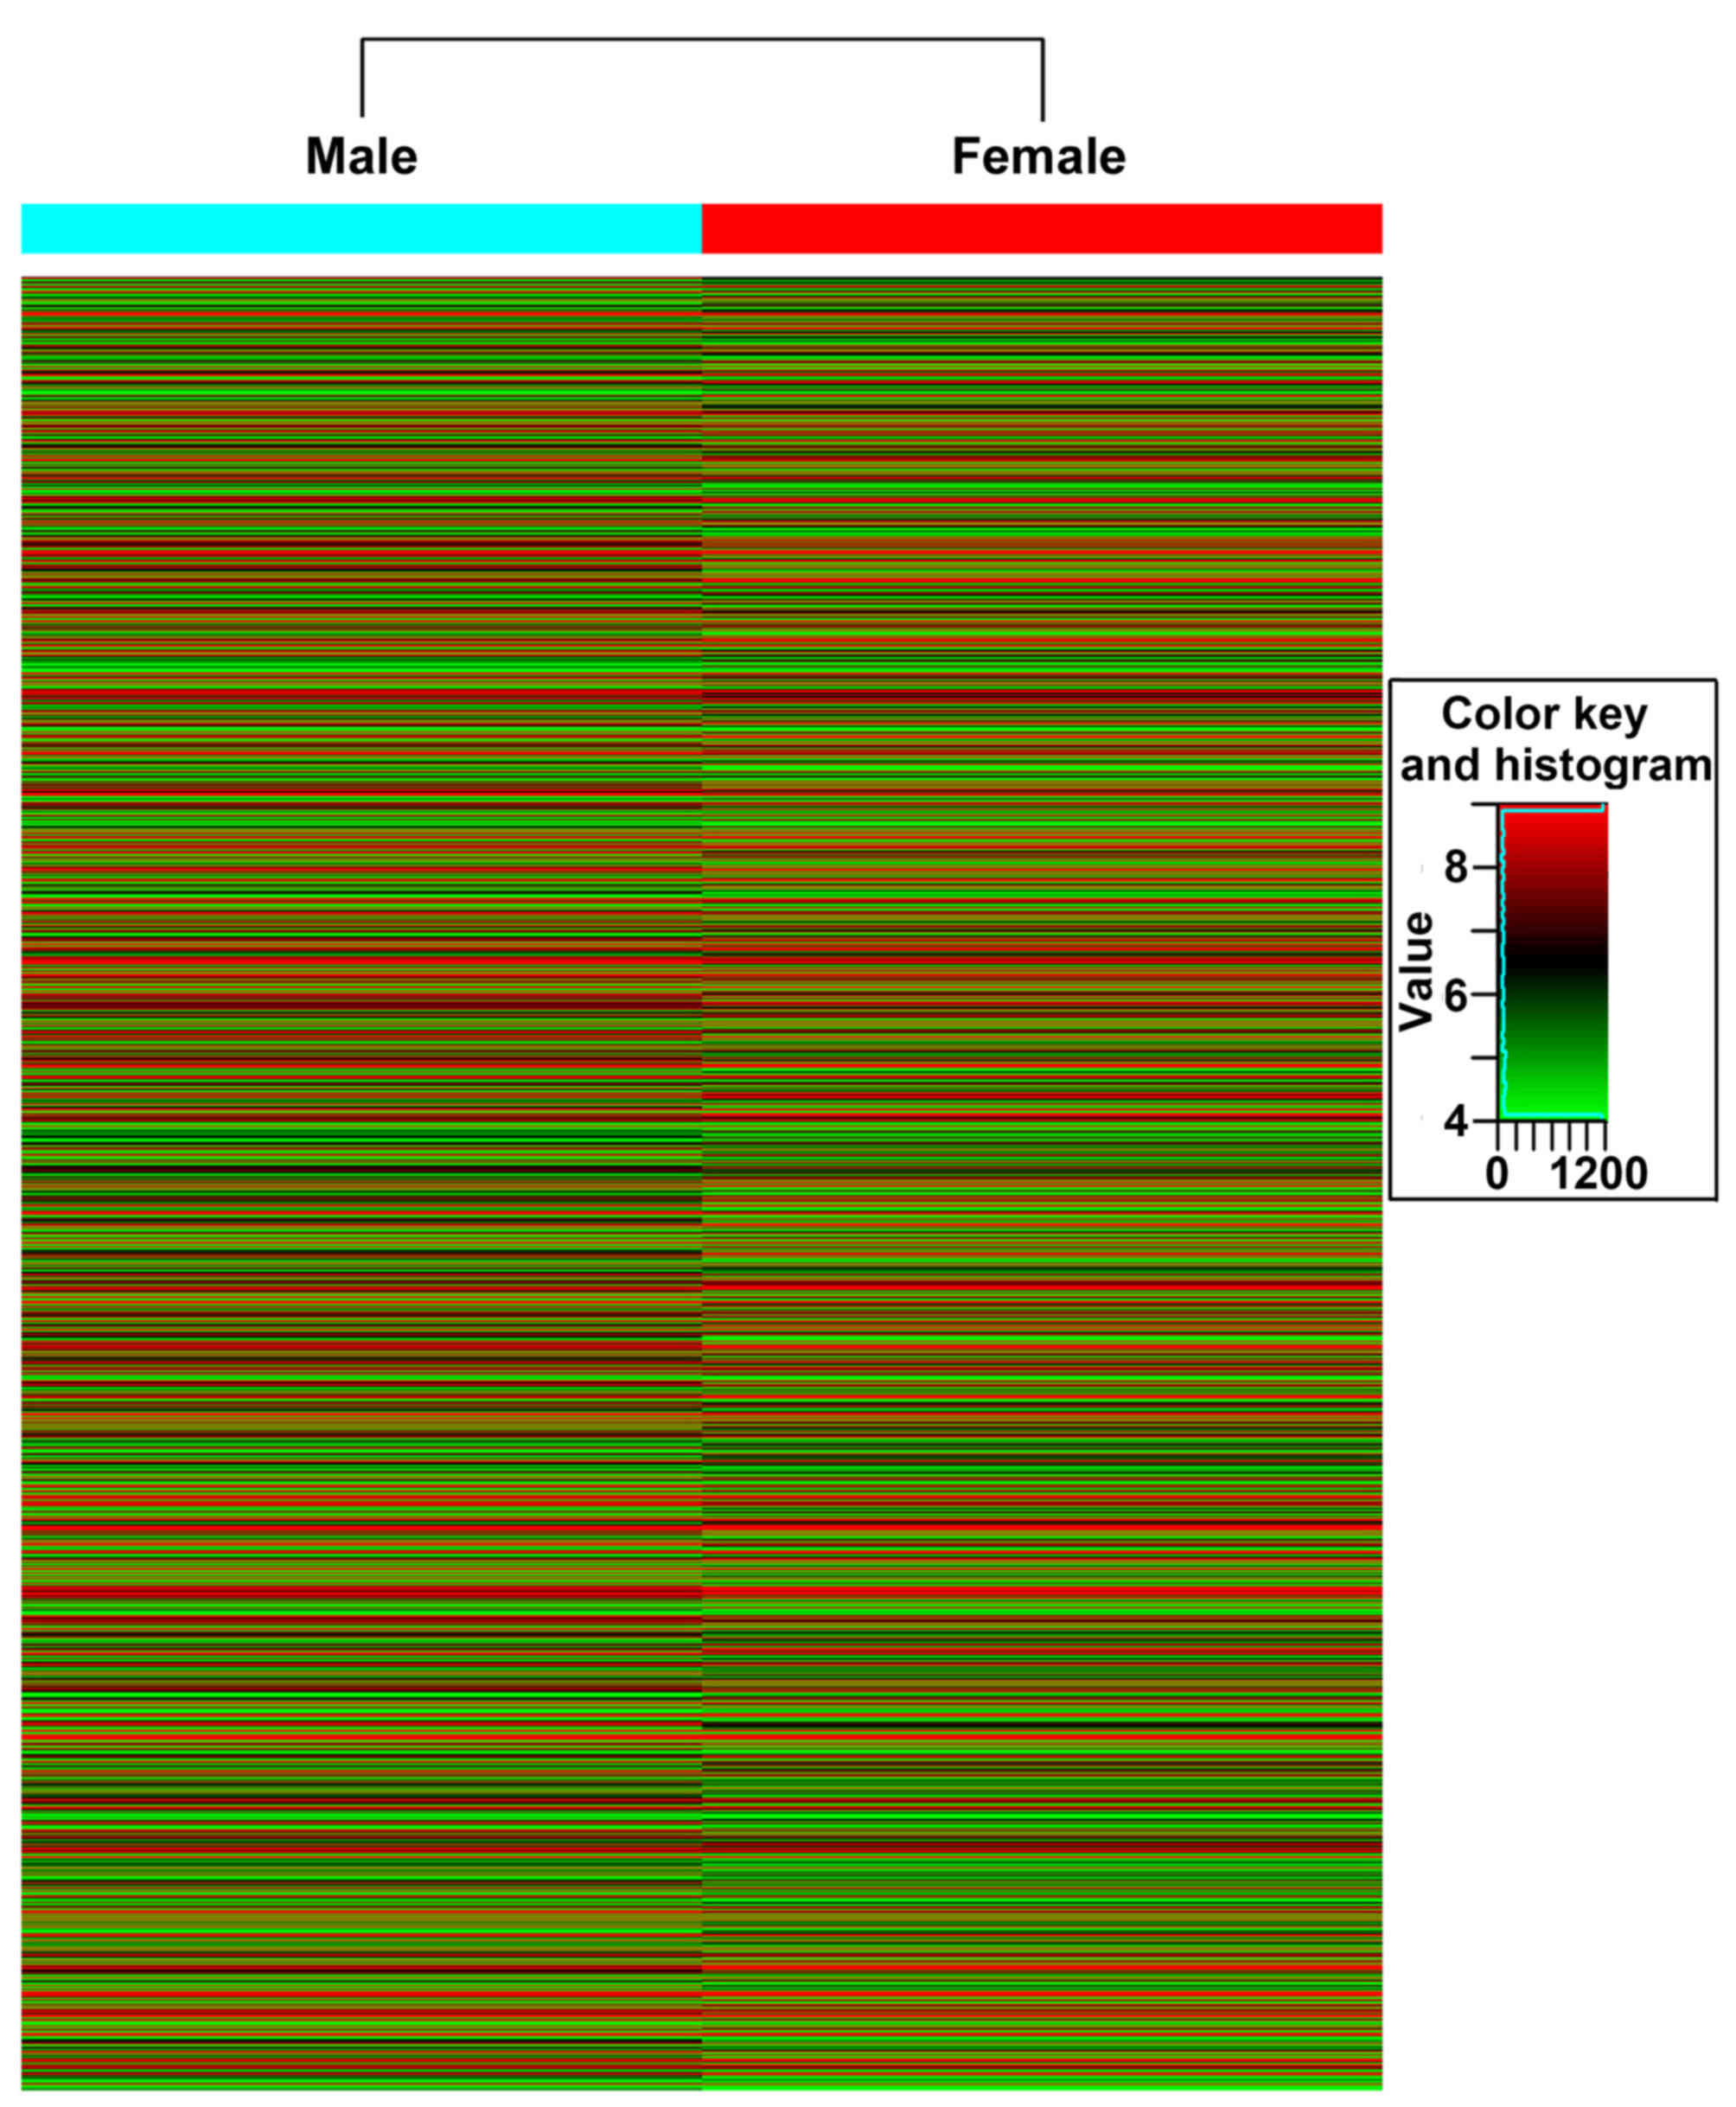
Agilent Whole Genome Oligo Microarrays containing
sequences from 13,594 genes were used. Overall, 64.9% of all genes
were differentially expressed in both male and female groups. The
up- and downregulated genes of the male and female groups were
displayed as a heat map (Fig. 4). In
the male group, a total of 1,205 genes (8.8% of total genes) were
upregulated by at least 2.0-fold. Upregulated (>6 fold) DEGs are
summarized in Table II, and >30%
were associated with Y chromosome function. In the female group,
1,313 genes (9.6% of total genes) were upregulated by at least
2.0-fold. Upregulated (>6 fold) DEGs are summarized in Table III. To examine the specific
function and biological pathways of the DEGs identified, GO and
KEGG pathway analysis was performed using microarray dataset using
the GO (www.geneontology.gov) and KEGG
pathway database (www.genome.jp/kegg/pathway.html). Among these DEGs,
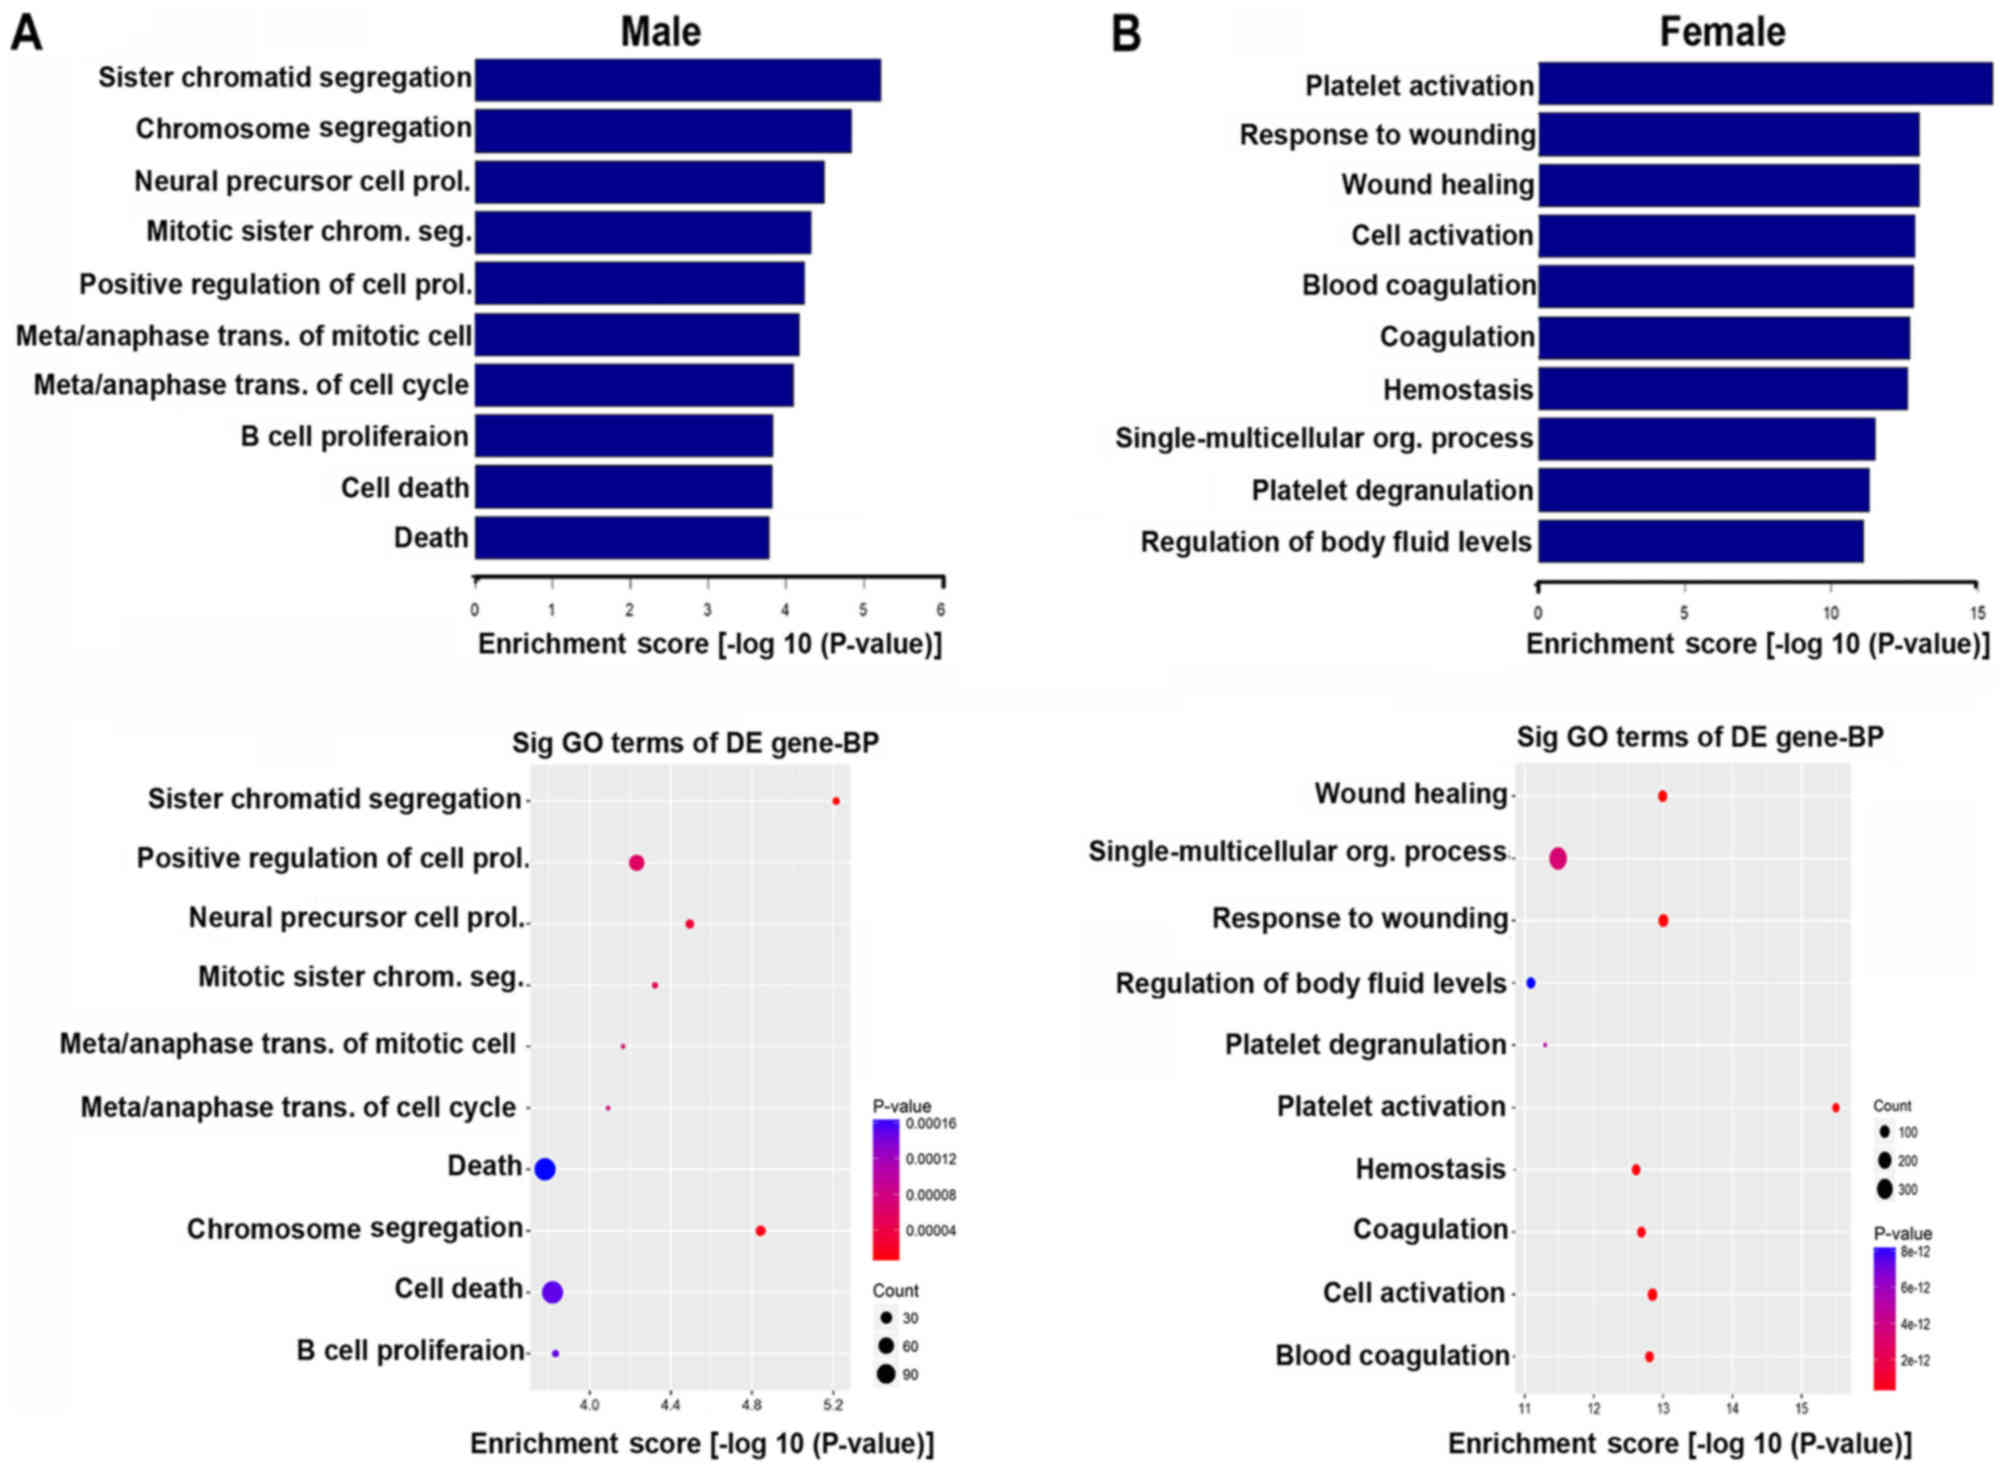
the top five significantly enriched biological processes in the
male group were sister chromatid segregation, chromosome
segregation, neural precursor cell proliferation, mitotic sister
chromatid segregation and positive regulation of cell proliferation
(Fig. 5A). The top five
significantly enriched biological processes in the female group
were platelet activation, response to wounding, wound healing, cell
activation and blood coagulation (Fig.
5B).
| Table II.Upregulated DEGs in the male group
(>6-fold). |
Table II.
Upregulated DEGs in the male group
(>6-fold).
| Fold-change | Gene symbol | Definition [GenBank
accession no.] |
|---|
| 594.2159004 | RPS4Y2 | Ribosomal protein
S4, Y-linked 2 (RPS4Y2) [NM_001039567] |
| 325.6161621 | RPS4Y1 | S ribosomal
protein S4, Y-linked 1 (RPS4Y1) [NM_001008] |
| 140.3517653 | EIF1AY | S eukaryotic
translation initiation factor 1A, Y-linked (EIF1AY)
[NM_004681] |
| 130.2768923 | DDX3Y | DEAD
(Asp-Glu-Ala-Asp) box polypeptide 3, Y-linked (DDX3Y), transcript
variant 1 [NM_001122665] |
| 78.8031503 | SIGLEC14 | Sialic acid binding
Ig-like lectin 14 (SIGLEC14) [NM_001098612] |
| 76.6696878 | USP9Y | Ubiquitin specific
peptidase 9, Y-linked (USP9Y) [NM_004654] |
| 35.4723966 | CYorf15B | Chromosome Y open
reading frame 15B (CYorf15B) [NM_032576] |
| 30.3805272 | UTY | Ubiquitously
transcribed tetratricopeptide repeat gene, Y-linked
[NC_000024.10] |
| 18.1032197 | CYorf15A | S chromosome
Y open reading frame 15A (CYorf15A) [NM_001005852] |
| 14.4214818 | UTY | Ubiquitously
transcribed tetratricopeptide repeat gene, Y-linked (UTY),
transcript variant 1, [NM_182660] |
| 14.2319062 | HIPK2 | Homeodomain
interacting protein kinase 2 (HIPK2), transcript variant
1[NM_022740] |
| 13.2519228 | ZFY | Zinc finger
protein, Y-linked (ZFY), transcript variant 1 [NM_003411] |
| 12.8883619 | CCL20 | Chemokine (C-C
motif) ligand 20 (CCL20), transcript variant 1 [NM_004591] |
| 12.5203328 | EIF1AY | Eukaryotic
translation initiation factor 1A, Y-linked (EIF1AY)
[NM_004681] |
| 12.4420681 | UTY | Ubiquitously
transcribed tetratricopeptide repeat gene, Y-linked (UTY),
transcript variant 3[NM_007125] |
| 11.9361188 | LOC728073 | mRNA; cDNA
DKFZp762K239 (from clone DKFZp762K239) [AL833395] |
| 11.1046799 | TTTY15 | Testis-specific
transcript, Y-linked 15 (non-protein coding) (TTTY15), non-coding
RNA [NR_001545] |
| 9.9518083 | HLA-DRB6 | Major
histocompatibility complex, class II, DR beta 6 (pseudogene)
(HLA-DRB6), non-coding RNA [NR_001298] |
| 9.5174719 | KIAA1751 | Chromosome 1 open
reading frame 222 [Source:HGNC Symbol;Acc:27917]
[ENST00000378592] |
| 9.2779971 | OR2A5 | S olfactory
receptor, family 2, subfamily A, member 5 (OR2A5) [NM_012365] |
| 8.8590285 | WISP2 | WNT1 inducible
signaling pathway protein 2 (WISP2) [NM_003881] |
| 8.7457057 | NPTX1 | Neuronal pentraxin
I (NPTX1) [NM_002522] |
| 8.719558 | CEACAM8 | Carcinoembryonic
antigen-related cell adhesion molecule 8 (CEACAM8) [NM_001816] |
| 8.601976 | ZDBF2 | S zinc
finger, DBF-type containing 2 (ZDBF2) [NM_020923] |
| 8.2684666 | USP9Y | Ubiquitin specific
peptidase 9, Y-linked (USP9Y) [NM_004654] |
| 7.9132372 | S100B | S100 calcium
binding protein B (S100B) [NM_006272] |
| 7.8571146 | DAND5 | DAN domain family,
member 5 (DAND5) [NM_152654] |
| 7.7909864 | IFI27 | Interferon,
alpha-inducible protein 27 (IFI27), transcript variant 2
[NM_005532] |
| 7.509532 | ITGB2 | Integrin, beta 2
(complement component 3 receptor 3 and 4 subunit)
[ENST00000397846] |
| 7.5074346 | IL7R | S
interleukin 7 receptor (IL7R) [NM_002185] |
| 7.4898327 | CAMP | Cathelicidin
antimicrobial peptide (CAMP) [NM_004345] |
| 7.0189348 | PDZRN4 | PDZ domain
containing ring finger 4 (PDZRN4), transcript variant
2[NM_013377] |
| 6.9116334 | HINT3 | Histidine triad
nucleotide binding protein 3 (HINT3) [NM_138571] |
| 6.6545679 | THEMIS | Thymocyte selection
associated (THEMIS), transcript variant 1 [NM_001164685] |
| 6.6351266 | OLFM4 | Olfactomedin 4
(OLFM4) [NM_006418] |
| 6.620981 | PDE4B | Phosphodiesterase
4B, cAMP-specific (PDE4B), transcript variant d [NM_001037341] |
| 6.3871366 | ASS1 | Argininosuccinate
synthase 1 (ASS1), transcript variant 1 [NM_000050] |
| 6.2447192 | LOC283174 | Hypothetical
LOC283174 (LOC283174), non-coding RNA [NR_024344] |
| 6.204357 | MORN4 | MORN repeat
containing 4, mRNA (cDNA clone IMAGE:4690584), complete cds.
[BC022054] |
| 6.1692183 | CD8B | CD8b molecule
(CD8B), transcript variant 4 [NM_172102] |
| 6.1476516 | NCRNA00282 | Non-protein coding
RNA 282 (NCRNA00282), transcript variant 1, non-coding RNA
[NR_027047] |
| 6.0312787 | LOC254099 | Hypothetical
LOC254099 (LOC254099), non-coding RNA [NR_038869] |
| Table III.Upregulated DEGs in the female group
(>6-fold). |
Table III.
Upregulated DEGs in the female group
(>6-fold).
| Fold-change | Gene symbol | Definition [GenBank
accession no.] |
|---|
| 544.6738522 | XIST | X
(inactive)-specific transcript (non-protein coding) (XIST),
non-coding RNA [NR_001564] |
| 28.4003794 | FFAR3 | Free fatty acid
receptor 3 (FFAR3) [NM_005304] |
| 17.5307644 | EGR2 | Early growth
response 2 (EGR2), transcript variant 1 [NM_000399] |
| 12.1291479 | CHRM4 | Cholinergic
receptor, muscarinic 4 (CHRM4) [NM_000741] |
| 11.8541392 | CCL3L3 | Chemokine (C-C
motif) ligand 3-like 3 (CCL3L3) [NM_001001437] |
| 11.4339739 | CCL4 | Chemokine (C-C
motif) ligand 4 (CCL4), transcript variant 1 [NM_002984] |
| 10.4989686 | NCRNA00238 | Non-protein coding
RNA 238 (NCRNA00238), transcript variant 1, non-coding RNA
[NR_024338] |
| 10.0601213 | MXRA7 | Matrix-remodelling
associated 7 (MXRA7), transcript variant 1 [NM_001008528] |
| 10.0576266 | CCL4 | Chemokine (C-C
motif) ligand 4 (CCL4), transcript variant 1 [NM_002984] |
| 9.4497247 | H19 | H19, imprinted
maternally expressed transcript (non-protein coding) (H19),
non-coding RNA [NR_002196] |
| 8.8575678 | TAF5L | TAF5-like RNA
polymerase II, p300/CBP-associated factor (PCAF)-associated factor,
65kDa (TAF5L), transcript variant 1, [NM_014409] |
| 8.5429208 | HEMK1 | HemK
methyltransferase family member 1 (HEMK1) [NM_016173] |
| 8.5307418 | ZSCAN2 | Zinc finger and
SCAN domain containing 2 (ZSCAN2), transcript variant 1
[NM_181877] |
| 8.320606 | LIMK1 | LIM domain kinase 1
(LIMK1), transcript variant 1 [NM_002314] |
| 8.2361226 | CCL3L3 | Chemokine (C-C
motif) ligand 3-like 3 (CCL3L3) [NM_001001437] |
| 8.0555941 | CCL3 | Chemokine (C-C
motif) ligand 3 (CCL3) [NM_002983] |
| 7.9687299 | XAGE5 | X antigen family,
member 5 (XAGE5) [NM_130775] |
| 6.7899982 | POU2F2 | POU class 2
homeobox 2 (POU2F2), transcript variant 3 [NM_001207026] |
| 6.7290741 | PF4V1 | Platelet factor 4
variant 1 (PF4V1) [NM_002620] |
| 6.5002189 | LOC285224 | S
hypothetical LOC285224 (LOC285224), non-coding RNA [NR_037890] |
| 6.4555177 | CXCL10 | Chemokine (C-X-C
motif) ligand 10 (CXCL10) [NM_001565] |
| 6.4486358 | BTG2 | BTG family, member
2 (BTG2) [NM_006763] |
| 6.2758219 | KIAA0408 | KIAA0408 (KIAA0408)
[NM_014702] |
| 6.2581186 | SOCS3 | Suppressor of
cytokine signaling 3 (SOCS3) [NM_003955] |
| 6.2558308 | ARPC5 | Actin related
protein 2/3 complex, subunit 5, 16kDa [ENST00000367534] |
| 6.1485137 | ECSCR | S
endothelial cell-specific chemotaxis regulator (ECSCR)
[NM_001077693] |
| 6.1442538 | MEOX2 | Mesenchyme homeobox
2 (MEOX2) [NM_005924] |
| 6.0415968 | FLJ40606 | cDNA FLJ40606 fis,
clone THYMU2011939. [AK097925] |
| 6.0281884 | MYL9 | Myosin, light chain
9, regulatory (MYL9), transcript variant 2 [NM_181526] |
UniProtKB analysis
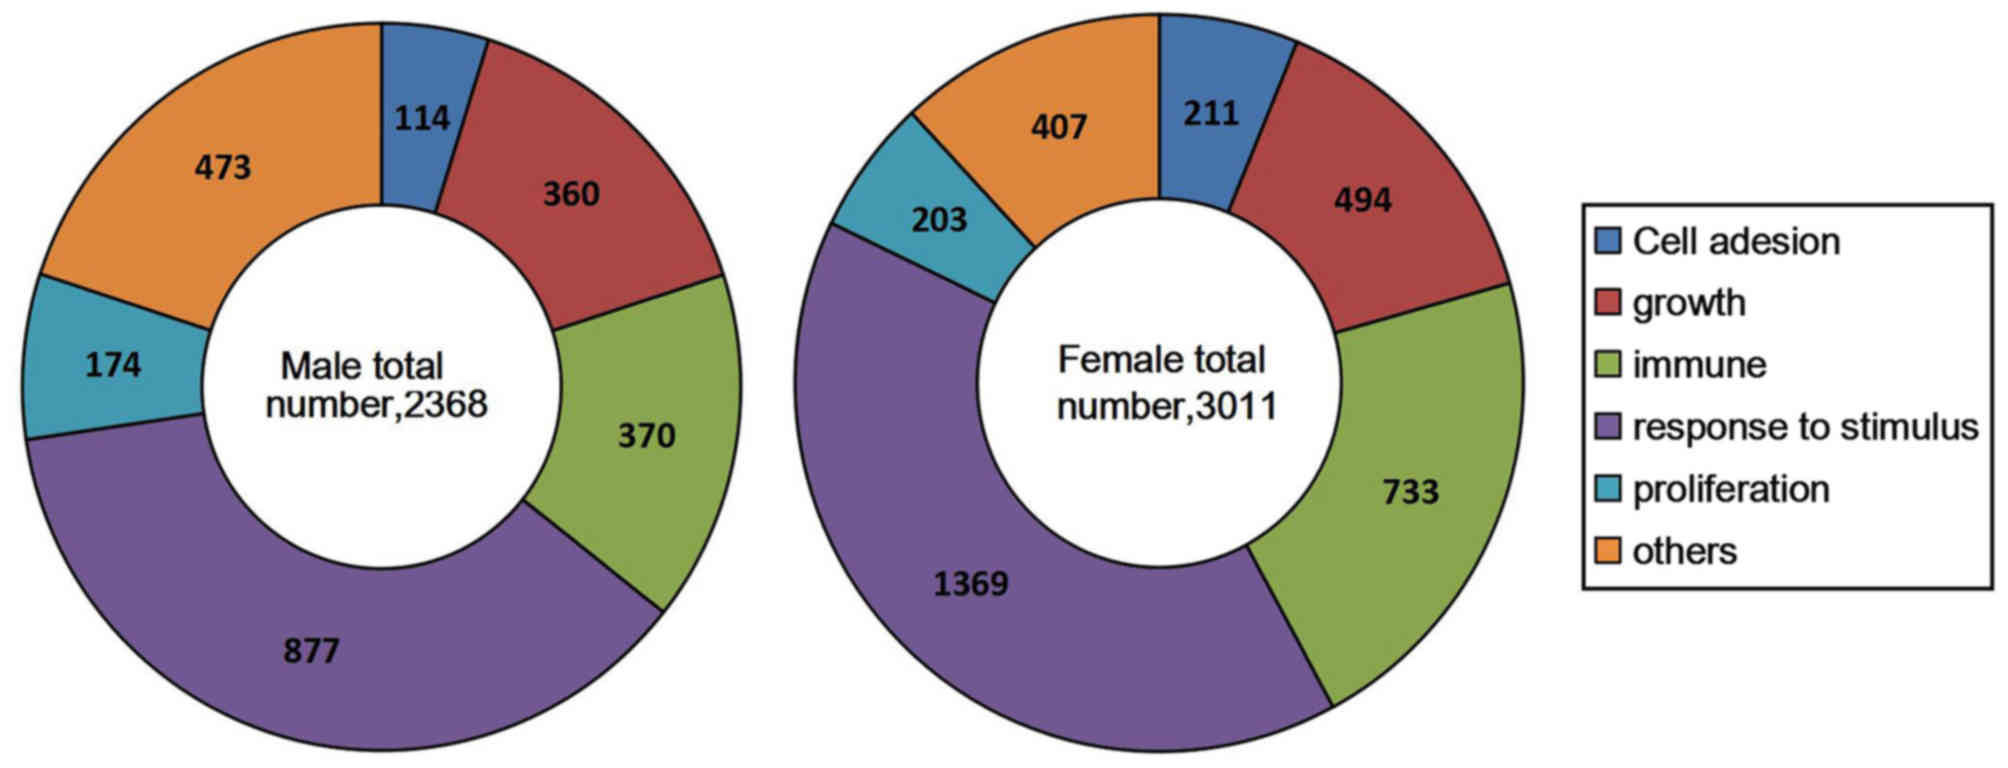
Among the DEGs, 2,368 genes in the male group and
3,011 genes in the female group were successfully mapped to the
UniProtKB IDs. Differences between the male and female group were
categorized into six common biological functions: Cell adhesion,
growth, immunity, response to stimulus, proliferation and other. It
is noteworthy that a number of genes were involved in the response
to stimulus pathway in males and females (37 vs. 45%; Fig. 6), suggesting that hematopoietic
stem/progenitor cells are likely to be resistant to unfavorable
growth environments, which is consistent with recent studies
(12–14).
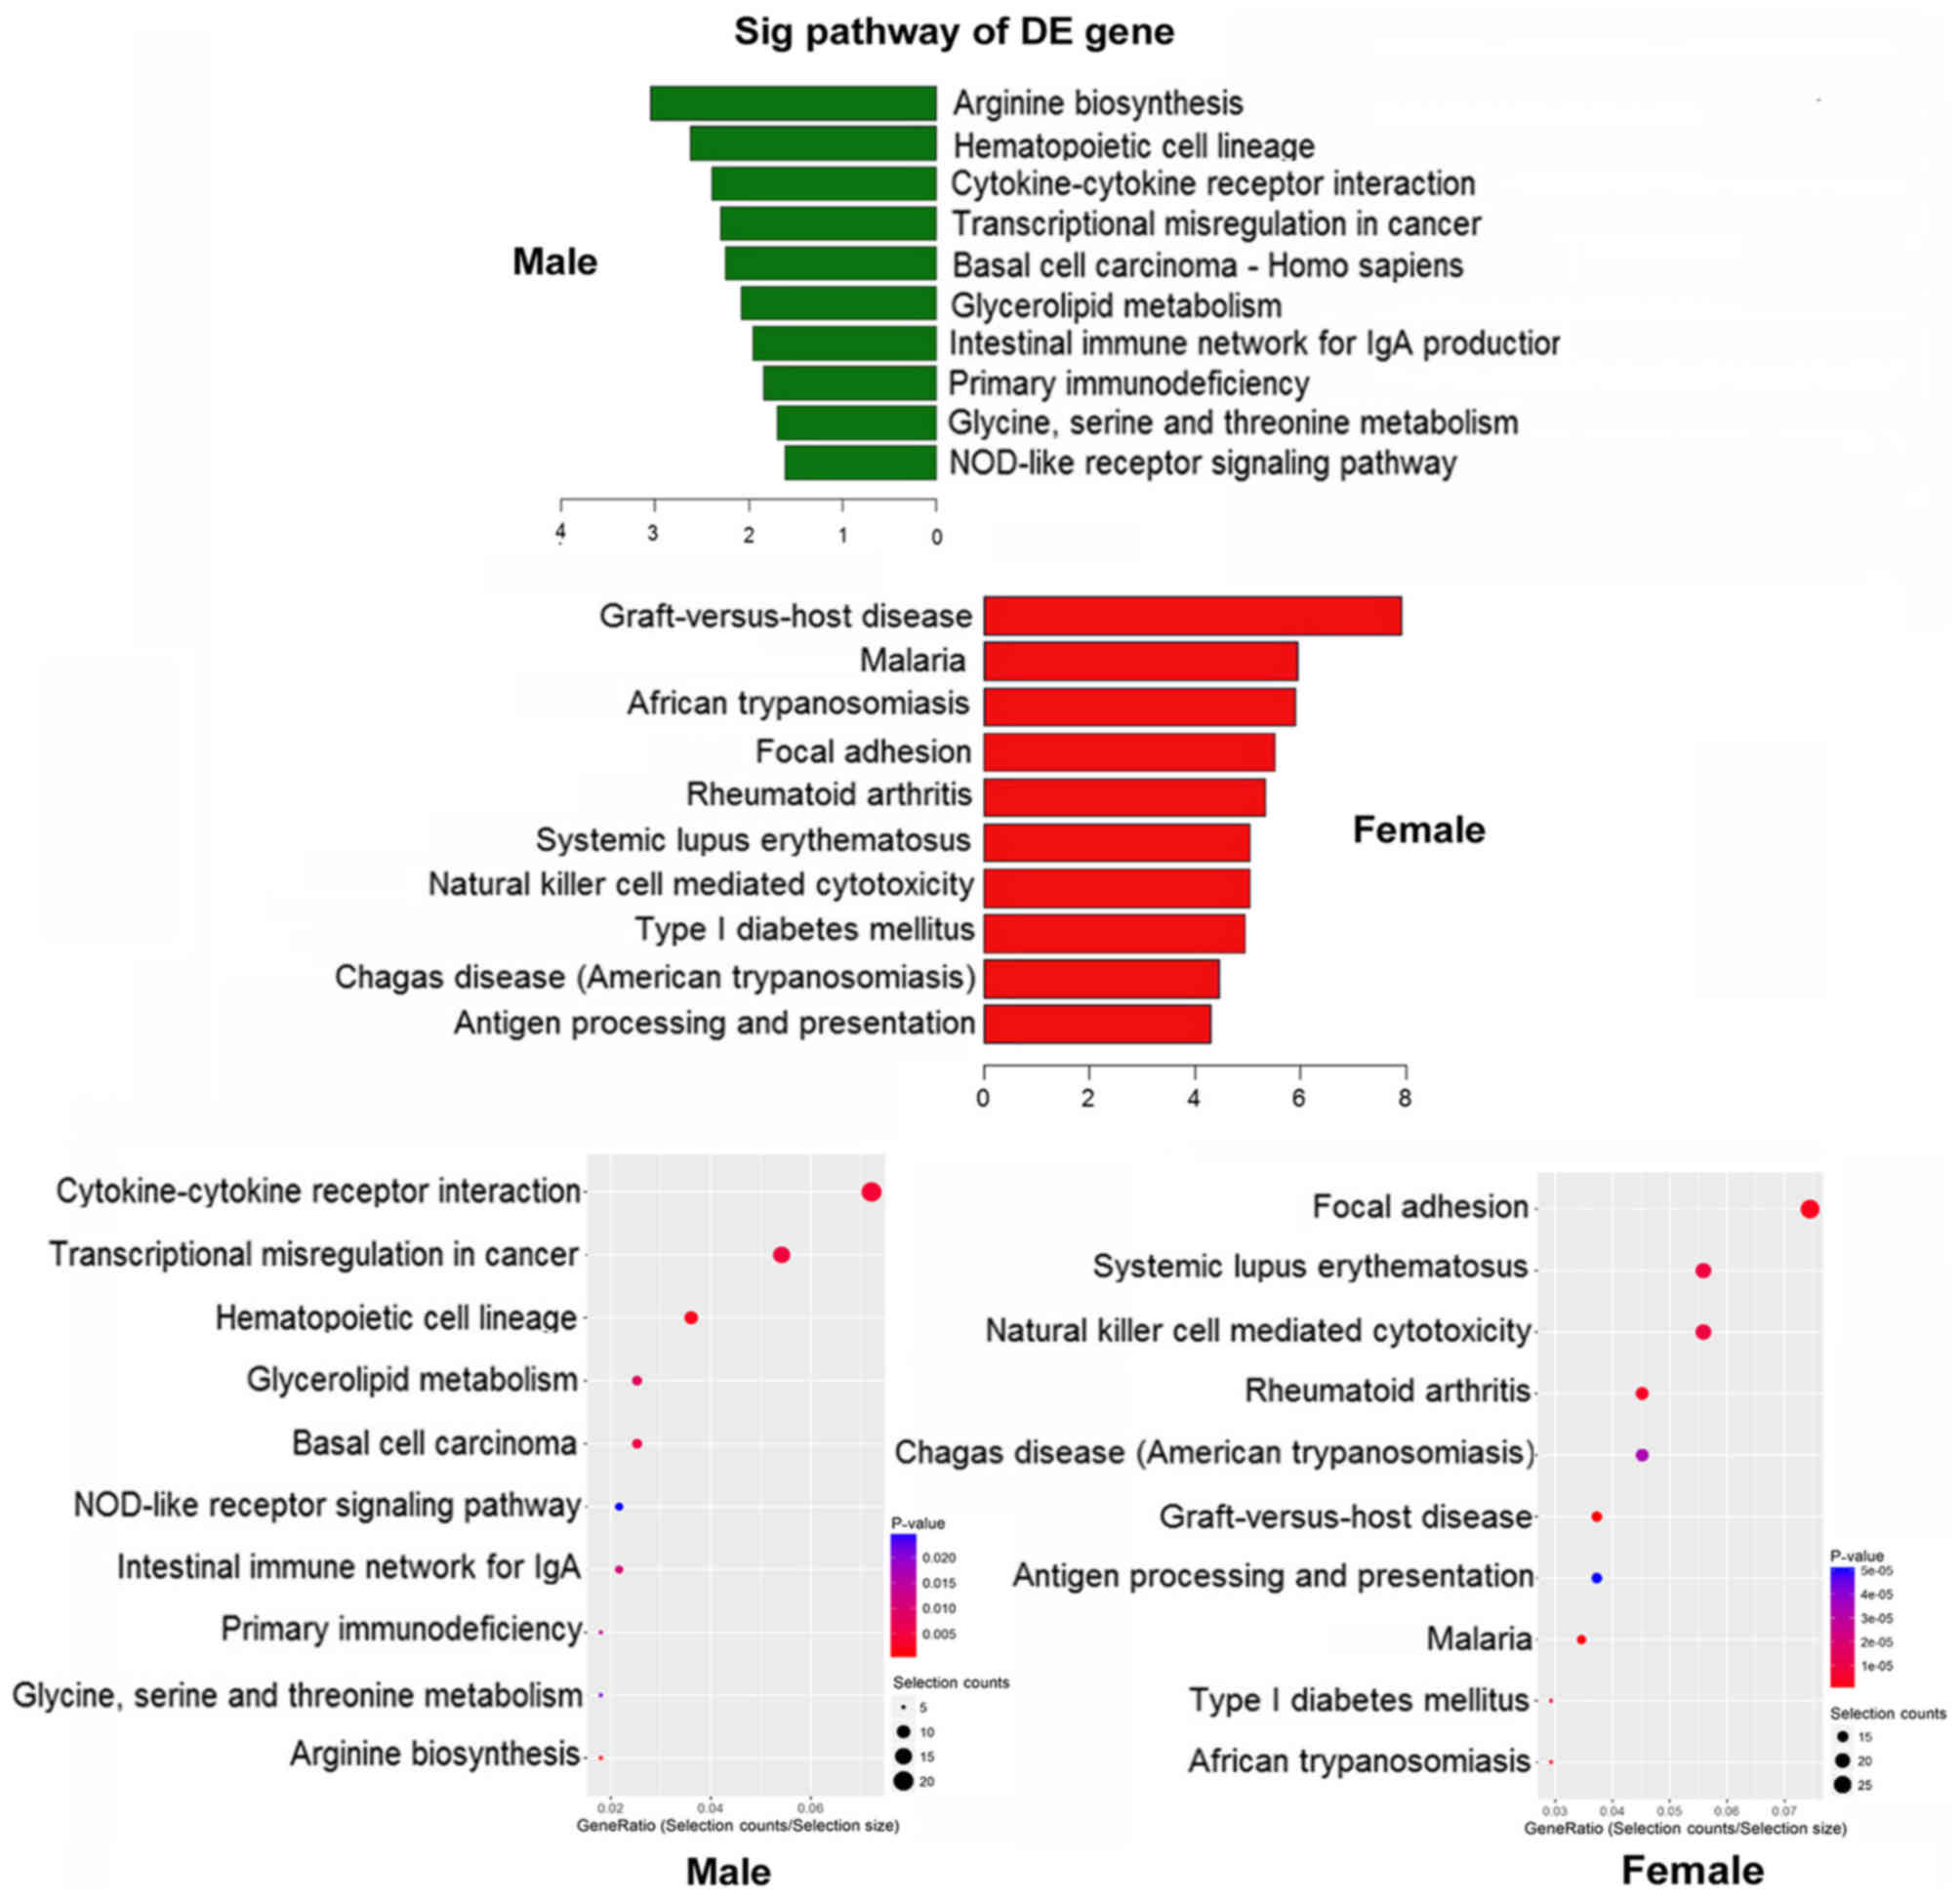
Signaling pathways
The top three significantly enriched signaling
pathways identified in the male group were arginine biosynthesis,
hematopoietic cell lineage and cytokine-cytokine receptor
interaction, while the top three significantly enriched signaling
pathways in the female group were graft-vs.-host disease, malaria
and African trypanosomiasis (Fig.
7). The top 10 upregulated signaling pathway in the male and
female group are listed in Tables
IV and V, respectively.
Signaling pathways associated with hematopoietic cell proliferation
were screened and analyzed. Subsequent analysis focused on the
hematopoietic cell lineage and cytokine-cytokine receptor
interaction signaling pathways in the two groups.
| Table IV.Top 10 significantly enriched
signaling pathways in DEGs in the male group. |
Table IV.
Top 10 significantly enriched
signaling pathways in DEGs in the male group.
| Signaling
pathway | Fisher P-value | Genes |
|---|
| Arginine
biosynthesis | 0.0008948247 |
ARG1/ASS1/CPS1/GLS/GPT |
| Hematopoietic cell
lineage | 0.002383657 |
CD24/CD5/CD8B/CR2/DNTT/IL1R2/IL6R/IL7/IL7R/MS4A1 |
| Cytokine-cytokine
receptor interaction | 0.004093339 |
CCL20/CCR7/CCR9/CD40LG/CXCL12/CXCR4/IL13RA1/IL1R2/IL23A/IL6R/IL6ST/IL7/IL7R/INHBB/PRL/TGFBR2/TNFRSF10D/TNFRSF25/TNFSF15/VEGFA |
| Transcriptional
misregulation in cancer | 0.005049407 |
ARNT2/ATM/BIRC3/CCR7/CEBPE/DEFA3/IL1R2/MMP9/NR4A3/RUNX1/SMAD1/TGFBR2/TMPRSS2/UTY/ZEB1 |
| Basal cell
carcinoma | 0.005654648 |
APC/APC2/GLI1/HHIP/LEF1/TCF7/TCF7L2 |
| Glycerolipid
metabolism | 0.008313989 |
AGPAT5/ALDH7A1/GPAM/GPAT2/LCLAT1/LPL/MOGAT1 |
| Intestinal immune
network for IgA production | 0.001110992 |
CCR9/CD28/CD40LG/CXCL12/CXCR4/MADCAM1 |
| Primary
immunodeficiency | 0.001453322 |
CD40LG/CD8B/IL7R/PTPRC/RAG1 |
| Glycine, serine and
threonine metabolism | 0.001993447 |
ALDH7A1/CTH/GLDC/PSAT1/SARDH |
| NOD-like receptor
signaling pathway | 0.002447901 |
BIRC3/CARD8/NAIP/NLRP3/RIPK2/TAB1 |
| Table V.Top 10 significantly enriched
signaling pathways in DEGs in the female group. |
Table V.
Top 10 significantly enriched
signaling pathways in DEGs in the female group.
| Signaling
pathway | Fisher P-value | Genes |
|---|
| Graft-vs.-host
disease | 0.001244344 |
FASLG/HLA-A/HLA-DPA1/HLA-DQA1/HLA-DQA2/IFNG/IL1A/IL1B/IL6/KIR2DL2/KLRC1/KLRD1/PRF1/TNF- |
| Malaria | 0.001148487 |
CCL2/HBA2/IFNG/IL1B/IL6/ITGAL/KLRK1/SELE/SELP/TGFB1/THBS2/TNF/VCAM1 |
| African
trypanosomiasis | 0.001221394 |
FASLG/HBA2/IDO1/IDO2/IFNG/IL1B/IL6/LAMA4/SELE/TNF/VCAM1 |
| Focal adhesion | 0.003092215 |
ACTN3/AKT1/BCAR1/CAV1/CAV2/COL2A1/EGF/FLNA/ILK/ITGA2B/ITGB3/ITGB5/JUN/LAMA4/LAMB1/MYL9/MYLK/PAK6/PARVB/PDGFD/PDGFRB/RASGRF1/RELN/THBS2/TLN1/TNXB/VCL/VWF |
| Rheumatoid
arthritis | 0.004613411 |
CCL2/CCL3/CCL3L3/CCL5/CXCL6/FOS/HLA-DPA1/HLA-DQA1/HLA-DQA2/IFNG/IL1A/IL1B/IL6/ITGAL/JUN/TGFB1/TNF |
| Natural killer
cell-mediated | 0.009071911 |
CD247/FASLG/FCER1G/FCGR3A/HLA-A/IFNG/ITGAL/KIR2DL2/ |
| cytotoxicity |
|
KIR2DS2/KIR2DS3/KIR2DS4/KLRC1/KLRC3/KLRD1/KLRK1/NCR3/NFATC2/PPP3R1/PRF1/SH2D1B/TNF |
| Systemic lupus
erythematosus | 0.009071911 |
ACTN3/C1QA/C1QB/FCGR3A/HIST1H2AC/HIST1H2AD/HIST1H2AE/HIST1H2AM/HIST1H2BM/HIST1H3B/HIST1H3H/HIST1H4A/HIST1H4E/HIST2H2AA4/HIST2H2AB/HIST2H2BE/HLA-DPA1/HLA-DQA1/HLA-DQA2/IFNG/TNF |
| Type I diabetes
mellitus | 0.001139852 |
CPE/FASLG/HLA-A/HLA-DPA1/HLA-DQA1/HLA-DQA2/IFNG/IL1A/IL1B/PRF1/TNF |
| Chagas disease | 0.003387479 |
AKT1/C1QA/C1QB/CCL2/CCL3/CCL3L3/CCL5/CD247/FASLG/FOS/GNAO1/IFNG/IL1B/IL6/JUN/TGFB1/TNF |
| Antigen processing
and presentation | 0.005018711 |
HLA-A/HLA-DPA1/HLA-DQA1/HLA-DQA2/HSPA6/IFNG/KIR2DL2/KIR2DS2/KIR2DS3/KIR2DS4/KLRC1/KLRC3/KLRD1/TNF |
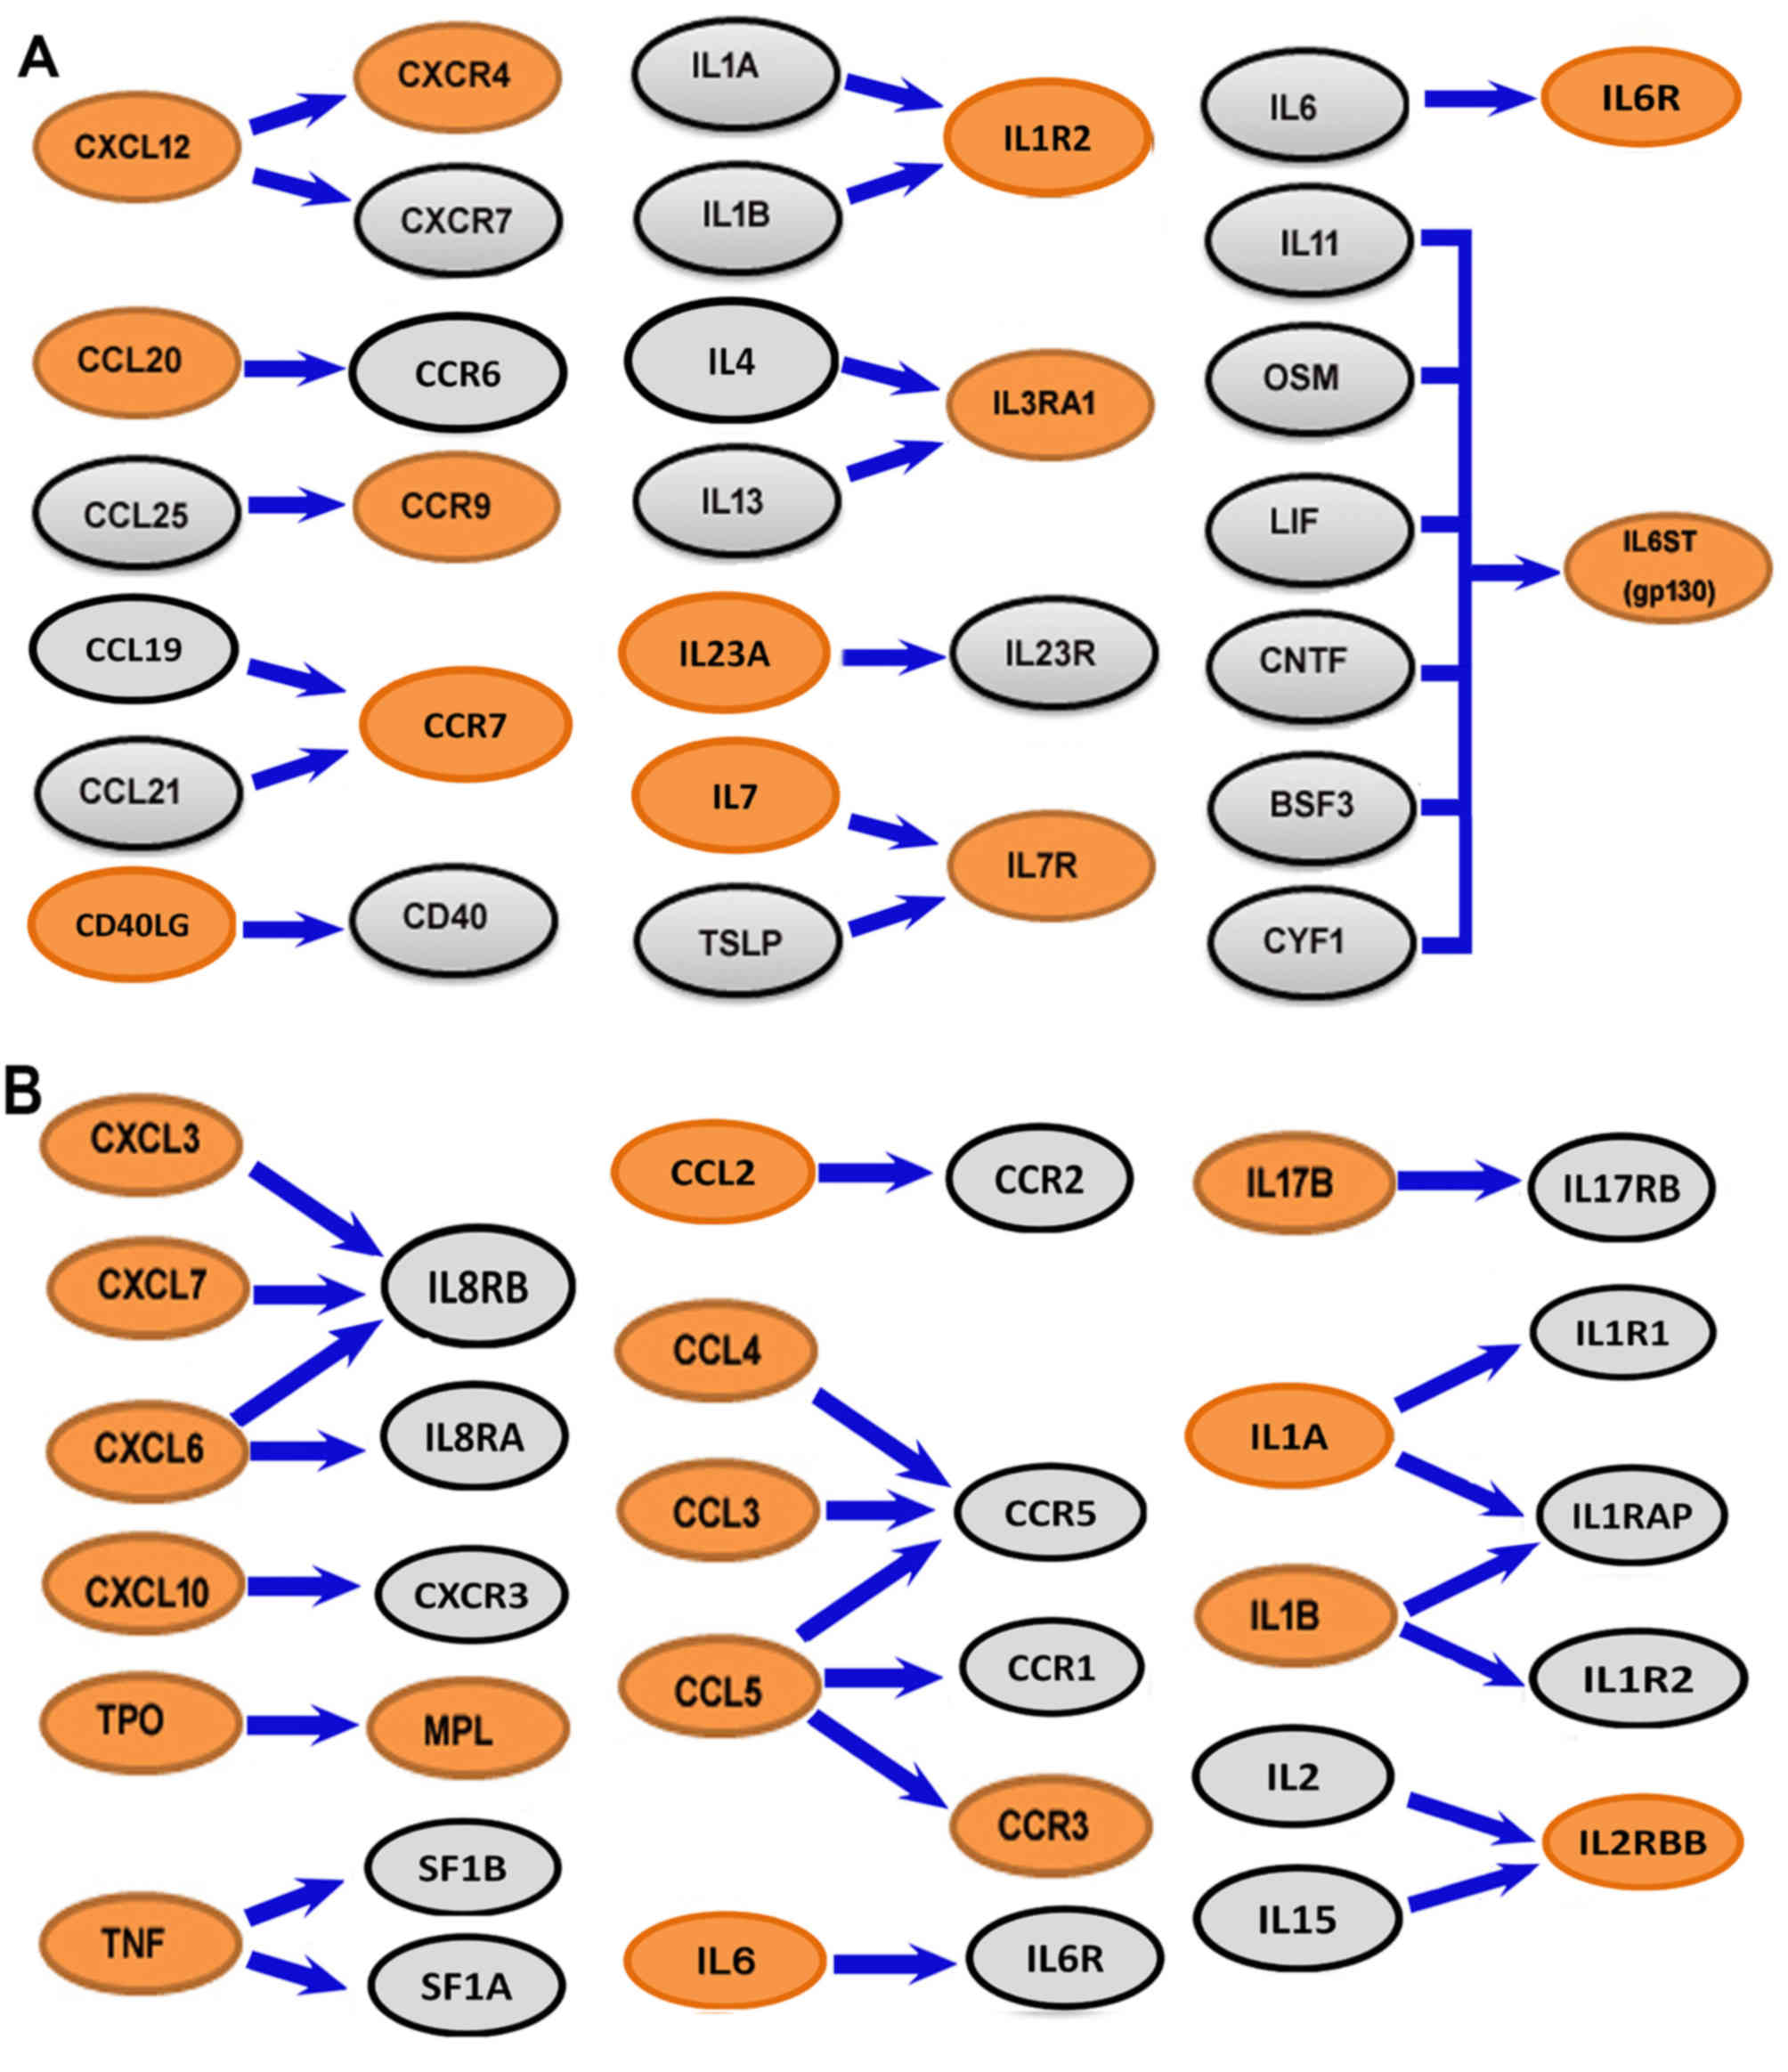
In the hematopoietic cell lineage signaling pathway,
the male group exhibited high expression of CD5, CD8B, CD20, CD21,
CD24, CD126, CD127 and IL-7 (Fig.
8A), which are mainly associated with lymphocyte function. By
contrast, the female group exhibited high expression of CD41, CD42,
CD61 and thrombopoietin (TPO), which are mainly associated with
platelet function (Fig. 8B).
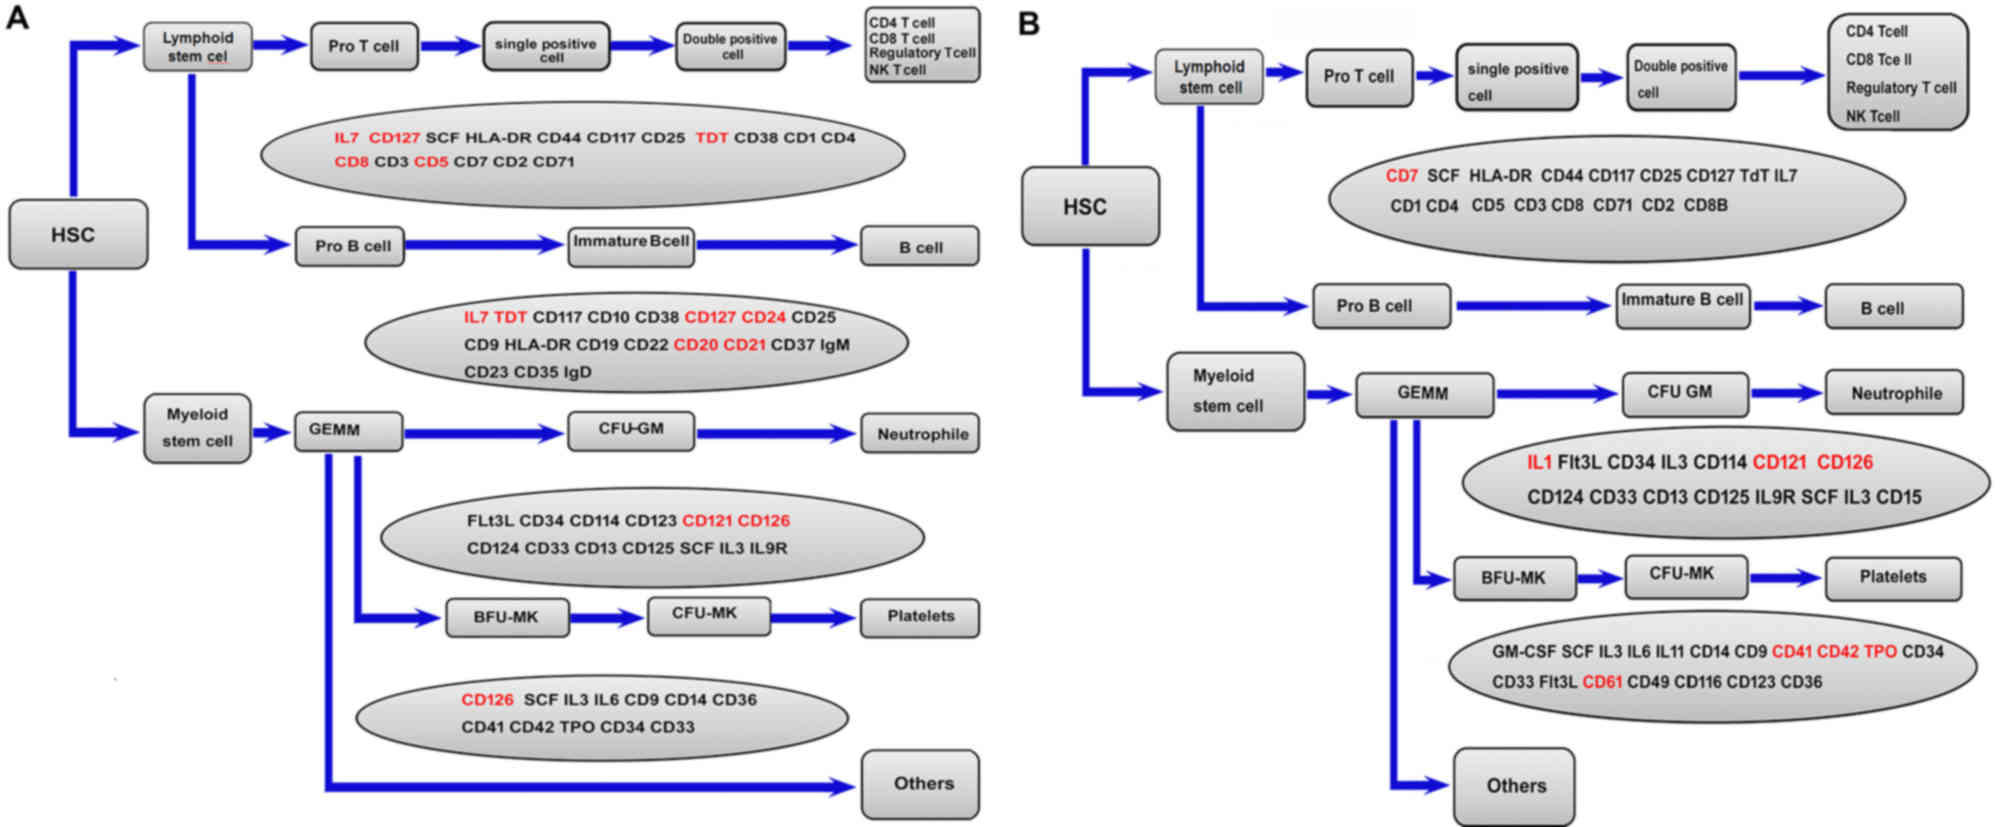 | Figure 8.Hematopoietic cell lineage signaling
pathway in the male and female groups. (A) Hematopoietic cell
lineage signaling pathway map in the male group. Genes indicated in
red were upregulated in the male group and those in gray were not
differentially expressed. (B) Hematopoietic cell lineage signaling
pathway map in the female group. Genes in red were upregulated in
females and those in gray were not significantly differentially
expressed. NK, natural killer; HSC, hematopoietic stem cell; CFU,
colony-forming units; CFU-GM, CFU-granulocyte, macrophage; BFU,
burst-forming unit; IL, interleukin; Ig, immunoglobulin, GEMM,
granulocyte, erythrocyte, monocyte and megakaryocyte; CFU-MK,
CFU-megakaryocyte. |
Regarding cytokine-cytokine receptor interaction
signaling pathways, the C-X-C motif chemokine ligand 12
(CXCL12)/C-X-C motif chemokine receptor 4 (CXCR4) pathway was
upregulated in the male group and the expression levels of IL-6
signal transducer (IL6ST) [glycoprotein (gp)130] and IL-7 receptor
(IL-7R) were significantly higher in cells from the male than in
the female group (Fig. 9A). However,
in the female group, more cytokines were expressed in
CD34+ cells, including C-C motif chemokine ligand 2
(CCL2), CCL3, CCL4, CCL5, CXCL3, CXCL6, CXCL7, CXCL10, IL1A, IL1B,
IL6, TPO and tumor necrosis factor (TNF) (Fig. 9B).
Higher expression of gp130 (CD130) and
IL-7R (CD127) in male CD34+ cells
In order to verify the results of the gene chip
analysis, FACS was used to validate the expression of two key
molecules in the male group, namely IL-7R (CD127) and gp130
(CD130). FSC/SSC scatter diagrams for the male and female groups
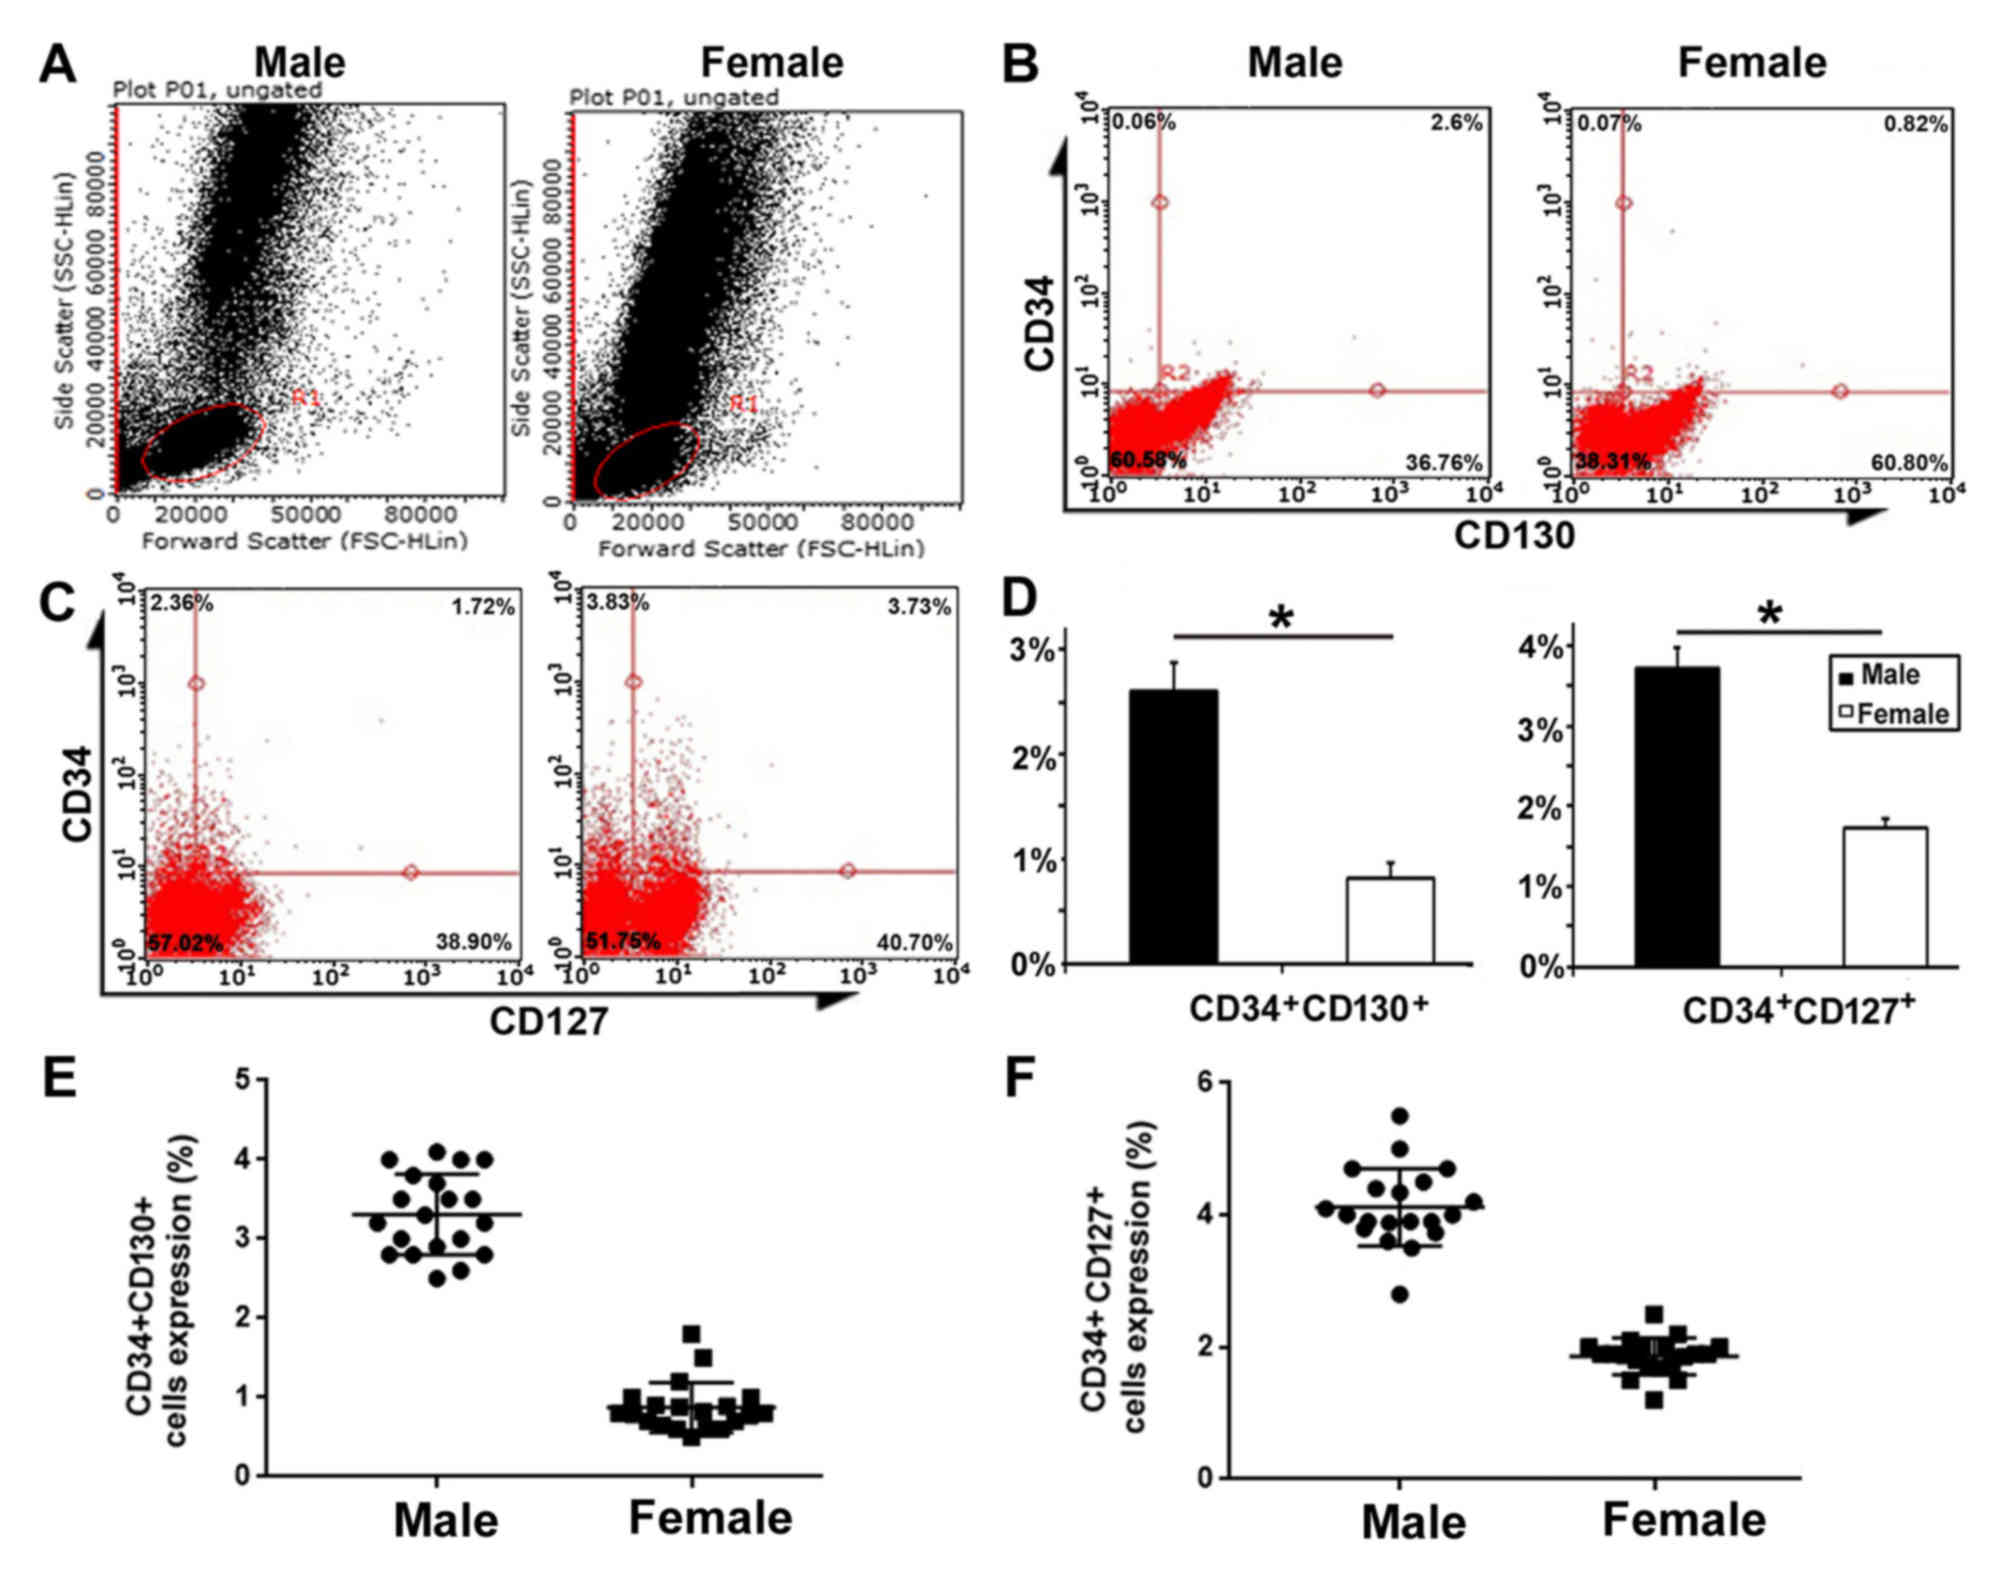
were gated on the overall cell population (Fig. 10A). The proportion of
CD34+CD127+ cells and
CD34+CD130+ cells were higher in the male
group compared with the female group. P<0.05; Fig. 10B-D). Statistical analysis of the
expression of CD34+CD130+ or
CD34+CD127+cells in the male and female
groups was detected by flow cytometry (Fig. 10E and F). These results are
consistent with those following gene chip analysis.
Discussion
The present study attempted to determine whether
neonatal gender affects the hematopoietic potential of CB
transplants and, if so, to determine the underlying molecular
mechanisms. The experimental results revealed a difference in the
concentration of CD34+ cells among CB MNCs between the
male and female groups prior to amplification. In the colony
formation assay, the number of CFUs and total cells in the male
group were higher than those in the female group. Furthermore, the
male group exhibited a higher number of CFU-Mix, and this result is
consistent with that of a previous study (8). Therefore, it may be hypothesized that
gender is a factor influencing HSC amplification.
In the next expansion experiment, it was observed
that the cells in the male group exhibited consistently higher
amplification efficiencies. However, the percentage of
CD34+CD38− cells was not significantly
different between the male and female groups.
The gene chip assay indicated that neonatal gender
affected the gene expression in CD34+ cells. In terms of
the underlying mechanisms, the experimental results indicated that
a large number of the upregulated DEGs were involved in chromosomal
segregation in the male group. Further study focused on the
analysis of signaling pathways associated with hematopoietic cell
proliferation. The hematopoietic cell lineages and
cytokine-cytokine receptor interaction signaling pathways were
upregulated in the male group. Further analysis indicated that the
genes CD5, CD8B, CD20, CD21, CD24, CD126, CD127 and IL-7 were
highly expressed in the male group. CD5 and CD8B belong to the
T-cell antigen phenotype, and CD20, CD21 and CD24 belong to the
B-cell antigen phenotype. Regarding cytokine-cytokine receptor
interaction signaling pathways, DEGs were upregulated in the
CXCL12/CXCR4, IL6ST (gp130), IL-7 and IL-7R pathways in the male
group. Based on the above analysis, it was hypothesized that the
reasons for the better expansion of CD34+ cells in the
male group may be as follows: i) The male group had a higher
expression of genes associated with chromosome segregation.
Combined with the fact that DEGs involved in the positive
regulation of cell proliferation were upregulated, it was
speculated that male CB CD34+ cells have more
opportunities to enter the mitosis period, which is conducive to
cell proliferation. This may explain for the observation that,
under the same culture conditions, CB CD34+ cells from
males exhibited higher amplification efficiencies than those from
females. ii) DEGs associated with lymphocyte proliferation,
activation and other functions, including CD5, CD8B, CD20, CD21,
CD24, CD126, CD127, IL-7 and IL-7R, were highly expressed in the
male group. The major physiological role of IL-7 is to promote T/B
lymphocyte development. IL-7 may promote the growth of B-progenitor
cells, thymocytes and peripheral mature T cells derived from human
or mouse bone marrow (15).
According to FACS, CD127 antigens were more highly expressed in
male CB CD34+ cells. These results were consistent with
those of the gene chip assay. iii) The expression of IL6ST (gp130)
was obviously higher in the male group. According to previous
studies (16–18), peripheral blood (PB)-derived CD34+
cells ubiquitously express gp130 (19). Gp130 forms the β subunit of IL-6R,
which is composed of the IL-6 α-receptor and the β-subunit
glycoprotein 130. It is well documented that signals activated by
IL-6 are transmitted through the signal-transducing gp130 (20). The physiological role of IL-6 is to
stimulate B and T cell proliferation and secretion of antibodies
(21). The expression of CD5, CD8B,
CD20, CD21, CD24, CD126, CD127, IL-7, IL-7R and IL6ST were
significantly higher in male CB CD34+ cells. According
to FACS, CD130 membrane surface antigens were more highly expressed
in CD34+ cells from male CB. These results were
consistent with those of the gene chip. They suggest that there may
be more lymphoid progenitor cells in the CD34+ HSCs and
hematopoietic progenitor cells (HSP) population, or that
CD34+ cells of the male group more easily differentiated
into lymphoid progenitor cells. iv) Finally, the CXCL12/CXCR4
pathway was upregulated in the male group. Mice lacking either
CXCL12 or CXCR4 exhibit similar embryonic lethal defects, including
impaired myeloid and B-cell hematopoiesis (22–24).
CXCL12 is a crucial factor involved in the migration, retention,
and mobilization of HSCs during homeostasis and after injury, and
its corresponding receptor is CXCR4. Collectively, the genetic and
functional data indicate that the CXCL12/CXCR4 pathway is crucial
for the retention and maintenance of adult HSCs (25). Therefore, it may be speculated that
the upregulation of this signaling pathway in the male group is
conducive to the maintenance of HSC characteristics and functions.
Together, these four points may partially explain why the
CD34+ cells from CB of male neonates exhibit an
increased amplification capacity.
In the female group, the results revealed an
increased expression of platelet phenotype-associated genes,
including CD41, CD42, TPO and CD61, suggesting that the
CD34+ cells from CB of female neonates may exhibit
increased platelet activation and coagulation functions. In
addition, female cells expressed more chemokines, including CCL2,
CCL3, CCL4, CCL5, CXCL3, CXCL6, CXCL7, CXCL10, 1L1A, 1L1B, IL6, TPO
and TNF. This may indicate that the CD34+ cells in the
female group have a better migration/chemotaxis ability than those
in the male group.
In conclusion, the present study indicated that
gender may affect the hematopoietic potential of CB. Whether this
difference has any clinical consequences remains to be determined.
Careful selection of the best CB units for transplantation may
improve the efficiency of this source of HSCs and HSPs in adult
transplantation settings and reduce the cost of processing
(26). The experimental results of
the present study may therefore provide a reference for the
clinical selection of CB and insight into potential treatments for
certain types of hematological disorder.
Acknowledgements
Not applicable.
Funding
The current study was supported by grants from the
Shandong Province Key R&D Fund (grant nos. 2017GSF18155 and
2017GSF218015), the Shandong Province Natural Science Fund (grant
no. 2014ZRE27630), the Ji'nan Science and Technology Development
Plan (grant no. 201704066) and the National Natural Science
Foundation of China (grant no. 81473484).
Availability of data and materials
The datasets used and/or analyzed during the current
study are available from the corresponding author on reasonable
request.
Authors' contributions
DL and XJ contributed to the study design. PZ, XL,
XX and QS performed the experiments. LZ, ZC and XZ performed the
statistical analysis and interpreted the data. LZ prepared the
manuscript. All authors read and approved the final manuscript.
Ethical approval and consent to
participate
The current study was approved by the Ethics
Committee of Shandong University Qilu Hospital (Jinan, China).
Written informed consent was obtained from all donors.
Patient consent for publication
Not applicable.
Competing interests
The authors declare that they have no competing
interests.
References
|
1
|
Seita J and Weissman IL: Hematopoietic
stem cell: Self-renewal versus differentiation. Wiley Interdiscip
Rev SystBiol Med. 2:640–653. 2010. View
Article : Google Scholar
|
|
2
|
Möbest D, Mertelsmann R and Henschler R:
Serum-free ex vivo expansion of CD34(+) hematopoietic progenitor
cells. Biotechnol Bioeng. 60:341–347. 1998. View Article : Google Scholar : PubMed/NCBI
|
|
3
|
Hao QL, Shah AJ, Thiemann FT, Smogorzewska
EM and Crooks GM: A functional comparison of
CD34+CD38− cells in cord blood and bone
marrow. Blood. 86:3745–3753. 1995.PubMed/NCBI
|
|
4
|
Bhatia M, Wang JC, Kapp U, Bonnet D and
Dick JE: Purification of primitive human hematopoietic cells
capable of repopulating immune-deficient mice. Proc Natl Acad Sci
USA. 94:5320–5325. 1997. View Article : Google Scholar : PubMed/NCBI
|
|
5
|
Rocha V, Wagner JE Jr, Sobocinski KA,
Klein JP, Zhang MJ, Horowitz MM and Gluckman E: Graft-versus-host
disease in children who have received a cord-blood or bone marrow
transplant from an HLA-identical sibling. Eurocord and
international bone marrow transplant registry working committee on
alternative donor and stem cell sources. N Engl J Med.
342:1846–1854. 2000. View Article : Google Scholar : PubMed/NCBI
|
|
6
|
Chou S, Chu P, Hwang W and Lodish H:
Expansion of human cord blood hematopoietic stem cells for
transplantation. Cell Stem Cell. 7:427–428. 2010. View Article : Google Scholar : PubMed/NCBI
|
|
7
|
Horwitz ME and Frassoni F: Improving the
outcome of umbilical cord blood transplantation through ex vivo
expansion or graft manipulation. Cytotherapy. 17:730–738. 2015.
View Article : Google Scholar : PubMed/NCBI
|
|
8
|
Aroviita P, Teramo K, Hiilesmaa V and
Kekomäki R: Cord blood hematopoietic progenitor cell concentration
and infant sex. Transfusion. 45:613–621. 2005. View Article : Google Scholar : PubMed/NCBI
|
|
9
|
Bijou F, Ivanovic Z, Fizet D, Dazey B,
Boiron JM and Lafarge X: Neonatal sex and weight influence CD34(+)
cell concentration in umbilical cord blood but not stromal
cell-ederived factor 1–3′ A polymorphism. Cytotherapy. 17:68–72.
2015. View Article : Google Scholar : PubMed/NCBI
|
|
10
|
Robinson S, Niu T, de Lima M, Ng J, Yang
H, McMannis J, Karandish S, Sadeghi T, Fu P, del Angel M, et al: Ex
vivo expansion of umbilical cord blood. Cytotherapy. 7:243–250.
2005. View Article : Google Scholar : PubMed/NCBI
|
|
11
|
Sauvageau G, Iscove NN and Humphries RK:
In vitro and in vivo expansion of hematopoietic stem
cells. Oncogene. 23:7223–7232. 2004. View Article : Google Scholar : PubMed/NCBI
|
|
12
|
Ramalho-Santos M, Yoon S, Matsuzaki Y,
Mulligan RC and Melton DA: ‘Stem ness’: Transcriptional profiling
of embryonic and adult stem cells. Science. 298:597–600. 2002.
View Article : Google Scholar : PubMed/NCBI
|
|
13
|
Fortunel NO, Out HH, Ng HH, Chen J, Mu X,
Chevassut T, Li X, Joseph M, Bailey C, Hatzfeld JA, et al: Comment
on “‘Stemness’: Transcriptional profiling of embryonic and adult
stem cells” and ‘a stem cell molecular signature’. Science.
302:3932003. View Article : Google Scholar : PubMed/NCBI
|
|
14
|
Ivanova NB, Dimos JT, Schaniel C, Hackney
JA, Moore KA and Lemischka IR: A stem cell molecular signature.
Science. 298:601–604. 2002. View Article : Google Scholar : PubMed/NCBI
|
|
15
|
Alves NL, Richard-Le Goff O, Huntington
ND, Sousa AP, Ribeiro VS, Bordack A, Vives FL, Peduto L, Chidgey A,
Cumano A, et al: Characterization of the thymic IL-7 niche in
vivo. Proc Natl Acad Sci USA. 106:1512–1517. 2009. View Article : Google Scholar : PubMed/NCBI
|
|
16
|
Kimura T, Sakabe H, Tanimukai S, Abe T,
Urata Y, Yasukawa K, Okano A, Taga T, Sugiyama H, Kishimoto T and
Sonoda Y: Simultaneous activation of signals through gp130, c-kit,
and interleukin-3 receptor promotes a trilineage blood cell
production in the absence of terminally acting lineage-specific
factors. Blood. 90:4767–4778. 1997.PubMed/NCBI
|
|
17
|
Sonoda Y, Sakabe H, Ohmisono Y, Tanimukai
S, Yokota S, Nakagawa S, Clark SC and Abe T: Synergistic actions of
stem cell factor and other burst-promoting activities on
proliferation of CD34+ highly purified blood progenitors expressing
HLA-DR or different levels of c-kit protein. Blood. 84:4099–4106.
1994.PubMed/NCBI
|
|
18
|
Minamiguchi H, Yahata N, Kimura T, Fujiki
H, Harada S, Wang J, Okuda K, Kaneko H, Hodohara K, Banba T, et al:
Interleukin-6 receptor expression by human cord blood- or
peripheral blood-derived primitive haematopoietic progenitors
implies acqusition of different functional properties. Br J
Haematol. 110:327–328. 2000. View Article : Google Scholar : PubMed/NCBI
|
|
19
|
Kimura T, Wang J, Minamiguchi H, Fujiki H,
Harada S, Okuda K, Kaneko H, Yokota S, Yasukawa K, Abe T and Sonoda
Y: Signal through gp130 activated by soluble interleukin (IL)-6
receptor (R) and IL-6 or IL-6R/IL-6 fusion protein enhances ex vivo
expansion of human peripheral blood-derived hematopoietic
progenitors. Stem Cells. 18:444–452. 2000. View Article : Google Scholar : PubMed/NCBI
|
|
20
|
Wolf J, Rose-John S and Garbers C:
Interleukin-6 and its receptors: A highly regulated and dynamic
system. Cytokine. 70:11–20. 2014. View Article : Google Scholar : PubMed/NCBI
|
|
21
|
Mihara M, Hashizume M, Yoshida H, Suzuki M
and Shiina M: IL-6/IL-6 receptor system and its role in
physiological and pathological conditions. Clin Sci (Lond).
122:143–159. 2012. View Article : Google Scholar : PubMed/NCBI
|
|
22
|
Lapidot T and Petit I: Current
understanding of stem cell mobilization: The roles of chemokines,
proteolytic enzymes, adhesion molecules, cytokines, and stromal
cells. Exp Hematol. 30:973–981. 2002. View Article : Google Scholar : PubMed/NCBI
|
|
23
|
Nagasawa T, Hirota S, Tachibana K,
Takakura N, Nishikawa S, Kitamura Y, Yoshida N, Kikutani H and
Kishimoto T: Defects of B-cell lymphopoiesis and bone-marrow
myelopoiesis in mice lacking the CXC chemokine PBSF/SDF-1. Nature.
382:635–638. 1996. View Article : Google Scholar : PubMed/NCBI
|
|
24
|
Zou YR, Kottmann AH, Kuroda M, Taniuchi I
and Littman DR: Function of the chemokine receptor CXCR4 in
haematopoiesis and in cerebellar development. Nature. 393:595–599.
1998. View Article : Google Scholar : PubMed/NCBI
|
|
25
|
Wilson A and Trumpp A: Bone-marrow
haematopoietic-stem-cell niches. Nat Rev Immunol. 6:93–106. 2006.
View Article : Google Scholar : PubMed/NCBI
|
|
26
|
Lane TA: Umbilical cord blood grafts for
hematopoietic transplantation in adults: A cup half empty or half
full? Transfusion. 45:1027–1034. 2005. View Article : Google Scholar : PubMed/NCBI
|