Introduction
Diabetes is a metabolic disease with a prevalence of
~9% worldwide according to the World Health Organization (1). Currently, ~387 million people suffer
from diabetes, with this number predicted to rise to ~597 million
by 2035 (2). Previous studies have
reported that diabetic patients are more susceptible to infection
than non-diabetic patients. For example, Shah et al
(3) confirmed that diabetic patients
exhibited an increased prevalence of infections compared to the
nondiabetic population with the highest incidence of osteomyelitis,
pyelonephritis, cystitis, pneumonia, cellulitis, sepsis and
peritonitis. Muller et al (4)
also demonstrated that diabetic patients were more predisposed to
lower respiratory tract infections, urinary tract infections,
bacterial skin infections and mucous membrane infections than
non-diabetic patients. In addition, Korbel et al (5) revealed that infection was the cause for
10% of emergency room visits among diabetic patients, and the
incidence of infection in diabetic patients was two-fold higher
than that of their non-diabetic counterparts. Hine et al
(6) reported that almost all kinds
of infections were common in diabetic patients, and bacterial,
fungal or yeast infections were more prevalent in people with poor
blood glucose control.
Precise prediction of infection and its severity in
diabetic patients serves an important role in improving infection
control and prognosis. At present, the ‘gold standard’ for the
diagnosis of infections, in particular of blood infections, is by
bacterial culture (7). However, the
long testing period and poor sensitivity of bacterial culture used
routinely in the clinic limits the standardized use of antibiotics.
Therefore, it is necessary to identify useful predictive serum
markers for infection in diabetic patients. C-reactive protein
(CRP) has been regarded as an early indicator of infection or
inflammation in addition to being a universal biomarker for
numerous diseases and disorders such as myocardial infarction and
neoplastic diseases (8). White blood
count (WBC) and neutrophil percent (N%) have also been
traditionally used as markers for inflammation.
Procalcitonin (PCT) is the precursor of calcitonin
and is secreted mainly by thyroidal parafollicular C-cells under
normal conditions (9). However,
during infection, PCT is ectopically secreted into the peripheral
bloodstream by neuroendocrine cells of the liver, peripheral blood
monocytes, macrophages, spleen, lung, small intestine and kidneys
(10). Serum PCT levels increase
rapidly as bacterial infection advances, but remain low during
viral infections and non-specific inflammatory diseases such as
ulcerative colitis (11). Until
recently, changes in serum PCT levels of patients afflicted with
type 2 diabetes mellitus (T2DM) following the onset of infection
have not been well studied. Therefore, in the present study, the
value of PCT for predicting infection in patients with T2DM was
explored by comparing with different indicators of inflammation in
patients with T2DM afflicted with different degrees of
infection.
Materials and methods
General patient information
This study retrospectively analyzed 178 patients
with T2DM (78 males; 100 females) at the Endocrinology Department
of The Third Affiliated Hospital of Soochow University (Changzhou,
China) between November 2013 and February 2017. The study was
approved by the ethics committee of Soochow University
(2019-WD-003) and patients signed informed consent forms. The
patients in this study were between 22 and 95 years old with the
average age of 62±16 years, and a disease duration ranging between
1 day and 19 years since diagnosis. The inclusion criteria were
patients with T2DM diagnosed according to the 1999 WHO diabetes
diagnosis and classification criteria (12). Patients with type 1 diabetes,
gestational diabetes and other rarer types of diabetes (e.g.
genetic defects of beta-cell function) were excluded. Infection
definition was based on the standardized criteria proposed by the
Center for Disease Control and Prevention i.e. it already existed
prior to hospitalization and was assessed based on disease history,
symptoms, body temperature, etiological tests and improvement
following antibiotics treatment. Sepsis was defined in accordance
to the Sepsis-3 definitions of the Third International Consensus
Definitions for Sepsis and Septic Shock (13). All patients were further classified
into the non-infection (29 cases), local infection (125 cases) and
sepsis groups (24 cases). In addition, 33 healthy individuals (19
males and 14 females) with an average age of 61±14 years old who
did not suffer from liver and kidney dysfunction or chronic
diseases were included in the control group. Pregnant women,
lactating women, patients receiving antibiotics within one week
prior to admission and patients afflicted with acute complications
from diabetes such as shock, autoimmune diseases, surgery, trauma,
shock, severe liver and kidney dysfunction (glomerular filtration
rate <30 ml/min), pancreatitis, cancer and blood system diseases
were all excluded.
Observation indexes
The sex, age, body mass index (BMI), disease
histories (including disease diagnosis, past history and personal
history), comorbidities, infection sites and vital signs at
admission in addition to the highest body temperature of the
patients were recorded after admission. Blood samples were
extracted from the patients within 24 h of admission prior to
antibiotics treatment and used to measure inflammatory markers
including WBC (normal range: 4–10×109/l), N% (normal range:
40–75%), PCT (normal range: 0.021–0.500 ng/ml) and CRP (normal
range: 0–10.0 mg/l). Complete blood count was examined using a
Sysmex XN9000 hematology analyzer (Sysmex Corporation). PCT was
measured using a Roche Cobas 8000 modular analyzer (Roche
Diagnostics). CRP was measured using a Beckman Coulter AU5800
chemistry analyzer (Beckman Coulter, Inc.). Blood culture was
performed using the BD BACTEC FX blood culture system (BD
Biosciences).
Statistical analysis
Data were analyzed using SPSS v15.0 (SPSS Inc.). The
measurement of data with normal distribution and non-normal
distribution were presented as the mean ± standard deviation, and
median and percentiles P50 (P25; P75), respectively. The count data
were expressed as numbers or %. Data exhibiting normal distribution
were compared using independent-samples t-test or one-way analysis
of variance followed by Student-Newman-Keuls post hoc test. Data
demonstrating non-normal distribution were compared using
Mann-Whitney U test and Kruskal-Wallis H test. Rates were compared
using the χ2 test. The receiver operating characteristic (ROC)
curves and the area under the curve (AUC) were used to compare the
diagnostic efficacy of different indices. The sensitivity and
specificity were calculated, and the cutoff value was determined by
the Youden index. P<0.05 was considered to indicate a
statistically significant difference.
Results
Comparison of clinicopathological
characteristics between patients with T2DM in the non-infection
group and healthy controls
A comparison of clinicopathological characteristics
between two groups is presented in Table
I to illustrate the higher baseline inflammation index of
patients with T2DM in the non-infection group compared with healthy
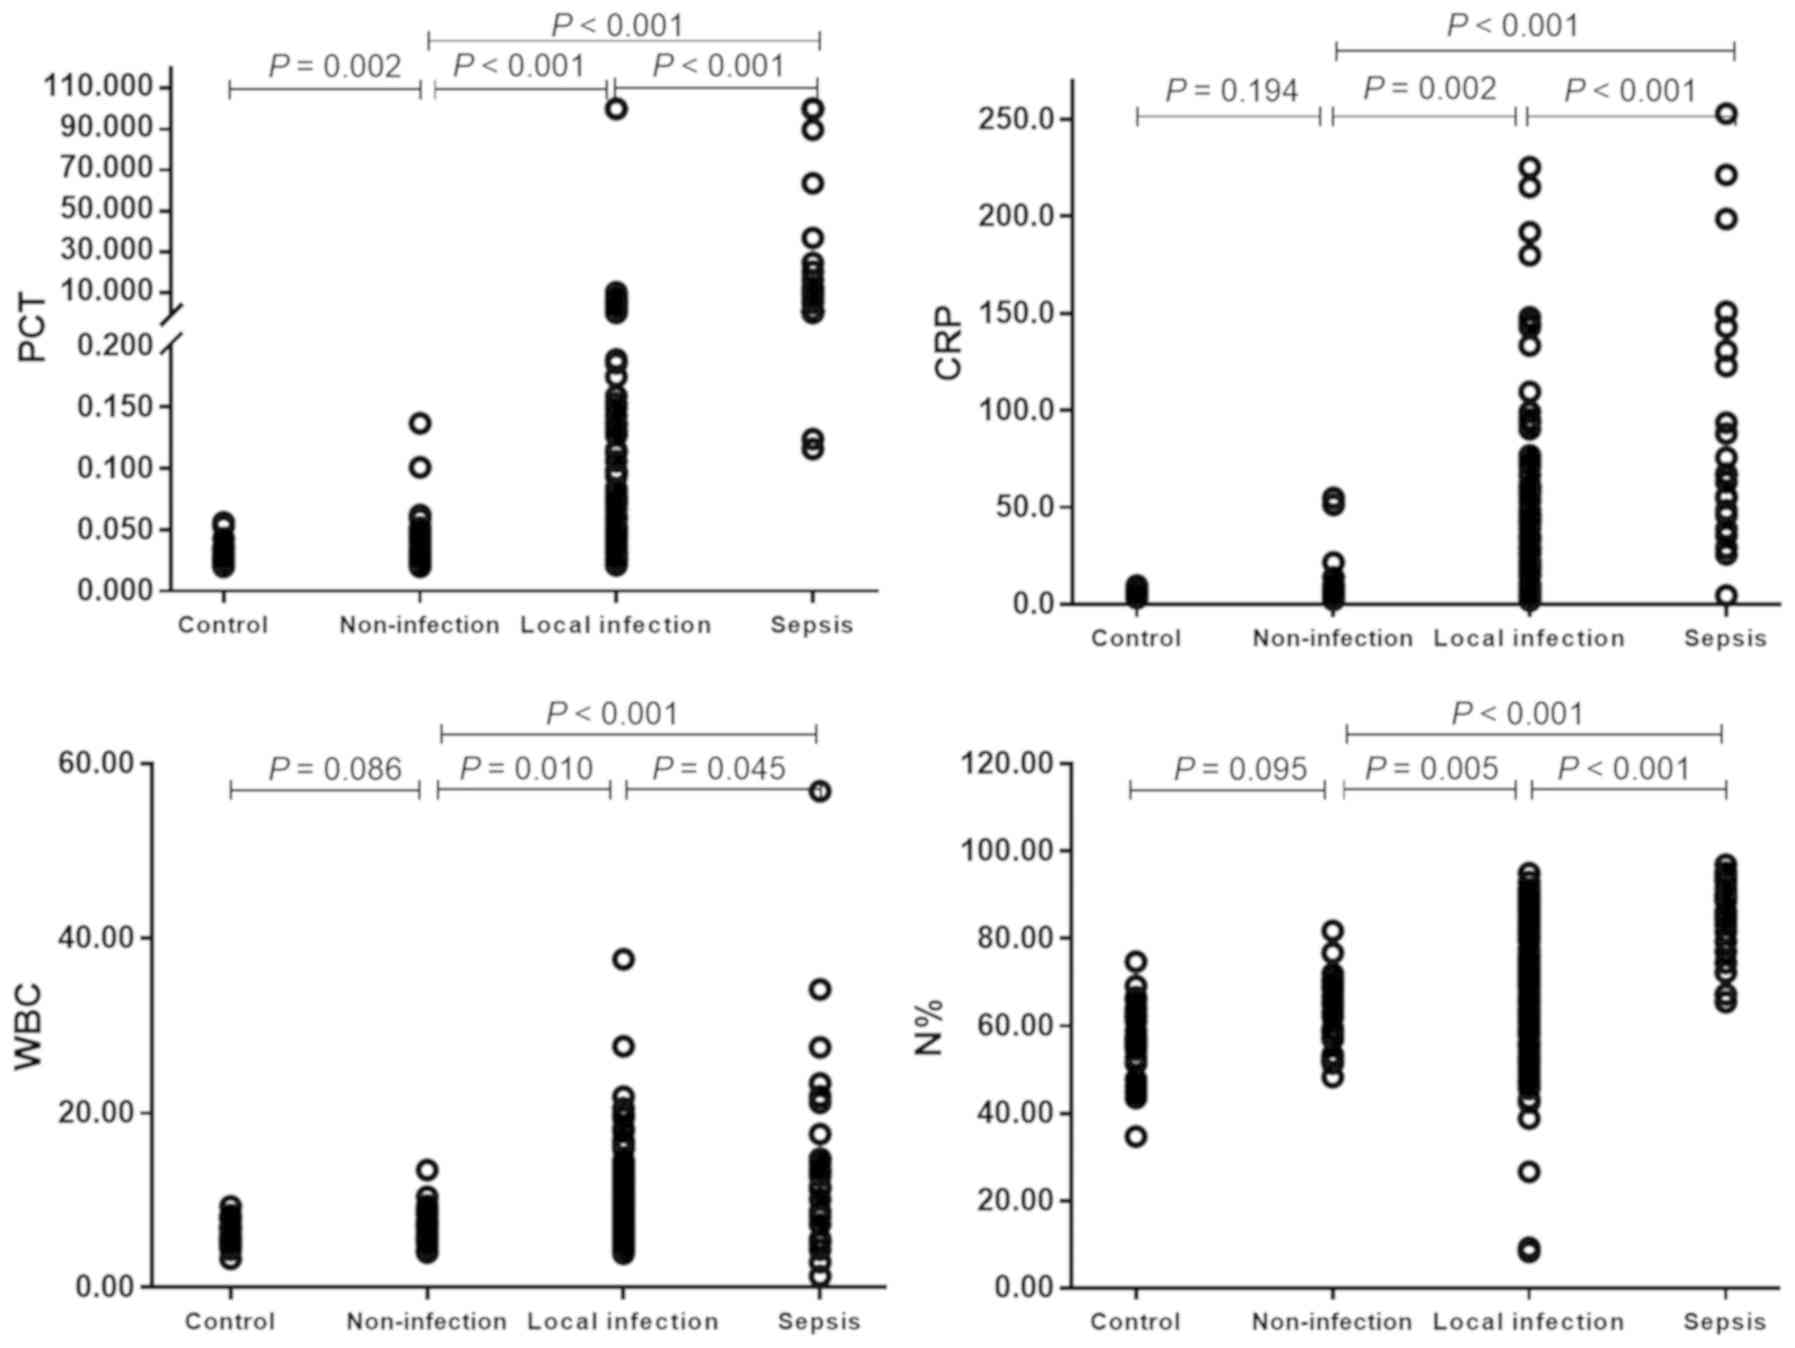
controls. No significant differences were identified between the
two groups in relation to average age, proportion of male, BMI,
baseline CRP, WBC and N% (all P>0.05; Table I; Fig.
1); however, patients with T2DM in the non-infection group
exhibited significantly higher baseline PCT compared with the
healthy controls (P=0.002).
 | Table I.Comparison of clinicopathological
characteristics between the non-infection group of patients with
type 2 diabetes and healthy control group. |
Table I.
Comparison of clinicopathological
characteristics between the non-infection group of patients with
type 2 diabetes and healthy control group.
| Clinicopathological
characteristic | Control (n=33) | Non-infection
(n=29) |
Z/χ2/t | P-value |
|---|
| Age (years) | 61±14 | 62±15 | −0.182 | 0.857 |
| Male (%) | 19 (57.6) | 12 (41.4) | 1.620 | 0.203 |
| BMI
(kg/m2) | 24.2±2.9 | 24.5±4.0 | 0.394 | 0.695 |
| Clinical
parameters |
|
|
|
|
| PCT
(ng/ml) | 0.025 (0.020;
0.032) | 0.034 (0.025;
0.049) | −3.049 | 0.002 |
| CRP
(mg/l) | 5.4 (4.1; 7.1) | 6.5 (4.2;
10.0) | −1.300 | 0.194 |
| WBC
(×109 cells/l) | 5.61 (5.07;
6.90) | 6.03 (5.50;
8.06) | −1.086 | 0.086 |
| N% | 58.9 (53.4;
63.2) | 62.1 (55.2;
68.9) | −1.672 | 0.095 |
Comparison of clinical characteristics
and inflammatory indicators between patients with T2DM in
non-infection, local infection and sepsis groups
Comparisons of clinicopathological characteristics
and inflammatory indicators among patients with T2DM in the
non-infection, local infection and sepsis groups are presented in
Table II and Fig. 1. Age, male proportion, BMI and
comorbidity proportion (hypertension, nephropathy and diabetic
ketoacidosis (DKA) were not revealed to be significantly different
across the three different groups (all P>0.05; Table II). However, patients in the sepsis
group demonstrated a significantly higher proportion of urinary
tract infections compared with patients in the local infection
group (50.0 vs. 16.0%, respectively; P<0.001; Table II), whereas the proportions of other
infections were not significantly different between the two groups
(all P>0.05).
| Table II.Comparison of clinicopathological
characteristics and inflammatory markers among patients with type 2
diabetes in non-infection, local infection and sepsis groups. |
Table II.
Comparison of clinicopathological
characteristics and inflammatory markers among patients with type 2
diabetes in non-infection, local infection and sepsis groups.
| Clinicopathological
characteristic | Non-infection
(n=29) | Local infection
(n=125) | Sepsis (n=24) |
F/χ2 | P-value |
|---|
| Age (years) | 62±15 | 62±17 | 68±12 | 1.876 | 0.156 |
| Male (%) | 12 (41.4) | 60 (48.0) | 6 (25.0) | 4.410 | 0.110 |
| BMI
(kg/m2) | 24.5±4.0 | 24.5±3.6 | 22.7±3.5 | 1.281 | 0.281 |
| Comorbidities |
|
|
|
|
|
|
Hypertension (%) | 13 (44.8) | 68 (54.4) | 11 (45.8) | 1.244 | 0.537 |
|
Nephropathy (%) | 5 (17.2) | 21 (16.8) | 4 (16.7) | 0.004 | 0.988 |
| DKA
(%) | n/a | 17 (13.6) | 1 (4.2) | 0.916 | 0.339 |
| Infection
location |
|
|
|
|
|
|
Respiratory tract (%) | n/a | 61 (48.8) | 7 (29.2) | 3.128 | 0.077 |
|
Digestive tract (%) | n/a | 24 (19.2) | 5 (20.8) | 0.034 | 0.853 |
| Urinary
tract (%) | n/a | 20 (16.0) | 12 (50.0) | 13.802 |
<0.001 |
| Skin
(%) | n/a | 24 (19.2) | 3 (12.5) | 0.241 | 0.623 |
| Others
(%) | n/a | 21 (16.8) | 3 (12.5) | 0.049 | 0.825 |
| Clinical
parameters |
|
|
|
|
|
| PCT
(ng/ml) | 0.034 (0.025;
0.049) | 0.098 (0.039;
0.413) | 10.205 (1.085;
33.900) | 63.773 |
<0.001 |
| CRP
(mg/l) | 6.5 (4.2;
10.0) | 25.5 (7.0;
52.9) | 67.1 (44.2;
133.9) | 34.471 |
<0.001 |
| WBC
(×109 cells/l) | 6.03 (5.50;
8.06) | 8.48 (6.10;
10.96) | 13.04 (7.48;
20.26) | 17.496 |
<0.001 |
| N% | 62.1 (55.2;
68.9) | 72.9 (59.7;
82.4) | 88.8 (79.9;
92.7) | 39.483 |
<0.001 |
The blood levels of the four inflammatory markers
tested (PCT, WBC, CRP and N%) all exhibited significant differences
between patients from the three infection groups (all P<0.001;
Table II; Fig. 1), ranking from high to low: Sepsis
group > local infection group > non-infection group (all
P<0.001; Fig. 1).
ROC analysis of using different
inflammatory indicators to predict patients with T2DM with local
infection
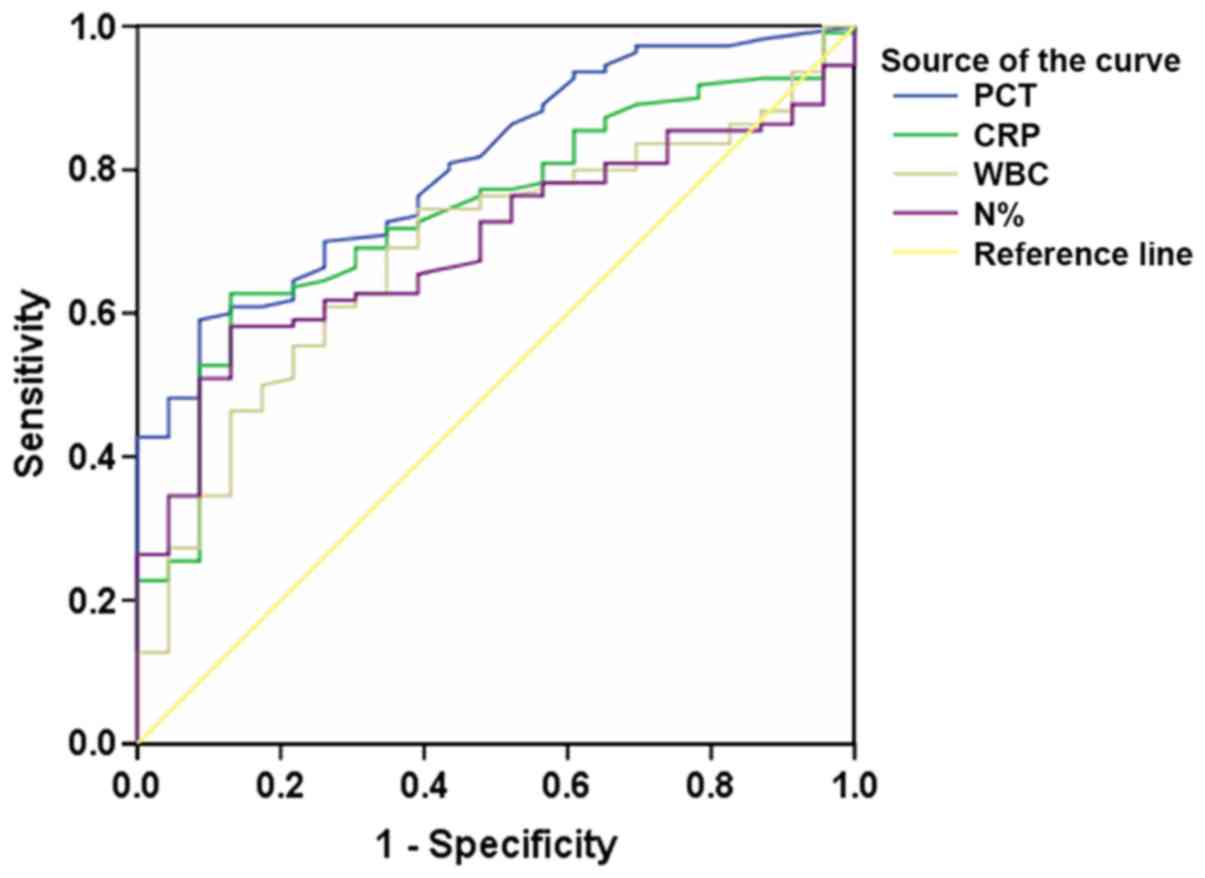
ROC curves using PCT, CRP, WBC and N% to predict
local infection in patients with T2DM were analyzed (Fig. 2; Table
III). The AUCs corresponding to PCT and CRP, which may be used
to predict local infection of patients with T2DM, were demonstrated
to be relatively higher (0.804 and 0.741, respectively) compared
with WBC and N%. By contrast, the sensitivities of PCT, WBC and N%
were revealed to be very low, with values of 21.8, 32.3 and 41.8%
at their classical cutoff points at 0.500, 10.0 and 75 ng/ml,
respectively (Table III). In
comparison, the sensitivity of CRP was determined to be high, with
a value of 64.1% at its classical cutoff point at 10.0 mg/l,
whereas its specificity was 76.1%, compared with that of 100, 91.3
and 91.3% for PCT, WBC and N% respectively.
| Table III.A summary of receiver operating
characteristic curve analysis using PCT, CRP, WBC and N% to predict
local infection in patients with type 2 diabetes. |
Table III.
A summary of receiver operating
characteristic curve analysis using PCT, CRP, WBC and N% to predict
local infection in patients with type 2 diabetes.
| Indicator | AUC | P-value | 95% CI | Cutoffa | Sensitivity
(%)a | Specificity
(%)a |
|---|
| PCT | 0.804 | <0.001 | 0.719–0.889 | 0.046b | 70.0 | 73.9 |
|
|
|
|
|
0.500b | 21.8 | 100.0 |
| CRP | 0.741 | <0.001 | 0.643–0.839 | 8.2c | 69.1 | 69.6 |
|
|
|
|
|
10.0c | 64.1 | 76.1 |
| WBC | 0.687 | 0.005 | 0.580–0.793 | 7.41d | 60.9 | 73.9 |
|
|
|
|
|
10.00d | 32.3 | 91.3 |
| N% | 0.696 | 0.003 | 0.601–0.791 | 70.8e | 58.2 | 87.0 |
|
|
|
|
| 75e | 41.8 | 91.3 |
ROC analysis of using different
inflammatory indicators to predict sepsis in patients with
T2DM
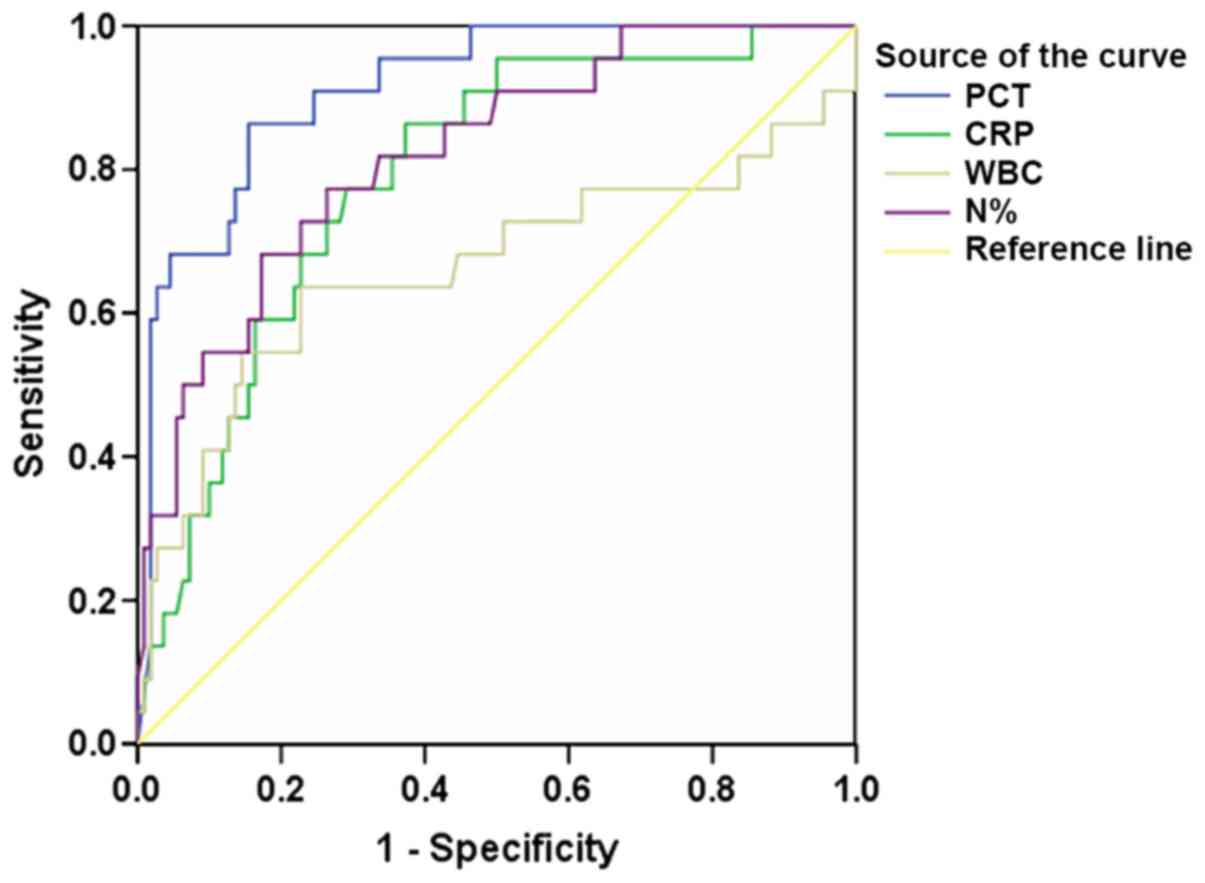
The ROC curves of using inflammatory indicators PCT,
CRP, WBC and N% to predict sepsis in patients with T2DM is
presented in Fig. 3, and a summary
of the ROC analyses is presented in Table IV. Of the four inflammatory
indicators tested that could predict sepsis in patients with T2DM,
PCT exhibited the largest AUC (0.914), the highest sensitivity
(86.4%) and the best specificity (84.5%) with its cutoff value at
0.990 ng/ml (Table IV).
| Table IV.A summary of receiver operating
characteristic curve analysis using PCT, CRP, WBC and N% to predict
sepsis in patients with type 2 diabetes. |
Table IV.
A summary of receiver operating
characteristic curve analysis using PCT, CRP, WBC and N% to predict
sepsis in patients with type 2 diabetes.
| Indicator | AUC | P-value | 95% CI | Cutoff | Sensitivity
(%) | Specificity
(%) |
|---|
| PCT | 0.914 | <0.001 | 0.855–0.972 | 0.990a | 86.4 | 84.5 |
| CRP | 0.790 | <0.001 | 0.694–0.886 | 47.9b | 77.3 | 70.9 |
| WBC | 0.662 | 0.017 | 0.506–0.817 | 11.15c | 63.6 | 77.3 |
| N% | 0.822 | <0.001 | 0.728–0.916 | 81.5d | 77.3 | 73.6 |
Discussion
Results from the present study revealed that
patients with T2DM in the non-infection group exhibited increased
baseline PCT levels. Patients with T2DM are afflicted with chronic
low-grade inflammation (14),
hyperglycemia (15) and
microvascular injury (16). These
pathophysiological features of patients with T2DM could influence a
variety of immune mechanisms and impair blood supply, thereby
increasing the possibility of local infection. Patients with T2DM
often have elevated blood glucose levels, significantly increased
chance of blood coagulation and reduced neutrophil degranulation
(17). Elevated glucose
concentrations in the tissue surface layer will increase
susceptibility to bacterial colonization and can potentially
upregulate the expression of intercellular adhesion molecules and
increase neutrophil adhesion, thereby impairing neutrophil
chemotaxis and their subsequent antibacterial activities (18). Insulin resistance is a key feature of
T2DM and can impact immune cell migration, oxidative explosion
activity and phagocytosis (19). In
addition, following macrophage-mediated stimulation, tissue cells,
including adipocytes, will secrete PCT (20). PCT secretion is increased because
adipose tissues harbor increased numbers of activated macrophages.
Therefore, an increase in the baseline PCT levels of patients with
T2DM may be associated with insulin resistance and various
metabolic syndromes (20,21).
Patients with chronic kidney disease are at high
risk of severe infection (22–25).
However, an insufficient number of studies have investigated the
relationship between infection in diabetic patients and comorbid
nephropathy and hypertension. Data from the present study revealed
no difference in this relationship. Indeed, infection is a major
predisposing factor for DKA. Azoulay et al (26) reported that the incidence of sepsis
in patients with T2DM with DKA was not correlated, consistent with
the results from the present study.
A previous study has reported that rare infectious
diseases, including emphysematous pyelonephritis, invasive otitis
externa, emphysematous cholecystitis and rhinocerebral mucormycosis
were more prevalent in diabetic patients (27). In addition, diabetic patients appear
to carry an increased likelihood of infection caused by certain
strains of bacteria, including Staphylococcus aureus and
Mycobacterium tuberculosis (27). There has also been evidence
demonstrating that certain pathogens such as Streptococcus
pneumoniae are associated with a higher rate of bacteremia
(28). Data from the present study
also suggested that local infection occurred mostly at the
respiratory tract (48.8%), and the rate of urinary tract infection
was significantly higher in patients with sepsis compared with
patients with local infection (50.0 vs. 16.0%). This may be related
to the high proportion of females in the sepsis group as they are
more susceptible to urinary tract infections (29).
A number of studies have suggested that PCT could be
used as an indicator to exclude bacterial infections because it
could reliably and accurately reduce inappropriate antibiotic
exposure compared with the traditional tests, including CRP and WBC
(30–33). The present study demonstrated that
PCT and CRP may be used to predict local infection, but the former
exhibited lower sensitivity than the latter. This may be because
the sensitivity of PCT to predict local infection is reduced due to
the increased baseline PCT levels in patients with T2DM, whereas
T2DM exerted smaller effects on CRP. Alternatively, leukocytes have
been reported to be a potential source of PCT during sepsis
(34); and since local infection
results in reduced specific leukocyte stimulation, PCT was only
slightly increased.
PCT levels are almost undetectable in healthy
subjects, but it could be detected within 2 h of common bacterial
infection and it increases rapidly within 6 h before peaking at
about 24 h (35). Therefore,
measuring PCT levels in the blood enables the early diagnosis and
warning of sepsis (36,37). Davies et al (38) proposed that PCT was the most
effective biomarker in the diagnosis of sepsis and was superior to
CRP. A number of studies have reported that unlike CRP levels,
which did not increase significantly with the progression of
disease, PCT levels increased significantly in patients with severe
organ dysfunction, sepsis and septic shock (31,39),
possibly due to CRP and PCT of diverse origins in the inflammatory
process. CRP is an acute phase reactant protein synthesized by the
liver, and is considered to be a superior diagnostic indicator of
early inflammation (40). During
severe infection, CRP levels in patients with liver dysfunction did
not increase further (34), thus
reducing its diagnostic efficacy. The present study demonstrated
that PCT was superior to CRP and other inflammatory indicators for
the prediction of sepsis, consistent with the studies
aforementioned.
The present study contains a number of limitations.
Firstly, owing to its retrospective design, the inclusion cases may
contain a degree of selective bias. Secondly, bacterial and
non-bacterial infections were not distinguished in this study due
to the reduced proportion of microbiologically confirmed infection,
which may also affect the evaluation of PCT as a diagnostic marker
for infection.
In summary, the present findings identified that the
baseline PCT levels increased significantly in patients with T2DM
without infection. Furthermore, the value of PCT for the prediction
of infection in T2DM patients was clarified. The application of PCT
to predict local infection in patients with T2DM was inferior to
CRP, but its ability to predict sepsis was concluded to be superior
compared with CRP, WBC and N%.
Acknowledgements
Not applicable.
Funding
The present study was supported by The Science and
Technology Planning Project of Changzhou (grant no.
CJ20180022).
Availability of data and materials
The datasets used during the present study are
available from the corresponding author upon reasonable
request.
Authors' contributions
XW, YS and XS designed the study. XW and YS
performed the experiments. XS analyzed the data. XW and XS
interpreted the data and provided discussion of the results. XW
wrote the manuscript and YS revised it with XS. All authors read
and approved the final version of the manuscript for
publication.
Ethics approval and consent to
participate
The study was approved by the ethics committee of
Soochow University (2019-WD-003) and all patients signed informed
consent forms.
Patient consent for publication
Not applicable.
Competing interests
The authors declare that they have no competing
interests.
References
|
1
|
Whiting DR, Guariguata L, Weil C and Shaw
J: IDF diabetes atlas: Global estimates of the prevalence of
diabetes for 2011 and 2030. Diabetes Res Clin Pract. 94:311–321.
2011. View Article : Google Scholar : PubMed/NCBI
|
|
2
|
Rahelic D: 7th edition of IDF Diabetes
Atlas-call for Immediate Action. Lijec Vjesn. 138:57–58. 2016.(In
Croatian). PubMed/NCBI
|
|
3
|
Shah BR and Hux JE: Quantifying the risk
of infectious diseases for people with diabetes. Diabetes Care.
26:510–513. 2003. View Article : Google Scholar : PubMed/NCBI
|
|
4
|
Muller LM, Gorter KJ, Hak E, Goudzwaard
WL, Schellevis FG, Hoepelman AI and Rutten GE: Increased risk of
common infections in patients with type 1 and type 2 diabetes
mellitus. Clin Infect Dis. 41:281–288. 2005. View Article : Google Scholar : PubMed/NCBI
|
|
5
|
Korbel L and Spencer JD: Diabetes mellitus
and infection: An evaluation of hospital utilization and management
costs in the United States. J Diabetes Complicat. 29:192–195. 2015.
View Article : Google Scholar : PubMed/NCBI
|
|
6
|
Hine JL, de Lusignan S, Burleigh D,
Pathirannehelage S, McGovern A, Gatenby P, Jones S, Jiang D,
Williams J, Elliot AJ, et al: Association between glycaemic control
and common infections in people with Type 2 diabetes: A cohort
study. Diabetic Med. 34:551–557. 2017. View Article : Google Scholar : PubMed/NCBI
|
|
7
|
Florio W, Morici P, Ghelardi E, Barnini S
and Lupetti A: Recent advances in the microbiological diagnosis of
bloodstream infections. Crit Rev Microbiol. 44:351–370. 2018.
View Article : Google Scholar : PubMed/NCBI
|
|
8
|
Vashist SK, Venkatesh AG, Marion Schneider
E, Beaudoin C, Luppa PB and Luong JH: Bioanalytical advances in
assays for C-reactive protein. Biotechnol Adv. 34:272–290. 2016.
View Article : Google Scholar : PubMed/NCBI
|
|
9
|
Muller B and Becker KL: Procalcitonin: How
a hormone became a marker and mediator of sepsis. Swiss Med Wkly.
131:595–602. 2001.PubMed/NCBI
|
|
10
|
Karzai W, Oberhoffer M, Meier-Hellmann A
and Reinhart K: Procalcitonin-a new indicator of the systemic
response to severe infections. Infect. 25:329–334. 1997. View Article : Google Scholar
|
|
11
|
Snider RH Jr, Nylen ES and Becker KL:
Procalcitonin and its component peptides in systemic inflammation:
immunochemical characterization. J Invest Med. 45:552–560.
1997.
|
|
12
|
Alberti KG and Zimmet PZ: Definition,
diagnosis and classification of diabetes mellitus and its
complications. Part 1: Diagnosis and classification of diabetes
mellitus provisional report of a WHO consultation. Diabet Med.
15:539–553. 1998. View Article : Google Scholar : PubMed/NCBI
|
|
13
|
Levy MM, Fink MP, Marshall JC, Abraham E,
Angus D, Cook D, Cohen J, Opal SM, Vincent JL and Ramsay G: 2001
SCCM/ESICM/ACCP/ATS/SIS International Sepsis Definitions
Conference. Intensive Care Med. 29:530–538. 2003. View Article : Google Scholar : PubMed/NCBI
|
|
14
|
Wellen KE and Hotamisligil GS:
Inflammation, stress, and diabetes. J Clin Invest. 115:1111–1119.
2005. View
Article : Google Scholar : PubMed/NCBI
|
|
15
|
Jafar N, Edriss H and Nugent K: The effect
of short-term hyperglycemia on the innate immune system. Am J Med
Sci. 351:201–211. 2016. View Article : Google Scholar : PubMed/NCBI
|
|
16
|
Barrett EJ, Liu Z, Khamaisi M, King GL,
Klein R, Klein BEK, Hughes TM, Craft S, Freedman BI, Bowden DW, et
al: Diabetic Microvascular Disease: An Endocrine Society Scientific
Statement. J Clin Endocrinol Metab. 102:4343–4410. 2017. View Article : Google Scholar : PubMed/NCBI
|
|
17
|
Stegenga ME, van der Crabben SN, Blumer
RM, Levi M, Meijers JC, Serlie MJ, Tanck MW, Sauerwein HP and van
der Poll T: Hyperglycemia enhances coagulation and reduces
neutrophil degranulation, whereas hyperinsulinemia inhibits
fibrinolysis during human endotoxemia. Blood. 112:82–89. 2008.
View Article : Google Scholar : PubMed/NCBI
|
|
18
|
Morigi M, Angioletti S, Imberti B,
Donadelli R, Micheletti G, Figliuzzi M, Remuzzi A, Zoja C and
Remuzzi G: Leukocyte- endothelial interaction is augmented by high
glucose concentrations and hyperglycemia in a NF-κB-dependent
fashion. J Clin Invest. 101:1905–1915. 1998. View Article : Google Scholar : PubMed/NCBI
|
|
19
|
Cohen G, Ilic D, Raupachova J and Horl WH:
Resistin inhibits essential functions of polymorphonuclear
leukocytes. J Immunol. 181:3761–3768. 2008. View Article : Google Scholar : PubMed/NCBI
|
|
20
|
Becker KL, Nylen ES, White JC, Muller B
and Snider RH Jr: Clinical review 167: Procalcitonin and the
calcitonin gene family of peptides in inflammation, infection, and
sepsis: A journey from calcitonin back to its precursors. J Clin
Endocrinol Metab. 89:1512–1525. 2004. View Article : Google Scholar : PubMed/NCBI
|
|
21
|
Abbasi A, Corpeleijn E, Postmus D,
Gansevoort RT, de Jong PE, Gans RO, Struck J, Hillege HL, Stolk RP,
Navis G and Bakker SJ: Plasma procalcitonin is associated with
obesity, insulin resistance, and the metabolic syndrome. J Clin
Endocrinol Metab. 95:E26–E31. 2010. View Article : Google Scholar : PubMed/NCBI
|
|
22
|
James MT, Quan H, Tonelli M, Manns BJ,
Faris P, Laupland KB and Hemmelgarn BR: CKD and risk of
hospitalization and death with pneumonia. Am J Kidney Dis.
54:24–32. 2009. View Article : Google Scholar : PubMed/NCBI
|
|
23
|
James MT, Laupland KB, Tonelli M, Manns
BJ, Culleton BF and Hemmelgarn BR: Risk of bloodstream infection in
patients with chronic kidney disease not treated with dialysis.
Arch Inter Med. 168:2333–2339. 2008. View Article : Google Scholar
|
|
24
|
Davenport A: Peritonitis remains the major
clinical complication of peritoneal dialysis: The London, UK,
peritonitis audit 2002–2003. Perit Dial Int. 29:297–302.
2009.PubMed/NCBI
|
|
25
|
Mactier R: Peritonitis is still the
achilles' heel of peritoneal dialysis. Perit Dial Int. 29:262–266.
2009.PubMed/NCBI
|
|
26
|
Azoulay E, Chevret S, Didier J, Barboteu
M, Bornstain C, Darmon M, Le Gall JR, Vexiau P and Schlemmer B:
Infection as a trigger of diabetic ketoacidosis in intensive
care-unit patients. Clin Infect Dis. 32:30–35. 2001. View Article : Google Scholar : PubMed/NCBI
|
|
27
|
Joshi N, Caputo GM, Weitekamp MR and
Karchmer AW: Infections in patients with diabetes mellitus. New
Engl J Med. 341:1906–1912. 1999. View Article : Google Scholar : PubMed/NCBI
|
|
28
|
Marrie TJ: Bacteraemic pneumococcal
pneumonia: A continuously evolving disease. J Infect. 24:247–255.
1992. View Article : Google Scholar : PubMed/NCBI
|
|
29
|
Nichols GA, Brodovicz KG, Kimes TM,
Deruaz-Luyet A and Bartels DB: Prevalence and incidence of urinary
tract and genital infections among patients with and without type 2
diabetes. J Diabetes Complications. 31:1587–1591. 2017. View Article : Google Scholar : PubMed/NCBI
|
|
30
|
Luzzani A, Polati E, Dorizzi R,
Rungatscher A, Pavan R and Merlini A: Comparison of procalcitonin
and C-reactive protein as markers of sepsis. Crit Care Med.
31:1737–1741. 2003. View Article : Google Scholar : PubMed/NCBI
|
|
31
|
Castelli GP, Pognani C, Meisner M, Stuani
A, Bellomi D and Sgarbi L: Procalcitonin and C-reactive protein
during systemic inflammatory response syndrome, sepsis and organ
dysfunction. Crit Care. 8:R234–R242. 2004. View Article : Google Scholar : PubMed/NCBI
|
|
32
|
Schuetz P, Albrich W, Christ-Crain M,
Chastre J and Mueller B: Procalcitonin for guidance of antibiotic
therapy. Expert Rev Anti Infect Ther. 8:575–587. 2010. View Article : Google Scholar : PubMed/NCBI
|
|
33
|
Lee SH, Chan RC, Wu JY, Chen HW, Chang SS
and Lee CC: Diagnostic value of procalcitonin for bacterial
infection in elderly patients-a systemic review and meta-analysis.
Int J Clin Pract. 67:1350–1357. 2013. View Article : Google Scholar : PubMed/NCBI
|
|
34
|
Park JH, Kim DH, Jang HR, Kim MJ, Jung SH,
Lee JE, Huh W, Kim YG, Kim DJ and Oh HY: Clinical relevance of
procalcitonin and C-reactive protein as infection markers in renal
impairment: A cross-sectional study. Crit Care. 18:6402014.
View Article : Google Scholar : PubMed/NCBI
|
|
35
|
Brechot N, Hekimian G, Chastre J and Luyt
CE: Procalcitonin to guide antibiotic therapy in the ICU. Int J
Antimicrob Agents. 46:S19–S24. 2015. View Article : Google Scholar : PubMed/NCBI
|
|
36
|
Tan BH, Png ME, Yeo CP and Wong GC:
Procalcitonin in febrile neutropenia-timing is important. Support
Care Cancer. 22:583–584. 2014. View Article : Google Scholar : PubMed/NCBI
|
|
37
|
Bodmann KF, Schenker M, Heinlein W and
Wilke MH: Procalcitonin as a tool for the assessment of successful
therapy of severe sepsis: An analysis using clinical routine data.
Med Klin Intensivmed Notfmed. 113:533–541. 2016. View Article : Google Scholar : PubMed/NCBI
|
|
38
|
Davies J: Procalcitonin. J Clin Pathol.
68:675–679. 2015. View Article : Google Scholar : PubMed/NCBI
|
|
39
|
Claeys R, Vinken S, Spapen H, ver Elst K,
Decochez K, Huyghens L and Gorus FK: Plasma procalcitonin and
C-reactive protein in acute septic shock: Clinical and biological
correlates. Crit Care Med. 30:757–762. 2002. View Article : Google Scholar : PubMed/NCBI
|
|
40
|
Sierra R, Rello J, Bailen MA, Benitez E,
Gordillo A, Leon C and Pedraza S: C-reactive protein used as an
early indicator of infection in patients with systemic inflammatory
response syndrome. Intens Care Med. 30:2038–2045. 2004. View Article : Google Scholar
|