Introduction
Preeclampsia is a complication of pregnancy
characterized by new-onset hypertension and proteinuria of
gestation, with serious consequences for mother and infant
(1). This gestation-specific
syndrome affects 8% of all pregnancies worldwide (2). Preeclampsia may result in eclampsia and
hemolysis, elevated liver enzymes and low platelets (HELLP
syndrome) in the mother, and preterm birth, intrauterine growth
restriction and perinatal death in the fetus (2).
In a normal pregnancy, cytotrophoblasts invade the
uterine spiral arteries and cause arterial remodeling, replacing
much of the maternal endothelium. Consequently, the high-resistance
uterine arteriolar system is transformed into a low-resistance,
high-capacity system, allowing for increased fetal blood flow and
delivery of oxygen and nutrients to the placenta (3,4). In
preeclampsia, a two-stage theory has been proposed as a useful
concept to address its pathophysiology. Stage 1 comprises reduced
placental perfusion due to inadequate cytotrophoblast invasion of
spiral arterioles. This then translates, in certain but not all
maternal females, into stage 2, the multisystemic maternal syndrome
of preeclampsia (5). In addition,
there is a certain association between preeclampsia and maternal
rejection, and a correlation between prednisone and trophoblastic
insufficiency. Preeclampsia is also closely associated with fetal
rejection, gene polymorphisms and trophoblastic insufficiency
(6–8). Although a vast amount of studies have
been performed on preeclampsia, the pathogenesis of this
multisystemic disease has remained to be fully elucidated.
Recent technological advances in high-throughput
sequencing and Bioinformatics provide tools to obtain valuable
information on the dynamic changes of genes in specific disorders.
Gene set enrichment analyses (GSEAs), including Gene Ontology
functional term and Kyoto Encyclopedia of Genes and Genomes (KEGG)
biological pathway enrichment analysis are widely used to identify
the biological mechanisms of gene sets (9,10). The
currently available methods have two major inadequacies: i)
Designed comparisons or regression analyses are applied to the
comparison between control and experimental groups. These
traditional methods are not able to effectively exploit time
information in time series of transcriptomic measurements; ii)
overlapping genes in multiple pathways are thought to have multiple
roles in hypothesis testing, while the weight coefficients are
overestimated (11).
In the present study, a novel analytical procedure
for GSEA was used to overcome these defects. First, KEGG enrichment
analysis was used to identify the differential signaling pathways
between preeclampsia patients and controls. Furthermore, functional
principal component analysis (FPCA), which utilizes the temporal
information of gene expression profiles, was performed.
Subsequently, the elastic-net regression method was performed to
eliminate overlapping gene effects. Combined with the Mann-Whitney
U (MWU) test, the key molecular pathways were identified from the
gene transcription data of preeclampsia patients vs. controls.
Materials and methods
Data retrieval and pre-processing
Gene expression data for preeclampsia patients that
had been deposited in the Gene Expression Omnibus (GEO) database of
the National Center for Biotechnology Information (NCBI; www.ncbi.nlm.nih.gov/gds; accession no. GSE40182)
were downloaded. A total of 39 samples were contained in the
dataset. Villous cytotrophoblasts (CTBs) had been isolated from
preeclampsia placentas and placentas of preterm labor patients
without signs of infection, which served as gestation-matched
controls. In addition, gene expression data were obtained from the
in vitro culture of those villous CTBs cultured for
different durations. According to the American College of
Obstetricians and Gynecologists published criteria (12,13),
patients with the most clinically significant forms of this
condition that necessitated preterm delivery were included:
Maternal females with severe preeclampsia ± intrauterine growth
restriction, preeclampsia with superimposed hypertension and HELLP
syndrome. The first group named as the preterm labor group included
19 samples and served as gestation-matched controls, and the second
group contained 20 samples and was named as the preeclampsia group.
After converting the row names of the gene expression profile
matrix into GENESYMBOL format, 23,520 genes were obtained. Based on
the description of the time-series expression profile, the 39
samples were divided into four time-series groups depending on the
culture time: 0, 12, 24 and 48 h, which can provide a common CTB
fingerprint for preeclampsia. Meanwhile, CTB cell was under normal
culturing conditions. All analyses were performed using the
bioinformatics platform from Honghui Biotech Co. Ltd (http://www.genelibs.com).
FPCA analysis of time-series
expression profile
Time-series gene signature data were analyzed by
functional principal component analysis and an F value was
determined for each gene (11). The
mean expression of each gene was subtracted and FPCA was adopted
across all of the centered expression values. Each gene expression
value was calculated according to the following function:
xˆi(t)=uˆi+∑i=1Lξˆi1ϖˆ1(t)
In the above formula, ξˆi1 is the FPC score, which
quantifies how much Xˆi (t)
may be explained by φˆ1(t).uˆi represents the average
expression in the temporal sample and φˆ1(t) represents the lth
eigenfunction.
When this was applied to the time-dependent gene
expression, functional F-statistics were used to summarize the gene
pattern information for each gene at the different time-points:
Fi=RSSi0-RSSi1RSSi1+δ
where RSSi0 is
the residual sum of squares of null hypotheses, represents
RSSi1 the residual sum of squares
of alternative hypotheses and δ represents the signal-to-noise
ratio. Fi may be considered to indicate the
importance a gene, and i stands for a gene (14).
Pathway enrichment analysis
Differentially expressed genes were determined by
ranking their F values and ranked list of genes was used for
pathway enrichment analysis. KEGG pathway enrichment analysis was
performed to obtain significant pathways of the preeclampsia and
controls (15). In the present
study, Fisher's exact test was performed to select significant
pathways. Pathways with P<0.05 and an intersection gene count of
>1 were extracted, and were considered as important
pathways.
Estimation of the weights of genes
using the elastic-net regression model
Regression analysis is a predictive modeling
technique to assess the association between dependent and
independent variables. This technique has been frequently used in
predictive analyses and in identifying causal associations between
variables, particularly in time-series models (16). The elastic-net regression model
combines the Lasso algorithm and Ridge regression technique
(17,18). The major function of the model was as
follows:
βˆi=minβiOBJ(βi|Xi(t),φˆi(t))
OBJ(βi|Xi(t),φˆi(t))=‖Xi(t)-φˆi(t)Tβi‖2+λ1‖βi‖1+λ2‖βi‖2
Where λ is the penalty coefficient
(λ1=0.4, λ2=0.01) and βˆi is the vector of the set of
linear coefficients. When βˆi is
calculated and estimated, the weights of the overlapping genes may
be obtained as follows:
Wˆi,k:=∑l=1L(βˆl,ik)2∑k∈Ki∑l=1L(βˆl,ik)2
Wˆi,k=1if
gene i belongs to the ĸth gene set only. Due to the
use of lasso penalty, in some cases both the numerator and
denominator may be zero, in which case Wˆi,k=0. The above model would take
apart an overlapping gene between gene-sets and eliminate the
effects of overlapping genes (11).
Weighted MWU test with correlation
using GSEA
The MWU test is a rank-based non-parametric test
that is usually used in a competitive GSEA. The MWU test utilizes
the gene weight value to test whether the weight of this gene is
significantly greater than that of other genes (background genes)
(19). In combination with the
t-test, key signaling pathways are thereby obtained.
Co-expression network construction and
hub gene identification
First, an adjacency matrix of genes in the key
pathways was built using Spearman correlation analysis based on the
gene expression values. Any two genes were connected and if the
adjacency value of a pair of genes was >0.95, the given edge
would be retained for inclusion in the co-expression network.
Topological features were further studied to identify key nodes in
the network. Genes whose degree of connectivity was bigger than the
average degree values were considered as hub genes. Heat map and
clustering analysis were used to visualize the hub genes in
preeclampsia. Receiver operating characteristic (ROC) analysis was
performed and the area under the ROC curve (AUC) was calculated by
using the ROCR package in R.
Results
FPCA analysis of time-series
expression profile
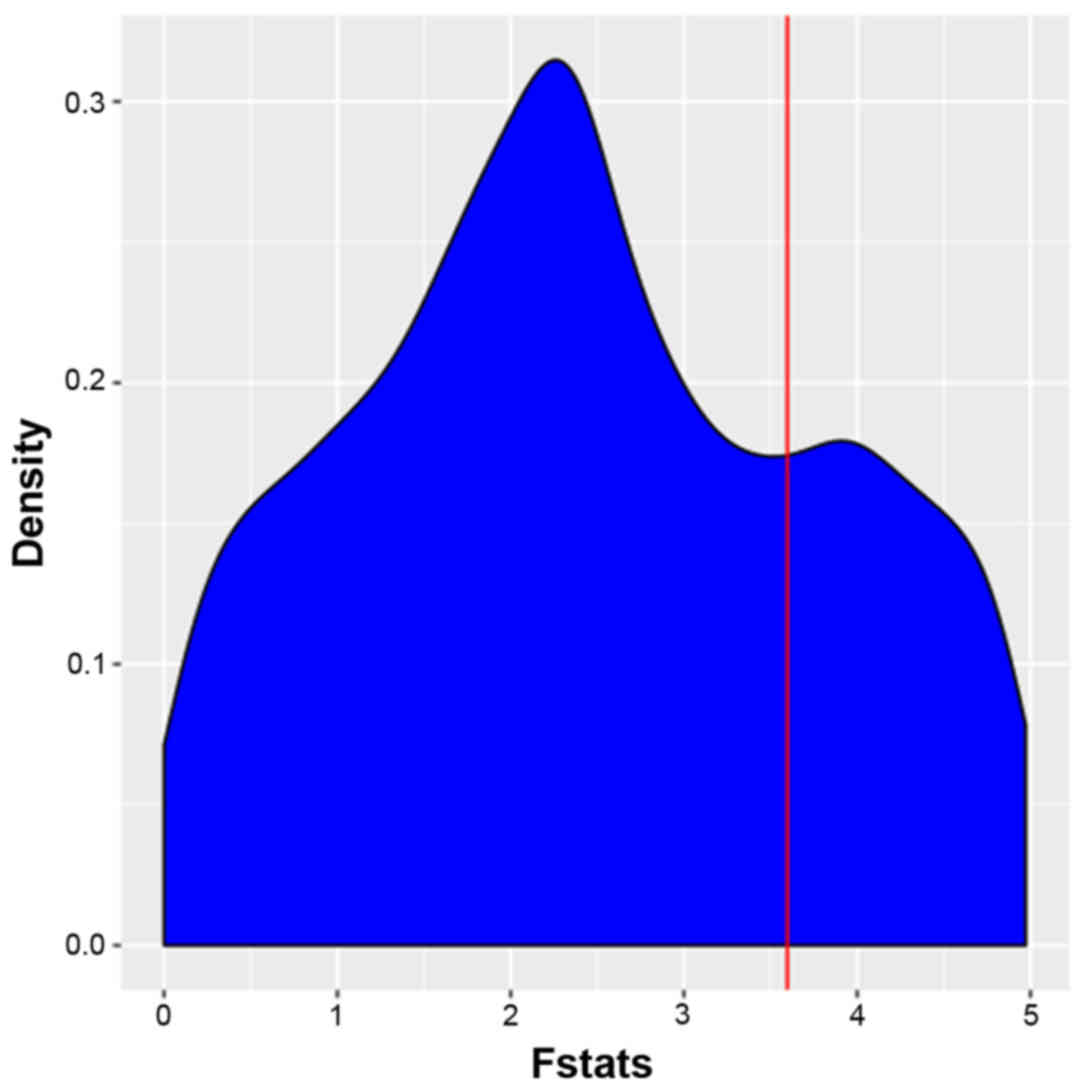
The FPCA model was used to identify temporally
differently expressed genes and each gene was assigned with
individual F-value F-values were then listed in descending order
and the top 1,000 differentially expressed genes were thereby
identified. FPCA analysis narrowed the gene search range from 4,419
to 1,000 for the dataset GSE40182. The distribution of the F-values
of pathway-associated genes is presented in Fig. 1. FPCA was able to effectively utilize
the time series information and overcome the deficiencies of the
traditional control design that could not achieve comparison with a
control group at one time-point (11). In the FPCA model, the basis functions
are estimated from the observed data and the data-adaptive basis
has the favorable property to flexibly characterize the major modes
of variation in the data (20).
F-values were then subjected to the MWU test.
Pathway enrichment analysis based on
KEGG
Pathway enrichment analysis of differentially
expressed genes between the preeclampsia vs. control group was
performed using the KEGG pathway database. A total of 286 pathways
comprising 6,893 genes were obtained. After applying Fisher's exact
test, 134 pathways comprising 4,419 genes were retained. In
Table I, the top 6 signaling
pathways associated with preeclampsia are presented in an ascending
order based on the P-value. The most significant pathway was
‘olfactory transduction’.
 | Table I.The top 6 differentially expressed
pathways of GSE40182 according to the KEGG analysis. |
Table I.
The top 6 differentially expressed
pathways of GSE40182 according to the KEGG analysis.
| Pathway name | P-value | FDR | Gene count |
|---|
| hsa04740: Olfactory
transduction |
5.89×10−191 | 1.69×10-188 | 112 |
| hsa05206: MicroRNAs
in cancer |
6.99×10−57 |
1.00×10−54 | 151 |
| hsa05200: Pathways
in cancer |
1.87×10⁻¹⁵ |
1.79×10⁻¹³ | 391 |
| hsa04151: PI3K/Akt
signaling pathway |
9.93×10⁻¹⁰ |
7.13×10⁻⁸ | 336 |
| hsa00970: Aminoacyl
tRNA biosynthesis |
5.53×10⁻⁹ |
3.17×10⁻⁷ | 39 |
| hsa04810:
Regulation of actin cytoskeleton |
2.23×10⁻⁸ |
1.07×10⁻⁶ | 211 |
Weights of genes estimated using the
elastic-net regression model
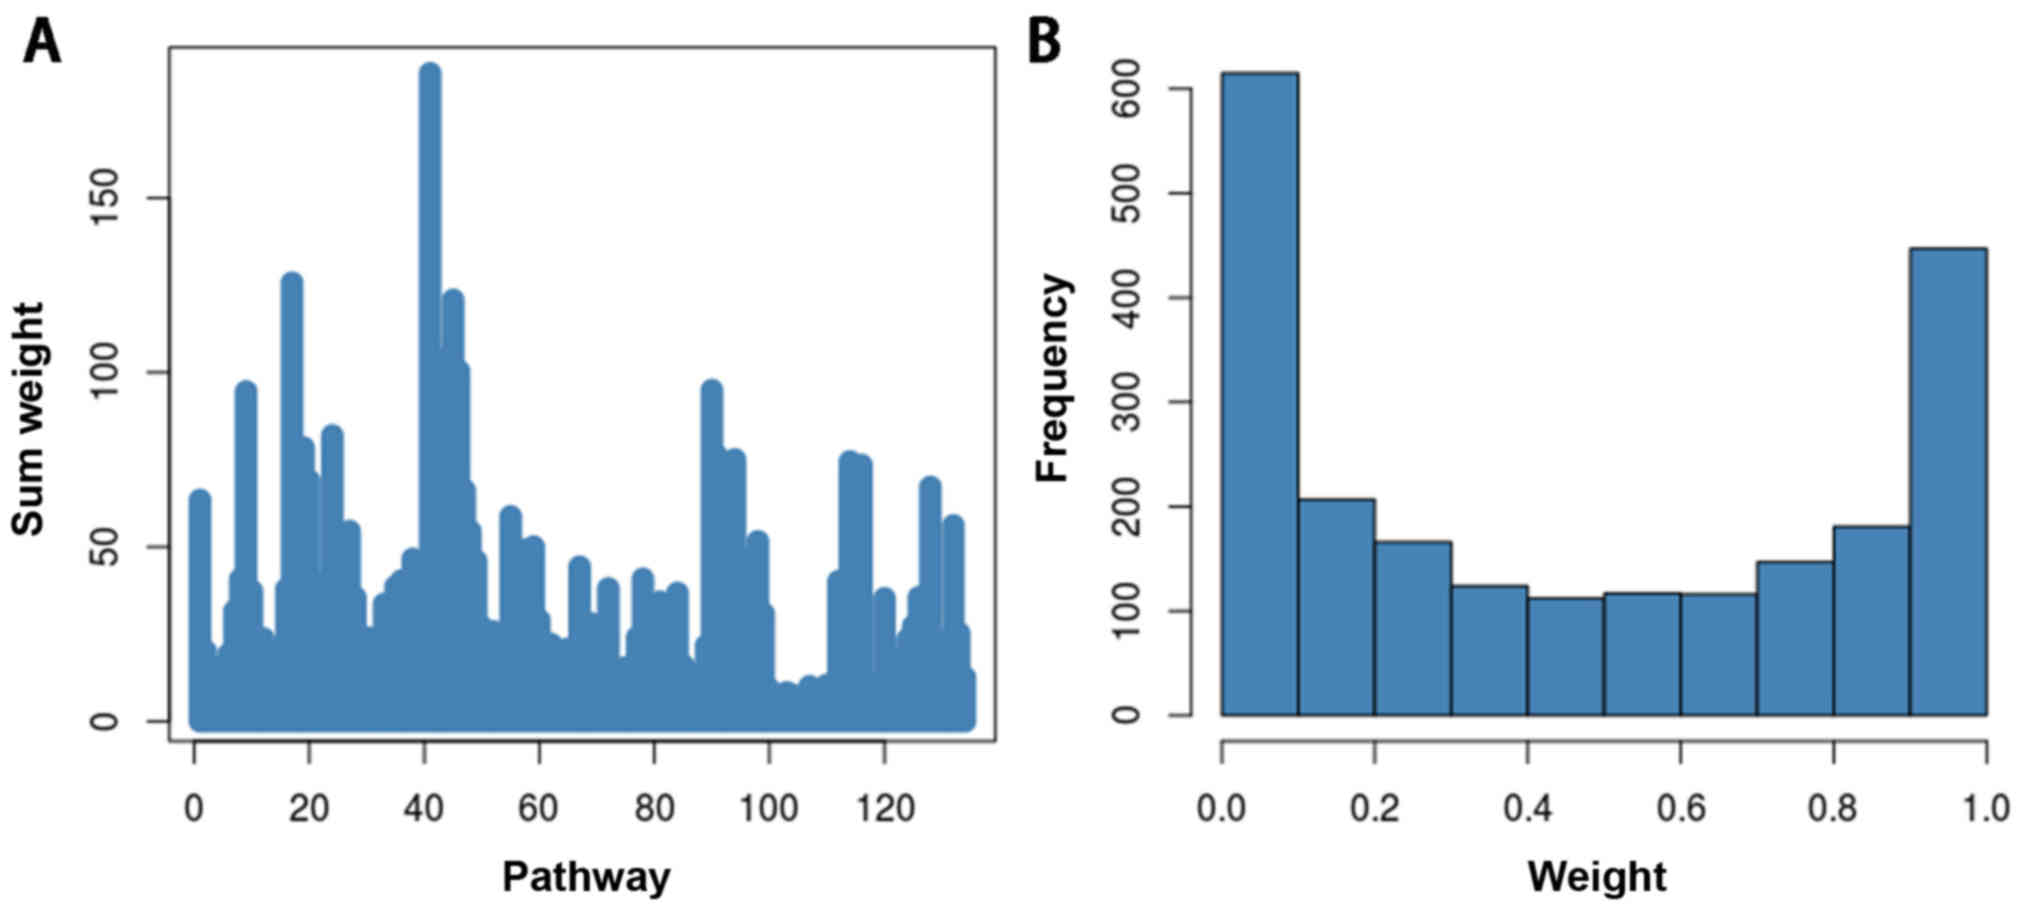
Overlapping genes are defined as genes involved in
multiple pathways. These genes have multiple roles in hypothesis
testing, leading to overestimation of the weight coefficients.
In the present study, an elastic-net regression
model was used to take apart an overlapping gene between gene sets
and eliminate the overlapping effects. After calculating the weight
value of each gene and adding the weight values of the genes in the
pathways, the total weight value of the pathways was obtained. The
total weight of each pathway in presented in Fig. 2. The weight value of each gene was
used for MWU test.
Weighted MWU test with correlation
using GSEA
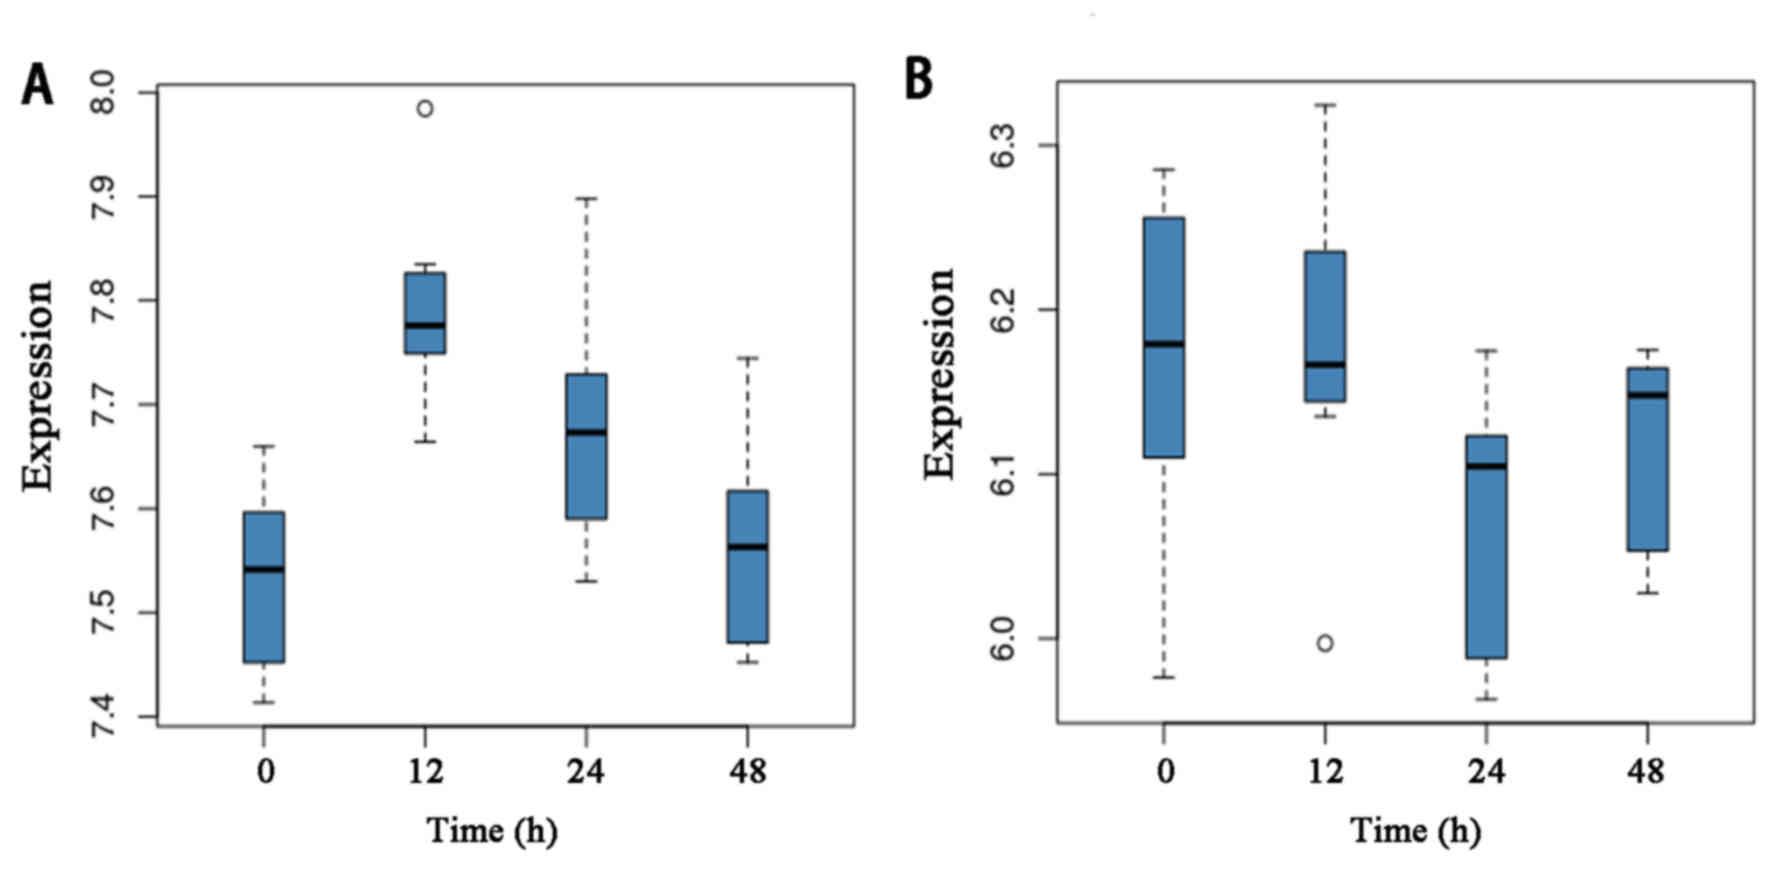
A total of 134 pathways enriched by the
differentially expressed were obtained were obtained by KEGG
pathway analysis. Using the MWU test, key molecular pathways for
differentially expressed genes between preeclampsia and controls
were identified. Based on the results of the test, pathways were
ranked in a descending order. The top two candidates were pathways
in hsa05142: Chagas disease (American trypanosomiasis) and
hsa05204: Chemical carcinogenesis. The expression levels of the
genes in the two pathways at different time-points are provided in
Fig. 3.
Hub genes in the co-expression network
and clustering analysis
A weighted gene co-expression network was
constructed by Spearman correlation analysis. For this, a total of
61 genes involved in the pathways hsa05142 Chagas disease and
hsa05204 Chemical carcinogenesis were selected. Edges with an
adjacency value for a pair of genes of >0.95 were retained for
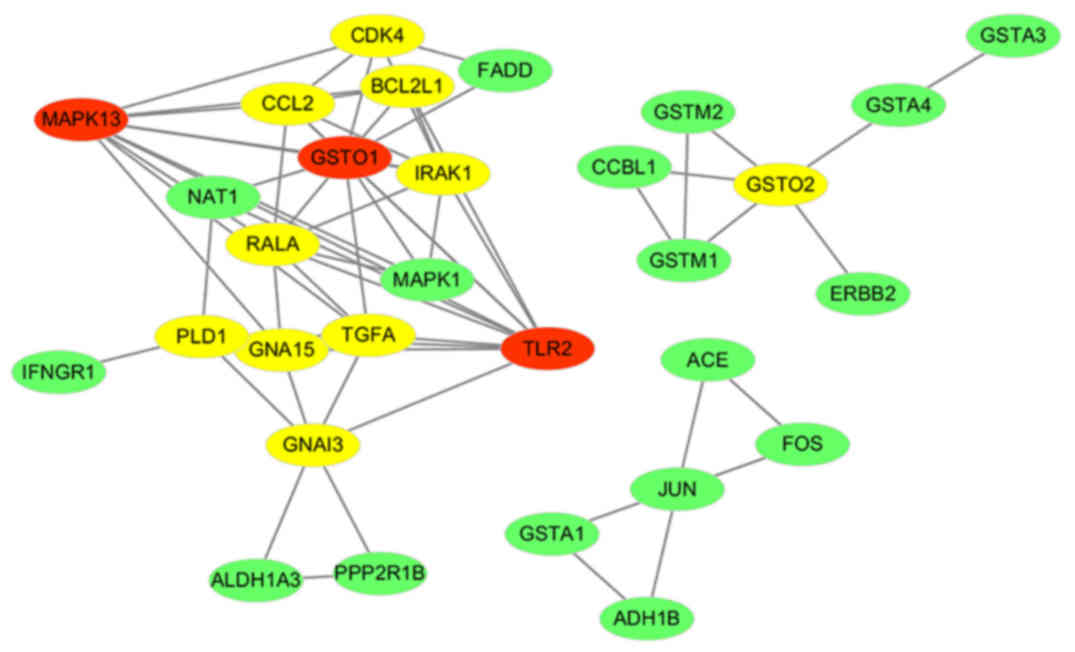
the network. Subsequently, the co-expression network was built. A
total of 30 nodes (genes) were contained in the co-expression
network. The co-expression network of the genes of the two most
important pathways in preeclampsia is displayed in Fig. 4.
The topological features of the network were
further studied to identify key nodes. Genes with a degree of
connectivity above average (average degree, 4.258) were considered
as hub genes. In the present study, a total of 13 hub genes (red
and yellow nodes represent hub genes, red nodes have a higher
degree than yellow nodes and green nodes) were identified,
including glutathione S-transferase omega (GSTO)2, GSTO1, BCL2 like
1 (BCL2L1), RAS like proto-oncogene A (RALA), transforming growth
factor α (TGFA), cyclin dependent kinase 4 (CDK4), phospholipase D1
(PLD1), Toll-like receptor 2 (TLR2), interleukin 1 receptor
associated kinase 1 (IRAK1), mitogen-activated protein kinase
(MAPK13), C-C motif chemokine ligand 2 (CCL2), G protein subunit α
15 (GNA15) and G protein subunit alpha I3 (GNAI3). Table II lists the key topological
characteristics of the hub genes. The diagnostic value (AUC) of
each gene is provided in Fig. S1.
The top AUC was 66.84% for the gene TLR2.
| Table II.Key topological characteristics of
the hub genes in the co-expression network. |
Table II.
Key topological characteristics of
the hub genes in the co-expression network.
| Gene name | Degree of
connectivity | Betweenness
centrality | Closeness
centrality | No. of directed
edges |
|---|
| TLR2 | 11 | 0.18228291 | 0.65384615 | 11 |
| GSTO1 | 11 | 0.25733543 | 0.73913043 | 11 |
| MAPK13 | 10 | 0.07893908 | 0.62962963 | 10 |
| RALA | 8 | 0.03345588 | 0.58620690 | 8 |
| IRAK1 | 8 | 0.02447479 | 0.58620690 | 8 |
| TGFA | 7 | 0.08142507 | 0.62962963 | 7 |
| CCL2 | 7 | 0.01197479 | 0.56666667 | 7 |
| PLD1 | 6 | 0.13480392 | 0.54838710 | 6 |
| GNAI3 | 6 | 0.22058824 | 0.54838710 | 6 |
| GNA15 | 6 | 0.03734244 | 0.58620690 | 6 |
| GSTO2 | 5 | 0.76666667 | 0.85714286 | 5 |
| BCL2L1 | 5 | 0.00000000 | 0.53125000 | 5 |
| CDK4 | 5 | 0.01250000 | 0.45945946 | 5 |
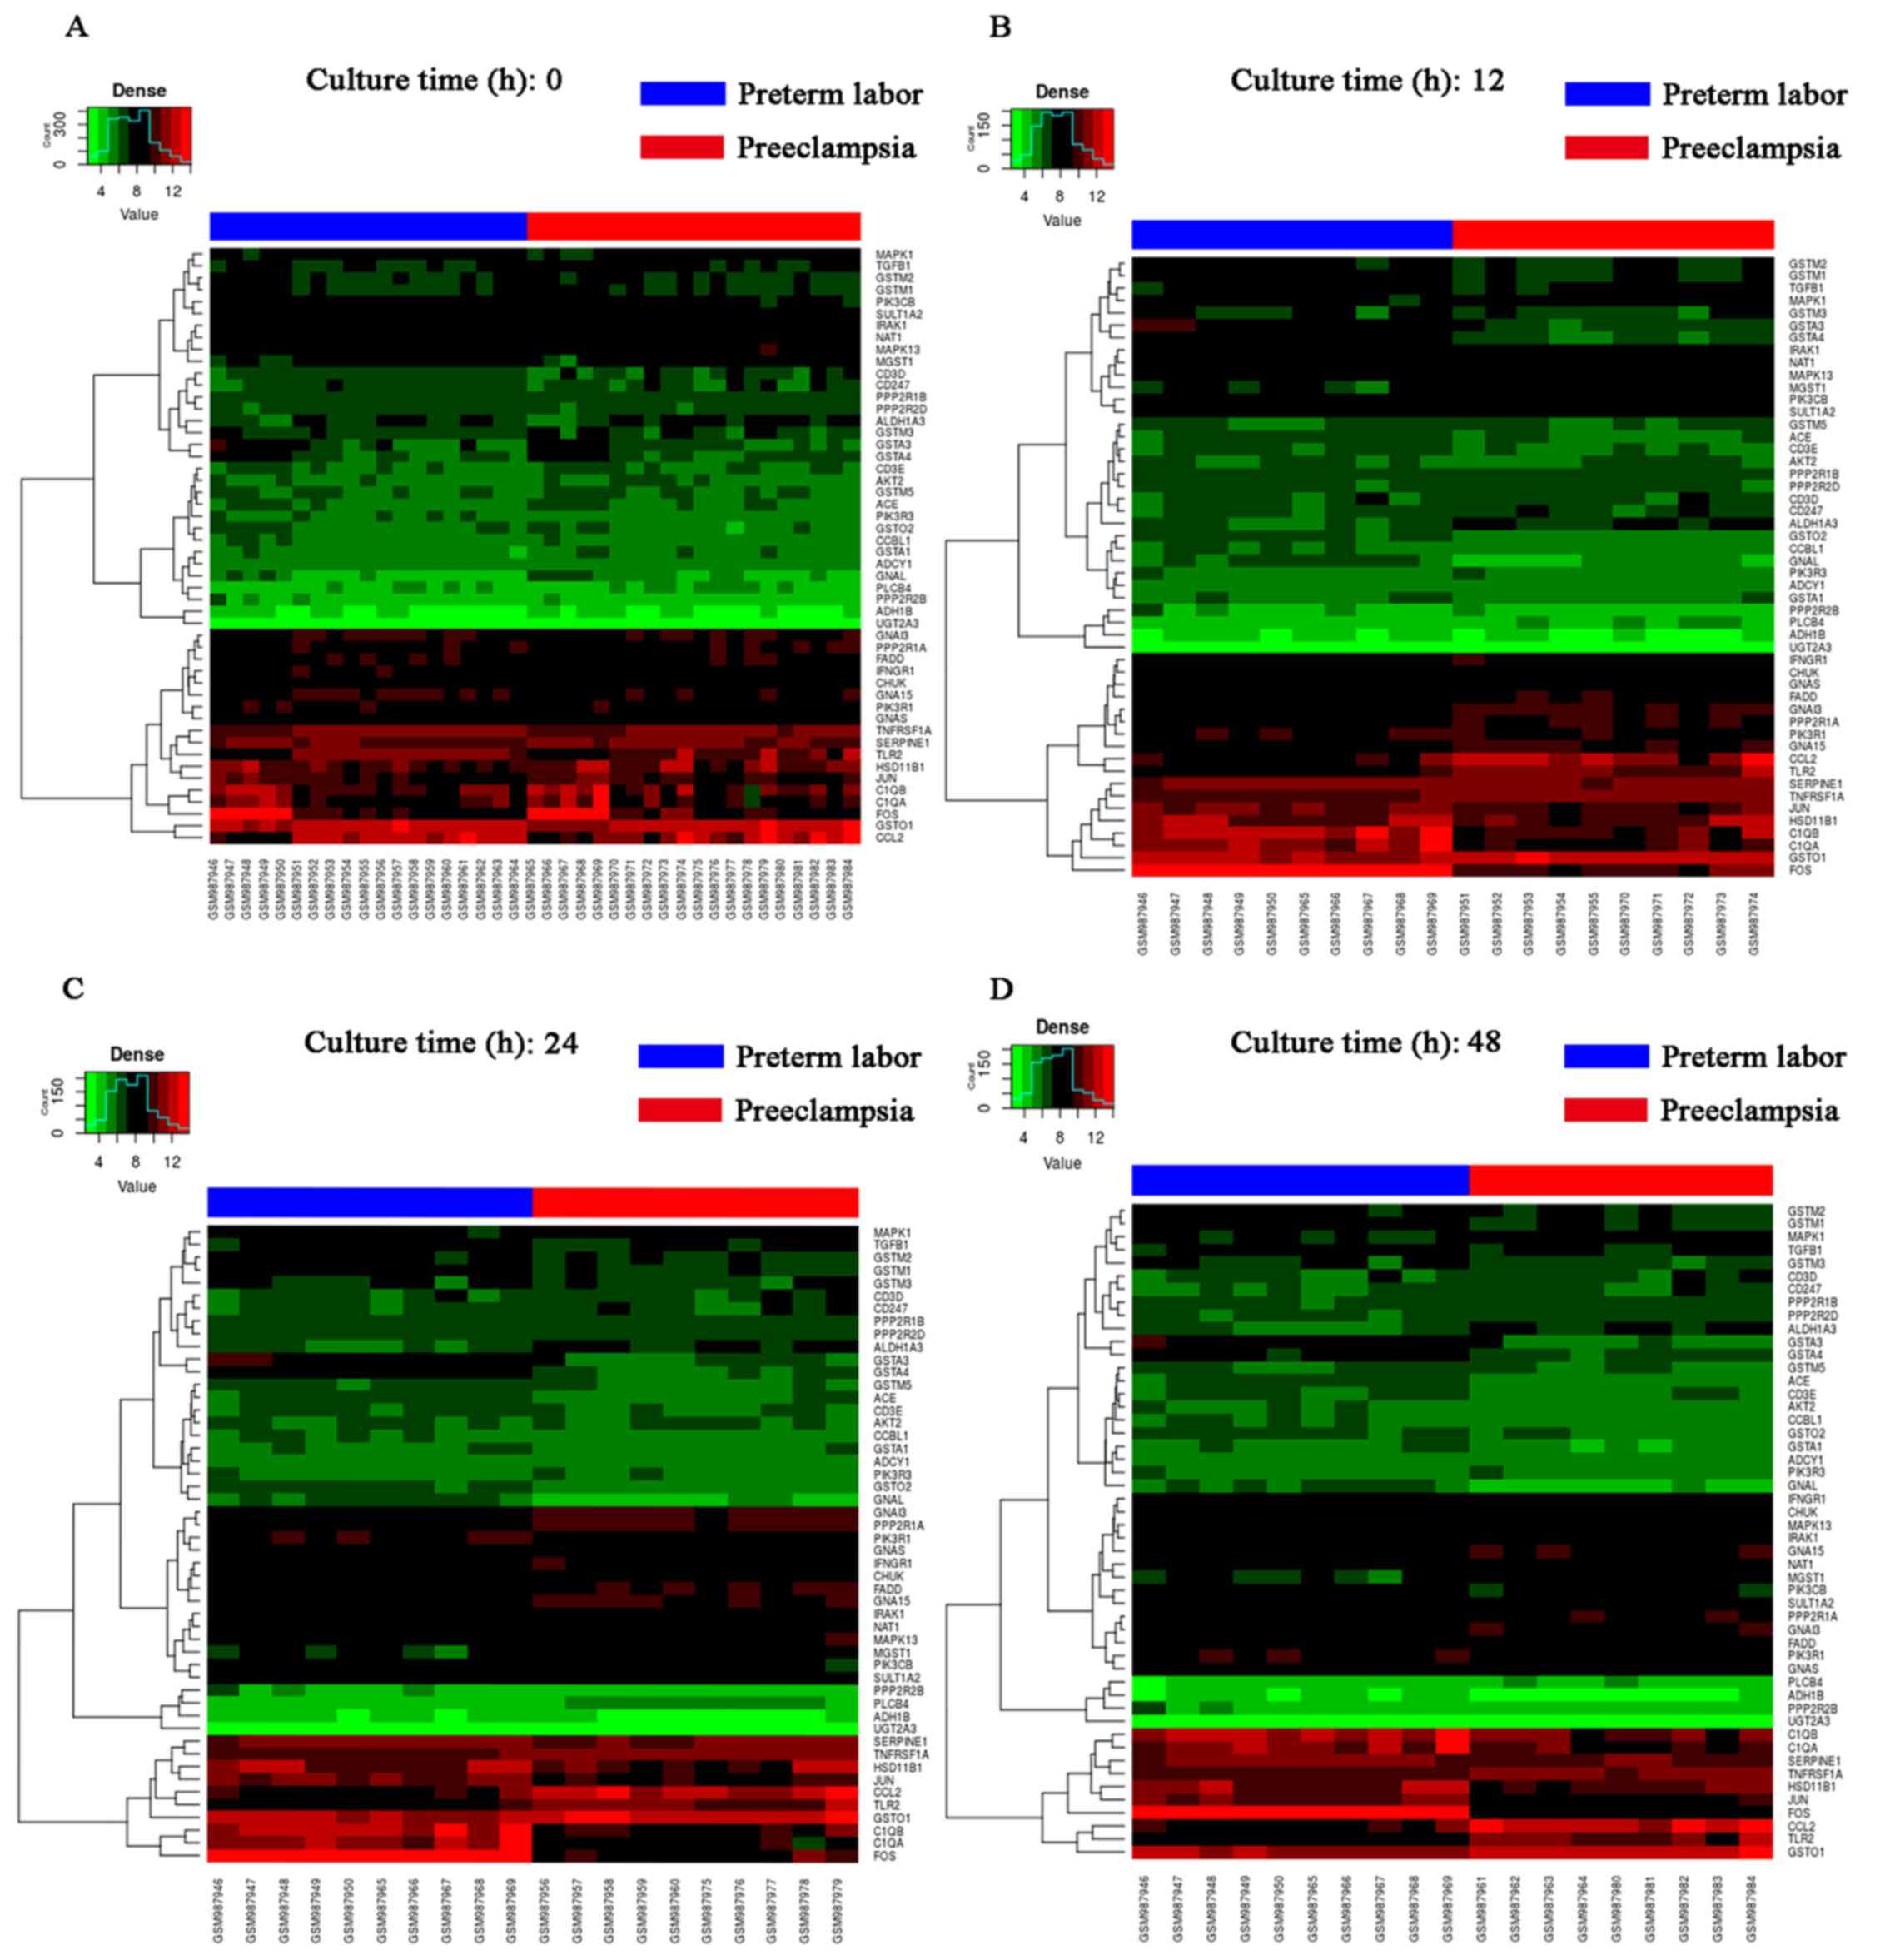
Based on the degree of connectivity, the top 3
candidates were TLR2, GSTO1 and MAPK13. Heat map and clustering
analysis were also used to determine the hub genes in preeclampsia.
The clustering heat map is presented in Fig. 5. It was observed that there were
distinctive expression levels in different groups at 4 different
time-points.
Discussion
The causes of preeclampsia remain to be fully
elucidated and are a hotspot of current research. The present study
focused on the relative expression of the whole genome in primary
culture of villous CTB from placentas of subjects with preeclampsia
compared with normal pregnancies. The present results enhance the
current understanding of the potential factors in preeclampsia. In
recent years, novel mathematical models have been widely used in
molecular biology and Bioinformatics. Studies have indicated that
dysregulation in gene expression at numerous time-points may be
calculated by cutting-edge mathematical models (21,22),
including high-dimensional differential equations (23,24),
dynamic Bayesian networks (21,22) and
Granger's model (25).
In the present study, the pathogenesis of
preeclampsia was analyzed using Bioinformatics, including KEGG
enrichment analysis, FPCA, elastic-net regression and MWU test.
According to this novel analytical procedure, two major signaling
pathways, hsa05142 Chagas disease and hsa05204 Chemical
carcinogenesis, were identified. In the pathway has05142 (Fig. S2; taken from KEGG; www.kegg.jp/dbget-bin/www_bget?map05142), TLR
signaling was identified. In the context of pregnancy, it is
reported that maternal females with systemic lupus erythematosus
have a 3–4-fold higher risk of developing preeclampsia (26). Systemic inflammatory disorders
involving extensive tissue damage are characterized by significant
changes in the innate immune system. TLRs have an important role in
the underlying pathophysiological mechanisms of preeclampsia. TLR2,
one of the TLRs, which is expressed on the surface of certain cells
and recognizes foreign substances, has a role in the immune system.
Previous studies have provided solid evidence that the immune
system is closely associated with preeclampsia, and the TLR family
has a significant involvement (27–29).
Goulopoulou et al (30)
proposed a hypothesis that severely necrotic trophoblasts lead to
the release of mitocshondrial DNA, stimulating TLR9 to induce an
immune response, resulting in hypertension and intra-uterine growth
restriction. Circulating mitochondrial DNA may be a potential
marker of inchoate preeclampsia, and anti-TLR9 treatments may be
promising for this disease (31).
Consistent with those studies, the present results also suggested
that TLR2 has a diagnostic potential in preeclampsia, which may be
used for clinical applications (Fig.
S1). Maternal females with preeclampsia had increased TLR2 and
TLR4 mRNA and protein expression compared with normal pregnancies
(32). MAPK13 is a member of the
MAPK family, taking part in a wide variety of cellular processes
and acting as an integration point for TLR signaling (33). There are also studies on MAPKs
involvement in preeclampsia, which enhance the current
understanding of the mechanisms associated with this condition
(34).
In order to further elucidate the interrelation of
genes involved in those two pathways, a co-expression network was
constructed in the present study. Based on the topological
features, 13 hub genes were identified. The top 3 candidates were
TLR2, GSTO1 and MAPK13.
Apart from TLR2 and MAPK13 mentioned above, GSTO1
in the pathway hsa05204 Chemical carcinogenesis also has an
important role in preeclampsia (Fig.
S3, taken from KEGG; www.kegg.jp/dbget-bin/www_bget?map05204). GSTO1 has
dehydroascorbate reductase activity and has an important role in
the glutathione-ascorbate cycle as part of the anti-oxidant
metabolism (35).
Numerous studies have verified the influence of TLR
pathways on preeclampsia. The result was a demonstration of the
feasibility and scientific value of this analytic process.
Furthermore, TLR2, GSTO1 and MAPK13 were identified as key
molecules according to this analysis, which provides a basis for
further studies on the significance of these genes in
preeclampsia.
In conclusion, TLR2, GSTO1 and MAPK13 were
identified as key genes of preeclampsia and have potential as
diagnostic markers or drug targets for preeclampsia; however,
further experimental verification should be performed to confirm
these in silico results. Since the distribution of clinical
factors may be different in other regions or databases, the present
results also require verification in clinical samples of a large
number of subjects from multiple centers/geographical regions.
Supplementary Material
Supporting Data
Acknowledgements
The authors would like to thank Jinan Honghui
Biotech Co. Ltd. for providing support for data pre-processing.
Funding
No funding received.
Availability of data and materials
The datasets used and/or analyzed during the
present study are available from the corresponding author on
reasonable request.
Authors' contributions
XL and YF wrote the manuscript; XL downloaded and
analyzed data, and drafted the manuscript; YF interpreted the data
and made critical revisions. All authors discussed the results and
reviewed the manuscript.
Ethics approval and consent to
participate
No applicable.
Patient consent for publication
No applicable.
Competing interests
The authors declare that they have no competing
interests.
References
|
1
|
Chaiworapongsa T, Chaemsaithong P, Yeo L
and Romero R: Pre-eclampsia part 1: Current understanding of its
pathophysiology. Nat Rev Nephrol. 10:466–480. 2014. View Article : Google Scholar : PubMed/NCBI
|
|
2
|
Hariharan N, Shoemaker A and Wagner S:
Pathophysiology of hypertension in preeclampsia. Microvasc Res.
109:34–37. 2017. View Article : Google Scholar : PubMed/NCBI
|
|
3
|
Yang JI, Kong TW, Kim HS and Kim HY: The
proteomic analysis of human placenta with pre-eclampsia and normal
pregnancy. J Korean Med Sci. 30:770–778. 2015. View Article : Google Scholar : PubMed/NCBI
|
|
4
|
Zhou Y, Gormley MJ, Hunkapiller NM,
Kapidzic M, Stolyarov Y, Feng V, Nishida M, Drake PM, Bianco K,
Wang F, et al: Reversal of gene dysregulation in cultured
cytotrophoblasts reveals possible causes of preeclampsia. J Clin
Invest. 123:2862–2872. 2013. View Article : Google Scholar : PubMed/NCBI
|
|
5
|
Roberts JM and Gammill HS: Preeclampsia:
Recent insights. Hypertension. 46:1243–1249. 2005. View Article : Google Scholar : PubMed/NCBI
|
|
6
|
Minassian C, Thomas SL, Williams DJ,
Campbell O and Smeeth L: Acute maternal infection and risk of
pre-eclampsia: A population-based case-control study. PLoS One.
8:e730472013. View Article : Google Scholar : PubMed/NCBI
|
|
7
|
Banadakoppa M, Vidaeff AC, Yallampalli U,
Ramin SM, Belfort MA and Yallampalli C: Complement split products
in amniotic fluid in pregnancies subsequently developing
early-onset preeclampsia. Dis Markers. 2015:2631092015. View Article : Google Scholar : PubMed/NCBI
|
|
8
|
Song L and Zhong M: Association between
Interleukin-10 gene polymorphisms and risk of early-onset
preeclampsia. Int J Clin Exp Pathol. 8:11659–11664. 2015.PubMed/NCBI
|
|
9
|
Alshahrour F, Minguez P, Tárraga J,
Montaner D, Alloza E, Vaquerizas JM, Conde L, Blaschke C, Vera J
and Dopazo J: BABELOMICS: A systems biology perspective in the
functional annotation of genome-scale experiments. Nucleic Acids
Res. 34:(Web Server Issue). W472–W476. 2006. View Article : Google Scholar : PubMed/NCBI
|
|
10
|
Tabas-Madrid D, Nogales-Cadenas R and
Pascual-Montano A: GeneCodis3: A non-redundant and modular
enrichment analysis tool for functional genomics. Nucleic Acids
Res. 40:(Web Server Issue). W478–W483. 2012. View Article : Google Scholar : PubMed/NCBI
|
|
11
|
Zhang Y, Topham DJ, Thakar J and Qiu X:
FUNNEL-GSEA: FUNctioNal ELastic-net regression in time-course gene
set enrichment analysis. Bioinformatics. 33:1944–1952. 2017.
View Article : Google Scholar : PubMed/NCBI
|
|
12
|
ACOG Committee on Practice
Bulletins-Obstetrics, . ACOG practice bulletin. Diagnosis and
management of preeclampsia and eclampsia. Number 33, January 2002.
Obstet Gynecol. 99:159–167. 2002.PubMed/NCBI
|
|
13
|
Haram K, Svendsen E and Abildgaard U: The
HELLP syndrome: Clinical issues and management. A review. BMC
Pregnancy Childbirth. 9:82009. View Article : Google Scholar : PubMed/NCBI
|
|
14
|
Wu S and Wu H: More powerful significant
testing for time course gene expression data using functional
principal component analysis approaches. BMC Bioinformatics.
14:62013. View Article : Google Scholar : PubMed/NCBI
|
|
15
|
Zhu J and Yao X: Use of DNA methylation
for cancer detection: Promises and challenges. Int J Biochem Cell
Biol. 41:147–154. 2009. View Article : Google Scholar : PubMed/NCBI
|
|
16
|
Lu CJ, Wu JY and Lee TS: Application of
independent component analysis preprocessing and support vector
regression in time series prediction. International Joint
Conference on Computational Sciences and Optimization. 468–471.
2009. View Article : Google Scholar
|
|
17
|
Ogutu JO, Schulzstreeck T and Piepho HP:
Genomic selection using regularized linear regression models: Ridge
regression, lasso, elastic net and their extensions. BMC Proc. 6
(Suppl 2):S102012. View Article : Google Scholar : PubMed/NCBI
|
|
18
|
Townsend W: ELASTICREGRESS: Stata module
to perform elastic net regression, lasso regression, ridge
regression. Statist Software Comp. 2017.
|
|
19
|
Brandsma CA, van den Berge M, Postma DS,
Jonker MR, Brouwer S, Paré PD, Sin DD, Bossé Y, Laviolette M,
Karjalainen J, et al: A large lung gene expression study
identifying fibulin-5 as a novel player in tissue repair in COPD.
Thorax. 70:21–32. 2015. View Article : Google Scholar : PubMed/NCBI
|
|
20
|
Zhao Y, Chen MH, Pei B, Rowe D, Shin DG,
Xie W, Yu F and Kuo L: A bayesian approach to pathway analysis by
integrating gene-gene functional directions and microarray data.
Stat Biosci. 4:105–131. 2012. View Article : Google Scholar : PubMed/NCBI
|
|
21
|
Low ST, Mohamad MS, Omatu S, Chai LE,
Deris S and Yoshioka M: Inferring gene regulatory networks from
perturbed gene expression data using a dynamic Bayesian network
with a Markov Chain Monte Carlo algorithm. IEEE International
Conference on Granular Computing. 179–184. 2014.
|
|
22
|
Young WC, Raftery AE and Yeung KY: Fast
Bayesian inference for gene regulatory networks using ScanBMA. BMC
Syst Biol. 8:472014. View Article : Google Scholar : PubMed/NCBI
|
|
23
|
Cai TT and Zhang A: Inference for
high-dimensional differential correlation matrices. J Multivar
Anal. 143:107–126. 2016. View Article : Google Scholar : PubMed/NCBI
|
|
24
|
Chung NC and Storey JD: Statistical
significance of variables driving systematic variation in
high-dimensional data. Bioinformatics. 31:545–554. 2015. View Article : Google Scholar : PubMed/NCBI
|
|
25
|
Basu S, Shojaie A and Michailidis G:
Network granger causality with inherent grouping structure. J Mach
Learn Res. 16:1–31. 2012.
|
|
26
|
Abd Rahman R, DeKoninck P, Murthi P and
Wallace EM: Treatment of preeclampsia with hydroxychloroquine: A
review. J Matern Fetal Neonatal Med. 31:525–529. 2018. View Article : Google Scholar : PubMed/NCBI
|
|
27
|
Perez-Sepulveda A, Torres MJ, Khoury M and
Illanes SE: Innate immune system and preeclampsia. Front Immunol.
5:2442014. View Article : Google Scholar : PubMed/NCBI
|
|
28
|
Saito S, Shiozaki A, Nakashima A, Sakai M
and Sasaki Y: The role of the immune system in preeclampsia. Mol
Aspects Med. 28:192–209. 2007. View Article : Google Scholar : PubMed/NCBI
|
|
29
|
Laresgoiti-Servitje E: A leading role for
the immune system in the pathophysiology of preeclampsia. J Leukoc
Biol. 94:247–257. 2013. View Article : Google Scholar : PubMed/NCBI
|
|
30
|
Goulopoulou S, Matsumoto T, Bomfim GF and
Webb RC: Toll-like receptor 9 activation: A novel mechanism linking
placenta-derived mitochondrial DNA and vascular dysfunction in
pre-eclampsia. Clin Sci (Lond). 123:429–435. 2012. View Article : Google Scholar : PubMed/NCBI
|
|
31
|
Yasuda K, Rutz M, Schlatter B, Metzger J,
Luppa PB, Schmitz F, Haas T, Heit A, Bauer S and Wagner H: CpG
motif-independent activation of TLR9 upon endosomal translocation
of ‘natural’ phosphodiester DNA. Eur J Immunol. 36:431–436. 2006.
View Article : Google Scholar : PubMed/NCBI
|
|
32
|
Xie F, Hu Y, Turvey SE, Magee LA, Brunham
RM, Choi KC, Krajden M, Leung PC, Money DM, Patrick DM, et al:
Toll-like receptors 2 and 4 and the cryopyrin inflammasome in
normal pregnancy and pre-eclampsia. BJOG. 117:99–108. 2010.
View Article : Google Scholar : PubMed/NCBI
|
|
33
|
Cerezo-Guisado MI and Cuenda A: MAPK13
(mitogen-activated protein kinase 13). Atlas Genet Cytogenet Oncol
Haematol. 14:911–914. 2010.
|
|
34
|
Luo X, Yao ZW, Qi HB, Liu DD, Chen GQ,
Huang S and Li QS: Gadd45α as an upstream signaling molecule of p38
MAPK triggers oxidative stress-induced sFlt-1 and sEng upregulation
in preeclampsia. Cell Tissue Res. 344:551–556. 2011. View Article : Google Scholar : PubMed/NCBI
|
|
35
|
Whitbread AK, Masoumi A, Tetlow N, Schmuck
E, Coggan M and Board PG: Characterization of the omega class of
glutathione transferases. Methods Enzymol. 401:78–99. 2005.
View Article : Google Scholar : PubMed/NCBI
|