Introduction
Type 2 diabetes mellitus (T2DM) is a
noninsulin-dependent chronic degenerative disease caused by
defective insulin action and secretion that is characterized by
metabolic complications and an abnormally high glucose level
(1,2). T2DM is a primary cardiovascular risk
factor and is also considered a risk factor for coronary artery
disease (3). Currently, T2DM is
among the top three fatal diseases, alongside cancer and
cardiovascular disease (4). Although
controlling hyperglycemia is the aim of T2DM treatment, the
underlying pathophysiology of T2DM is receiving increasing
attention and is emerging as an important therapeutic target
(5). The etiology of T2DM is
associated with the destruction of pancreatic β-cell function, the
induction of insulin resistance and the loss of β-cell mass
(6). Genetic susceptibility also
serves a critical role in the etiology and likelihood of developing
T2DM and environmental factors likely to amplify genetic factors
(7). It has been indicated that the
γ-aminobutyric acid (GABA) signaling pathway is associated with
T2DM (8).
GABA is the principle inhibitory neurotransmitter in
the central nervous system (CNS) and serves an important role in
the regulation of various psychological and physiological
processes, including anxiety, depression and functional bowel
disorders (9). The activation of
GABA receptors (GABA-R) has been reported to inhibit obesity,
high-fat diet-induced glucose intolerance and insulin resistance
via an increase in T regulatory cell responses and the inhibition
of obesity-associated inflammation in vivo, therefore
intervening with T2DM (10). A
previous study revealed no significant metabolite changes in the
thalamus of diabetics but higher Glx/GABA levels in the right
thalamus of those with diabetic neuropathy (11). A further study demonstrated that
excitatory neurotransmitters (glutamate and glutamine) were
increased and inhibitory neurotransmitters (GABA) were decreased in
patients with T2DM, which is indicative of abnormal pain regulation
(12). T2DM has been demonstrated to
produce medical complications in several organ systems, including
in the hippocampus (13).
Furthermore, the association between glucose level and changes in
cerebral metabolites have been previously reported (14). During the process of hippocampal
formation, many neuromodulators are likely employed in synaptic
plasticity, such as in long-term potentiation (LTP) induced by
high-frequency stimulation (15).
LTP is a long-lasting activity-dependent enhancement of the
excitatory synapse, induced by brief high-frequent electrical
stimulation and is generally considered to be the closest neural
model of the learning and memory storage cellular mechanism, along
with other forms of synaptic plasticity (16). T2DM is commonly associated with
cognitive genetic decline, which can also create a burden to
patients and their families (17).
Impairment of LTP in the hippocampal CA1 region has been observed
in a rat model of T2DM (18).
Although it has been recently reported that insulin signaling
modulates the activity of neurotransmitters, including inhibitory
GABA-R, the underlying pathophysiological mechanisms are yet to be
elucidated (19). Therefore, the
current study was performed to assess the effects of GABA-R on
hippocampal CA1 region depotentiation in T2DM mice.
Materials and methods
Study subjects and grouping
A total of 30 spontaneous T2DM mice (C57BLKS/J
db/db; male; age, 9 weeks; weight, 34–38 g) at clean stage and 10
non-diabetic db/m hetereozygous mice of the same age from the same
brood were purchased from the Model Animal Research Center of
Nanjing University (Nanjing, China) as negative control (NC). Mice
in the NC group were treated with GABA-R-NC, whilst mice in the
blank group received no treatment. During a 1-week quarantine in a
specific pathogen free animal house, mice were housed in a
temperature-controlled environment (humidity, 60–65%; temperature,
21±3°C) with a 12-h light/dark cycle, and were provided free access
to aseptic water and chow. 20 db/db mice were randomly assigned to
the GABA-R or negative control (NC) groups (10 mice/group). A
further 10 untreated db/db mice were assigned to the blank group
and the 10 db/m mice were assigned to the normal group. Mice in the
GABA-R group were subsequently injected with a mixed solution of
GABA-R gene plasmid (2 µg; Shanghai GenePharma Co., Ltd.) and
GeneJamer transfection agent (6 µl; cat. no. 204130; Agilent
Technologies, Inc.). Mice in the NC group were injected with a
mixed solution consisting of the negative control plasmid
pCMV6-AC-GFP (2 µg; Shanghai GenePharma Co., Ltd.) and GeneJamer
transfection agent (6 µl). The plasmid and transfection agent
mixture were injected directly into the hippocampal CA1 region of
the GABA-R mice at a speed of 0.5 µl/min) after an anesthetic
intraperitoneal injection of pentobarbital sodium (45–50 mg/kg)
(20). The process was repeated
every five days for 30 days for a total of six injections. Mice
were kept in separate cages at 23±1°C under a relative humidity of
50–60% under a 12-h light/dark cycle with free access to food
(standard rodent feed) and water. On day 30 after treatment, all
mice were sacrificed and their brain tissues were utilized for
subsequent experimentation (21,22). The
current study was performed with the approval of the Animal Ethics
Committee of Sichuan Academy of Medical Sciences & Sichuan
Provincial People's Hospital (Chengdu, China). All animal
experiments were performed in strict accordance with the Guide for
the Care and Use of Laboratory Animal by International
Committees.
Measurement of weight and blood
glucose level
Mice were weighed using an analytical balance before
and after treatment. During the process of blood collection, mice
were fixed in position using a restraining device (cat. no. zk188;
CHICO.J.X Environmental Protection Technology Co., Ltd.) to prevent
rotation. One drop of blood was collected by puncturing the caudal
vein using a syringe needle, which was then dropped into blood
glucose test strips. Blood glucose level was measured using a micro
blood glucose meter (Johnson & Johnson) at 9 am before and
after treatment.
Reverse transcription-quantitative PCR
(RT-qPCR)
On day 30, four mice were randomly selected from the
GABA-R, NC, blank and normal groups, and intraperitoneally injected
with 1% pentobarbital sodium (40 mg/kg) for anesthesia. Following
euthanasia, brain tissues were separated and the hippocampus was
extracted. Total RNA in the right hippocampus was extracted using
the TRIzol reagent (Thermo Fisher Scientific Inc.). The RNA sample
(5 µl) was diluted 20X with ultra-pure water without RNase. The
optical density (OD) value was detected at 260 and 280 nm using an
ultraviolet spectrophotometer to determine the concentration and
purity of the RNA. RNAs with OD260/OD280 values between 1.7–2.1
were used for subsequent experiments. The cDNA template was
obtained by reverse transcription using a PrimeScript™ RT reagent
kit (cat. no. RR047A; Takara Bio, Inc.) in a PCR amplification
instrument. The reaction was performed at 37°C for 15 min and at
85°C for 5 sec. The ABI7500 qPCR instrument (cat. no. 4406985;
Thermo Fisher Scientific Inc.) was utilized to perform the qPCR
experiment using the EvaGreen® Dye (cat. no. 31000;
Biotium, Inc.). The reaction conditions were as follows: Initial
denaturation at 95°C for 10 min, followed by 50 cycles of
denaturation at 95°C for 15 sec and annealing and elongation at
60°C for 1 min. The following primers were used: GABA-R forward,
5′-TTCTAGCCTCCTTCCAGTATGATTTG-3′ and reverse,
5′-TACTCAACAGTACTGCTCCACTTCC-3′; GAPDH forward,
5′-GATGGGTGTGAACCACGAGAAAT-3′ and reverse,
5′-ACGGATACATTTGGGGGTAGGAA-3′. Each sample was measured three times
and data was analyzed using the 2−ΔΔCq method (23).
Western blot analysis
Total protein was extracted using a RIPA lysis
buffer (cat. no. P0013C; Beyotime Biotechnology Co., Ltd.) and the
Bradford method (24) was used to
perform protein quantification. Extracted protein (50 µg) was
separated by 7% SDS-PAGE and subsequently transferred to a PVDF
membrane (EMD Millipore; Merck KGaA). The membrane was then blocked
in 5% skimmed milk on a shaking table at 37°C for 1 h and incubated
with primary rabbit anti-mouse antibodies against GABA-R (1:1,000;
cat. no. ab86497; Abcam) and β-actin (1:1,000; cat. no. ab179467;
Abcam) overnight at 4°C. After washing with PBS supplemented with
0.05% Tween-20 three times (5 min/wash), the membrane was incubated
with a horseradish peroxidase labeled goat anti-rabbit IgG antibody
(1:2,000; cat. no. ab97051; Abcam) at room temperature for 2 h.
Membranes were subsequently washed and supplemented with
electrogenerated chemiluminescence solution (GE Healthcare). After
being developed with the X-ray film, protein bands were visualized
using a Bio-Rad image analysis system (Bio-Rad Laboratories, Inc.).
The relative content of the protein was expressed as a ratio of the
target protein OD value to that of the β-actin band using the
Quantity One software (v4.6.2; Bio-Rad Laboratories Inc.).
Transmission electron microscopy
Murine hippocampi were prefixed in 4% glutaraldehyde
for 5 h at 4°C, fixed in 1% Osmic acid for 2 h at 4°C, infiltrated
using epoxy resin and embedded. Specimens were cut into serial
ultrathin sections (60–70 nm) using an LKB-V type ultrathin slicing
machine (GE Healthcare). Sections were stained with 3% uranyl
acetate and lead citrate at room temperature for 2 min,
photographed and observed under a HITACHI H-600 transmission
electron microscope (magnification, ×400; Hitachi, Ltd.).
Measurement of hydroxyl (OH-) free
radicals in the hippocampus
The OH- content of the hippocampus was tested using
an OH-detection kit (cat. no. A018-1-1; Nanjing Jiancheng
Bioengineering Institute) in accordance with the manufacturers
protocol. Samples were then allowed to rest at room temperature for
20 min and the OD value was measured at 550 nm to calculate OH-
content (U/mg).
Electrophysiological experiment
Following anesthesia with sodium pentobarbital, mice
hippocampus tissues were removed and cut into ultrathin sections
(60–70 nm). Sections were then incubated in artificial
cerebrospinal fluid (cat. no. 597316; Friends Honesty Life Sciences
Co., Ltd.) for 1.5 h at 25°C. A bipolar stimulating electrode was
placed on the Schaffer collateral in the hippocampal CA3 region and
a glass electrode was placed on the pyramidal cell layer in the
hippocampal CA1 region to record the population spikes (PS). A
basal PS was induced with medium intensity stimulation. After
stabilization for 10 min, the PS was adjusted to 50–60% of the
maximum slope and kept stable for 15 min. Then, the Schaffer
collateral was stimulated by a 100 Hz high-frequency stimulation
(HFS; 100 strings) to induce LTP. Data was continuously recorded
for 60 min. Finally, two sets of high-intensity paired-pulse
low-frequency stimulations were delivered to depotentiate the LTP.
Results were continuously recorded for 110 min. The PS slope (%)
was recorded every 5 min, as previously described (25).
Statistical analysis
All data were processed using the statistical
software SPSS 21.0 (IBM Corp.). All measurement data were expressed
as the mean ± standard deviation. The weight and blood sugar levels
before and after treatment of the two groups were compared using a
paired Student's t-test. One-way ANOVA was used to compare data
among multiple groups, followed by Tukey's post-hoc test. The
comparison of the indexes of each group at different time points
was measured via repeated-measure variance analyses. P<0.05 was
considered to indicate a statistically significant result.
Results
Upregulated GABA-R decreases the
weight and blood glucose level of T2DM mice
Before treatment, the weights of mice in all groups
exhibited no significant differences. After treatment in the
GABA-R, NC, blank and normal groups, the weight and blood glucose
levels in the normal group also exhibited no marked differences
compared with those before treatment (all P>0.05), whereas no
significant differences were identified in the blood glucose level
(all P>0.05). Mice of the GABA-R group exhibited a significantly
increased weight and a significantly decreased blood glucose levels
after treatment when compared with that before treatment. Compared
with the blank group, mice of the GABA-R group exhibited decreased
weight and blood glucose levels (P<0.05; Table I).
 | Table I.Weight and blood glucose level of
mice in all groups. |
Table I.
Weight and blood glucose level of
mice in all groups.
|
| Weight (g) | Blood glucose
(mmol/l) |
|---|
|
|
|
|
|---|
| Groups | Before | After | Before | After |
|---|
| Normal | 35.34±3.02 | 36.16±3.03 | 9.43±0.95 | 9.56±0.97 |
| Blank | 35.53±3.12 |
47.33±3.79a | 25.46±4.23 | 27.32±6.02 |
| Negative
control | 35.39±3.04 |
47.76±3.68a | 25.39±4.45 | 27.93±6.29 |
| GABA-R | 35.89±3.97 |
41.74±3.93a,b | 25.37±4.17 |
19.14±5.03a,b |
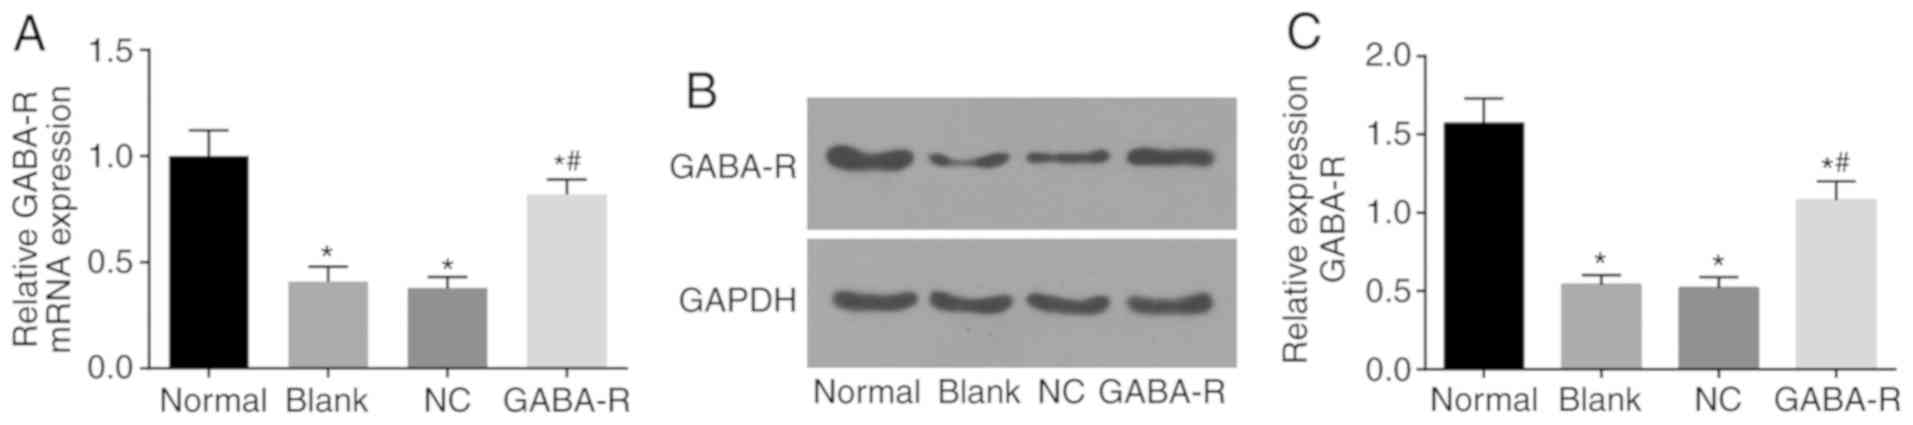
GABA-R mRNA and protein levels
RT-qPCR and western blot analysis was used to detect
GABA-R mRNA and protein expression in each group, respectively. The
results of the current study indicated that GABA-R mRNA and protein
levels in the GABA-R, NC and blank groups decreased compared with
the normal group (P<0.05; Fig. 1A and
B). Compared with the blank group, the mRNA and protein level
of GABA-R in the NC group were not markedly different (P>0.05;
Fig. 1A and B). However, the GABA-R
group exhibited an increase in GABA-R mRNA and protein levels
compared with the blank group (P<0.05; Fig. 1A and B). Based on these results, the
current study concluded that in vivo transfection increased
the expression of GABA-R in murine hippocampal CA1 regions.
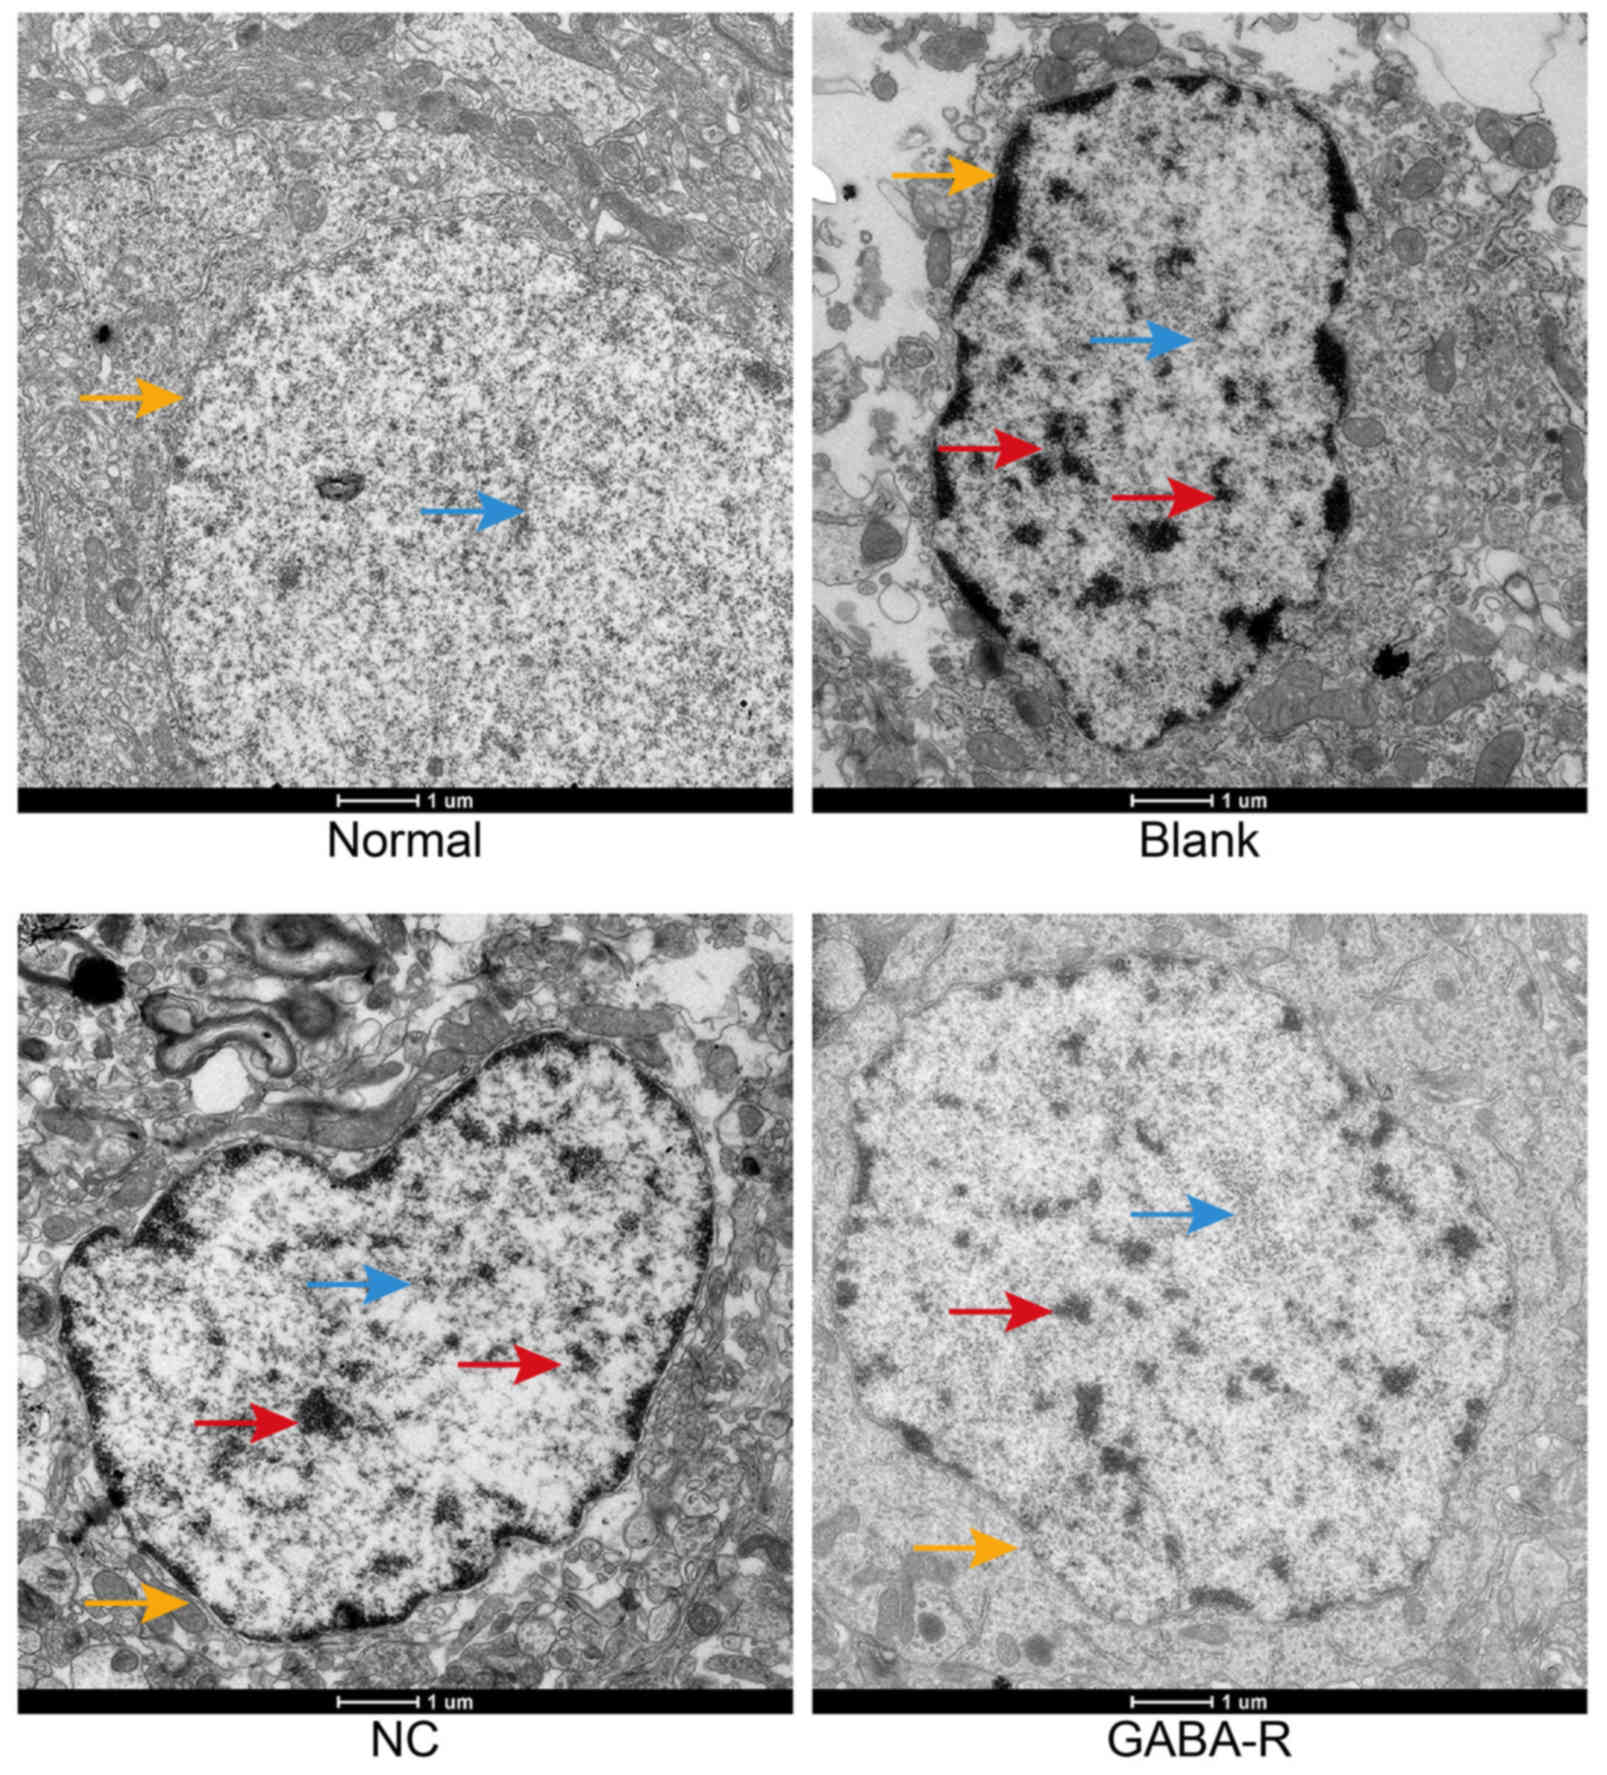
Upregulated GABA-R alleviates the
pathological changes in the hippocampal CA1 region of T2DM
mice
Transmission electron microscopy was performed to
observe the neuronal microstructure of mice hippocampi CA1 in each
group (Fig. 2). The normal group
exhibited a regular neuronal shape, smooth nuclear membranes,
well-distributed chromatin, and numerous rough endoplasmic
reticulum (RER) with ribosomes attached to the surface. The
hippocampal neurons of the blank and NC groups exhibited displaced
vacuoles in the cytoplasm, disintegration and maldistribution of
chromatin in the nucleus, an expanding RER and degranulation. A
nearly regular neuronal shape, decreased vacuoles in the cytoplasm,
and slight expanding of the partial RER was observed in the GABA-R
group compared with those in the blank group. The results
demonstrate that GABA may alleviate lesions in the hippocampus CAI
region of T2DM mice.
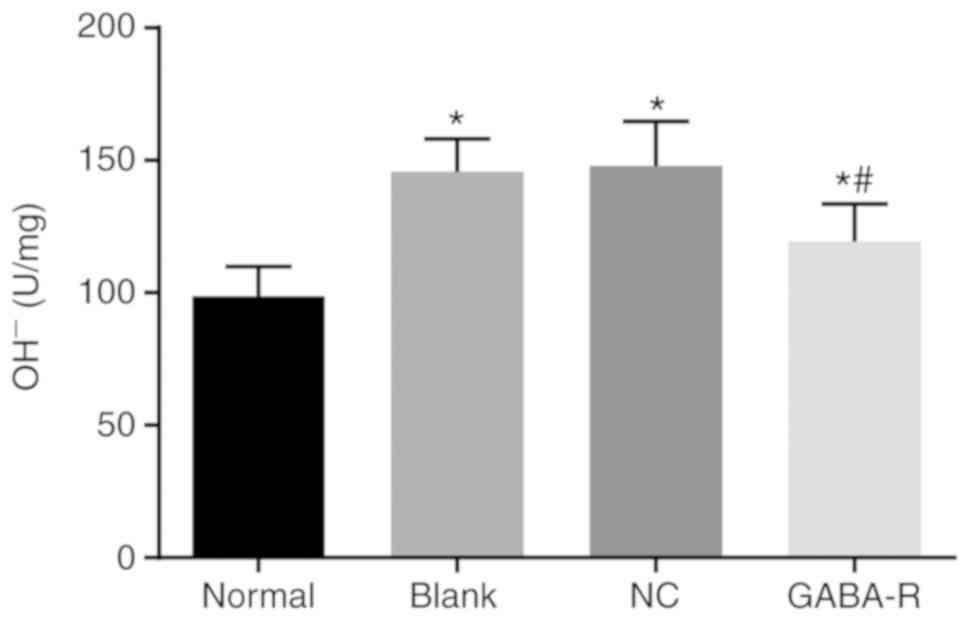
Upregulated GABA-R reduces the OH-
content in the hippocampus in T2DM mice
The hippocampal OH- content was increased in the
GABA-R, NC and blank groups compared with that in the normal group
(P<0.05; Fig. 3). Furthermore,
compared with the blank group, the NC group revealed no marked
difference (P>0.05), while the GABA-R group exhibited a
significant decrease in hippocampal OH- content (P<0.05;
Fig. 3). These data demonstrate that
OH-content is decreased by upregulated GABA.
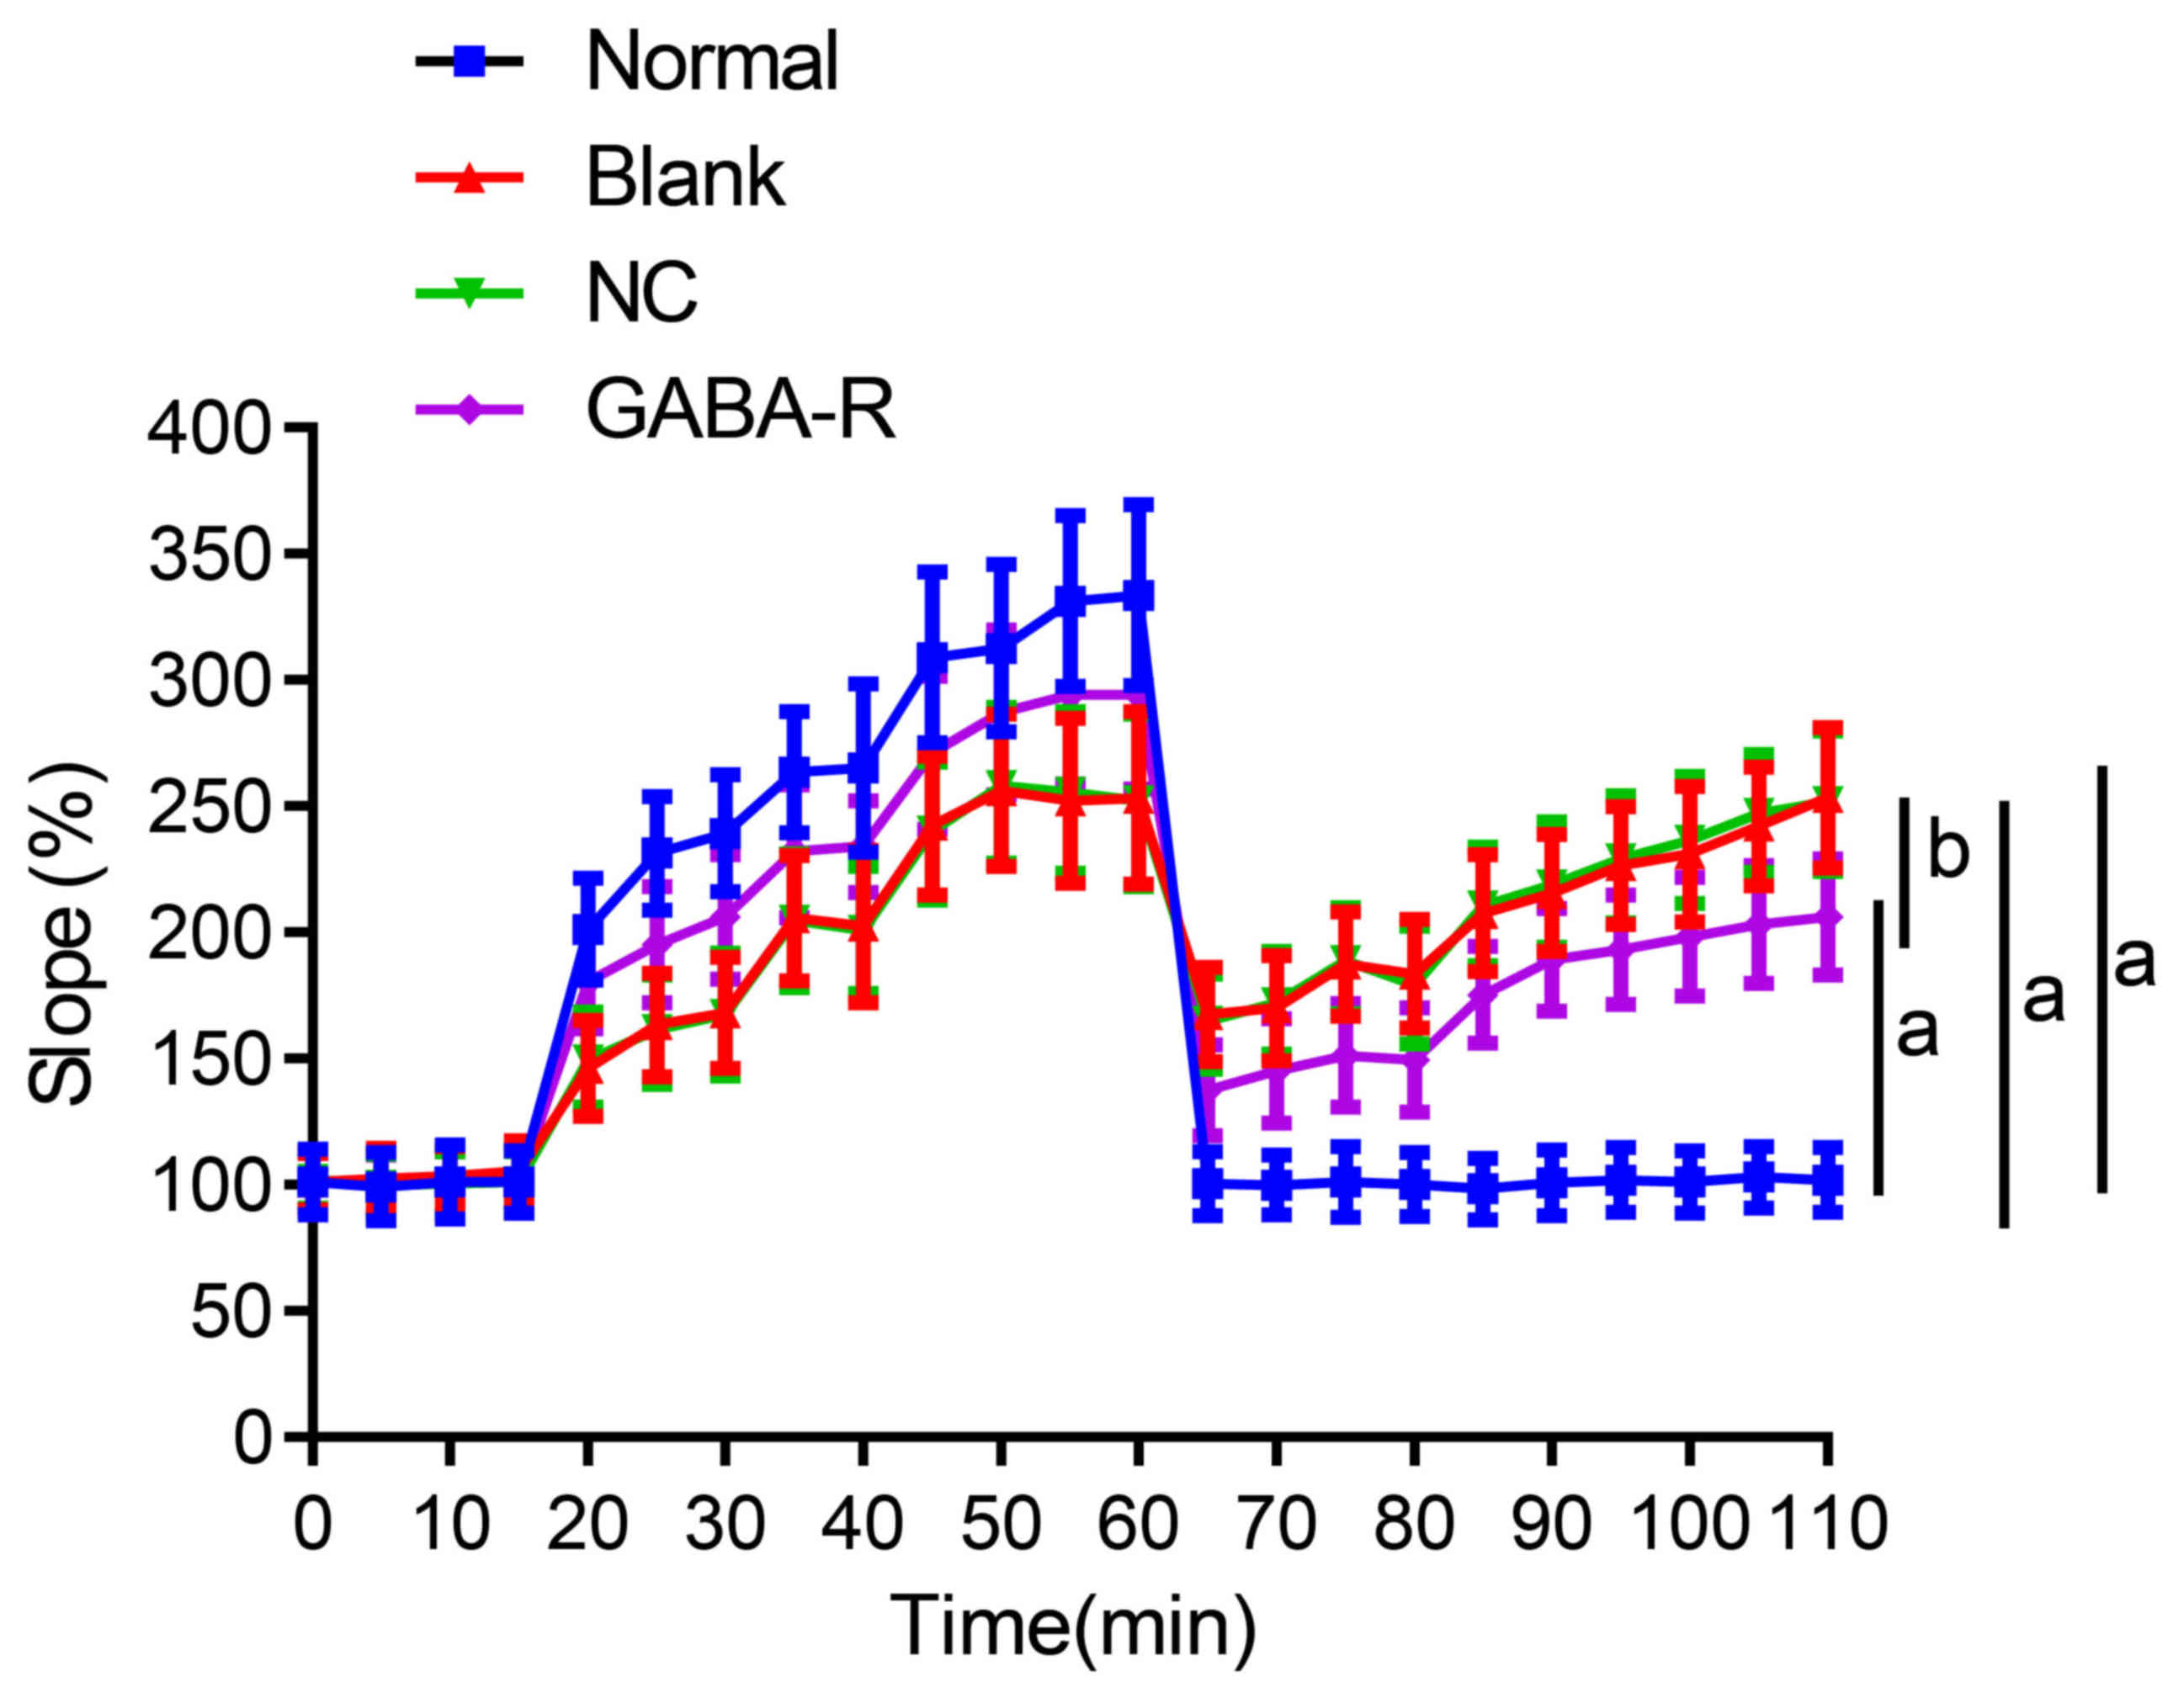
Upregulated GABA-R improves the
decrease in hippocampal synaptic transmission efficiency of T2DM
mice
The PS slope in the hippocampal CA1 region steadily
increased with enhanced synaptic transmission intensity and
efficiency after 60 min of HFS in the normal group. Although the PS
slope in the GABA-R, NC and blank groups also increased, it was
significantly lower than that in the normal group at the
corresponding time points (P<0.05; Table II; Fig.
4). Compared with the blank group, the NC group revealed no
marked differences (P>0.05; Table
II; Fig. 4), while the GABA-R
group exhibited a significant increase in PS slope at the
corresponding time points (P<0.05; Table II; Fig.
4). These results indicate that the upregulation of GABA-R
expression promotes a decrease in the hippocampal synaptic
transmission efficiency in T2DM mice.
| Table II.Changes in population spike slope in
CAl region of hippocampal slices of mice in each group. |
Table II.
Changes in population spike slope in
CAl region of hippocampal slices of mice in each group.
| Time | Normal | Blank | Negative
control | GABA-R |
|---|
| 0 | 101.14±13.12 | 101.24±11.15 | 102.14±11.34 | 101.42±11.16 |
| 5 | 99.27±13.53 | 102.61±11.98 | 99.74±12.54 | 99.97±11.74 |
| 10 | 100.11±14.62 | 103.64±11.39 | 100.63±12.43 | 100.74±12.54 |
| 15 | 101.21±12.26 | 105.65±11.79 | 101.19±11.83 | 101.21±12.29 |
| 20 | 210.32±20.24 |
146.1±18.98a |
149.57±18.86a |
180.34±18.39a,b |
| 25 | 231.43±22.52 |
163.34±20.57a |
161.41±21.73a |
195.18±22.97a,b |
| 30 | 239.31±23.24 |
168.14±22.12a |
167.45±24.28a |
206.24±24.74a,b |
| 35 | 263.46±23.89 |
205.67±24.74a |
204.76±26.45a |
232.12±26.36a,b |
| 40 | 265.21±33.41 |
202.34±30.12a |
200.93±25.24a |
234.11±18.14a,b |
| 45 | 308.85±33.82 |
242.35±27.43a |
240.19±27.39a |
271.26±30.28a,b |
| 50 | 312.63±33.29 |
256.22±30.19a |
258.29±30.91a |
287.24±32.74a,b |
| 55 | 331.28±33.74 |
252.19±32.59a |
255.43±31.91a |
294.32±35.57a,b |
| 60 | 333.64±35.97 |
253.29±34.24a |
252.29±34.24a |
294.11±37.36a,b |
| 65 | 100.43±12.62 |
167.57±18.6a |
164.73±18.83a |
137.44±17.91a,b |
| 70 | 99.98±11.74 |
170.05±20.84a |
172.19±20.4a |
145.18±20.73a,b |
| 75 | 101.23±13.92 |
187.45±20.68a |
188.83±20.84a |
151.24±20.44a,b |
| 80 | 100.21±12.64 |
183.61±21.53a |
179.16±23.36a |
149.52±20.63a,b |
| 85 | 98.37±12.26 |
207.64±23.14a |
210.34±23.53a |
175.31±19.04a,b |
| 90 | 100.87±12.94 |
215.64±23.29a |
218.94±24.75a |
189.26±20.28a,b |
| 95 | 101.93±12.85 |
226.52±23.42a |
229.04±25.26a |
193.24±21.74a,b |
| 100 | 101.21±12.43 |
231.05±26.81a |
236.54±25.17a |
198.32±23.57a,b |
| 105 | 103.02±12.12 |
242.01±23.43a |
247.3±23.33a |
203.29±23.36a,b |
| 110 | 101.98±12.92 |
253.37±27.75a |
250.42±23.64a |
206.14±23.03a,b |
Upregulated GABA-R enhances
depotentiation in the hippocampal CA1 region after LTP in T2DM
mice
High-intensity paired-pulse low frequency
stimulation was delivered after LTP for 60 min in the hippocampal
CA1 region. LTP reversal in the normal group returned to the
baseline level and the blank, NC and GABA-R groups all exhibited a
partial reversal of LTP; however, the degree was less than that
observed in the normal group (P<0.05; Table II; Fig.
4). Compared with the blank group, the NC group revealed no
marked difference (P>0.05; Table
II), while the GABA-R group exhibited more depotentiation
(P<0.05; Table II; Fig. 4). Data from the current study
therefore reveal that the overexpression of GABA-R promotes
depotentiation in the hippocampal CA1 region after LTP in T2DM
mice.
Discussion
The increase in T2DM global incidence has become an
emerging health concern to people worldwide (26). The present study was performed to
investigate the association between GABA-R and T2DM. The results
demonstrated that the upregulation of GABA-R protects the neuronal
ultrastructure and promotes LTP and depotentiation in the
hippocampal CA1 region of mice. This may be achieved via the
accumulation of OH- being accumulated in T2DM mice.
The current study demonstrated that T2DM induced a
decrease in GABA-R expression in the hippocampus of mice. Insulin
signaling modulates GABA-R and T2DM are mainly associated with
defects in insulin action (2,27). A
previous study has demonstrated that in a T2DM model, GABA levels
were increased and this increase was linked to the role of brain
glycogen in maintaining an appropriate ratio between inhibitory and
excitatory neurotransmitters (28).
Furthermore, GABA concentration in patients with T2DM has been
reported to be increased, which may be associated with lower
cognitive function (19).
In the current study, the results revealed that the
weight, blood glucose level and hippocampus OH- content of the
GABA-R, NC and blank groups were all increased compared with those
in the normal group. Furthermore, compared with the blank group,
the GABA-R group exhibited a decrease in weight, blood glucose
level and hippocampal OH- content. GABA-R has been revealed to be
strongly associated with insulin signaling (29). Excessive adipose tissue is also
associated with insulin resistance and the administration of
insulin serves an active role in glycemic control (30,31).
These results may provide an explanation for the increase in weight
and blood glucose level observed in T2DM mice and the decrease in
weight and blood glucose level after the upregulation of GABA-R in
the current study. Wilding et al (32) demonstrated that most patients
diagnosed with T2DM are overweight and that people with obesity are
more likely to develop T2DM. The increase in blood glucose levels
of the T2DM mice in the current study is consistent with a previous
report indicating that insulin homeostasis defects lead to T2DM,
resulting in an increase in blood glucose concentration (28). Furthermore, OH- content is associated
with insulin resistance due to the incorporation of ortho- and
meta-tyrosine, and the OH- products of L-phenylalanine into
cellular proteins, which leads to insulin resistance (33,34). The
link between OH- and insulin resistance may provide an explanation
for the observation in the present study; that OH- content
increases in T2DM mice and decreases after the upregulation of
GABA-R. This result is consistent with a study performed by Molnár
et al (35), who demonstrated
that meta- and ortho-tyrosine may potentially interfere with
insulin action. Additionally, the pathological change in the
neuronal morphology in the GABA-R group of the current study
decreased compared with that in the blank group. Due to its high
reactivity, OH- reacts with macromolecules and yields oxidation
products that induce damage to neurons via oxidative stress
(33,36). Therefore, the decrease in the OH-
content observed in the present study may have led to the decrease
in pathological changes of neuronal morphology in the GABA-R group
due to the reduced possibility of oxidative stress. Molnár et
al (35) indicated that a higher
plasma level or urinary excretion of ortho- and meta-tyrosine,
including hydroxylated phenylalanine derivatives, is associated
directly with an alteration of the oxidative state, thus serving as
markers of oxidative stress, which serves a significant role in the
pathogenesis of several morbidities including diabetic
nephropathy.
The current study revealed that after LTP was
induced, the PS slope in the GABA-R, NC and blank groups all
decreased compared with the normal group, while the GABA-R group
exhibited an increase in PS slope compared with the blank group.
During depotentiation, LTP reversal in the normal group returned to
the baseline level, but a partial reversal of LTP was observed in
the blank, NC and GABA-R groups. Furthermore, the GABA-R group
exhibited more depotentiation than the blank group. These results
indicate that GABA-R upregulation promoted the efficacy of LTP and
improved depotentiation in T2DM mice. T2DM has been proven to be
associated with cognitive dysfunction (14). Cognitive impairments are widely
believed to result from the progressive disruption of synaptic
function and neurodegeneration triggered by aggregated amyloid-β,
which contributes to the impairment of LTP (16,18).
However, GABA is the principal CNS inhibitory neurotransmitter and
upregulated GABA-R may exhibit an active influence on synaptic
plasticity, which also contributes to the increase in the PS slope
after the upregulation of GABA-R (9,19).
In conclusion, the present study assessed the
effects of GABA-R upregulation on the weight, blood glucose level,
accumulation of OH-, neuronal ultrastructure, LTP and reversal LTP
in T2DM mice. Ultimately, the data revealed that the upregulation
of GABA-R serves an active role in LTP and depotentiation in the
hippocampal CA1 region in T2DM mice. However, GABA-Rs can also be
divided into GABA-A receptors, GABA-B receptors and GABA-C
receptors, according to their different pharmacological
characteristics (37) and the
present study did not assess these specific types. Thus, further
studies are necessary to confirm the results obtained in the
present study.
Acknowledgements
The experiments were performed at the Cloud-Clone
Corp (Wuhan, China).
Funding
The present study was supported by The Youth
Training Program of Sichuan Provincial Science and Technology
Department (grant no. 2016049).
Availability of data and materials
The datasets used and/or analyzed during the present
study are available from the corresponding author upon reasonable
request.
Authors' contributions
LT and QS designed the study. LT and LW collated the
data, designed and developed the database, JS and JL performed the
data analyses and produced the initial draft of the manuscript. JS,
JL and LT drafted the manuscript. All authors have read and
approved the final submitted manuscript.
Ethics approval and consent to
participate
The current study was performed with the approval of
the Animal Ethics Committee of Sichuan Academy of Medical Sciences
& Sichuan Provincial People's Hospital (Chengdu, China). All
animal experiments were performed in strict accordance with the
Guide for the Care and Use of Laboratory Animal by International
Committees.
Patient consent for publication
Not applicable.
Competing interests
The authors declare that they have no competing
interests.
References
|
1
|
Alharbi KK, Khan IA, Munshi A, Alharbi FK,
Al-Sheikh Y and Alnbaheen MS: Association of the genetic variants
of insulin receptor substrate 1 (IRS-1) with type 2 diabetes
mellitus in a Saudi population. Endocrine. 47:472–477. 2014.
View Article : Google Scholar : PubMed/NCBI
|
|
2
|
DeFronzo RA: Pharmacologic therapy for
type 2 diabetes mellitus. Ann Intern Med. 131:281–303. 1999.
View Article : Google Scholar : PubMed/NCBI
|
|
3
|
O'Keefe JH, Abuannadi M, Lavie CJ and Bell
DS: Strategies for optimizing glycemic control and cardiovascular
prognosis in patients with type 2 diabetes mellitus. Mayo Clin
Proc. 86:128–138. 2011. View Article : Google Scholar : PubMed/NCBI
|
|
4
|
Wang J, Huang Y, Li K, Chen Y, Vanegas D,
McLamore ES and Shen Y: Leaf Extract from lithocarpus polystachyus
rehd. Promote glycogen synthesis in T2DM mice. PLoS One.
11:e01665572016. View Article : Google Scholar : PubMed/NCBI
|
|
5
|
Zinman B: Initial combination therapy for
type 2 diabetes mellitus: Is it ready for prime time? Am J Med. 124
(Suppl 1):S19–S34. 2011. View Article : Google Scholar : PubMed/NCBI
|
|
6
|
Alonso-Magdalena P, Quesada I and Nadal A:
Endocrine disruptors in the etiology of type 2 diabetes mellitus.
Nat Rev Endocrinol. 7:346–353. 2011. View Article : Google Scholar : PubMed/NCBI
|
|
7
|
Adeghate E, Schattner P and Dunn E: An
update on the etiology and epidemiology of diabetes mellitus. Ann N
Y Acad Sci 1084. 1–29. 2006. View Article : Google Scholar
|
|
8
|
Taneera J, Jin Z, Jin Y, Muhammed SJ,
Zhang E, Lang S, Salehi A, Korsgren O, Renström E, Groop L and
Birnir B: γ-Aminobutyric acid (GABA) signalling in human pancreatic
islets is altered in type 2 diabetes. Diabetologia. 55:1985–1994.
2012. View Article : Google Scholar : PubMed/NCBI
|
|
9
|
Bravo JA, Forsythe P, Chew MV, Escaravage
E, Savignac HM, Dinan TG, Bienenstock J and Cryan JF: Ingestion of
Lactobacillus strain regulates emotional behavior and central GABA
receptor expression in a mouse via the vagus nerve. Proc Natl Acad
Sci USA. 108:16050–16055. 2011. View Article : Google Scholar : PubMed/NCBI
|
|
10
|
Tian J, Dang HN, Yong J, Chui WS, Dizon
MP, Yaw CK and Kaufman DL: Oral treatment with gamma-aminobutyric
acid improves glucose tolerance and insulin sensitivity by
inhibiting inflammation in high fat diet-fed mice. PLoS One.
6:e253382011. View Article : Google Scholar : PubMed/NCBI
|
|
11
|
Petrou M, Pop-Busui R, Foerster BR, Edden
RA, Callaghan BC, Harte SE, Harris RE, Clauw DJ and Feldman EL:
Altered excitation-inhibition balance in the brain of patients with
diabetic neuropathy. Acad Radiol. 19:607–612. 2012. View Article : Google Scholar : PubMed/NCBI
|
|
12
|
Santhakumari R, Reddy IY and Archana R:
Effect of type 2 diabetes mellitus on brain metabolites by using
proton magnetic resonance spectroscopy-a systematic review. Int J
Pharma Bio Sci. 5:1118–1123. 2014.PubMed/NCBI
|
|
13
|
Hempel R, Onopa R and Convit A: Type 2
diabetes affects hippocampus volume differentially in men and
women. Diabetes Metab Res Rev. 28:76–83. 2012. View Article : Google Scholar : PubMed/NCBI
|
|
14
|
Wang Y, Xu XY, Feng CH, Li YL, Ge X, Zong
GL, Wang YB, Feng B and Zhang P: Patients with type 2 diabetes
exhibit cognitive impairment with changes of metabolite
concentration in the left hippocampus. Metab Brain Dis.
30:1027–1034. 2015. View Article : Google Scholar : PubMed/NCBI
|
|
15
|
Grassi S, Tozzi A, Costa C, Tantucci M,
Colcelli E, Scarduzio M, Calabresi P and Pettorossi VE: Neural
17β-estradiol facilitates long-term potentiation in the hippocampal
CA1 region. Neuroscience. 192:67–73. 2011. View Article : Google Scholar : PubMed/NCBI
|
|
16
|
Kumar A: Long-term potentiation at CA3-CA1
hippocampal synapses with special emphasis on aging, disease, and
stress. Front Aging Neurosci. 3:72011. View Article : Google Scholar : PubMed/NCBI
|
|
17
|
Abbatecola AM, Olivieri F, Corsonello A,
Antonicelli R, Corica F and Lattanzio F: Genome-wide association
studies: Is there a genotype for cognitive decline in older persons
with type 2 diabetes? Curr Pharm Des. 17:347–356. 2011. View Article : Google Scholar : PubMed/NCBI
|
|
18
|
Min JA, Lee HR, Kim JI, Ju A, Kim DJ and
Kaang BK: Impairment of long-term potentiation in the hippocampus
of alcohol-treated OLETF rats. Neurosci Lett. 500:52–56. 2011.
View Article : Google Scholar : PubMed/NCBI
|
|
19
|
van Bussel FC, Backes WH, Hofman PA, Puts
NA, Edden RA, van Boxtel MP, Schram MT, Stehouwer CD, Wildberger JE
and Jansen JF: Increased GABA concentrations in type 2 diabetes
mellitus are related to lower cognitive functioning. Medicine
(Baltimore). 95:e48032016. View Article : Google Scholar : PubMed/NCBI
|
|
20
|
Redfors B, Oras J, Shao Y, Seemann-Lodding
H, Ricksten SE and Omerovic E: Cardioprotective effects of
isoflurane in a rat model of stress-induced cardiomyopathy
(takotsubo). Int J Cardiol. 176:815–821. 2014. View Article : Google Scholar : PubMed/NCBI
|
|
21
|
Hitti FL and Siegelbaum SA: The
hippocampal CA2 region is essential for social memory. Nature.
508:88–92. 2014. View Article : Google Scholar : PubMed/NCBI
|
|
22
|
Bathina S and Das UN: Dysregulation of
PI3K-Akt-mTOR pathway in brain of streptozotocin-induced type 2
diabetes mellitus in Wistar rats. Lipids Health Dis. 17:1682018.
View Article : Google Scholar : PubMed/NCBI
|
|
23
|
Livak KJ and Schmittgen TD: Analysis of
relative gene expression data using real-time quantitative PCR and
the 2(-Delta Delta C(T)) method. Methods. 25:402–408. 2001.
View Article : Google Scholar : PubMed/NCBI
|
|
24
|
Carlsson N, Borde A, Wölfel S, Kerman B
and Larsson A: Quantification of protein concentration by the
Bradford method in the presence of pharmaceutical polymers. Anal
Biochem. 411:116–121. 2011. View Article : Google Scholar : PubMed/NCBI
|
|
25
|
Bitiktaş S, Tan B, Kavraal Ş, Yousef M,
Bayar Y, Dursun N and Süer C: The effects of intra-hippocampal
L-thyroxine infusion on long-term potentiation and long-term
depression: A possible role for the αvβ3 integrin receptor. J
Neurosci Res. 95:1621–1632. 2017. View Article : Google Scholar : PubMed/NCBI
|
|
26
|
Wu H, Zhong J, Yu M, Wang H, Gong W, Pan
J, Fei F, Wang M, Yang L and Hu R: Incidence and time trends of
type 2 diabetes mellitus in youth aged 5–19 years: A
population-based registry in Zhejiang, China, 2007 to 2013. BMC
Pediatr. 17:852017. View Article : Google Scholar : PubMed/NCBI
|
|
27
|
Kleinridders A, Ferris HA, Cai W and Kahn
CR: Insulin action in brain regulates systemic metabolism and brain
function. Diabetes. 63:2232–2243. 2014. View Article : Google Scholar : PubMed/NCBI
|
|
28
|
Sickmann HM, Waagepetersen HS, Schousboe
A, Benie AJ and Bouman SD: Brain glycogen and its role in
supporting glutamate and GABA homeostasis in a type 2 diabetes rat
model. Neurochem Int. 60:267–275. 2012. View Article : Google Scholar : PubMed/NCBI
|
|
29
|
Enell LE, Kapan N, Söderberg JA, Kahsai L
and Nässel DR: Insulin signaling, lifespan and stress resistance
are modulated by metabotropic GABA receptors on insulin producing
cells in the brain of Drosophila. PLoS One. 5:e157802010.
View Article : Google Scholar : PubMed/NCBI
|
|
30
|
Lee M and Aronne LJ: Weight management for
type 2 diabetes mellitus: Global cardiovascular risk reduction. Am
J Cardiol. 99:68B–79B. 2007. View Article : Google Scholar : PubMed/NCBI
|
|
31
|
Blevins T: Control of postprandial glucose
levels with insulin in type 2 diabetes. Postgrad Med. 123:135–147.
2011. View Article : Google Scholar : PubMed/NCBI
|
|
32
|
Wilding JP: The importance of weight
management in type 2 diabetes mellitus. Int J Clin Pract.
68:682–691. 2014. View Article : Google Scholar : PubMed/NCBI
|
|
33
|
Molnár GA, Mikolás EZ, Szijártó IA, Kun S,
Sélley E and Wittmann I: Tyrosine isomers and hormonal signaling: A
possible role for the hydroxyl free radical in insulin resistance.
World J Diabetes. 6:500–507. 2015. View Article : Google Scholar : PubMed/NCBI
|
|
34
|
Mikolás E, Kun S, Laczy B, Molnár GA,
Sélley E, Kőszegi T and Wittmann I: Incorporation of ortho- and
meta-tyrosine into cellular proteins leads to
erythropoietin-resistance in an erythroid cell line. Kidney Blood
Press Res. 38:217–225. 2013. View Article : Google Scholar : PubMed/NCBI
|
|
35
|
Molnár GA, Kun S, Sélley E, Kertész M,
Szélig L, Csontos C, Böddi K, Bogár L, Miseta A and Wittmann I:
Role of tyrosine isomers in acute and chronic diseases leading to
oxidative stress-A review. Curr Med Chem. 23:667–685. 2016.
View Article : Google Scholar : PubMed/NCBI
|
|
36
|
Kimura Y and Kimura H: Hydrogen sulfide
protects neurons from oxidative stress. FASEB J. 18:1165–1167.
2004. View Article : Google Scholar : PubMed/NCBI
|
|
37
|
Cheng ZY, Chebib M and Schmid KL:
Identification of GABA receptors in chick cornea. Mol Vis.
18:1107–1114. 2012.PubMed/NCBI
|