Introduction
Globally, the number of adults affected by diabetes
mellitus (DM) increased rapidly from ~108,000,000 in 1980 to
422,000,000 in 2014 (1). In the
adult population, the global prevalence of DM has nearly doubled
from 4.7 to 8.5% since 1980 (1). The
prevalence of DM in adults reported by the International Diabetes
Federation Western Pacific Region ranges between 2.6% in Cambodia
and 16.9% in Malaysia (2). The major
risk factors for type 2 DM (T2DM) are age, metabolic conditions
(overweight and obesity) and lifestyle (unhealthy diet, physical
inactivity and smoking); however, genetic factors, including
ethnicity, family history of diabetes and previous gestational
diabetes may serve crucial roles in increasing T2DM susceptibility
(1). The mean height, weight, body
mass index (BMI) and total visceral fat volume are lower in the
East Asian population compared with in the African and Caucasian
populations; however, non-obese East Asian individuals can also
develop T2DM (3–6). A family history of T2DM is a crucial
factor. If a parent has T2DM, their children are 40% as likely to
develop T2DM. If both parents have T2DM, the probability of their
children developing T2DM exceeds 70% (7,8). In
addition, different ethnic groups exhibit different incidence
rates; this also demonstrates the effects of genetic factors
(9). In the majority of individuals,
T2DM causes insulin resistance in its target tissues throughout the
body, and eventually the b-cells of the pancreatic islets fail to
secrete sufficient insulin to overcome the resistance. In addition
to environmental factors, multiple genetic factors appear to cause
predisposition to T2DM (10,11). Currently, >120 associated gene
variants have been identified and have minor effects on diabetes
risk (12). There is no complete
information regarding genetic susceptibility of T2DM despite the
availability of novel detection techniques; thus, additional pieces
of the puzzle may help to explain the heritability of diabetes.
Polyamines are organic polycations essential for
cell growth and differentiation, and impairment of the polyamine
signaling pathway can lead to numerous diseases and conditions,
including cancer, inflammation, stroke, renal failure and diabetes
(13). Ornithine decarboxylase (ODC)
is involved in the commitment and rate-limiting step in polyamine
biosynthesis, and polyamine homeostasis is maintained by the
regulatory proteins antizyme isoform 1 (AZ1) and antizyme inhibitor
1 (AZIN1) (14). Translation of
intracellular AZ1 occurs alongside upregulation of intracellular
polyamine synthesis (15,16). AZ1 binds to ODC to form an ODC-AZ1
heterodimer that inhibits polyamine production (14). AZIN1 is obtained from rat liver
extract, exhibits high similarity in sequence and structure to ODC,
and has a greater affinity for AZ1 than ODC (17). AZIN1 inhibits the activity of ODC,
promotes ubiquitin-dependent degradation of ODC and contributes to
carcinogenesis (17). However,
binding of AZ1 to ODC reduces the cellular polyamine level and
affects the conversion of ASPC-1 cells into α-cells, which form
islet-like structures and express the glucagon gene to regulate
pancreatic endocrine cell function (18). Competition between AZIN1 and ODC for
AZ1 binding effectively restores ODC activity and increases the
cellular polyamine level, which may serve a role in diabetes
(16). The present study
demonstrated that AZIN1 genetic polymorphisms are potential
candidate genes for diabetes in the Taiwanese population and
revealed the downregulation of AZIN1 gene expression in T2DM.
Materials and methods
Patients and sample collection for
genotyping
In the present study, a total of 570 T2DM patients,
aged 20 years and older (mean age, 63.6±11.5; 51.4% male
individuals) were enrolled at China Medical University Hospital
(Taichung, Taiwan) between August 2014 and July 2015. All patients
met the diagnostic criteria (19)
for T2DM with the exclusion criteria those without T2DM. To
determine the prevalence of polymorphism in these patients,
genotype frequency data of 1,700 healthy controls was downloaded
from the Taiwan Biobank (https://taiwanview.twbiobank.org.tw/) (case no:
TWBR10509-02; control no: TWBR10309-001) (9). In addition, to determine the
association between polymorphism and clinical features in T2DM
patients, the clinical features, including age, BMI, hemoglobin
A1c, blood urea nitrogen, creatinine, uric acid, total calcium,
phosphorus, parathyroid hormone (PTH), albumin, cholesterol,
triglycerides, low-density lipoprotein-C and alanine
aminotransferase (ALT) were also downloaded from the Taiwan
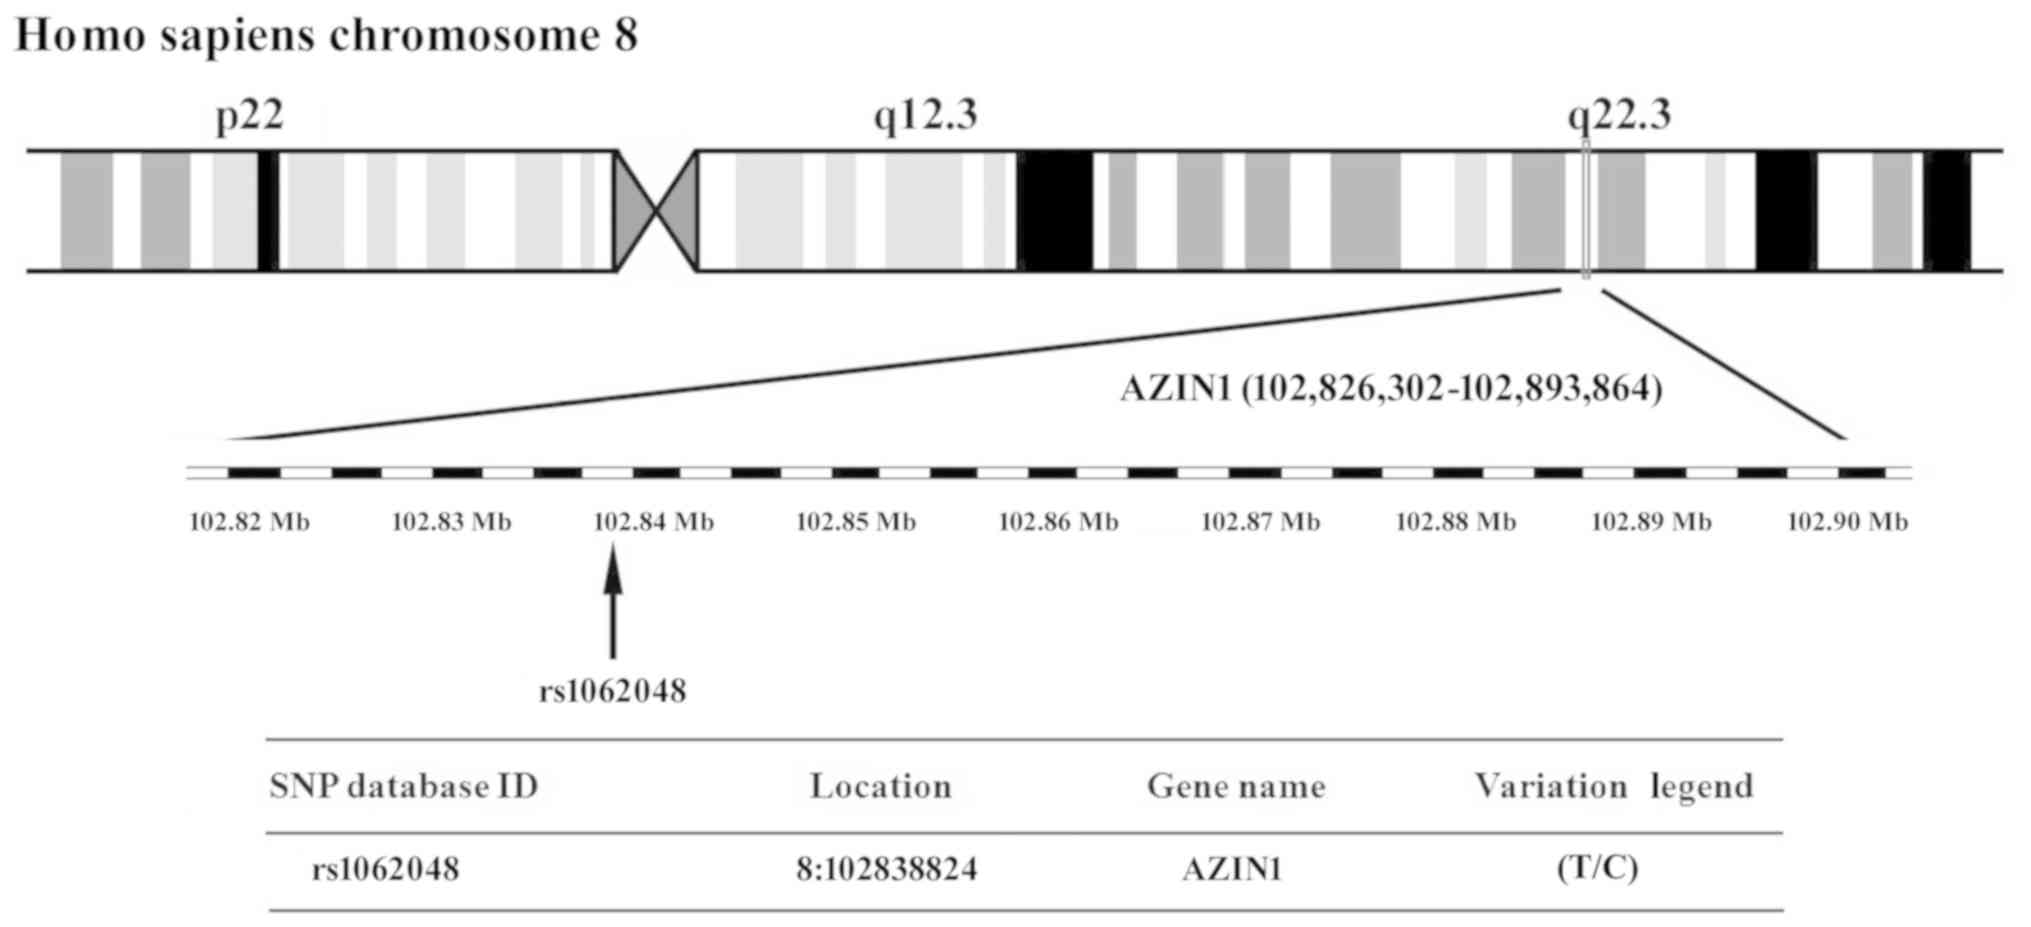
Biobank. The present study obtained the rs1062048 single-nucleotide
polymorphism (SNP) at chromosome region 8q22.3 in AZIN1 (Fig. 1) from the National Center for
Biotechnology Information's SNP database (http://www.ncbi.nlm.nih.gov/snp). The SNPs in the T2DM
and control groups were then compared. Tag SNPs were selected using
the Tagger function (http://software.broadinstitute.org/mpg/tagger/server.html)
with the additional criteria: ii) A threshold minor allele
frequency in the HapMap phase 3; and ii) Han Chinese in Beijing,
China (CHB) + Japanese in Tokyo, Japan (JPT) population of 0.05 for
‘tag SNPs’. Chi-square tests were used to calculate odds ratios and
P-values. All study protocols were approved by the Ethical
Committee of China Medical University Hospital (approval no.
CMUH103-REC2-071). Informed consent was obtained from all analyzed
patients.
Animal model
A total 24 male background BKS.Cg-Dock
7m+/+ Leprdb/JNarl mice (age, 4 weeks old)
were purchased from the National Laboratory Animal Center. Mice
with the +Dock7m/+Dock7m genotype constituted
the control group (n=12) and those with the
+Leprdb/+Leprdb genotype constituted the T2DM
group (n=12). The diabetic mice averaged 62±3 g in body weight at
the time of the studies and their control littermates averaged 20±1
g. The animals were housed in individual cages and provided with
lab chow ad libitum (Lab Diet 5k52; Purina) in a room at
22–25°C, with sufficient water, a relative humidity of 50–70%, and
a 12-h light/dark cycle. The present study involved animal
experiments and considered the 3R principles of ‘Replace’, ‘Reduce’
and ‘Refine’ to optimize experimental design (20). According to the information from
Jackson Laboratory (JAX stock #000642) (21), the mouse model exhibited elevated
blood sugar at 4–8 weeks and mortality by 10 months of age. The
mice in the present study were divided into six groups (four mice
per group), namely three control groups of mice aged 4 (early
stage), 16 (middle stage) and 32 (late stage) weeks, and three T2DM
groups of mice aged 4 (early stage), 16 (middle stage) and 32 (late
stage) weeks. Mice were sacrificed and the liver tissue was
obtained at the scheduled time. Sample went through the methodology
of flash freezing (22), which
provided excellent specimen integrity and a wide array of options
for tissue analysis, including extraction of RNA and proteins in
the present research. The present study was reviewed and approved
by the Institutional Animal Care and Use Committee (IACUC) of China
Medical University (IACUC permit no. 2106-221).
Reverse transcription-quantitative PCR
(RT-qPCR)
The RNeasy Mini kit (Qiagen, Inc.) was used for
total RNA isolation from the liver tissues of the control and T2DM
mice, and the Superscript First-Strand Synthesis kit (Invitrogen;
Thermo Fisher Scientific, Inc.) was used for complementary DNA
transcription, as previously described (23). Briefly, the cDNA synthesis reaction
protocol including reverse transcription step, 30 min at 42°C and
RT inactivation step, 1 min at 95°C. To study gene expression, qPCR
was performed using the ABI ViiA™ 7 Real-Time PCR system (Applied
Biosystems; Thermo Fisher Scientific, Inc.) and TaqMan™ MGB (minor
groove binder)-NFQ (nonfluorescent quencher) Universal ProbeLibrary
(Roche Diagnostics) probes, as previously described (24). The primer sequences were as follows:
Mus musculus AZIN1 (NM_018745.5) forward,
5′-TGCTAAGAAAGTTGTTGAAAATGATAA-3′; murine AZIN1 reverse,
5′-CTGGCTCATCACTCCCATTT-3′ with UPL probe #6 (Roche, cat. no.
04685032001); mouse GAPDH (M32599.1) forward,
5′-GAGCCAAACGGGTCATCA-3′; and murine GAPDH reverse,
5′-CATATTTCTCGTGGTTCACACC-3′ with UPL probe #29 (Roche, cat. no.
04687612001). PCR amplification conditions were: Initial
denaturation at 95°C for 5 min, followed by 25 cycles of 95°C for
10 sec, 56°C for 10 sec and 72°C for 20 sec, with a final extension
at 72°C for 5 min. The target gene expression levels were
normalized to mouse GAPDH expression. The relative quantification
gene expression of AZIN1 was determined using the 2−ΔΔCq
method (25). The assay was run in
triplicate for each case to allow for assessment of technical
variability. To account for PCR amplification of contaminating
genomic DNA, a control without reverse transcription was included.
To improve the accuracy of RT-qPCR for quantification,
amplifications were performed in triplicate for each RNA
sample.
Western blot (WB) analysis
In the present study, an anti-AZIN1 (cat. no.
orb154904; Biorbyt, Ltd.) polyclonal anti-rabbit antibodies were
used to detect AZIN1 in the WB analysis. Samples were separated by
SDS-PAGE on a 12.5% gel. WB was performed as described previously
(26). Frozen liver tissue samples
were homogenized with three volumes of 10 mM ice cold phosphate
buffer (pH 7.0), containing 1 mM ethylenediaminetetraacetic acid,
0.25 M sucrose, 1 mM sodium azide and 0.1 mM phenylmethylsulfonyl
fluoride. Samples were centrifuged at 20,000 × g for 30 min at 4°C.
The protein concentration was measured using a bicinchoninic acid
assay (Pierce; Thermo Fisher Scientific, Inc.). The tissue lysate
was obtained through denaturing electrophoresis by SDS-PAGE on a
12.5% with 60 mg protein loaded per lane, electrotransferred to a
polyvinylidene difluoride membrane, the blots was incubated with
blocking buffer (1X PBS and 5% nonfat dry milk) for 1 h at room
temperature and then probed with primary anti-AZIN1 antibodies
(1:1,000; cat. no. orb154904; Biorbyt, Ltd.) overnight at 4°C,
followed by incubation with horseradish peroxidase-conjugated
secondary antibody (1:5,000; cat. no. GTX213110; GeneTex) for 1
hour at RT. To control equal loading of total protein in all lanes,
blots were stained with mouse anti-β-actin antibody (1:5,000; cat.
no. ab8226; Abcam). The bands were visualized using an enhanced
chemiluminescence kit (GE Healthcare) according to the
manufacturer's protocol. Finally, the blots were visualized using
an ImageQuant™ LAS 4000 system (GE Healthcare) (27).
Immunohistochemistry (IHC)
analysis
AZIN1 protein expression was determined using IHC
analysis of paraffin-embedded liver sections. Anti-AZIN1 IHC
staining was conducted using the LAB-SA Detection System (cat. no.
85-8943; Invitrogen; Thermo Fisher Scientific, Inc.). IHC was
performed as described previously (28). Paraffin tissue sections (5 µm thick)
were dewaxed, treated with proteinase K enzyme and incubated in 3%
hydrogen peroxide for 10 min at room temperature to block
endogenous peroxidase activity. After being washed in PBS (pH 7.6)
for 5 min, the sections were incubated in 0.1% Triton X in PBS with
primary anti-AZIN1 antibody (cat. no. orb154904; 1:200 dilution;
Biorbyt, Ltd.) at 4°C for overnight followed by staining with
secondary rabbit anti-rat antibody conjugated with horseradish
peroxidase (1× reagent B; cat. no. 1454284A; Invitrogen; Thermo
Fisher Scientific, Inc.) at room temperature for 20 min. The
immunocomplexes were visualized after treatment with
3,3′-diaminobenzidine (cat. no. 00-2014; Invitrogen; Thermo Fisher
Scientific, Inc.) solution for 5 min at room temperature. The
sections were then washed with PBS (pH 7.6) for further processing
(29–31). The AZIN1 protein expression was
defined using light microscopy (Leica DM 1000 LED Lab; cat. no.
10052-384; Leica Microsystems, Inc.) at a magnification of ×100 or
×400.
Statistical analysis
Statistically significant differences in
allele/genotype frequencies of AZIN1 SNP (rs1062048) between the
T2DM and control groups were determined using the χ2
test. Odds ratios were calculated from the genotypic frequency and
allelic frequency at 95% CI for the AZIN1 SNP (rs1062048).
Statistical analysis was performed using SPSS software (version 11;
SPSS, Inc.). Data from three independent experiments are expressed
as the mean ± SE. Statistical comparisons between the T2DM and
control groups were performed using Student's t-test. P<0.05 was
considered to indicate a statistically significant difference.
Results
Genotypic and allelic frequencies of
AZIN1 gene polymorphisms in patients with T2DM and controls
Table I presents the
allelic and genotypic frequencies of the rs1062048 AZIN1 gene
polymorphism distribution in patients with T2DM and controls. It
was observed that the T allele in the rs1062048 polymorphism was
higher in the patients with T2DM (87.6%; 999/1,140) than in the
controls (85.2%; 2,897/3,400). The frequencies of the TT genotype
at rs1062048 differed between the control group (72.3%; 1229/1700)
and patients with T2DM (77.4%; 441/570). Genotype frequencies were
significantly different between T2DM and control groups (P=0.039).
The data suggested that the T allele and TT genotype at rs1062048
SNP are risk factors for T2DM.
 | Table I.Genotypic and allelic frequencies of
antizyme inhibitor 1 genetic polymorphism in patients with T2DM and
controls. |
Table I.
Genotypic and allelic frequencies of
antizyme inhibitor 1 genetic polymorphism in patients with T2DM and
controls.
| A, Genotype
data |
|---|
|
|---|
| Genotype | T2DM (n=570), n
(%) | Control (n=1,700),
n (%) | OR (95% CI) | P-value |
|---|
| CC | 12 (2.1) | 32 (1.9) | 1.05
(0.53–2.05) | 0.039 |
| CT | 117 (20.5) | 439 (25.8) | 0.74
(0.59–0.94) |
|
| TT | 441 (77.4) | 1229 (72.3) | 1.00 |
|
|
| B, Allele
frequency data |
|
| Allele | T2DM (n=1,140),
n (%) | Control
(n=3,400), n (%) | OR (95%
CI) | P-value |
|
| C | 141 (12.4) | 503 (14.8) | 0.81
(0.67–0.99) | 0.042 |
| T | 999 (87.6) | 2,897 (85.2) | 1.00 |
|
Downregulation of AZIN1 gene
expression in liver tissues of T2DM mice
The control (+Dock7m/+Dock7m)
and T2DM (+Leprdb/+Leprdb) mice were
sacrificed at 4, 16 and 32 weeks of age, and liver tissue RNA was
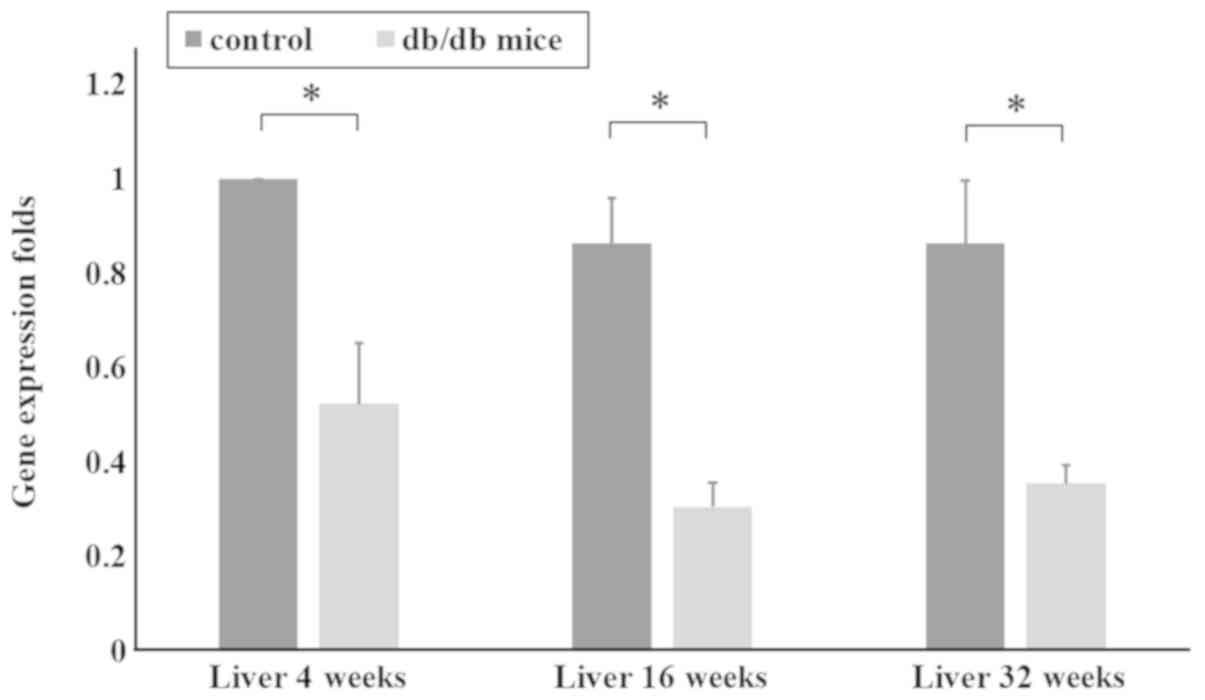
extracted for RT-qPCR. The qPCR data in Fig. 2 shows AZIN1 gene expression in the
liver tissues of mice aged 4, 16 and 32 weeks. AZIN1 gene
expression in the liver tissues of mice in the T2DM group was
significantly lower than that in the control group (P<0.05;
Fig. 2). These results suggested
that downregulation of AZIN1 gene expression occurred in the T2DM
mice.
Downregulation of AZIN1 protein
expression in liver tissues of T2DM mice
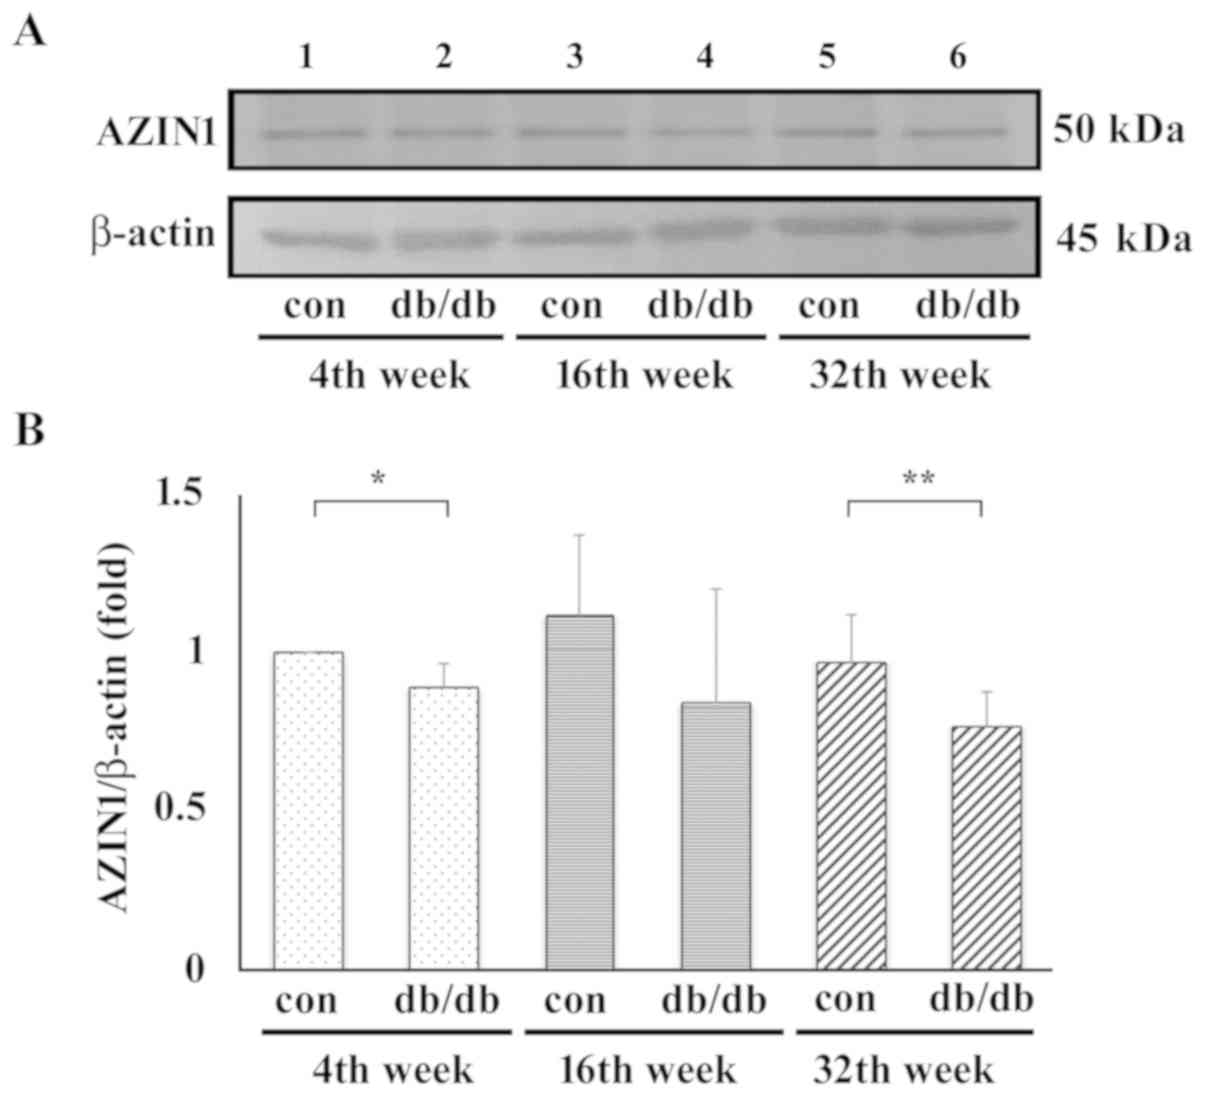
Liver tissues were homogenized and 60 µg protein was
used in WB analysis using an anti-AZIN1 antibody and β-actin as a
control. Representative blots are shown in Fig. 3A. Samples from the control mice are
in lanes 1, 3 and 5 and those from the T2DM mice are in lanes 2, 4
and 6 at 4, 16 and 32 weeks, respectively. Compared with T2DM mice,
no matter which stage, the AZIN1 protein expression level was
always higher in the control group. In addition, the protein
expression levels of AZIN1 were significantly lower in early stage
(4th week) and late stage (32nd week) T2DM mouse liver samples when
compared with that in control samples (Fig. 3B).
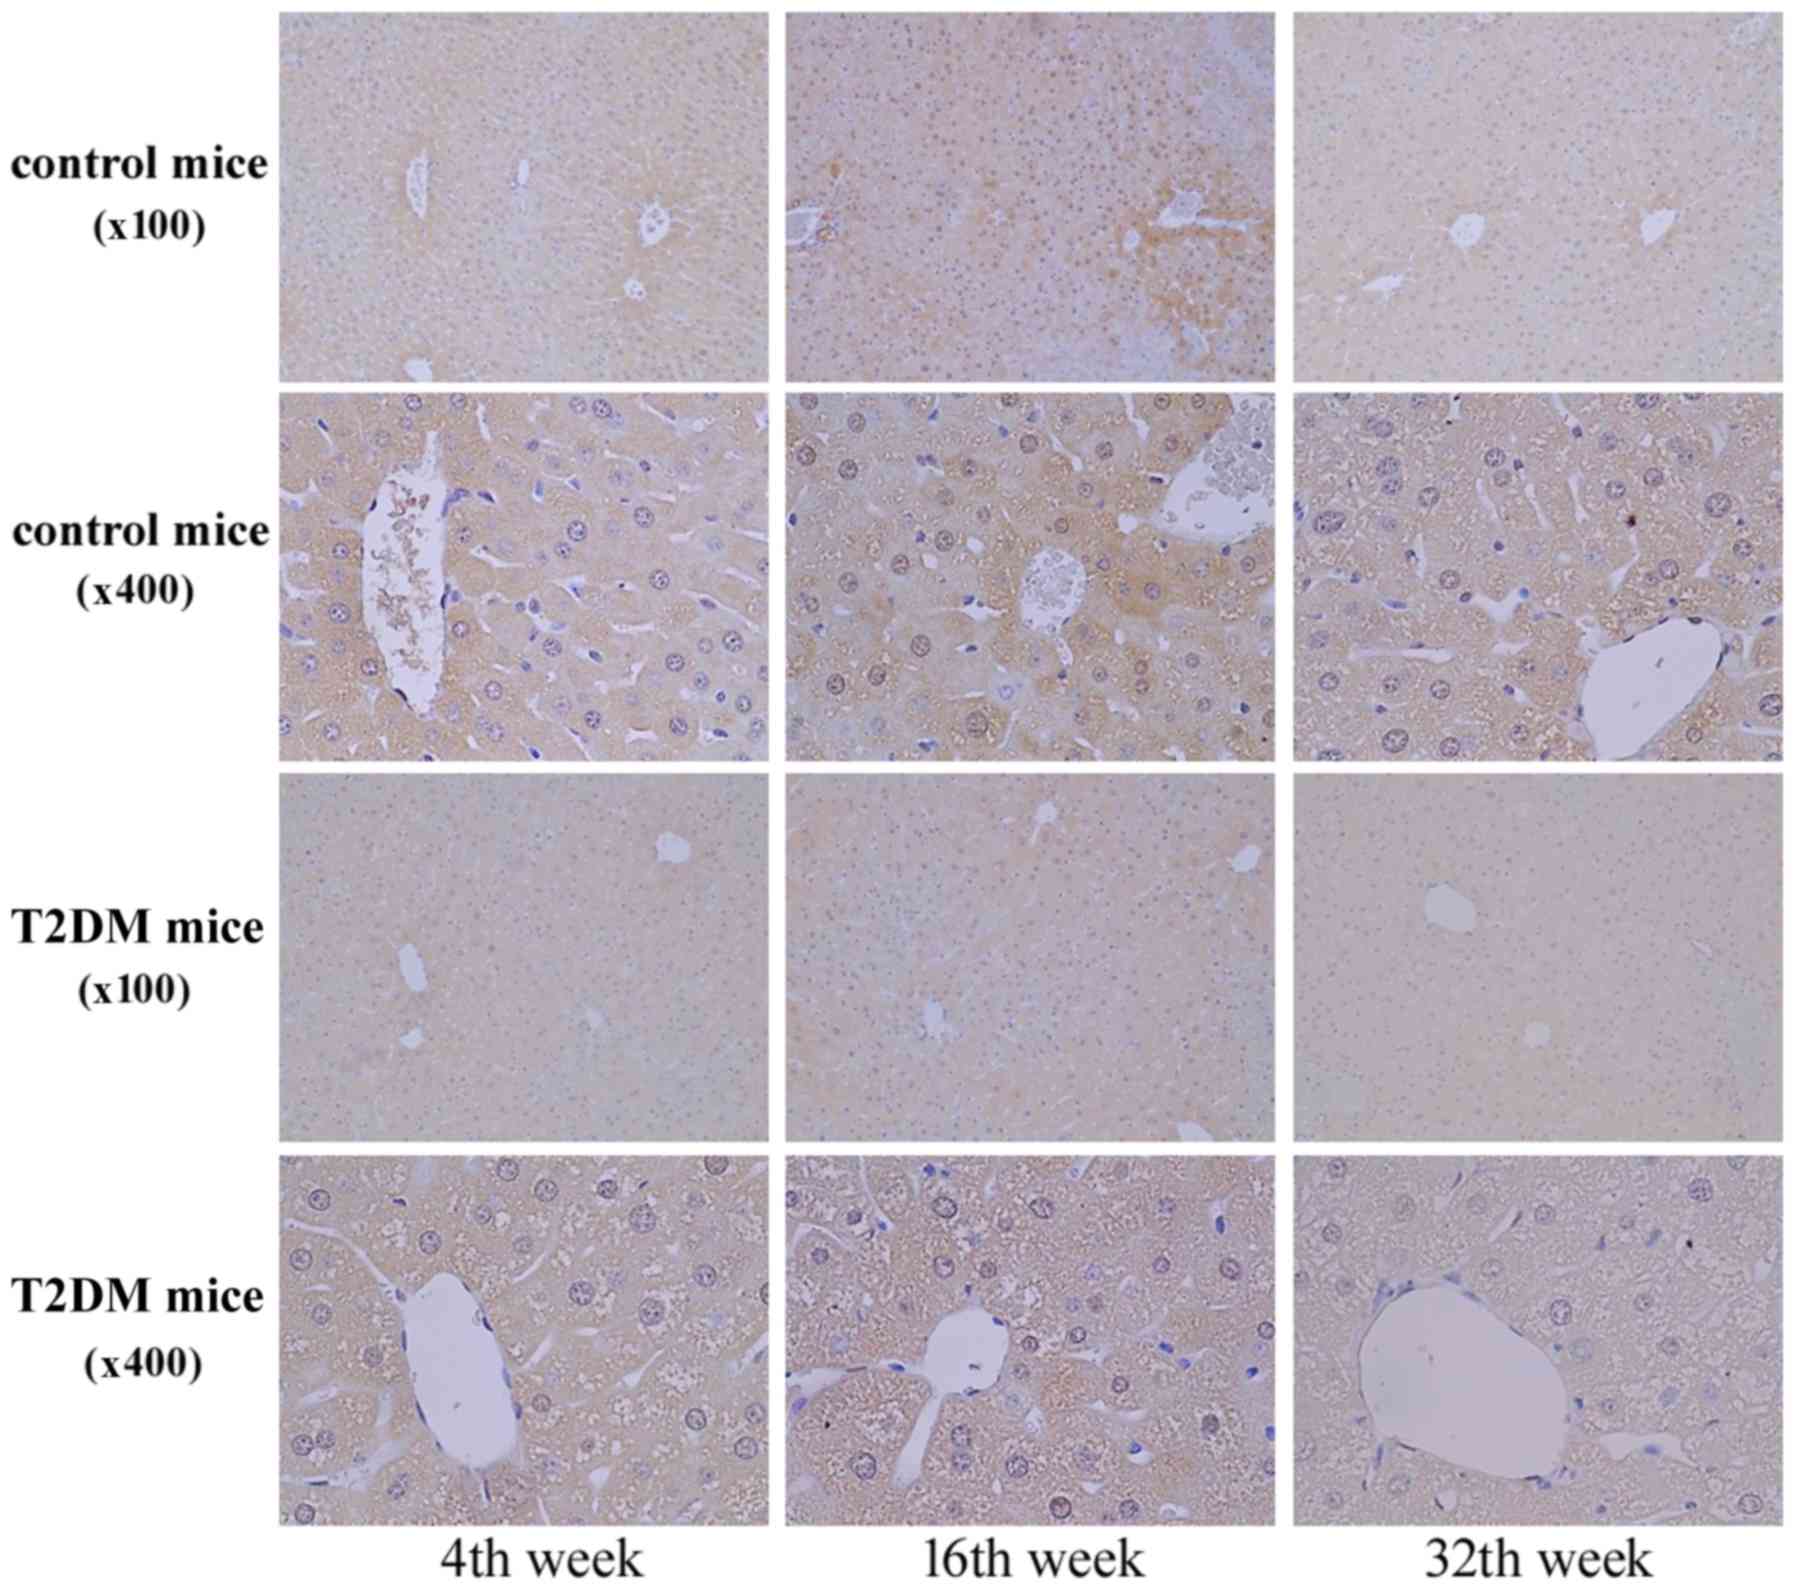
In Fig. 4, the IHC
staining revealed AZIN1 protein expression in the liver tissues at
4, 16, and 32 weeks of age. AZN1 protein expression in the liver
tissues of the T2DM group was lower than that in the control group
(Figs. 3 and 4). The results suggested that
downregulation of AZIN1 protein expression occurred in T2DM
mice.
Association between AZIN1 rs1062048
SNP and clinical features in patients with type 2 diabetic
nephropathy (T2DN)
There were 246 patients with T2DM developing into
T2DN in the cohort of the present study. A comparison between the
clinical features of the patients with T2DN with and without the TT
genotype at rs1062048 SNP is detailed in Table II. The two patient groups did not
differ significantly in most of terms. However, the levels of
hemoglobin A1c, blood urea nitrogen, creatinine, total calcium and
triglycerides in the patients with T2DN with and without the TT
genotype at rs1062048 SNP were higher than the normal values. In
addition, the laboratory tests did not reveal differences between
the TT genotype and non-TT genotype groups at rs1062048 SNP in the
AZIN1 gene. In addition, a significantly higher level of
parathyroid hormone (PTH) was observed in the TT group
(202.7±176.62) than in the non-TT group (41.0±8.91; P=0.009;
Table II).
| Table II.Association between AZIN1 rs1062048
SNP and clinical features in patients with type 2 diabetic
nephropathy. |
Table II.
Association between AZIN1 rs1062048
SNP and clinical features in patients with type 2 diabetic
nephropathy.
|
| AZIN1 genotype
rs1062048 |
|
|---|
|
|
|
|
|---|
| Clinical
parameters | TT (n=189), mean ±
SD | Non-TT (n=57), mean
± SD | P-value | Normal value |
|---|
| Age, years | 68.12±12.61 | 68.28±13.0 | 0.933 |
|
| BMI,
kg/m2 | 25.95±5.26 | 25.38±4.84 | 0.480 | 20–25 |
| Hemoglobin A1c,
% | 7.22±1.64 | 6.95±1.34 | 0.269 | 3.8–6.0 |
| Blood urea
nitrogen, mg/dl | 38.59±26.24 | 32.34±18.07 | 0.066 | 7–20 |
| Creatinine,
mg/dl | 2.87±3.21 | 2.56±2.33 | 0.490 | 0.6–1.3 |
| Uric acid,
mg/dl | 7.16±4.31 | 6.27±1.59 | 0.171 | 2.3–7.6 |
| Total calcium,
mg/dl | 10.34±12.36 | 9.20±0.65 | 0.558 | 2.15–2.58 |
| Phosphorus,
mg/dl | 4.90±4.10 | 4.25±0.93 | 0.316 | 2.5–5.0 |
| Parathyroid
hormone, pg/ml | 202.76±176.62 | 41.00±8.91 | 0.009a | 12–65 |
| Albumin, g/dl | 4.04±0.50 | 4.18±0.40 | 0.077 | 3.5–5.7 |
| Cholesterol,
mg/dl | 172.13±41.61 | 168.49±41.65 | 0.609 | <200 |
| Triglyceride,
mg/dl | 181.54±162.91 | 173.51±127.95 | 0.762 | <150 |
| Low density
lipoprotein-C, mg/dl | 99.32±36.84 | 88.77±32.39 | 0.136 | <130 |
| Alanine
aminotransferase, IU/l | 24.64±16.09 | 21.74±12.71 | 0.308 | 0–41 |
Discussion
According to a literature review, the present study
was the first to reveal human AZIN1 gene polymorphisms in patients
with T2DM. Furthermore, to the best of our knowledge, it was the
first to use a time serial T2DM animal model from the early to the
late stage obese mice to determine the association between AZIN1
gene expression and protein levels by IHC staining of liver
sections. The animal model exhibited the characteristics of T2DM
and obesity, namely significant increases in body weight and blood
glucose (32,33).
Notably, the qPCR, WB and IHC assay data
demonstrated downregulation of AZIN1 gene and protein expression in
the T2DM group in liver tissue samples collected from mice of
varying ages (4, 16 and 32 weeks). These findings improved the
understanding of the role of AZIN1 gene expression in the
pathological features of T2DM. Oka et al (18) reported that AZ1 binds to ODC, which
reduces the cellular polyamine level. ASPC-1 cells are converted
into α-cells, which regulate the glucagon gene during pancreatic
endocrine cell function and form an islet-like structure (18). AZIN1 effectively competes with ODC
and has a higher AZ1 affinity, which restores the ODC activity of
polyamine accumulation; in addition, the cellular polyamine level
may serve a role in preventing diabetes (34). The animal model in the present study
revealed the downregulation of AZIN1 gene and protein expression in
T2DM mice. This may indirectly imply that polyamine homeostasis is
impaired by a regulatory protein, such as AZ1 or AZIN1, and AZ1 can
bind to ODC to reduce polyamine biosynthesis (14). Furthermore, these findings suggest
that AZIN1 may serve a crucial role in the T2DM mechanism.
The present study had several limitations. First,
the data indicated that the patients with T2DM exhibited a high TT
genotype distribution at rs1062048 SNP in the AZIN1. However, to
the best of our knowledge, no methods detecting AZIN1 activity to
demonstrate the functional associations between rs1062048 SNP and
the enzyme activity of AZIN1 are currently available. A second
limitation was that although a time serial of the T2DM animal model
was used to determine gene transcription and protein expression
levels of AZIN1 by WB and IHC staining. Considering the
disease/phenotype information from Jackson Laboratory (JAX stock
#000642), the phenotype findings in the present study demonstrated
that compared with the control, the T2DM mice exhibited more severe
fatty change during the time course of their life as they gain
weight. Therefore, it is possible that liver dysfunction interfered
with AZIN1 expression or its clearance. However, the level of ALT
did not differ significantly between the two groups. Therefore, the
liver function in all animals appeared consistent. In summary,
another dedicated experimental design is required to explore the
associations among AZ1/AZIN1/ODC and polyamines in human and animal
models.
The data indicated that the increase of the PTH in
the patients with T2DN with the TT (risk) genotype was
significantly higher than that in the non-TT genotype patients.
Recently, Mary et al (35)
reported that higher PTH prevalence is associated with increased
below-the-knee arterial calcification in patients with T2DM.
Therefore, the present study suggested that the patients with T2DN
with the TT (risk) genotype were at risk of increased calcification
of the inferior knee artery due to a high prevalence of PTH.
In conclusion, the present study explored the
downregulation of AZIN1 gene and protein expression in T2DM mice,
and demonstrated the association between AZIN1 and T2DM. To the
best of our knowledge, the present study was the first to use a
time serial animal model to investigate the association between
rodent AZIN1 gene expression and the progression of T2DM disease
from the gene expression to the phenotype level. Further research
is required to understand the mechanisms of AZIN1 at the gene and
protein levels, and its association with pancreatic endocrine cells
in patients with T2DM.
Acknowledgements
Not applicable.
Funding
The present study was supported by China Medical
University Hospital in Taiwan (grant nos. DMR-104-082 and
DMR-106-116) and by two funds from the National Health Research
Institutes (grant nos. 07A1-MGSP08-037 and TCVGH-NHRI10705).
Availability of data and materials
The datasets used and/or analyzed during the present
study available from the corresponding author on reasonable
request.
Authors' contributions
SYC, CHC, YHW and FJT conceived and designed the
study. SYC, CHC, YHW, FJT, SFT and TMY analyzed and interpreted the
data. SYC, CHC, YHW and FJT participated in the drafting of the
manuscript. SYC, CHC, YHW, FJT, SFT and TMY critically revised the
manuscript for important intellectual content. All authors read and
approved the final manuscript.
Ethics approval and consent to
participate
The animal experiments were approved by the
Institutional Animal Care and Use Committee of China Medical
University (IACUC permit no. 2016-221). The human experiments were
approved by the Ethics Committee/Institutional Review Board of
China Medical University Hospital (approval no. CMUH103-REC2-071).
All participants provided written informed consent.
Patient consent for publication
Not applicable.
Competing interests
The authors declare that they have no competing
interests.
References
|
1
|
World Health Organization (WHO), . Global
Report on Diabetes. WHO; Geneva: 2016
|
|
2
|
International Diabetes Federation (IDF), .
IDF Diabetes Atlas. 8th. International Diabetes Federation;
Brussels: 2017
|
|
3
|
Kodama K, Tojjar D, Yamada S, Toda K,
Patel CJ and Butte AJ: Ethnic differences in the relationship
between insulin sensitivity and insulin response: A systematic
review and meta-analysis. Diabetes Care. 36:1789–1796. 2013.
View Article : Google Scholar : PubMed/NCBI
|
|
4
|
Ma RC and Chan JC: Type 2 diabetes in East
Asians: Similarities and differences with populations in Europe and
the United States. Ann N Y Acad Sci. 1281:64–91. 2013. View Article : Google Scholar : PubMed/NCBI
|
|
5
|
Tatsumi Y, Morimoto A, Miyamatsu N, Noda
M, Ohno Y and Deura K: Effect of body mass index on insulin
secretion or sensitivity and diabetes. Am J Prev Med. 48:128–135.
2015. View Article : Google Scholar : PubMed/NCBI
|
|
6
|
Chung HF, Al Mamun A, Huang MC, Long KZ,
Huang YF, Shin SJ, Hwang SJ and Hsu CC: Obesity, weight change, and
chronic kidney disease in patients with type 2 diabetes mellitus: A
longitudinal study in Taiwan. J Diabetes. 9:983–993. 2017.
View Article : Google Scholar : PubMed/NCBI
|
|
7
|
Groop LC and Tuomi T:
Non-insulin-dependent diabetes mellitus-a collision between thrifty
genes and an affluent society. Ann Med. 29:37–53. 1997. View Article : Google Scholar : PubMed/NCBI
|
|
8
|
Tanda R, Anderson SE and Kamboj MK:
Pediatric type 2 diabetes: Prevention and treatment. The Handbook
of Life Course Health Development. Halfon N, Forrest CB, Lerner RM
and Faustman EM: Springer; New York, NY: pp. 197–236. 2017
|
|
9
|
Lu CC, Chen YT, Chen SY, Hsu YM, Lin CC,
Tsao JW, Juan YN, Yang JS and Tsai FJ: Hematopoietically expressed
homeobox gene is associated with type 2 diabetes in KK
Cg-Ay/J mice and a Taiwanese Han Chinese population. Exp
Ther Med. 16:185–191. 2018.PubMed/NCBI
|
|
10
|
Chen SY, Hsu YM, Lin YJ, Huang YC, Chen
CJ, Lin WD, Liao WL, Chen YT, Lin WY, Liu YH, et al: Current
concepts regarding developmental mechanisms in diabetic retinopathy
in Taiwan. Biomedicine (Taipei). 6:72016. View Article : Google Scholar : PubMed/NCBI
|
|
11
|
Yang JS, Lu CC, Kuo SC, Hsu YM, Tsai SC,
Chen SY, Chen YT, Lin YJ, Huang YC, Chen CJ, et al: Autophagy and
its link to type II diabetes mellitus. Biomedicine (Taipei).
7:82017. View Article : Google Scholar : PubMed/NCBI
|
|
12
|
Prasad RB and Groop L: Genetics of type 2
diabetes-pitfalls and possibilities. Genes (Basel). 6:87–123. 2015.
View Article : Google Scholar : PubMed/NCBI
|
|
13
|
Park MH and Igarashi K: Polyamines and
their metabolites as diagnostic markers of human diseases. Biomol
Ther (Seoul). 21:1–9. 2013. View Article : Google Scholar : PubMed/NCBI
|
|
14
|
Wu HY, Chen SF, Hsieh JY, Chou F, Wang YH,
Lin WT, Lee PY, Yu YJ, Lin LY, Lin TS, et al: Structural basis of
antizyme-mediated regulation of polyamine homeostasis. Proc Natl
Acad Sci USA. 112:11229–11234. 2015. View Article : Google Scholar : PubMed/NCBI
|
|
15
|
Matsufuji S, Matsufuji T, Miyazaki Y,
Murakami Y, Atkins JF, Gesteland RF and Hayashi S.: Autoregulatory
frameshifting in decoding mammalian ornithine decarboxylase
antizyme. Cell. 80:51–60. 1995. View Article : Google Scholar : PubMed/NCBI
|
|
16
|
Rom E and Kahana C: Polyamines regulate
the expression of ornithine decarboxylase antizyme in vitro by
inducing ribosomal frame-shifting. Proc Natl Acad Sci USA.
91:3959–3963. 1994. View Article : Google Scholar : PubMed/NCBI
|
|
17
|
Qiu S, Liu J and Xing F: Antizyme
inhibitor 1: A potential carcinogenic molecule. Cancer Sci.
108:163–169. 2017. View Article : Google Scholar : PubMed/NCBI
|
|
18
|
Oka T, Ohtani M and Suzuki J:
Identification of novel molecules regulating differentiation and
hormone secretion and clarification of their functional mechanisms
in pancreatic endocrine cells. Yakugaku Zasshi. 130:377–388.
2010.(In Japanese). View Article : Google Scholar : PubMed/NCBI
|
|
19
|
American Diabetes Association: Diagnosis
and classification of diabetes mellitus. Diabetes Care. 36 (Suppl
1):S67–S74. 2013. View Article : Google Scholar : PubMed/NCBI
|
|
20
|
Ibrahim DM: Reduce, Refine, Replace: The
Failure of the Three R's and the Future of Animal Experimentation.
University of Chicago Legal Forum. 2006:Article 7. 2006.
|
|
21
|
Mandel MA and Mahmoud AA: Impairment of
cell-mediated immunity in mutation diabetic mice (db/db). J
Immunol. 120:1375–1377. 1978.PubMed/NCBI
|
|
22
|
Didovyk A, Tonooka T, Tsimring L and Hasty
J: Rapid and scalable preparation of bacterial lysates for
cell-free gene expression. ACS Synth Biol. 6:2198–2208. 2017.
View Article : Google Scholar : PubMed/NCBI
|
|
23
|
Chen YT, Liao JW, Tsai YC and Tsai FJ:
Inhibition of DNA methyltransferase 1 increases nuclear receptor
subfamily 4 group A member 1 expression and decreases blood glucose
in type 2 diabetes. Oncotarget. 7:39162–39170. 2016.PubMed/NCBI
|
|
24
|
Bleda S, de Haro J, Varela C, Ferruelo A
and Acin F: Elevated levels of triglycerides and vldl-cholesterol
provoke activation of nlrp1 inflammasome in endothelial cells. Int
J Cardiol. 220:52–55. 2016. View Article : Google Scholar : PubMed/NCBI
|
|
25
|
Livak KJ and Schmittgen TD: Analysis of
relative gene expression data using real-time quantitative PCR and
the 2(-Delta Delta C(T)) method. Methods. 25:402–408. 2001.
View Article : Google Scholar : PubMed/NCBI
|
|
26
|
Wu KM, Hsu YM, Ying MC, Tsai FJ, Tsai CH,
Chung JG, Yang JS, Tang CH, Cheng LY, Su PH, et al: High-density
lipoprotein ameliorates palmitic acid-induced lipotoxicity and
oxidative dysfunction in H9c2 cardiomyoblast cells via ROS
suppression. Nutr Metab (Lond). 16:362019. View Article : Google Scholar : PubMed/NCBI
|
|
27
|
Huang CY, Chen SY, Tsai HC, Hsu HC and
Tang CH: Thrombin induces epidermal growth factor receptor
transactivation and CCL2 expression in human osteoblasts. Arthritis
Rheum. 64:3344–3354. 2012. View Article : Google Scholar : PubMed/NCBI
|
|
28
|
Chen SY, Lin JR, Darbha R, Lin P, Liu TY
and Chen YM: Glycine N-methyltransferase tumor susceptibility gene
in the benzo(a)pyrene-detoxification pathway. Cancer Res.
64:3617–3623. 2004. View Article : Google Scholar : PubMed/NCBI
|
|
29
|
Steneberg P, Bernardo L, Edfalk S,
Lundberg L, Backlund F, Ostenson CG and Edlund H: The type 2
diabetes-associated gene ide is required for insulin secretion and
suppression of α-synuclein levels in β-cells. Diabetes.
62:2004–2014. 2013. View Article : Google Scholar : PubMed/NCBI
|
|
30
|
Sekiguchi K, Kurabayashi M, Oyama Y,
Aihara Y, Tanaka T, Sakamoto H, Hoshino Y, Kanda T, Yokoyama T,
Shimomura Y, et al: Homeobox protein Hex induces SMemb/nonmuscle
myosin heavy chain-B gene expression through the cAMP-responsive
element. Circ Res. 88:52–58. 2001. View Article : Google Scholar : PubMed/NCBI
|
|
31
|
Cotsapas C, Prokunina-Olsson L, Welch C,
Saxena R, Weaver C, Usher N, Guiducci C, Bonakdar S, Turner N,
LaCroix B and Hall JL: Expression analysis of loci associated with
type 2 diabetes in human tissues. Diabetologia. 53:2334–2339. 2010.
View Article : Google Scholar : PubMed/NCBI
|
|
32
|
Chen H, Charlat O, Tartaglia LA, Woolf EA,
Weng X, Ellis SJ, Lakey ND, Culpepper J, Moore KJ, Breitbart RE, et
al: Evidence that the diabetes gene encodes the leptin receptor:
Identification of a mutation in the leptin receptor gene in db/db
mice. Cell. 84:491–495. 1996. View Article : Google Scholar : PubMed/NCBI
|
|
33
|
Hummel KP, Dickie MM and Coleman DL:
Diabetes, a new mutation in the mouse. Science. 153:1127–1128.
1966. View Article : Google Scholar : PubMed/NCBI
|
|
34
|
Palanimurugan R, Scheel H, Hofmann K and
Dohmen RJ: Polyamines regulate their synthesis by inducing
expression and blocking degradation of ODC antizyme. EMBO J.
23:4857–4867. 2004. View Article : Google Scholar : PubMed/NCBI
|
|
35
|
Mary A, Hartemann A, Brazier M, Aubert CE,
Kemel S, Salem JE, Cluzel P, Liabeuf S, Massy Z, Mentaverri R, et
al: Higher parathyroid hormone levels are associated with increased
below-the-knee arterial calcification in type 2 diabetes. Diabetes
Metab. 44:305–308. 2018. View Article : Google Scholar : PubMed/NCBI
|