Introduction
Breast cancer (BC) is the most common type of
malignancy among females and represents a serious public health
issue. It is a heterogeneous disease that is the leading cause of
cancer-associated death among females. For 2018, ~2.1 million newly
diagnosed cases have been estimated (1). According to cancer statistics, the
incidence of BC has increased from 2005 to 2014, including yearly
increases by 0.3–0.4% per year among Hispanic and black females and
1.7% per year among Asians/Pacific islanders (2). Treatments include surgery, radiation
and drug therapy. However, the treatment of patients with
metastatic BC is challenging (3,4).
Numerous biomarkers have been determined for BC but their
application has rarely been implemented in clinical practice
(5). Therefore, exploration of novel
biomarkers for BC detection, screening, diagnosis, prognostication
and treatment monitoring, is urgently required.
Epigenetic modifications are reversible and
heritable processes, which are involved in mechanisms associated
with the occurrence of cancer without causing any changes in the
DNA sequence (6). Furthermore,
epigenetic alterations may serve as biomarkers for the detection,
prognosis and treatment of cancer (7). Histone modifications are the major type
of epigenetic modifications (8).
Normally, histone proteins with abundant lysine and arginine
residues bind to negatively charged linear DNA to form nucleosomes.
The histone family includes histones H1, H2A, H2B, H3 and H4. The
four core histone proteins, H2A, H2B, H3 and H4, form an octamer.
These histones may be modified by a large number of enzymes and are
associated with multiple cancers. Histone variant H2A.Z.1 has been
reported to have an oncogenic role in hepatocellular carcinoma via
accelerating the cell cycle transition and epithelial to
mesenchymal transition (9). Another
previous study suggested that histone variant H2A.Z may be a novel
target for BC therapy (10). The
transforming growth factor-β/protein arginine methyltransferase
5/methylosome protein 50 axis was indicated to regulate
transcriptional activation and repression of cancer cell invasion
pathways through histone H3 and H4 arginine methylation (11). Furthermore, loss of histone H4K20
trimethylation is associated with cell invasion in vitro and
may be used as an independent marker to predict poor prognosis in
BC patients (12). Although previous
large-scale studies suggest that histone genes are involved in
numerous types of cancer, a systematic, comprehensive analysis of
histone family genes as prognostic markers in BC has not been
previously performed.
In the present study, mRNA expression data of breast
tumor and normal tissues were downloaded from The Cancer Genome
Atlas (TCGA) database and differences in gene expression were
assessed. The edgeR package of R software was used to determine
significantly differentially expressed genes (DEGs). The molecular
functional and pathway enrichment of these DEGs was assessed using
the Database for Annotation, Visualization and Integrated Discovery
(DAVID). Next, a closely connected cluster was constructed using
the Molecular Complex Detection (MCODE) plug-in of Cytoscape. A
previous study reported that histone family genes may serve as
prognostic factors for cervical cancer and it can be hypothesized
that they are associated with gynecological tumors (13). Thus, they were determined as hub
genes in BC with the criterion of degrees ≥10. To further validate
the present results, the Oncomine online platform was used to
assess the expression levels of histone family genes. In addition,
the association between the expression levels and the prognostic
value of histone genes in BC patients was analyzed. Finally, the
differential expression of histone family genes between BC and
normal samples was validated by reverse transcription-quantitative
(RT-q)PCR.
Materials and methods
RNA expression data mining
The RNA sequencing data of 1,208 samples associated
with breast carcinoma were obtained from TCGA (https://cancergenome.nih.gov/; accession date,
September 14, 2018), and were retrieved using all of the following
key words simultaneously: Primary site, breast; program name, TCGA;
project ID, TCGA-BRCA; gender, female; workflow type, HTseq-counts;
data category, transcriptome profiling; data type, gene expression
quantification (14). The mRNA
expression data were grouped into 1,096 BC samples and 112 normal
breast tissues. These data are publicly accessible and there was no
further ethical approval from the Ethics Committee.
Identification of DEGs
The DEGs between normal samples and BC were selected
using the edgeR package in R (v3.5.1). EdgeR is a Bioconductor
software package for selecting differences in replicated count data
(15). Fold-change (FC) analysis was
based on the two groups (tumor tissue and normal tissue). The DEGs
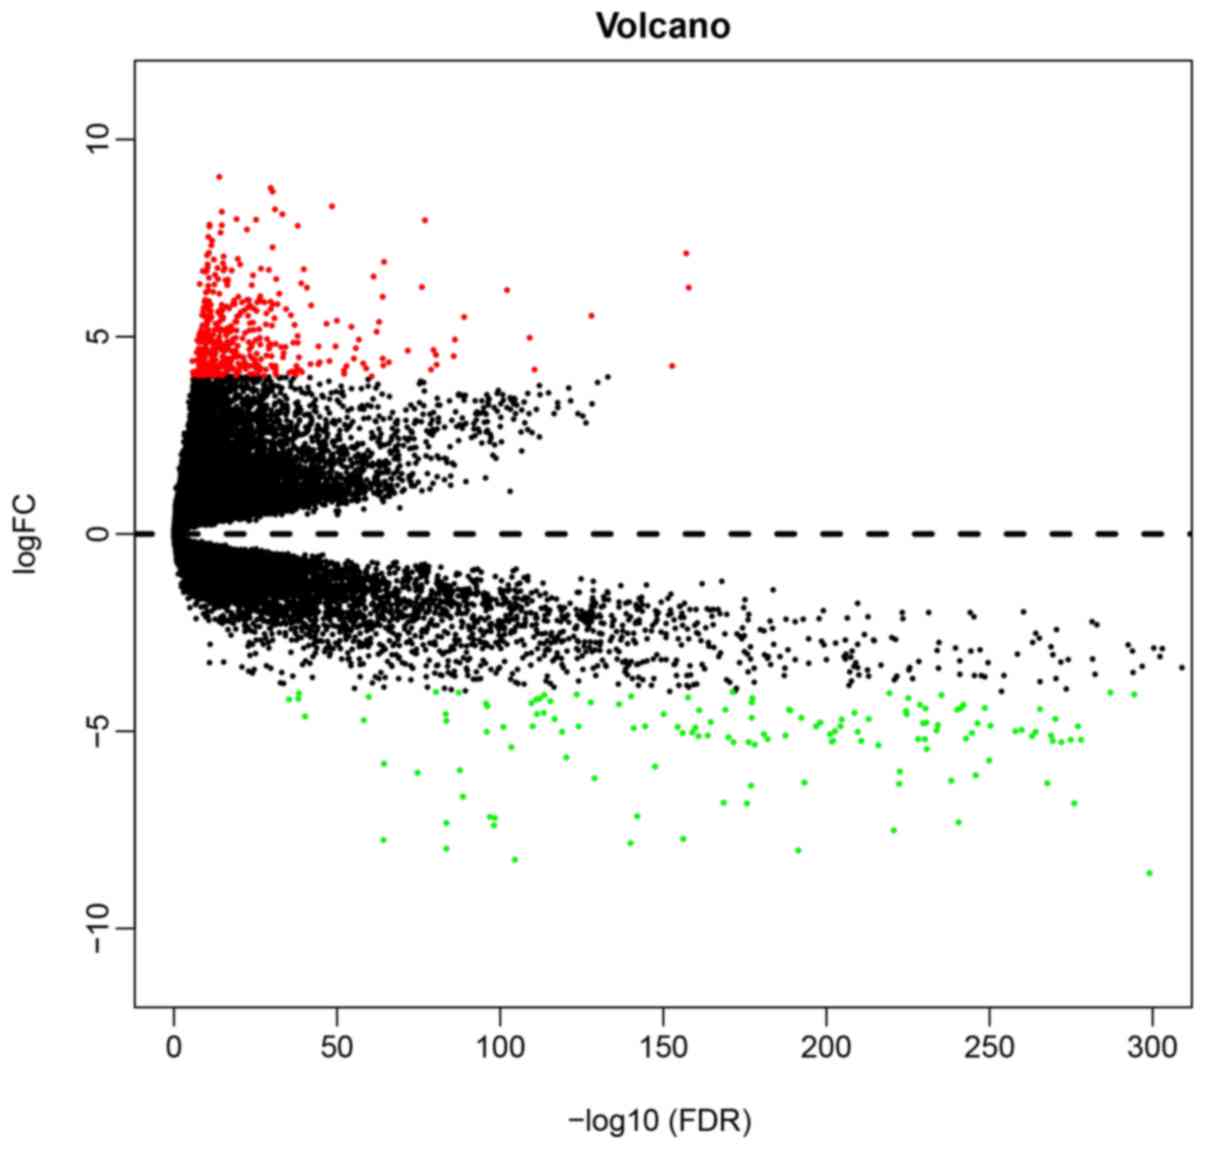
were then obtained using an unpaired t-test. P<0.0001 and
|logFC| ≥4 were set as cut-off values based on the
Benjamini-Hochberg method. A volcano plot was drawn to represent
the DEGs.
Kyoto Encyclopedia of Genes and
Genomes (KEGG) and Gene Ontology (GO) enrichment analyses of
DEGs
GO functional enrichment analysis of DEGs and KEGG
signaling pathway analysis was performed using DAVID (https://david.ncifcrf.gov/; version 6.8). DAVID is an
online bioinformatics enrichment tool for comprehensive analysis of
the functions of genes (16,17). GO enrichment analysis is an important
bioinformatics tool to annotate genes accumulated in the categories
‘biological process’, ‘molecular function’ and ‘cellular component’
(18,19). KEGG is an encyclopedia of genes and
genomes, which may be used for pathways enrichment analysis of
lists of genes (20). P<0.05 was
set as the cut-off criterion.
Protein-protein interaction (PPI)
network construction and analysis
The Search Tool for the Retrieval of Interacting
Genes (STRING; https://string-db.org/; version 10.5)
was applied to construct the PPI network (21). Furthermore, acknowledgement of
interactions between proteins may provide further understanding of
the complex mechanisms of tumor development. In the present study,
the PPI network was built using STRING. A combined score of >0.4
was considered to indicate statistical significance. Cytoscape
(version 3.6.1), which is a software platform for bioinformatics
analysis (22), was used for
visualizing PPI.
Hub gene selection and analysis
In the present study, a degree of ≥10 was set as the
criterion for selection of hub genes. MCODE (version 1.5.1) is a
plugin of Cytoscape which can identify densely connected regions of
a given network based on topology. The networks from STRING were
visualized using Cytoscape and the subnetworks were drawn by MCODE.
The selection criteria were set as follows: MCODE scores, >5;
degree cut-off, 2; node score cut-off, 0.2; Max depth, 100; and
k-score, 2.
Expression data analysis
The expression data of histone family genes in BC
vs. normal tissue were obtained via the Oncomine online database
(23). The parameters were set as
follows: P-value<10−4; FC, >2; and gene ranking,
top 10%. The immunohistochemistry results on the expression of the
histone family proteins in BC were retrieved from the Human Protein
Atlas (HPA) database (24).
Survival analysis of hub genes
For survival analysis for hub genes, PrognoScan
(http://www.prognoscan.org/) was
employed, which is a useful tool for researching the biological
association between gene expression and clinical prognosis based on
public cancer microarray datasets (dataset numbers provided in
Table SV) (25). A Cox proportional hazards model
P<0.05 was considered to indicate statistical significance and
associated data were displayed in the Kaplan Meier plot.
Ethics statement and clinical
specimens
The acquisition of tissue specimens for the present
study was approved by the Ethical Committee of Shanghai Tenth
People's Hospital (approval no. 107 SHSY-IEC-4.0/19-24/01). Each
patient provided written informed consent prior to participating in
the study. Fresh BC samples and para-carcinoma tissues were
collected from patients who had undergone surgical resection
between April and May 2019 in Shanghai Tenth People's Hospital. The
authors collected samples from a total of seven patients. There
were seven cancer tissues and ten normal tissues, among which three
normal tissues were the repetitive tissues belonging to the seven
patients (Table SI). A total of
seven BC primary tumor tissues and 10 adjacent non-tumor tissues
were collected.
RNA isolation and RT-qPCR
According to the manufacturer's protocols, total RNA
was isolated from 10 normal breast tissues and seven BC samples
using TRIzol reagent (Invitrogen; Thermo Fisher Scientific, Inc.).
A NanoDrop ONE spectrophotometer (Thermo Fisher Scientific, Inc.)
was used to measure the total RNA concentration. RNA was used for
first-strand cDNA synthesis in a reaction (final volume, 10 µl)
comprising 1 µl RNA, according to the protocol of PrimeScript™ RT
reagent kit (Takara Bio Inc.). The RT conditions were as follows:
reverse transcription at 37°C for 5 min; inactivation of reverse
transcriptase at 85°C for 5 sec; 4°C hold. qPCR was performed using
the C1000 Thermal Cycler (Bio-Rad Laboratories, Inc.) in a reaction
(final volume, 25 µl) comprising 2 µl cDNA with the following
conditions: Initial denaturation for 1 cycle at 95°C for 30 sec; 40
cycles of 95°C for 5 sec and 60°C for 30 sec; PCR primer sequences
are listed in Table SII. GAPDH was
used as the endogenous control and the 2−ΔΔCq method was
used to analyze the relative expression levels (26).
Statistical analysis
Values are expressed as the mean ± standard
deviation. Student's t-test was used to evaluate the differences
between two groups. RNA expression profiling information was used
to calculate the Median (M). The Mann-Whitney U test was used to
evaluate the differences between two groups in SPSS Statistics
version 20.0 software (IBM Corp.). P<0.05 was considered to
indicate a statistically significant difference.
Results
Identification of DEGs in BC
The gene expression data of a total of 1,208 cases,
including 1,096 BC samples and 112 normal samples in multiple
patients, were downloaded from TCGA. P<0.0001 and |logFC|≥4 were
used as cut-off criteria. Through this analysis, a total of 525
DEGs were determined, of which 366 were upregulated and 155 were
downregulated (Fig. 1).
GO and KEGG enrichment analysis of
DEGs
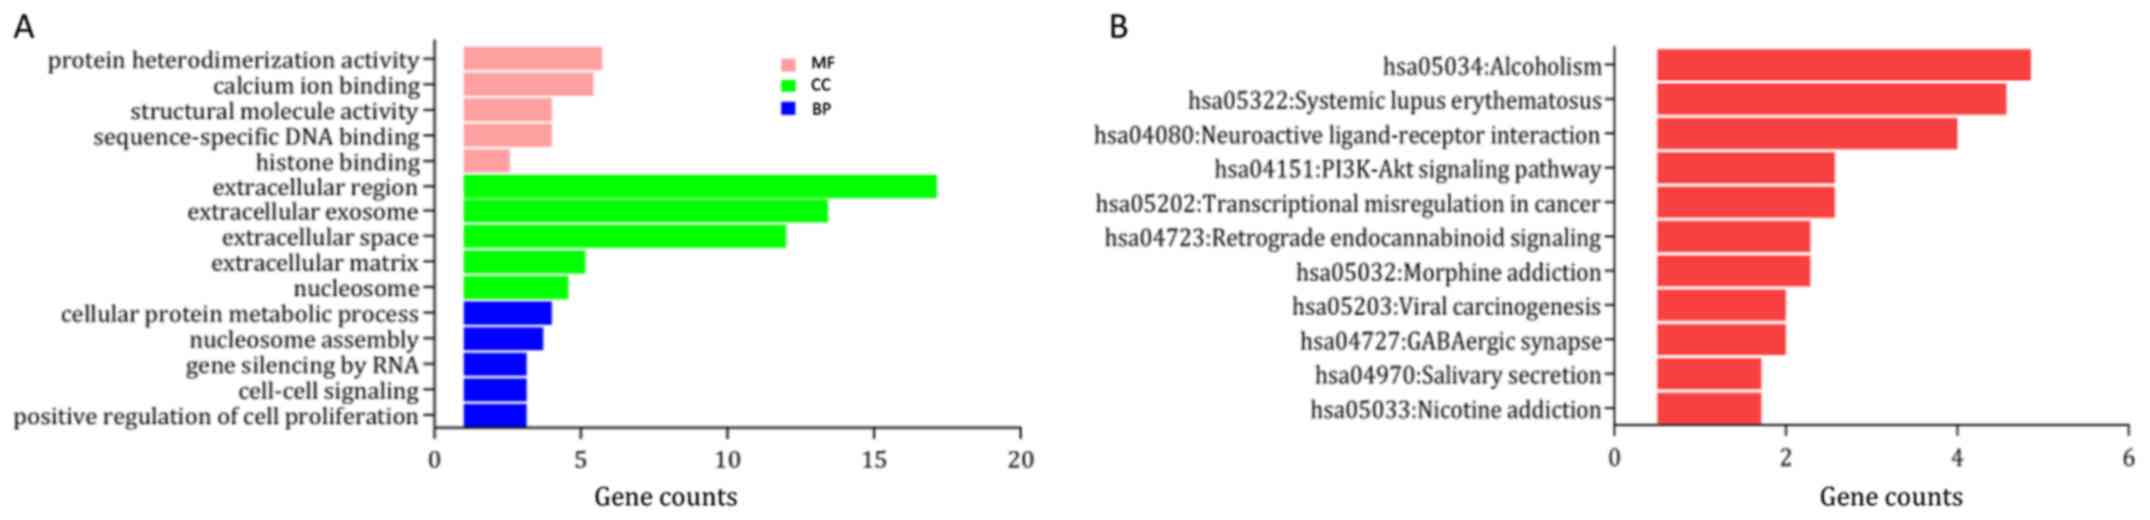
DAVID was used to annotate the DEGs, including GO
function and KEGG pathway enrichment. The results for the
upregulated and downregulated genes are provided in Table I. In the category ‘biological
process’ the upregulated DEGs were enriched in ‘DNA
replication-dependent nucleosome assembly’, ‘cellular protein
metabolic process’ and ‘telomere organization’ (Fig. 2A), and the downregulated DEGs were
enriched in ‘muscle filament sliding’, ‘muscle contraction’ and
‘cardiac muscle contraction’ (Fig.
S1A). In the category ‘molecular function’, the upregulated
DEGs were significantly enriched in ‘γ aminobutyric acid A receptor
activity’, ‘structural molecule activity’ and ‘protein
heterodimerization activity’ (Fig.
2A), while the downregulated DEGs were enriched in ‘actin
binding’, ‘zinc ion binding’, and ‘structural constituent of
muscle’ (Fig. S1A). In addition, in
the GO category ‘cellular component’, the upregulated DEGs were
mainly enriched in the terms ‘cornified envelope’, ‘nucleosome’ and
‘extracellular region’ (Fig. 2A),
while the downregulated DEGs were significantly enriched in ‘I
band’, ‘sarcomere’ and ‘Z disc’ (Fig.
S1A). KEGG pathway analysis suggested that the upregulated DEGs
were mainly enriched in ‘systemic lupus erythematosus (SLE)’,
‘alcoholism’ and ‘neuroactive ligand-receptor interaction’
(Fig. 2B), while the downregulated
DEGs were mainly enriched in the ‘peroxisome proliferator activated
receptor signaling pathway’, ‘protein kinase AMP-activated
catalytic subunit α1 signaling pathway’ and ‘cardiac muscle
contraction’ (Fig. S1B).
 | Table I.GO and Kyoto Encyclopedia of Genes
and Genomes pathway enrichment analysis of differentially expressed
genes in breast carcinoma samples. |
Table I.
GO and Kyoto Encyclopedia of Genes
and Genomes pathway enrichment analysis of differentially expressed
genes in breast carcinoma samples.
| Term | Description | Gene count | P-value |
|---|
| Upregulated |
|
GO:0032200 | Telomere
organization | 9 |
6.97×10⁻¹⁰ |
|
GO:0044267 | Cellular protein
metabolic process | 14 |
1.73×10⁻⁹ |
|
GO:0006335 | DNA replication
dependent nucleosome assembly | 9 |
3.13×10⁻⁹ |
|
GO:0005576 | Extracellular
region | 60 |
4.86×10⁻¹⁵ |
|
GO:0000786 | Nucleosome | 16 |
4.47×10⁻¹³ |
|
GO:0001533 | Cornified
envelope | 10 |
3.60×10⁻⁹ |
|
GO:0046982 | Protein
heterodimerization activity | 20 |
3.58×10⁻⁶ |
|
GO:0005198 | Structural molecule
activity | 14 |
9.47×10⁻⁶ |
|
GO:0004890 | GABA-A receptor
activity | 5 |
6.83×10⁻⁵ |
|
hsa05322 | Systemic lupus
erythematosus | 16 |
7.53×10⁻¹¹ |
|
hsa05034 | Alcoholism | 17 |
4.24×10⁻¹⁰ |
|
hsa04080 | Neuroactive
ligand-receptor interaction | 14 |
3.72×10⁻⁵ |
| Downregulated |
|
GO:0008307 | Structural
constituent of muscle | 13 |
1.43×10⁻¹⁶ |
|
GO:0003779 | Actin binding | 20 |
2.00×10⁻¹³ |
|
GO:0051373 | FATZ binding | 6 |
3.92×10⁻⁶ |
|
GO:0030018 | Z disc | 18 |
2.27×10⁻¹⁷ |
|
GO:0030017 | Sarcomere | 11 |
2.35×10⁻¹³ |
|
GO:0031674 | I band | 8 |
2.71×10⁻¹⁰ |
|
GO:0030049 | Muscle filament
sliding | 18 |
1.64×10⁻²⁶ |
|
GO:0006936 | Muscle
contraction | 20 |
9.30×10⁻²¹ |
|
GO:0060048 | Cardiac muscle
contraction | 12 |
4.09×10⁻¹⁴ |
|
hsa04260 | Cardiac muscle
contraction | 8 |
3.65×10⁻⁶ |
|
hsa04152 | AMPK signaling
pathway | 9 |
1.01×10⁻⁵ |
|
hsa03320 | PPAR signaling
pathway | 7 |
2.42×10⁻⁵ |
PPI network construction and hub gene
screening
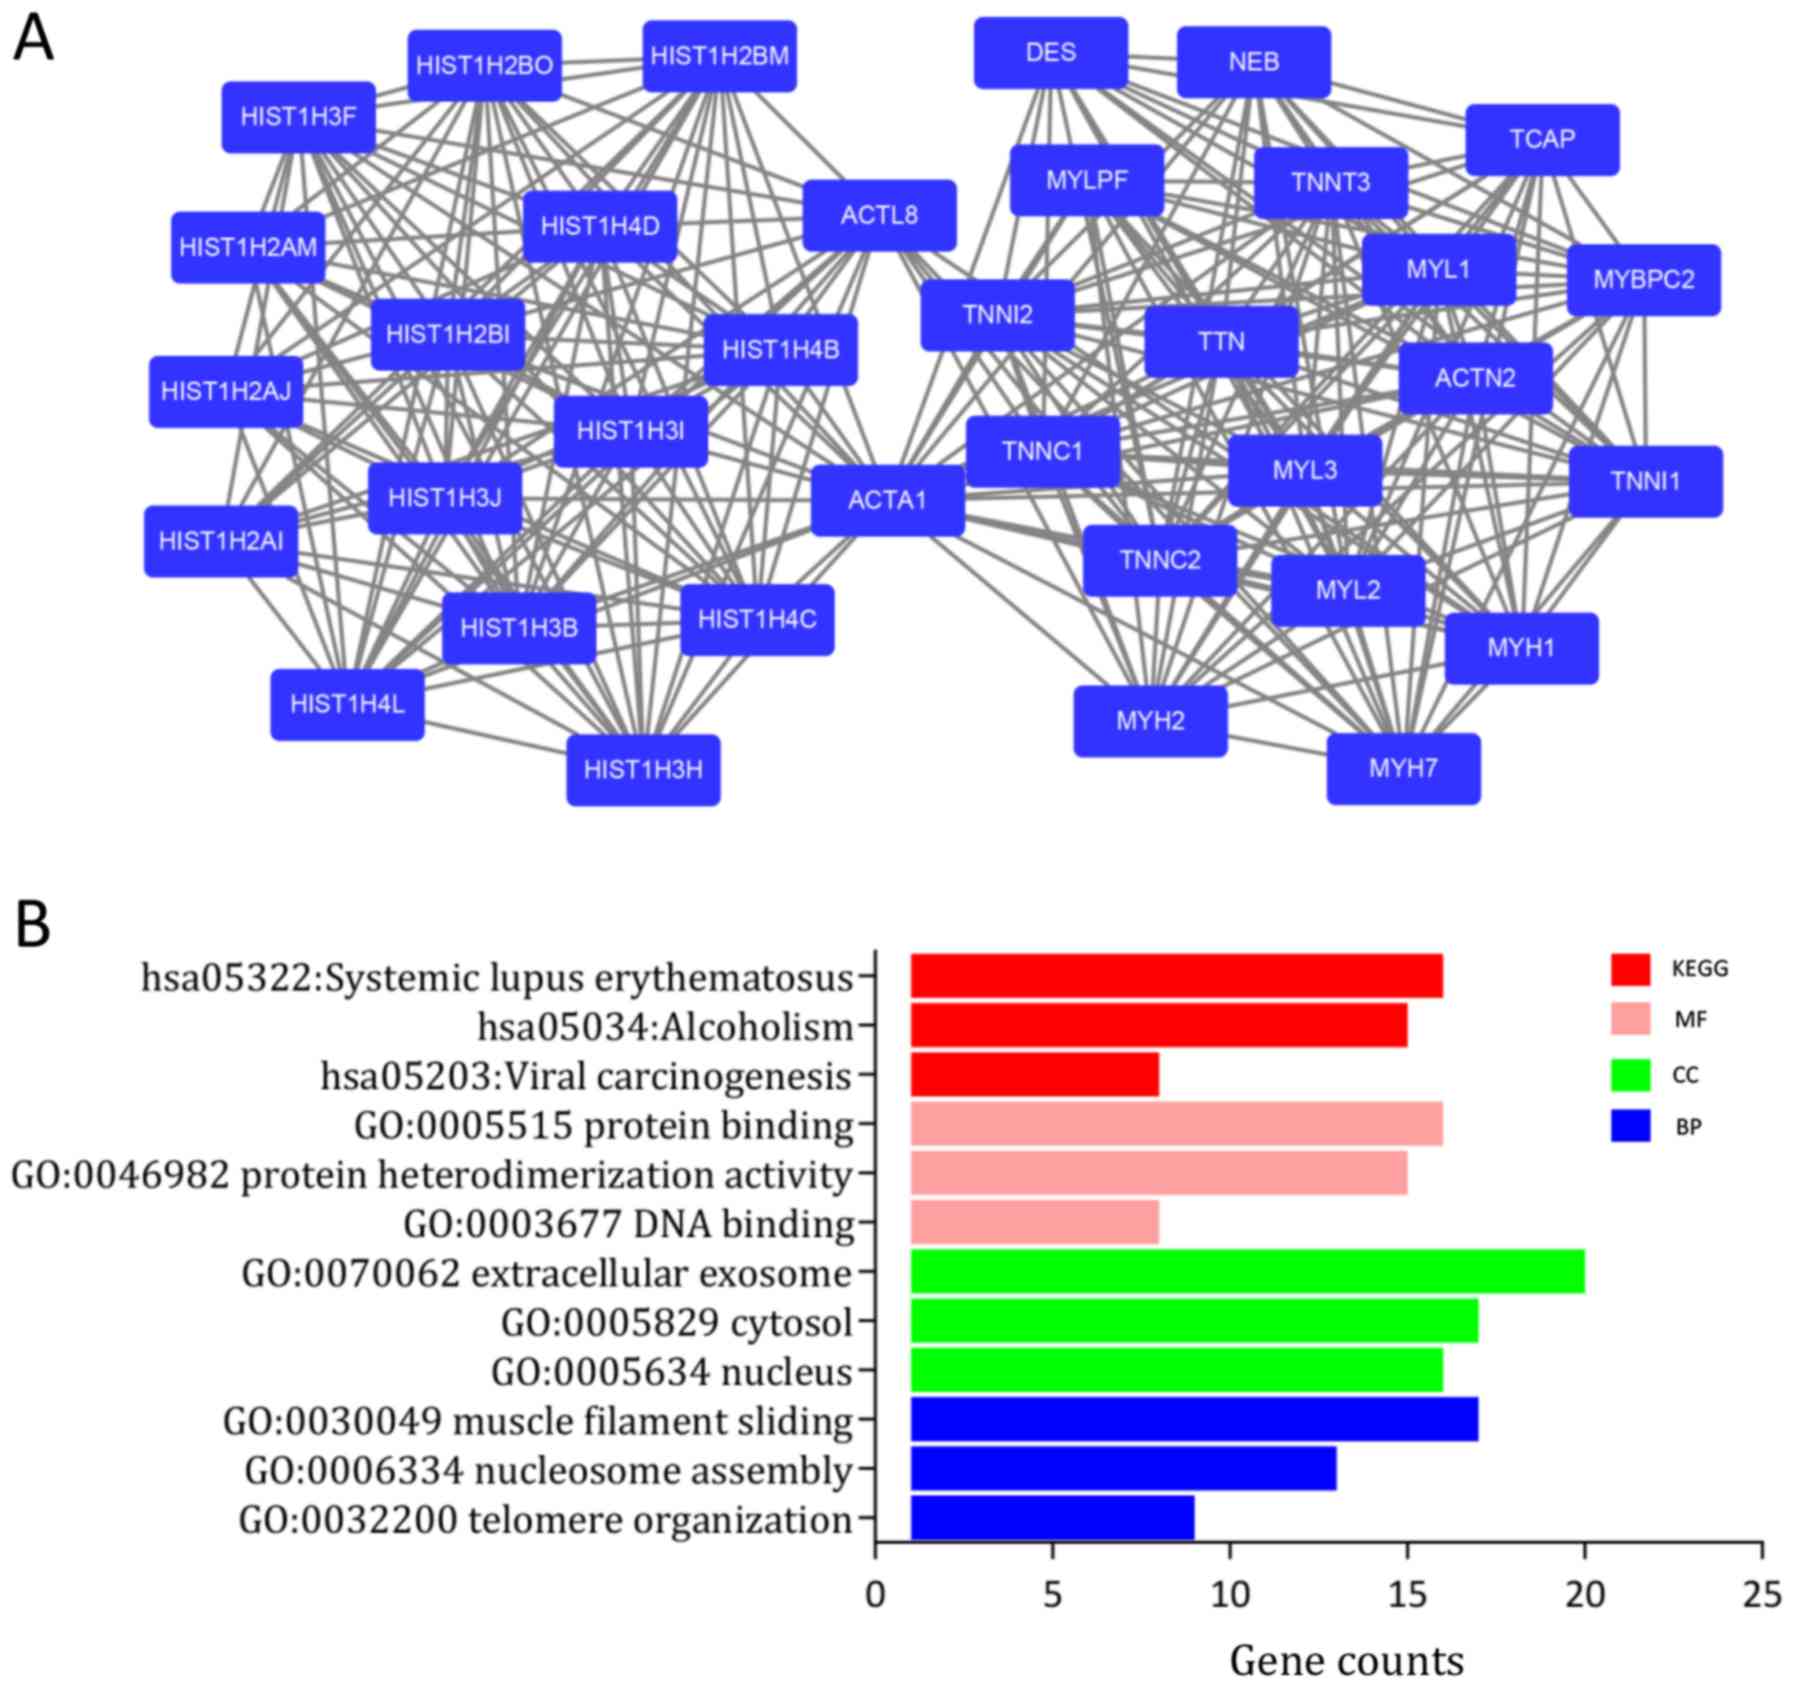
Next, the PPI network of the DEGs was constructed
using STRING with visualization by Cytoscape (Fig. S2). The MCODE plug-in, which is based
on topology, was used to identify close clusters in order to locate
highly connected regions. The score of cluster modules are
presented in Table II. The score of
the most significant cluster was 17.167 and it included 37 nodes
and 309 edges (Fig. 3A).
Furthermore, genes involved in this module were analyzed using the
DAVID online platform for GO and KEGG analysis. The results
indicated that genes in this module were significantly enriched in
‘SLE’, ‘muscle filament sliding’ and ‘nucleosome’ (Fig. 3B, Table
I).
| Table II.Subnetwork module analysis by
Molecular Complex Detection plug-in. |
Table II.
Subnetwork module analysis by
Molecular Complex Detection plug-in.
| Score | Nodes | Edges | Node IDs |
|---|
| 17.167 | 37 | 309 | MYBPC2, ACTA1,
ATP2A1, HIST1H3B, TCAP, HIST1H2AI, TTN, NEB, ACTL8, HIST1H4C,
HIST1H3J, HIST1H3F, HIST1H3H, HIST1H4D, MYL3, TNNC2, HIST1H4B,
HIST1H4L, HIST1H2BI, TNNC1, HIST1H2AM, HIST1H1B, MYLPF, HIST1H2BO,
MYL2, HIST1H3I, MYH7, TNNI1, MYL1, HIST1H2AJ, HIST1H2BM, DES, MYH1,
TNNI2, TNNT3, MYH2, ACTN2 |
| 9.882 | 18 | 84 | KISS1R, LIPE,
FABP4, APOB, GNGT1, INS, CCKBR, TRH, OXTR, GHSR, LEP, GCG, LPL,
ADRA1A, CD36, SLC2A4, ADIPOQ, GNG13 |
| 7 | 7 | 21 | ASB10, ASB15,
ASB11, ASB5, FBXO40, UBE2C, KBTBD10 |
| 5 | 5 | 10 | GABRA5, GABRQ,
GABRA3, GABRA1, GABRG2 |
| 4.5 | 5 | 9 | CST4, HTN1, CST2,
CST5, CST1 |
| 4 | 5 | 8 | FBP2, PYGM, GYS2,
PCK1, ENO3 |
| 4 | 4 | 6 | LCE1F, LCE2C, LOR,
LCE1A |
| 3.333 | 4 | 5 | NEUROD1, NKX2-2,
PDX1, IAPP |
| 3.333 | 4 | 5 | ADH1A, ADH1B,
HSD17B13, DHRS7C |
| 3 | 3 | 3 | LDB3, MYPN,
MYOZ1 |
From the MCODE plug-in, a total of 10 genes were
selected as hub genes with degrees ≥10. The further analysis
focused on histone family genes, which were all upregulated in BC
in the present results (Table
SIII). The names of the hub genes were as follows: Histone
cluster 1 H1 family member B (HIST1H1B), HIST1H2AJ, HIST1H2AM,
HIST1H2BI, HIST1H2BO, HIST1H3B, HIST1H3F, HIST1H3H, HIST1H4C
and HIST1H4D.
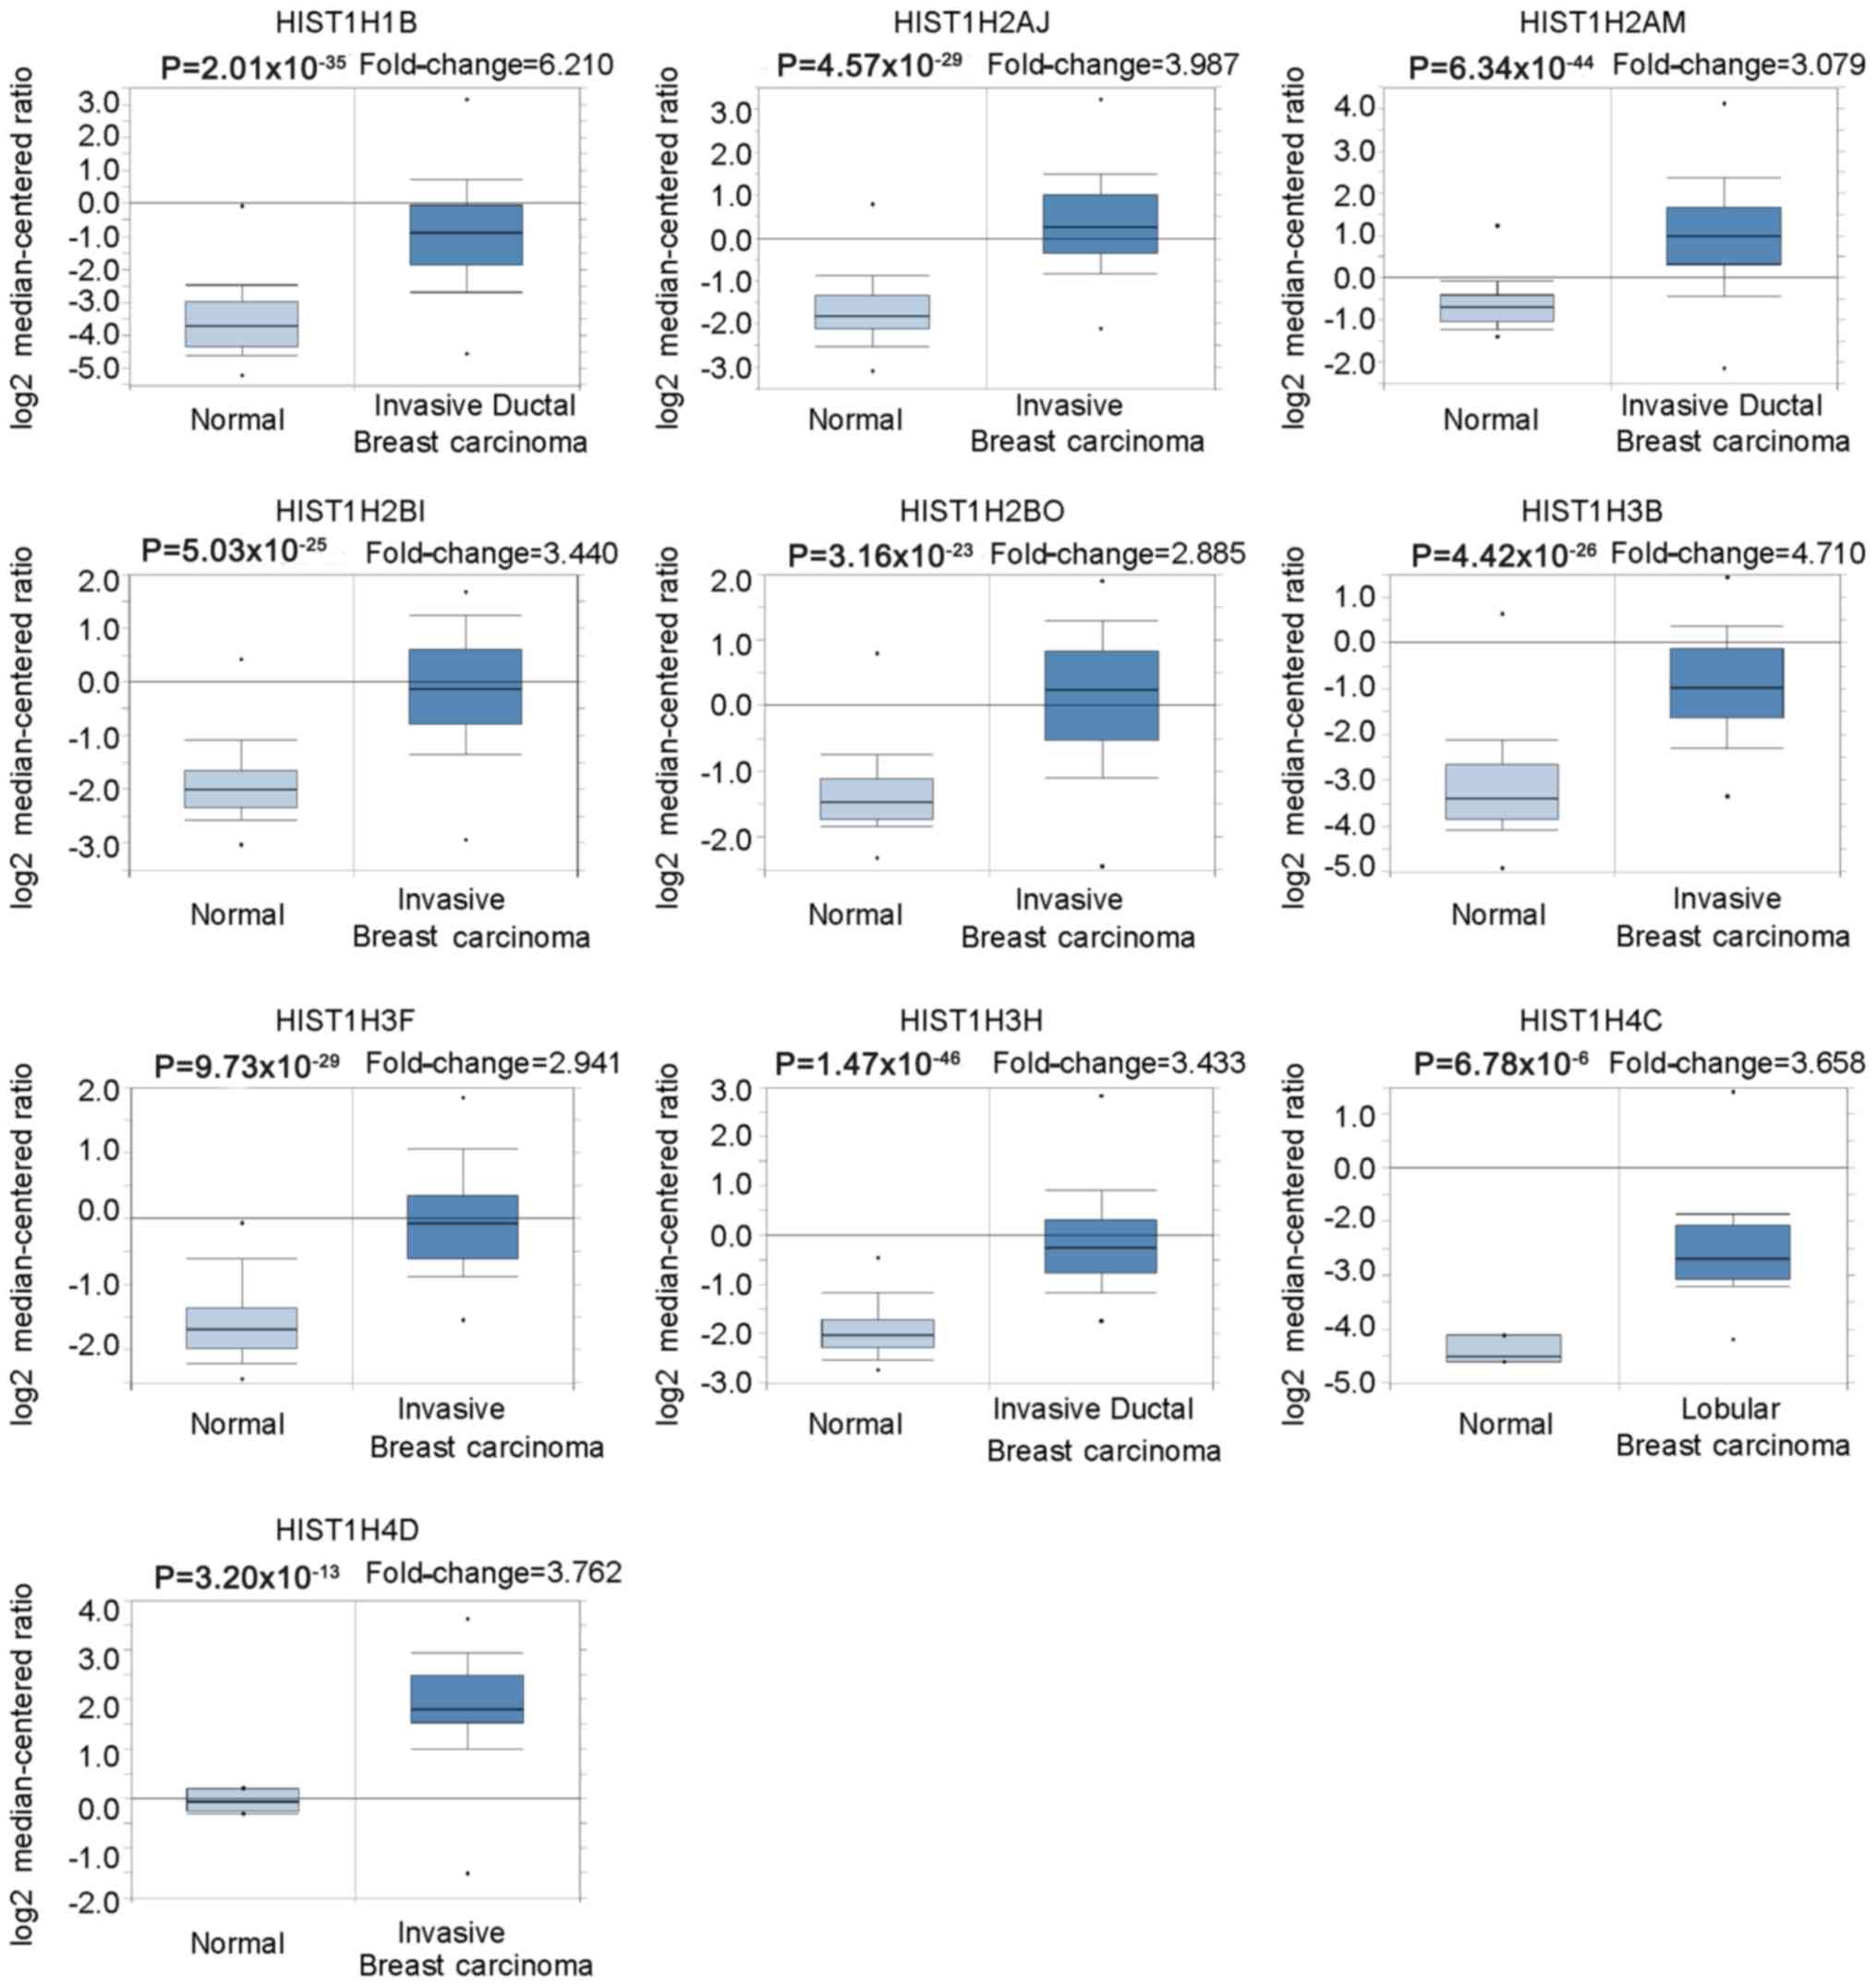
Hub gene analysis
Oncomine was used to further verify the expression
levels of 10 hub genes in BC vs. normal breast tissues. The results
indicated that the histone family genes selected were significantly
upregulated in invasive breast carcinoma, invasive ductal breast
carcinoma and lobular breast carcinoma, with P<0.05 considered
to indicate statistical significance (Fig. 4; Table
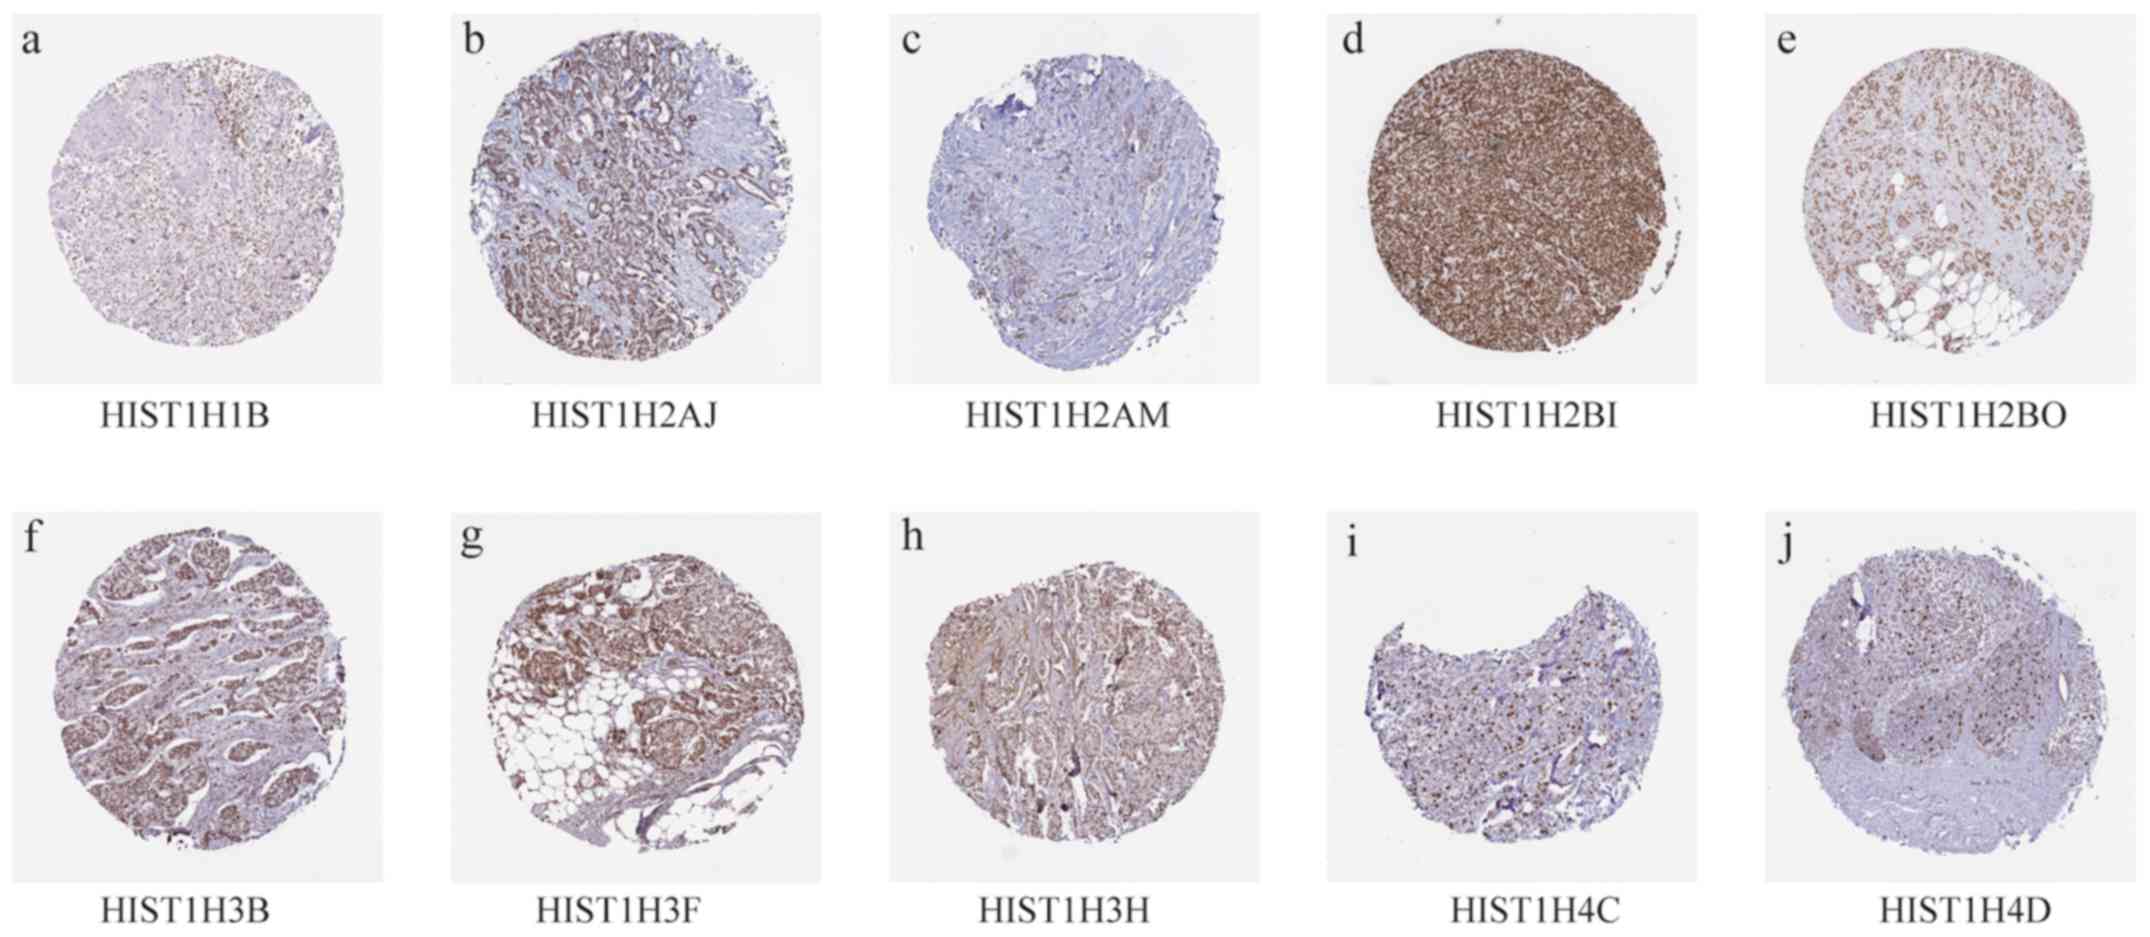
SIV). Analysis using the HPA database indicated that the 10 hub
genes were slightly elevated in BC tissues (Fig. 5; Table
III).
| Table III.Immunohistochemistry analysis of
histone family gene. |
Table III.
Immunohistochemistry analysis of
histone family gene.
| Gene | Patient ID | Age | Sex | Cancer type | Intensity | Quantity |
|---|
| HIST1H1B | 1910 | 61 | Female | Breast Duct
carcinoma | Moderate | >75% |
| HIST1H2AJ | 1939 | 87 | Female | Breast Duct
carcinoma | Strong | >75% |
| HIST1H2AM | 2091 | 40 | Female | Breast Duct
carcinoma | Moderate | >75% |
| HIST1H2BI | 1775 | 55 | Female | Breast Duct
carcinoma | Strong | >75% |
| HIST1H2BO | 2115 | 73 | Female | Breast Duct
carcinoma | Moderate | >75% |
| HIST1H3B | 2160 | 83 | Female | Breast Duct
carcinoma | Moderate | >75% |
| HIST1H3F | 2428 | 75 | Female | Breast Duct
carcinoma | Strong | >75% |
| HIST1H3H | 1874 | 80 | Female | Breast Duct
carcinoma | Strong | >75% |
| HIST1H4C | 2805 | 59 | Female | Breast Lobular
carcinoma | Strong | 75–25% |
| HIST1H4D | 3546 | 58 | Female | Breast Lobular
carcinoma | Strong | <25% |
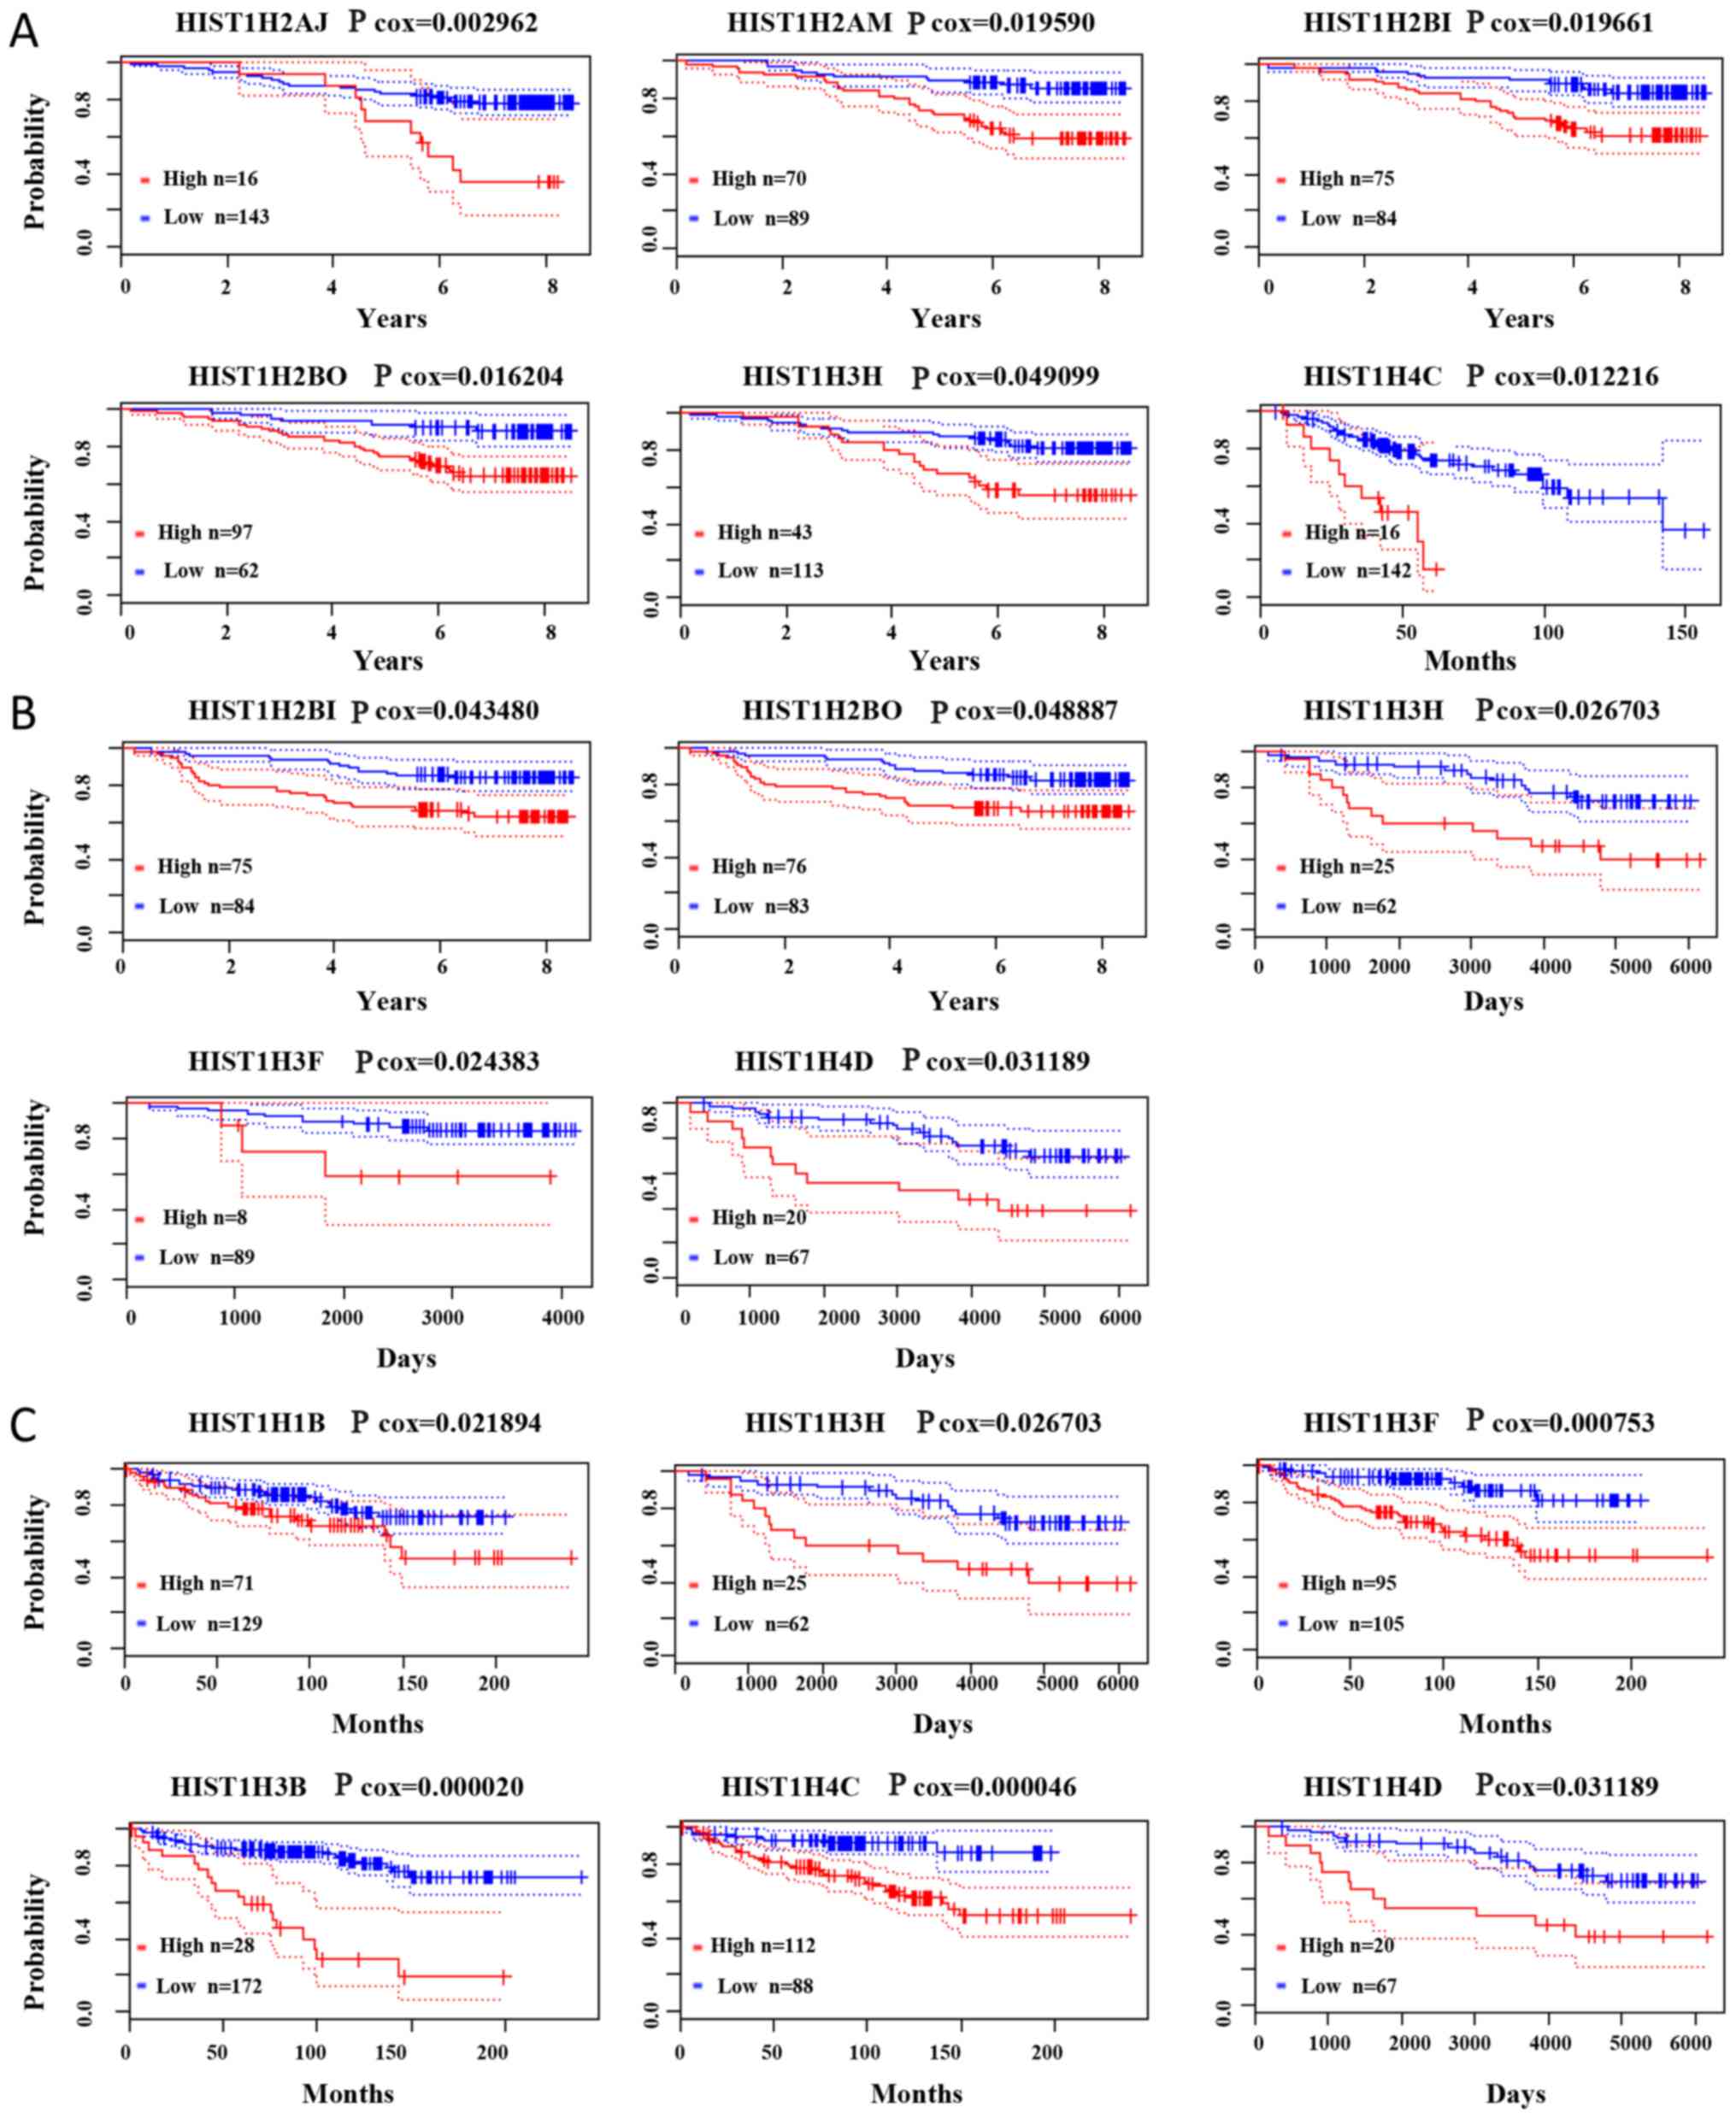
Prognostic value of histone family
genes in BC
PrognoScan was used to further investigate the
survival of hub genes in BC patients. The present results
demonstrated that a higher expression of HIST1H2AJ (Cox
P=0.002962), HIST1H2AM (Cox P=0.019590), HIST1H2BI
(Cox P=0.019661), HIST1H2BO (Cox P=0.016204),
HIST1H3H (Cox P=0.049099) and HIST1H4C (Cox
P=0.012216) were associated with poorer overall survival for BC
patients. Higher expression of HIST1H2BI (Cox P=0.043480),
HIST1H2BO (Cox P=0.048887), HIST1H3H (Cox
P=0.026703), HIST1H3F (Cox P=0.024383) and HIST1H4D
(Cox P=0.031189) was associated with poorer relapse-free survival.
Higher expression of HIST1H1B (Cox P=0.021894),
HIST1H3H (Cox P=0.02670), HIST1H3F (Cox P=0.000753),
HIST1H3B (Cox P=0.000020), HIST1H4C (Cox P=0.000046),
HIST1H4D (Cox P=0.031189) was associated with poorer distant
metastasis-free survival (Fig. 6).
Cox P-values and hazard ratios with 95% confidence intervals are
displayed in Table SV.
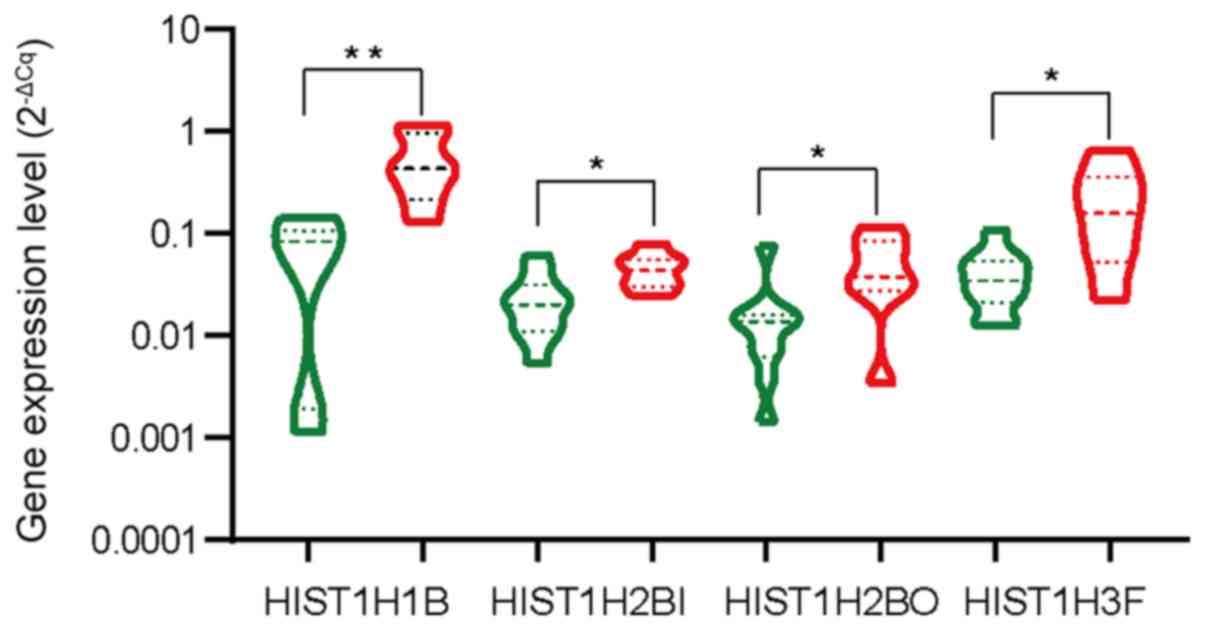
Expression of hub genes in BC
Next, seven of the 10 hub genes were selected to
analyze the expression levels in seven BC samples and 10
para-carcinoma tissues by qPCR. When compared with that in normal
breast tissues, the levels of HIST1H1B, HIST1H2BI, HIST1H2BO
and HIST1H3F were significantly increased in BC samples
compared to paracarcinoma samples (P=0.0016, P=0.0220, P=0.0323 and
P=0.0184, respectively; Fig. 7).
However, the expression levels of HIST1H3B, HIST1H4C and
HIST1H4D in these samples were not significantly different
from those in the adjacent tissues (P>0.05; Fig. S3).
Relationship between genes and
clinical pathological parameters
A total of 1,096 BC samples from TCGA were
investigated to explore the relationship between gene expression
and clinical pathological characteristics. As can be seen in
Table SVI, a significant difference
in HIST1H1B was due to age (P<0.001), estrogen responsive (ER)
growth status (P<0.001), progesterone responsive growth (PR)
status (P<0.001), human epidermal growth factor 2 (HER2) status
(P=0.003) and primary tumors (T) (P=0.032). BC patients in the
group aged <60 (median=5.85) had an increased expression of
HIST1H1B compared with those aged ≥60 (median=3.83). The expression
of HIST1H1B in ER negative BC patients (median=7.99) was more
significantly increased than that in ER positive patients
(median=4.07). The expression of HIST1H1B in PR negative BC
patients (median=7.32) was increased when compared with expression
in PR positive patients (median=4.02). Patients at an early stage
(T1-T2; median=5.15) had increased expression compared with those
at an advanced stage (T3-T4; median=4.17). As can be seen in
Table SVII, a significant
difference in HIST1H2BI expression was due to ER Status (P=0.047).
ER positive BC patients (median=0.95) had increased expression of
HIST1H2BI compared with the ER negative group (median=0.82).
Furthermore, as is shown in Table
SVIII, a significant difference in HIST1H2BO was found to be
related to age (P<0.001), ER Status (P=0.001), PR Status
(P=0.003) and metastasis (M) (P=0.001). Patients aged <60
(median=15.95) exhibited increased expression of HIST1H2BO compared
with patients aged ≥60 (median=11.02). The expression of HIST1H2BO
in ER negative BC patients (median=17.52) was more significantly
increased than that in ER positive patients (median=12.91). The
expression of HIST1H2BO in PR positive patients (median=18.09) was
more significantly increased than in PR negative patients
(median=13.94). The expression of HIST1H2BO in patients without
metastasis (median=14.31) was more significantly increased than in
patients with metastasis (median=8.88). However as is revealed in
Table SIX, there was no significant
difference in HIST1H3F for clinicopathological parameters.
Discussion
Breast carcinoma is the most common type of
malignant tumor in women worldwide. It has been classified into
multiple subtypes according to the molecular status and its
incidence has increased in recent years (2). Gene mutations, which may be inherited,
are thought to be the most common etiological factor for BC
(27). However, epigenetic
reprogramming, which includes DNA methylation, histone
modifications and RNA-mediated gene silencing, has gained vast
interest from researchers investigating its role in BC development,
drug resistance and clinical prognosis (28). Histone modifications occurring on
lysine residues include acetylation, methylation, phosphorylation,
sumoylation, biotinylation and ubiquitination (29).
In the present study, data were extracted from TCGA
and 366 upregulated DEGs and 155 downregulated DEGs between BC and
normal tissue samples were identified using bioinformatics. The PPI
network of these DEGs was constructed and MCODE was used to
construct clusters, which are closely and highly connected regions.
The cluster with the highest score was selected and 37 genes were
contained in this cluster. These genes were obviously enriched in
SLE. Therefore, histone family genes were determined as hub genes
in BC. Previous studies revealed that histone family genes are
involved in multiple cancer types. Copy number variations of
HIST1H1B were reported to be associated with cellular
development and growth, and with proliferation in melanoma
(30). HIST1H3B, as an
amplification-dependent driver oncogene, was reported to be
overexpressed in liver cancer (31).
HIST1H3F, as a classifier gene, was indicated to be able to
predict the prognosis of laryngeal cancer patients (32). Furthermore, the mutation of histone
H3 variants may be a potential specific therapeutic target for
diffuse intrinsic pontine glioma (33). Downregulation of histone H2A and H2B
may be a possible means of reversing clinical anthracycline
resistance in BC (34). In addition,
histone modification profiling may provide valuable classification
biomarkers and predict the risk of BC subtypes (35). Li et al (13) revealed that the histone family of
genes may serve as prognostic factors for survival prediction in
patients with cervical cancer. The authors of the present study
searched PubMed and found that the use of TCGA data for histones
gene family in BC has not been studied, which means data on
histones has not been investigated before in flagship TCGA papers
to the best of our knowledge. The present analysis indicated that
histone family genes may also be used as prognostic factors for BC
patients. It is suggested that the histone family of genes is
closely associated with gynecological cancer types.
According to the KEGG functional pathway analysis,
the set of upregulated histone variant genes were mainly enriched
in the SLE pathway. Histone modification-mediated chromatin changes
and gene expression have a vital role in the pathophysiology of
SLE, which is a systemic autoimmune disease (36). Global histone H3 and H4
hypoacetylation were associated with active cluster of
differentiation 4+ T cells in SLE (37). Deoxyribose-modified H2A histone bound
by serum anti-DNA autoantibodies may trigger immune responses in
SLE (38). Of note, an international
multicenter cohort study suggested a small increased risk for
cancer in general in SLE; however, a decreased risk was estimated
for breast, endometrial and ovarian cancers (39). However, the specific molecular
biological mechanisms of the roles of SLE pathways in BC require
further study.
In the present study, 7 clinical BC and 10 adjacent
non-cancerous tissues were used to examine the levels of histone
members using qPCR. HIST1H1B, HIST1H2BI, HIST1H2BO and
HIST1H3F expression in BC had a tendency to be upregulated,
which was consistent with the results of the analysis of TCGA data.
However, the small number of samples is a limitation. In further
studies, larger cohorts of BC patients are required to demonstrate
the prognostic value of the genes identified by analysis of
in-house data.
To the best of our knowledge, the present study
provides the first preliminary screening to indicate the predictive
value of histone members regarding the prognosis of BC patients.
Through retrieval and analysis of gene expression and survival data
of multiple patients with BC, the present study enhances the
understanding of histone members and their predictive value in BC
prognosis. The present study provides evidence that the histone
gene set may act as prognostic factors for survival in BC
patients.
However, correlations between the clinical features
and the histone gene set of BC have been seldom reported. The
present study used a larger scale sample from TCGA breast cancer
for a systematic investigation of the relationships. Therefore,
based on the TCGA data, the HIST1H1B, HIST1H2BI, HIST1H2BO
expression level in BC was related to age, ER status, PR status,
HER2 status, stage, T and M.
In conclusion, the present study identified
differentially expressed mRNAs in BC. Of note, histone family genes
were identified as the hub genes, which may have a significant
impact on the survival and prognosis of BC patients. However, the
biological function of histone family genes in BC requires further
research.
Supplementary Material
Supporting Data
Acknowledgements
Not applicable.
Funding
The present study was supported by the Shanghai
Talents Development Foundation (grant no. 2017103), the National
Key R&D Program of China (grant no. 2016YFC0104303) and the
National Natural Science Fund (grant no. 81771859).
Availability of data and materials
All data generated or analyzed during this study are
included in this published article or are available from the stated
public repository.
Authors' contributions
FY and CM designed the study. WX, JZ and PZ wrote
the manuscript and analyzed the data. SQ, HZ, XF and YY performed
the experiments. RL, HL, YH, YL, XY and ZL collected patient
samples. All authors agree with the results and conclusions of this
manuscript.
Ethics approval and consent to
participate
The acquisition of tissue specimens for the present
study was approved by the Ethical Committee of Shanghai Tenth
People's Hospital (approval no. 107 SHSY-IEC-4.0/19-24/01). Each
patient provided written informed consent prior to participating in
the study.
Patient consent for publication
Not applicable.
Competing interests
The authors declare that they have no competing
interests.
References
|
1
|
Bray F, Ferlay J, Soerjomataram I, Siegel
RL, Torre LA and Jemal A: Global cancer statistics 2018: GLOBOCAN
estimates of incidence and mortality worldwide for 36 cancers in
185 countries. CA Cancer J Clin. 68:394–424. 2018. View Article : Google Scholar : PubMed/NCBI
|
|
2
|
DeSantis CE, Ma J, Goding Sauer A, Newman
LA and Jemal A: Breast cancer statistics, 2017, racial disparity in
mortality by state. CA Cancer J Clin. 67:439–448. 2017. View Article : Google Scholar : PubMed/NCBI
|
|
3
|
Reed E and Corner J: Defining the illness
trajectory of metastatic breast cancer. BMJ Support Palliat Care.
5:358–365. 2015. View Article : Google Scholar : PubMed/NCBI
|
|
4
|
Redig AJ and McAllister SS: Breast cancer
as a systemic disease: A view of metastasis. J Intern Med.
274:113–126. 2013. View Article : Google Scholar : PubMed/NCBI
|
|
5
|
McShane LM, Altman DG, Sauerbrei W, Taube
SE, Gion M and Clark GM; Statistics Subcommittee of the NCI-EORTC
Working Group on Cancer Diagnostics, : REporting recommendations
for tumour MARKer prognostic studies (REMARK). Br J Cancer.
93:387–391. 2005. View Article : Google Scholar : PubMed/NCBI
|
|
6
|
Costa-Pinheiro P, Montezuma D, Henrique R
and Jerónimo C: Diagnostic and prognostic epigenetic biomarkers in
cancer. Epigenomics. 7:1003–1015. 2015. View Article : Google Scholar : PubMed/NCBI
|
|
7
|
Dworkin AM, Huang TH and Toland AE:
Epigenetic alterations in the breast: Implications for breast
cancer detection, prognosis and treatment. Semin Cancer Biol.
19:165–171. 2009. View Article : Google Scholar : PubMed/NCBI
|
|
8
|
Karsli-Ceppioglu S, Dagdemir A, Judes G,
Ngollo M, Penault-Llorca F, Pajon A, Bignon YJ and Bernard-Gallon
D: Epigenetic mechanisms of breast cancer: An update of the current
knowledge. Epigenomics. 6:651–664. 2014. View Article : Google Scholar : PubMed/NCBI
|
|
9
|
Yang HD, Kim PJ, Eun JW, Shen Q, Kim HS,
Shin WC, Ahn YM, Park WS, Lee JY and Nam SW: Oncogenic potential of
histone-variant H2A.Z.1 and its regulatory role in cell cycle and
epithelial-mesenchymal transition in liver cancer. Oncotarget.
7:11412–11423. 2016.PubMed/NCBI
|
|
10
|
Rangasamy D: Histone variant H2A.Z can
serve as a new target for breast cancer therapy. Curr Med Chem.
17:3155–3161. 2010. View Article : Google Scholar : PubMed/NCBI
|
|
11
|
Chen H, Lorton B, Gupta V and Shechter D:
A TGFβ-PRMT5-MEP50 axis regulates cancer cell invasion through
histone H3 and H4 arginine methylation coupled transcriptional
activation and repression. Oncogene. 36:373–386. 2017. View Article : Google Scholar : PubMed/NCBI
|
|
12
|
Yokoyama Y, Matsumoto A, Hieda M, Shinchi
Y, Ogihara E, Hamada M, Nishioka Y, Kimura H, Yoshidome K,
Tsujimoto M, et al: Loss of histone H4K20 trimethylation predicts
poor prognosis in breast cancer and is associated with invasive
activity. Breast Cancer Res. 16:R662014. View Article : Google Scholar : PubMed/NCBI
|
|
13
|
Li X, Tian R, Gao H, Yang Y, Williams BRG,
Gantier MP, McMillan NAJ, Xu D, Hu Y and Gao Y: Identification of a
histone family gene signature for predicting the prognosis of
cervical cancer patients. Sci Rep. 7:164952017. View Article : Google Scholar : PubMed/NCBI
|
|
14
|
Tomczak K, Czerwińska P and Wiznerowicz M:
The Cancer Genome Atlas (TCGA): An immeasurable source of
knowledge. Contemp Oncol (Pozn). 19:A68–A77. 2015.PubMed/NCBI
|
|
15
|
Robinson MD, McCarthy DJ and Smyth GK:
edgeR: A Bioconductor package for differential expression analysis
of digital gene expression data. Bioinformatics. 26:139–140. 2010.
View Article : Google Scholar : PubMed/NCBI
|
|
16
|
Huang W, Sherman BT and Lempicki RA:
Bioinformatics enrichment tools: Paths toward the comprehensive
functional analysis of large gene lists. Nucleic Acids Res.
37:1–13. 2009. View Article : Google Scholar : PubMed/NCBI
|
|
17
|
Huang W, Sherman BT and Lempicki RA:
Systematic and integrative analysis of large gene lists using DAVID
bioinformatics resources. Nat Protoc. 4:44–57. 2009. View Article : Google Scholar : PubMed/NCBI
|
|
18
|
Ashburner M, Ball CA, Blake JA, Botstein
D, Butler H, Cherry JM, Davis AP, Dolinski K, Dwight SS, Eppig JT,
et al The Gene Ontology Consortium, : Gene ontology: Tool for the
unification of biology. Nat Genet. 25:25–29. 2000. View Article : Google Scholar : PubMed/NCBI
|
|
19
|
Gene Ontology Consortium, . Gene Ontology
Consortium: Going forward. Nucleic Acids Res. 43:D1049–D1056. 2015.
View Article : Google Scholar : PubMed/NCBI
|
|
20
|
Kanehisa M, Furumichi M, Tanabe M, Sato Y
and Morishima K: KEGG: New perspectives on genomes, pathways,
diseases and drugs. Nucleic Acids Res. 45:D353–D361. 2017.
View Article : Google Scholar : PubMed/NCBI
|
|
21
|
Szklarczyk D, Morris JH, Cook H, Kuhn M,
Wyder S, Simonovic M, Santos A, Doncheva NT, Roth A, Bork P, et al:
The STRING database in 2017: Quality-controlled protein-protein
association networks, made broadly accessible. Nucleic Acids Res.
45:D362–D368. 2017. View Article : Google Scholar : PubMed/NCBI
|
|
22
|
Van Parys T, Melckenbeeck I, Houbraken M,
Audenaert P, Colle D, Pickavet M, Demeester P and Van de Peer Y: A
Cytoscape app for motif enumeration with ISMAGS. Bioinformatics.
33:461–463. 2017.PubMed/NCBI
|
|
23
|
Rhodes DR, Kalyana-Sundaram S, Mahavisno
V, Varambally R, Yu J, Briggs BB, Barrette TR, Anstet MJ,
Kincead-Beal C, Kulkarni P, et al: Oncomine 3.0: Genes, pathways,
and networks in a collection of 18,000 cancer gene expression
profiles. Neoplasia. 9:166–180. 2007. View Article : Google Scholar : PubMed/NCBI
|
|
24
|
Pontén F, Jirström K and Uhlen M: The
Human Protein Atlas - a tool for pathology. J Pathol. 216:387–393.
2008. View Article : Google Scholar : PubMed/NCBI
|
|
25
|
Mizuno H, Kitada K, Nakai K and Sarai A:
PrognoScan: A new database for meta-analysis of the prognostic
value of genes. BMC Med Genomics. 2:182009. View Article : Google Scholar : PubMed/NCBI
|
|
26
|
Tang R, Liang L, Luo D, Feng Z, Huang Q,
He R, Gan T, Yang L and Chen G: Downregulation of miR-30a is
associated with poor prognosis in lung cancer. Med Sci Monit.
21:2514–2520. 2015. View Article : Google Scholar : PubMed/NCBI
|
|
27
|
Abbasi S, Rasouli M, Nouri M and Kalbasi
S: Association of estrogen receptor-α A908G (K303R) mutation with
breast cancer risk. Int J Clin Exp Med. 6:39–49. 2013.PubMed/NCBI
|
|
28
|
Basse C and Arock M: The increasing roles
of epigenetics in breast cancer: Implications for pathogenicity,
biomarkers, prevention and treatment. Int J Cancer. 137:2785–2794.
2015. View Article : Google Scholar : PubMed/NCBI
|
|
29
|
Katz TA, Huang Y, Davidson NE and
Jankowitz RC: Epigenetic reprogramming in breast cancer: From new
targets to new therapies. Ann Med. 46:397–408. 2014. View Article : Google Scholar : PubMed/NCBI
|
|
30
|
Fidalgo F, Rodrigues TC, Silva AG, Facure
L, de Sá BC, Duprat JP, Achatz MI, Rosenberg C, Carraro DM and
Krepischi AC: Role of rare germline copy number variation in
melanoma-prone patients. Future Oncol. 12:1345–1357. 2016.
View Article : Google Scholar : PubMed/NCBI
|
|
31
|
Ohshima K, Hatakeyama K, Nagashima T,
Watanabe Y, Kanto K, Doi Y, Ide T, Shimoda Y, Tanabe T, Ohnami S,
et al: Integrated analysis of gene expression and copy number
identified potential cancer driver genes with
amplification-dependent overexpression in 1,454 solid tumors. Sci
Rep. 7:6412017. View Article : Google Scholar : PubMed/NCBI
|
|
32
|
Mirisola V, Mora R, Esposito AI, Guastini
L, Tabacchiera F, Paleari L, Amaro A, Angelini G, Dellepiane M,
Pfeffer U, et al: A prognostic multigene classifier for squamous
cell carcinomas of the larynx. Cancer Lett. 307:37–46. 2011.
View Article : Google Scholar : PubMed/NCBI
|
|
33
|
Castel D, Philippe C, Calmon R, Le Dret L,
Truffaux N, Boddaert N, Pagès M, Taylor KR, Saulnier P, Lacroix L,
et al: Histone H3F3A and HIST1H3B K27M mutations define two
subgroups of diffuse intrinsic pontine gliomas with different
prognosis and phenotypes. Acta Neuropathol. 130:815–827. 2015.
View Article : Google Scholar : PubMed/NCBI
|
|
34
|
Braunstein M, Liao L, Lyttle N, Lobo N,
Taylor KJ, Krzyzanowski PM, Kalatskaya I, Yao CQ, Stein LD, Boutros
PC, et al: Downregulation of histone H2A and H2B pathways is
associated with anthracycline sensitivity in breast cancer. Breast
Cancer Res. 18:162016. View Article : Google Scholar : PubMed/NCBI
|
|
35
|
Chen X, Hu H, He L, Yu X, Liu X, Zhong R
and Shu M: A novel subtype classification and risk of breast cancer
by histone modification profiling. Breast Cancer Res Treat.
157:267–279. 2016. View Article : Google Scholar : PubMed/NCBI
|
|
36
|
Hedrich CM: Epigenetics in SLE. Curr
Rheumatol Rep. 19:582017. View Article : Google Scholar : PubMed/NCBI
|
|
37
|
Hu N, Qiu X, Luo Y, Yuan J, Li Y, Lei W,
Zhang G, Zhou Y, Su Y and Lu Q: Abnormal histone modification
patterns in lupus CD4+ T cells. J Rheumatol. 35:804–810.
2008.PubMed/NCBI
|
|
38
|
Alam S, Arif Z and Alam K: Glycated-H2A
histone is better bound by serum anti-DNA autoantibodies in SLE
patients: Glycated-histones as likely trigger for SLE?
Autoimmunity. 48:19–28. 2015. View Article : Google Scholar : PubMed/NCBI
|
|
39
|
Bernatsky S, Ramsey-Goldman R, Labrecque
J, Joseph L, Boivin JF, Petri M, Zoma A, Manzi S, Urowitz MB,
Gladman D, et al: Cancer risk in systemic lupus: An updated
international multi-centre cohort study. J Autoimmun. 42:130–135.
2013. View Article : Google Scholar : PubMed/NCBI
|