Introduction
Consecutive and non-invasive pulse oxygen saturation
(SpO2) may be measured using pulse oximetry, which
allows for rapid identification of hypoxic state. Therefore, this
technique is a useful clinical alternative to intermittent arterial
blood sampling (1). However,
measurement of SpO2 has certain limitations and is
difficult to use in the presence of nail polish, anaemia, light
interference, skin pigmentation, venous pulsations and low
perfusion, as they may cause measurement errors (2). In 1977, Jöbsis (3) introduced, for the first time, the
monitoring of regional cerebral oxygen saturation
(rcSO2) via near-infrared spectroscopy (NIRS). NIRS
takes advantage of the tissue penetration abilities of light of the
near-infrared spectrum. In contrast to SpO2,
rcSO2 does not require plethysmography, and pulsatile
flow measurement is also not required. NIRS assumes a relative and
fixed amount of arterial vs. venous blood to determine the oxygen
saturation. Therefore, rcSO2 does not provide an
indicator of oxygen delivery and instead provides information
regarding the balance between regional oxygen supply and demand
(4). Recent studies have suggested
that pediatric patients may benefit from rcSO2
monitoring during surgery (5–9). The use
of rcSO2 is increasing, but the routine use of
rcSO2 as a standard-of-care monitor is still not
recommended at present.
Although it has been reported that rcSO2
provides an earlier alert during hypoxia compared with pulse
oximetry (10), whether
SpO2 and rcSO2 exhibit similar response
curves during acute apnea has, to the best of our knowledge, not
yet been reported in preschool children. The purpose of the present
study was to determine whether a correlation is present between the
changing tendency of SpO2 and rcSO2 in
response to hypoxia in preschool patients. It was hypothesized that
SpO2 may exhibit the same response to hypoxia as
rcSO2.
Materials and methods
Ethical approval and consent to
participate
The present study was registered in the research
registry (www.chictr.org.cn; registration no.
ChiCTR-OOC-16008095; 14 March 2016). The protocol (no. 2016-08; 1
March 2016) was approved by the review board of the Second
Affiliated Hospital and Yuying Children's Hospital of Wenzhou
Medical University (Wenzhou, China). Written informed consent had
been obtained by the parents or legally authorized guardians.
Inclusion criteria
A total of 36 pediatric patients [age, 4–6 years;
American Society of Anesthesiologists (ASA) grade I or II],
scheduled for elective tonsillectomy between May and September 2016
at the Second Affiliated Hospital and Yuying Children's Hospital of
Wenzhou Medical University were enrolled in the present clinical
trial.
Exclusion criteria
Patients were excluded if they exhibited the
following: i) No cooperation; ii) body mass index of <13.5
kg/m2 or >31 kg/m2; iii) upper airway
infection; iv) serious respiratory and/or cardiovascular disease,
hepatic or renal insufficiency (the values of alanine
aminotransferase, aspartate aminotransferase, blood urea nitrogen,
creatinine >1.5 times the upper limit of the normal level); v)
asthma or airway hyperresponsiveness, neuromuscular diseases or
cachexia; vi) airway abnormalities and a previous history of an
abnormal response to anesthesia; vii) an acid-base imbalance or
severe electrolyte disorder; viii) participation in another
clinical study within 30 days.
Experimental design
After arrival in the operating room, intravenous
access was established into the peripheral vein in the forearm for
induction of anaesthesia. Throughout the present study, all
patients were continuously monitored, with their rcSO2
(SenSmart™; Nonin Medical, Inc.) being assessed using a cerebral
oximetry probe (reading rcSO2 every 5 sec), which was
placed on the middle of the forehead, and SpO2 being
assessed using an oximetry probe (M1133A; Philips Medical Systems,
Inc.), which was placed on the right index finger. Non-invasive
systolic blood pressure (SBP), mean arterial pressure (MAP) and
diastolic blood pressure (DBP) were measured every 1 min on a
different limb to the SpO2 probe. Heart rate (HR),
electrocardiogram and end-tidal carbon dioxide partial pressure
(PETCO2) were also continuously monitored.
Induction of anaesthesia was performed using propofol 2–3 mg/kg,
fentanyl 2–3 µg/kg and cisatracurium 0.1–0.2 mg/kg. Anaesthesia was
maintained with a continuous target-controlled infusion of propofol
and remifentanil. Pressure-controlled ventilation of 100% oxygen
through a mask, with a flow rate of 6 l/min, was administered, and
PETCO2 was maintained between 30 and 35 mmHg.
After a period of 6 min, mechanical ventilation was stopped and the
tracheal tube was successfully introduced using a video
laryngoscope. The tracheal tube was subsequently disconnected from
the circuit and the proximal end was opened until the
SpO2 decreased to 90% or until the rcSO2
decreased by >10% of the baseline level. The tracheal tube was
then reconnected to the circuit and ventilation was recovered with
a flow rate of 6 l/min of 100% oxygen.
The values of NIBP, HR, SpO2 and
rcSO2 were recorded at the designated time-points:
T0 indicates the time-point prior to application of
oxygen prior to oxygenation; T1 indicates baseline, the
time-point at which the mechanical ventilation was stopped;
T2 indicates the time-point at which SpO2
began to drop from the baseline level; t2 indicates the
time-point at which rcSO2 began to drop from the
baseline level; T3 indicates the time-point of
SpO2 decreasing to 90% or rcSO2 decreasing by
>10% of the baseline level and mechanical ventilation being
recovered; T4 indicates the time-point at which
SpO2 began to rise from the minimum value following
ventilation; t4 indicates the time-point at which
rcSO2 began to rise from the minimum value following
ventilation; T5 indicates the time-point at which
SpO2 returned to the baseline level, t5
indicates the time-point at which rcSO2 returned to the
baseline level. ST1-T4 indicates the value of
SpO2 at T1 (baseline)-the value of
SpO2 at T4 (the minimum value);
RT1-t4 indicates the value of rcSO2 at the
T1 time-point (baseline)-the value of rcSO2
at t4 (the minimum value; Fig. 1).
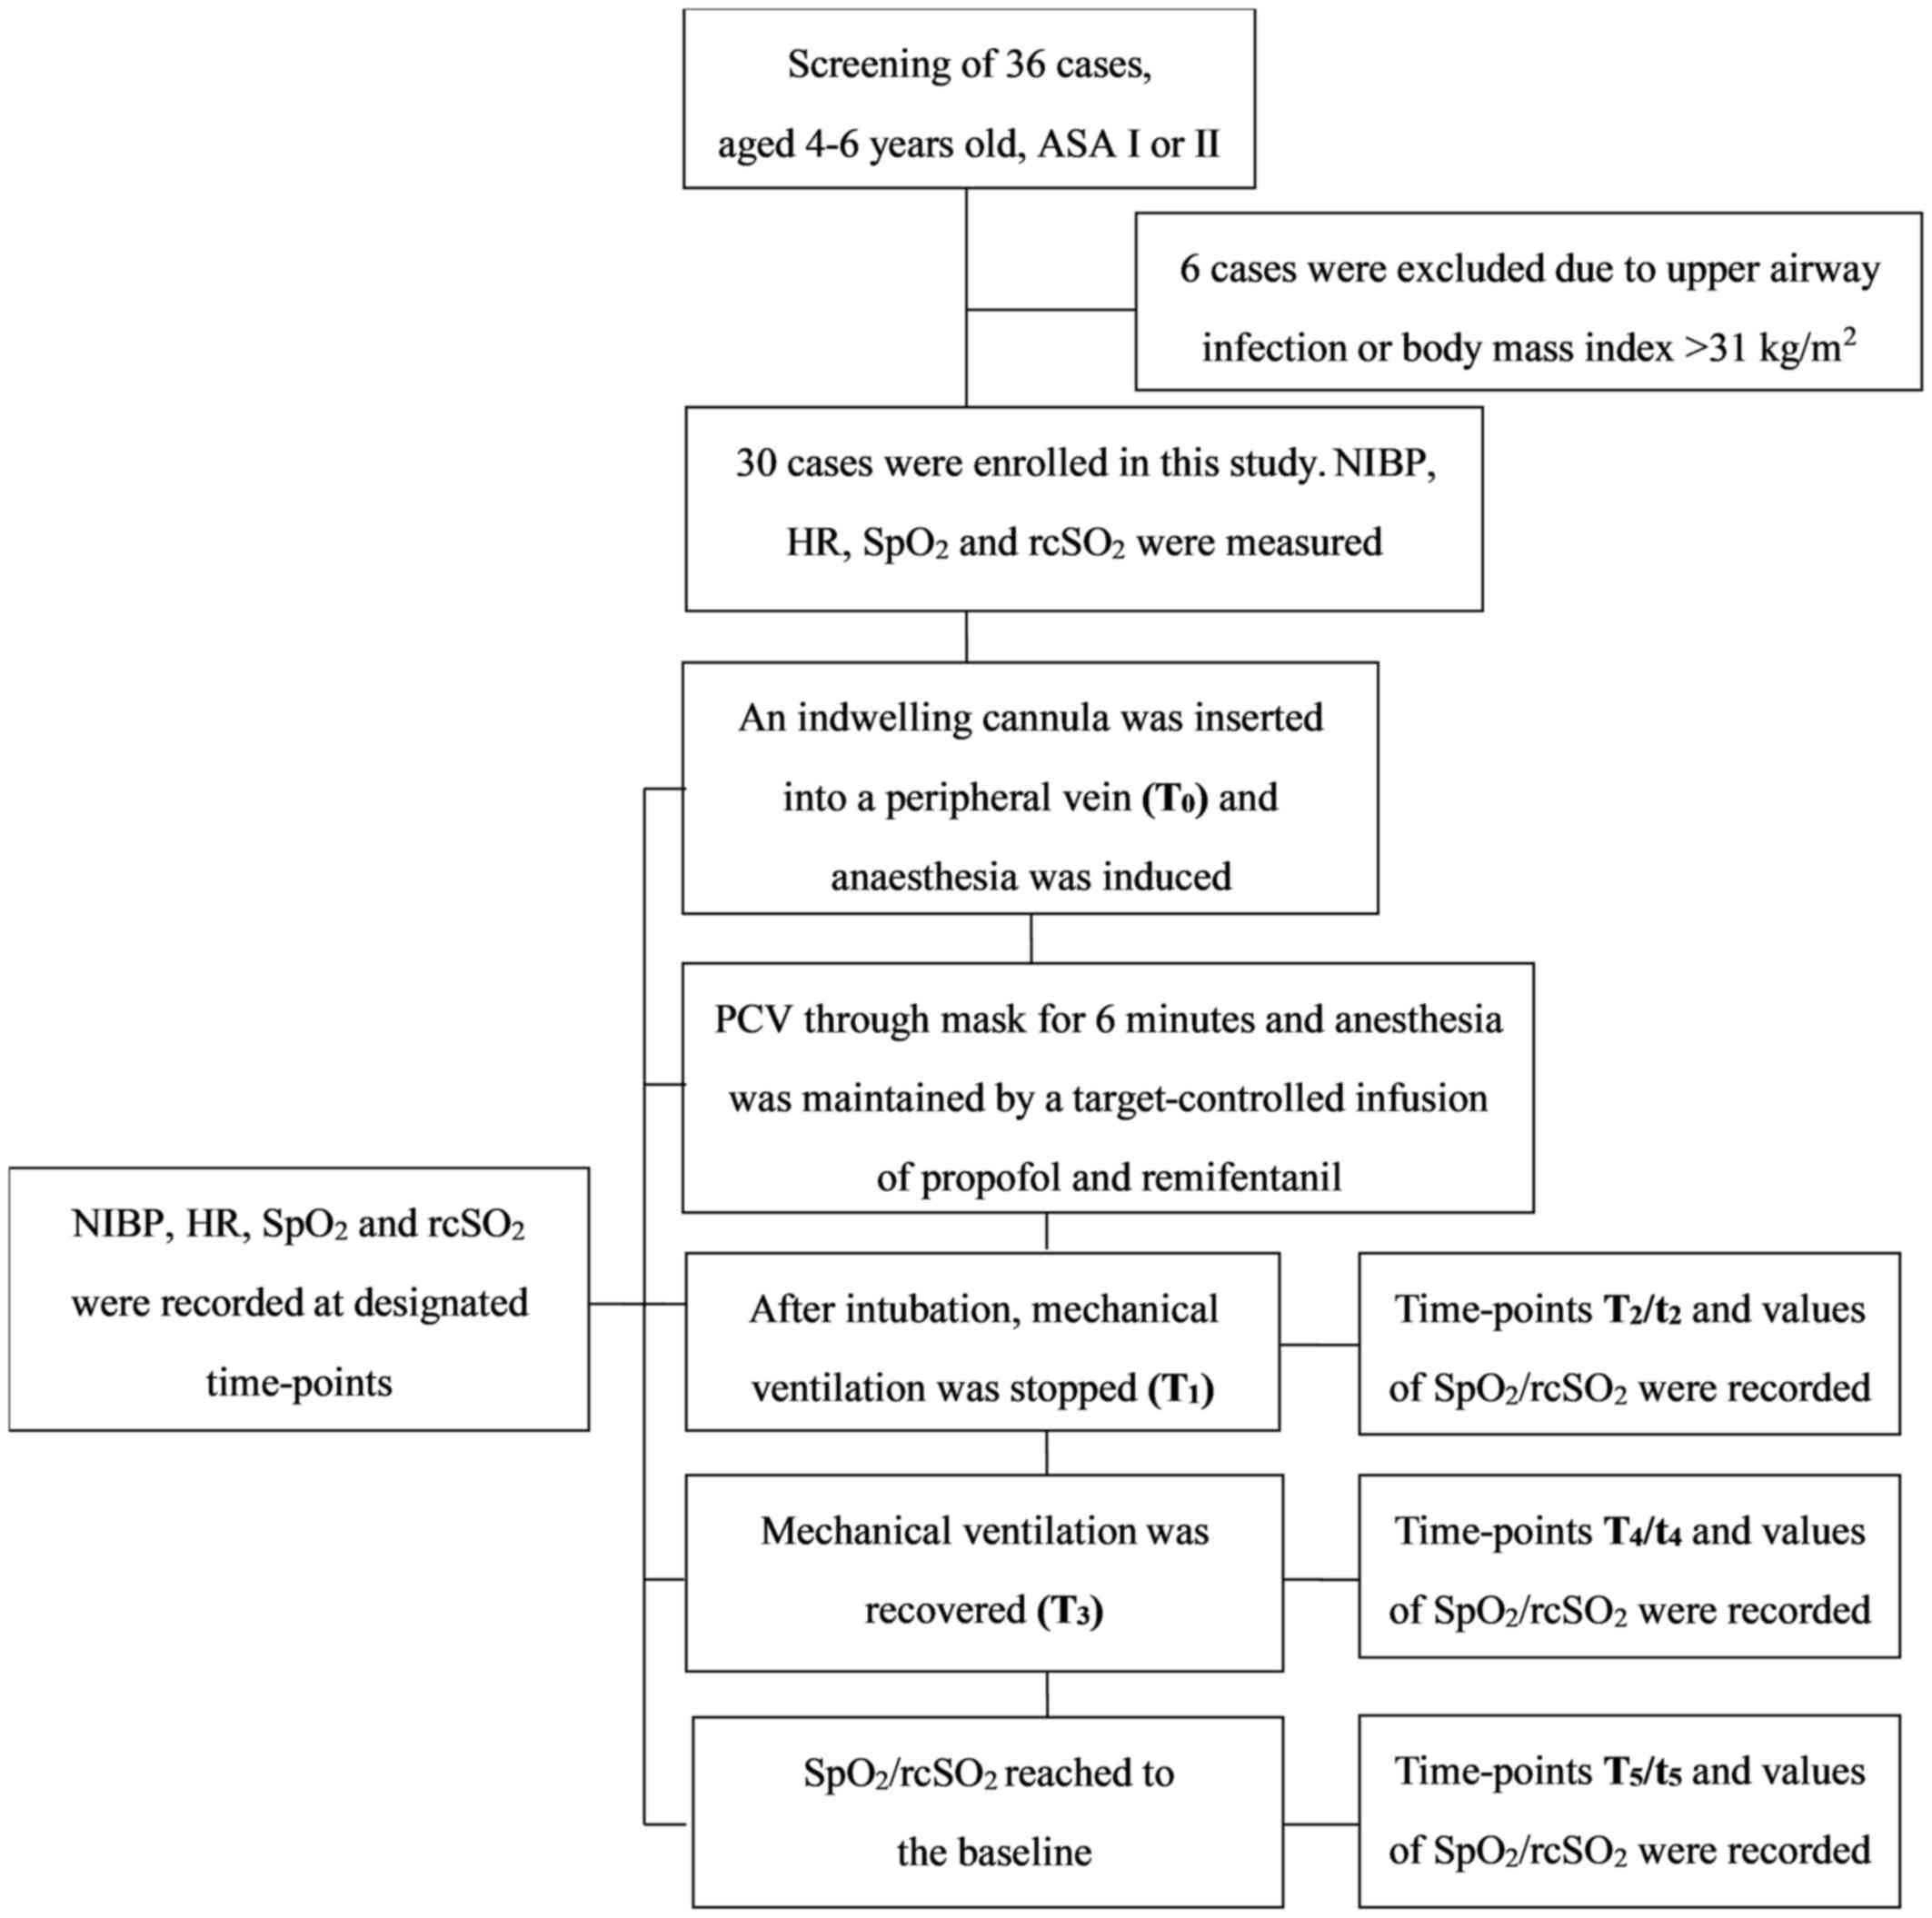 | Figure 1.Flow chart of the study. ASA,
American Society of Anesthesiologists; NIBP, non-invasive blood
pressure; HR, heart rate; SpO2, pulse oxygen saturation;
rcSO2, regional cerebral oxygen saturation; PCV,
pressure-controlled ventilation; T0, time-point prior to
application of any oxygen for pre-oxygenation; T1,
baseline, the time-point at which the mechanical ventilation was
stopped; T2, the time-point at which SpO2
began to drop from baseline; t2, the time-point at which
rcSO2 began to drop from baseline; T3, the
time-point at which SpO2 decreased to 90% or
rcSO2 decreased to by >10% of the baseline and
mechanical ventilation was recovered; T4, the time-point
at which SpO2 began to rise from the minimum value
following ventilation; t4, the time-point at which
rcSO2 began to rise from the minimum value following
ventilation; T5, the time-point at which SpO2
returned to the baseline level, t5, the time-point at
which rcSO2 returned to the baseline level. |
Statistical analysis
All data were expressed as the mean ± standard
deviation or as n (%), as appropriate. Statistical analysis was
performed using SPSS 18.0 (SPSS Inc.). The calculation of the
sample size, besides being based on the pilot study, mainly
referred to that in previous studies (Koch et al (8), where the sample size was n=21, and the
authors studied the perioperative use of cerebral and renal
near-infrared spectroscopy in neonates; and Eichhorn et al
(11), where the sample size was
n=10, and a clinical trial was used to evaluate the use of
near-infrared spectroscopy under apnea-dependent hypoxia in
humans).
The normality of distribution of data was examined
using the Shapiro-Wilk test. For the data that did not exhibit a
normal distribution, a Wilcoxon signed-rank test and Spearman's
rank correlation were used. Data exhibiting a normal distribution
were analyzed using a repeated-measures one-way analysis of
variance and Pearson's linear correlation. P<0.05 was considered
to indicate statistical significance.
Results
Patient characteristics
Among the 36 pediatric patients considered for the
present study, 6 cases were excluded due to upper airway infection
or body mass index >31 kg/m2, which may have added
complexity to the procedure. Finally, a total of 30 patients,
including 21 males and 9 females (age, 4.9±0.8 years; body weight,
21.8±5.5 kg) were enrolled in the present study.
Vital signs at different
time-points
Compared with the values at T0, the SBP,
MAP and DBP were decreased at the time-points from T1 to
T5/t5, and the HR was decreased at the
T1 time-point (P<0.001). Compared with those at
T1, the MAP and DBP were increased at the T2
time-point and the HR was increased from the
T2/t2 to the T5/t5
time-point (P<0.001), as presented in Table I.
 | Table I.Dynamic changes of SBP, MBP, DBP and
HR at different time-points. |
Table I.
Dynamic changes of SBP, MBP, DBP and
HR at different time-points.
| Parameter | T0 | T1 |
T2/t2 | T3 |
T4/t4 |
T5/t5 |
|---|
| SBP (mmHg) | 112±12 | 94±11a | 98±13a/97±12a | 97±13a | 97±12a/97±13a | 98±13a/98±12a |
| MAP (mmHg) | 80±9 | 62±8a | 68±11ab/66±9ab | 65±9a | 65±9a/65±9a | 66±10a/64±11a |
| DBP (mmHg) | 64±11 | 46±9a | 53±11ab/51±9ab | 49±9a | 49±9a/49±9a | 50±10a/47±12a |
| HR (bpm) | 96±16 | 83±13a | 93±12b/91±10b | 92±16b | 92±16b/92±16b | 91±16b/98±15b |
Changes of rcSO2 and
SpO2 over time
The values for rcSO2 and SpO2
are provided in Table II and the
different time-intervals are stated in Table III. Compared with the
SpO2, the rcSO2 exhibited an earlier decrease
in response to hypoxia (t2-T1=80.2±23.6 sec
vs. T2-T1=124.4±20.5 sec; P<0.001).
However, the rcSO2 decreased slower than the
SpO2 (T3-t2=104.8±27.3 sec vs.
T3-T2=60.6±13.7 sec; P<0.001).
Furthermore, the decrease of SpO2 to 90% of the baseline
occurred earlier than that of rcSO2 decreasing by
>10% of the baseline in all thirty cases. After the recovery of
ventilation, rcSO2 was increased earlier than
SpO2 (t4-T3=13.4±6.2 sec vs.
T4-T3=18.9±6.5 sec; P<0.001) and the duration of
t5-t4 was longer than that of
T5-T4 (84.8±24.3 sec vs. 15.2±6.8 sec;
P<0.001). In addition, the duration of
t5-T3 was longer than that of
T5-T3 (98.2±24.3 sec vs. 34.1±6.8 sec;
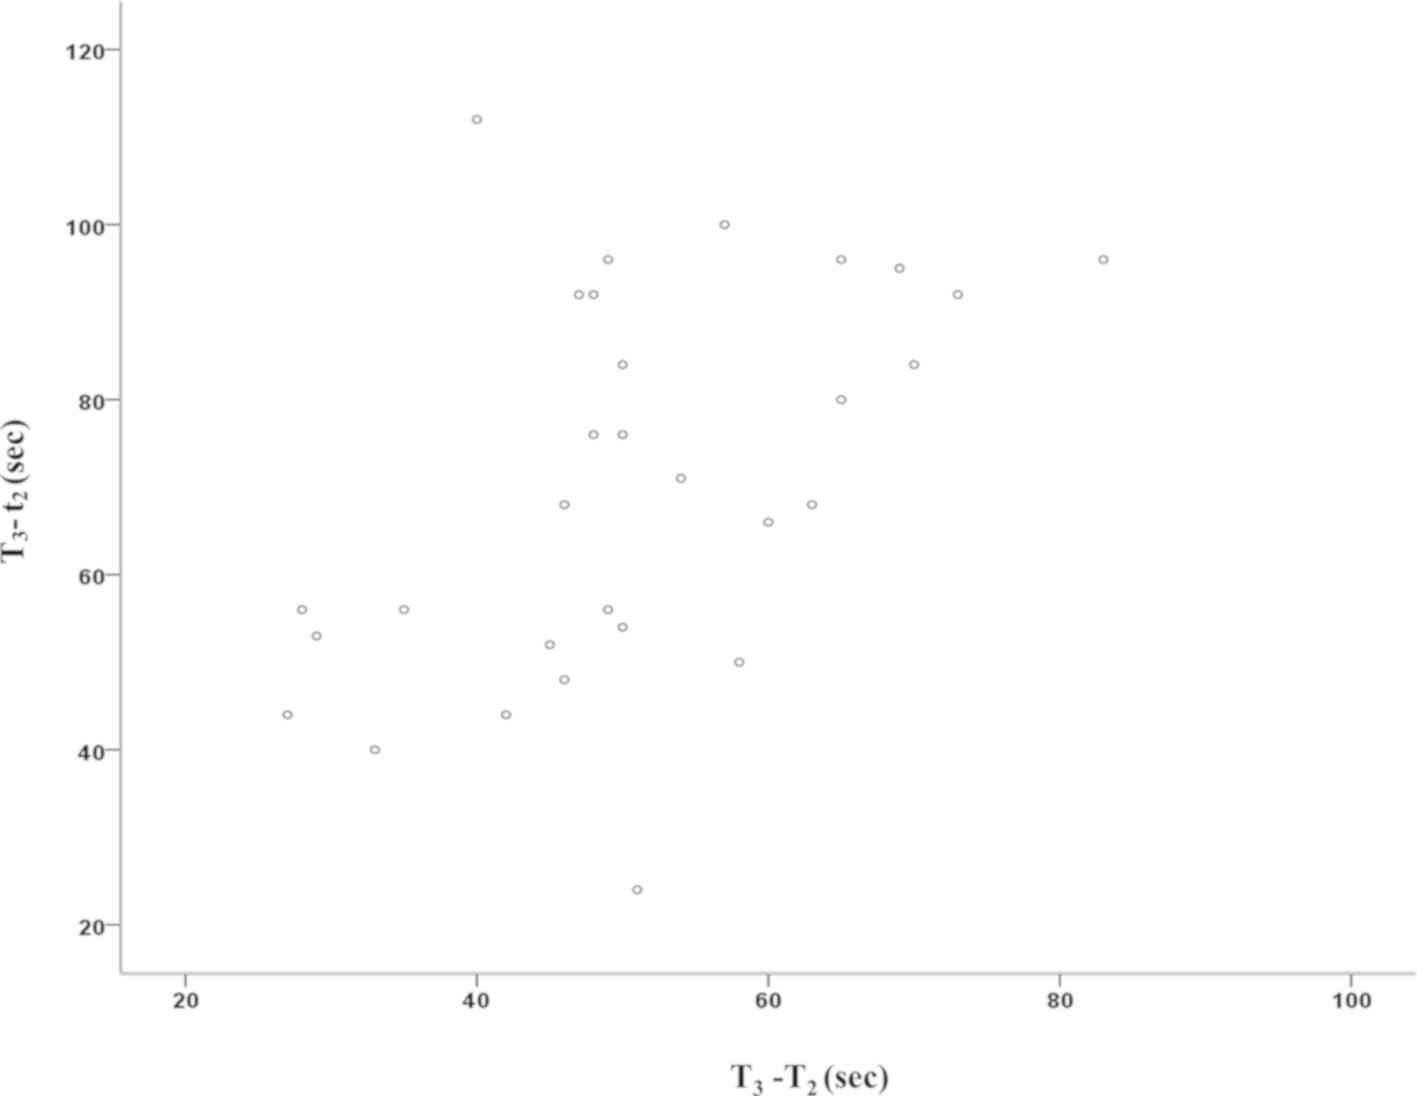
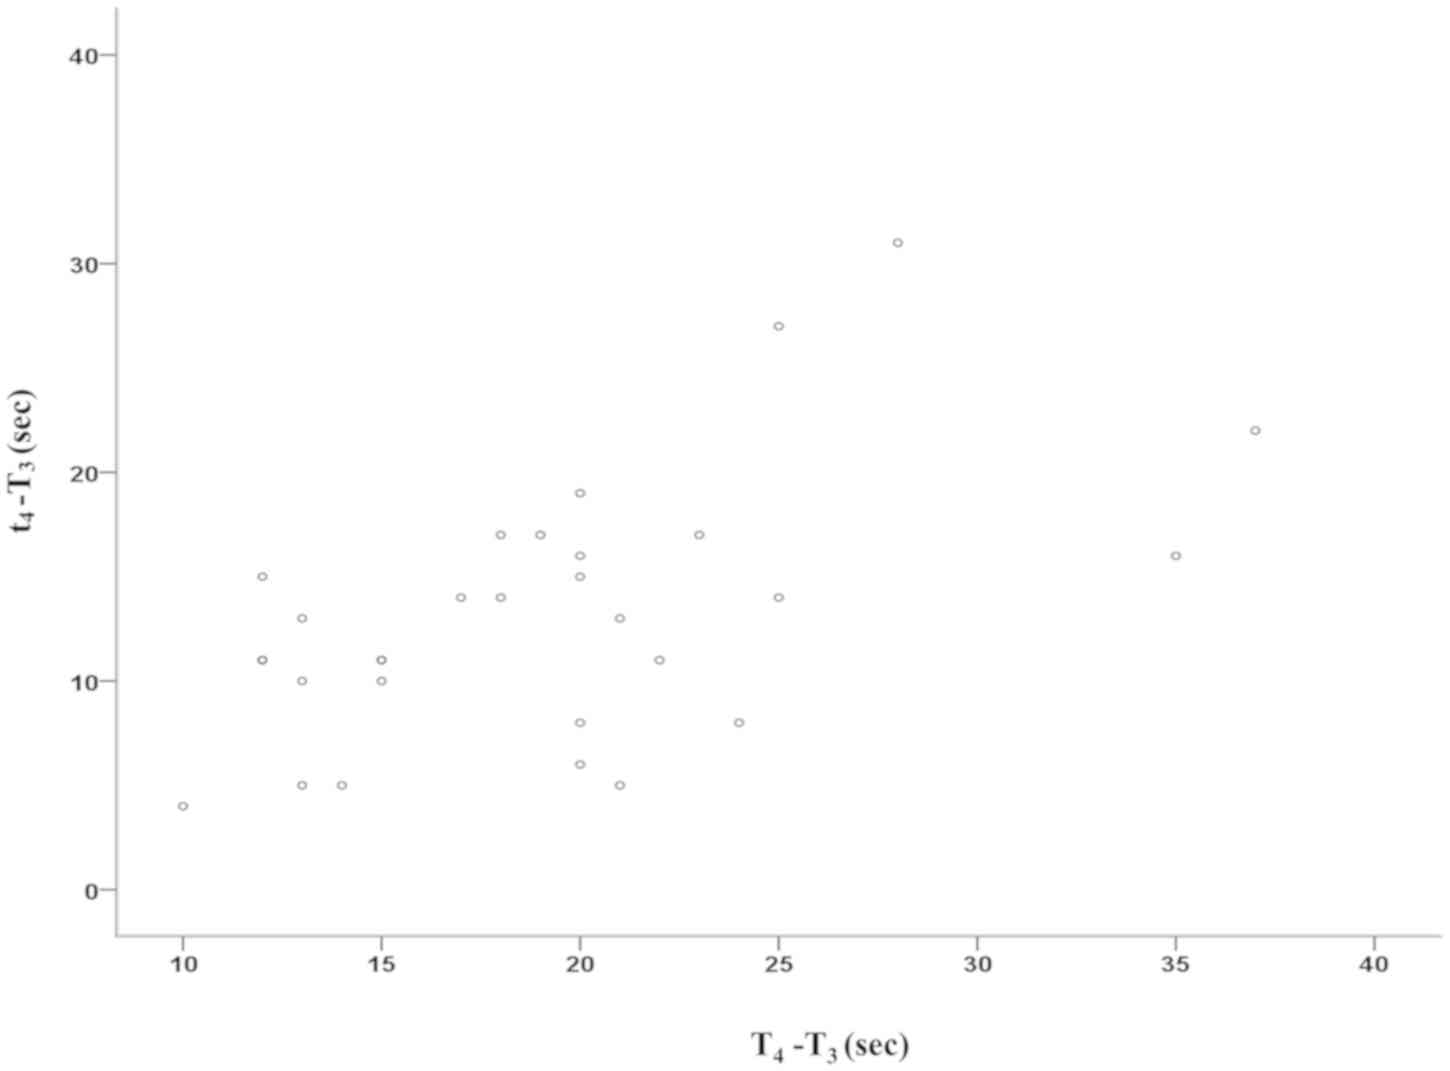
P<0.001). From T2/t2 to T3, the
rcSO2 and SpO2 values exhibited a decrease
and a significant correlation of the two parameters was determined
(Pearson's correlation coefficient=0.317; P=0.027). From
T3 to T4/t4, the rcSO2
and SpO2 values decreased significantly and a
significant correlation of the two parameters was obtained
(Spearman's correlation coefficient=0.489; P=0.006), as shown in
Figs. 2 and 3. Compared with ST1-T4,
RT1-t4 was smaller (9.7±0.5 sec vs. 5.3±2.7%;
P<0.001; Fig. 4).
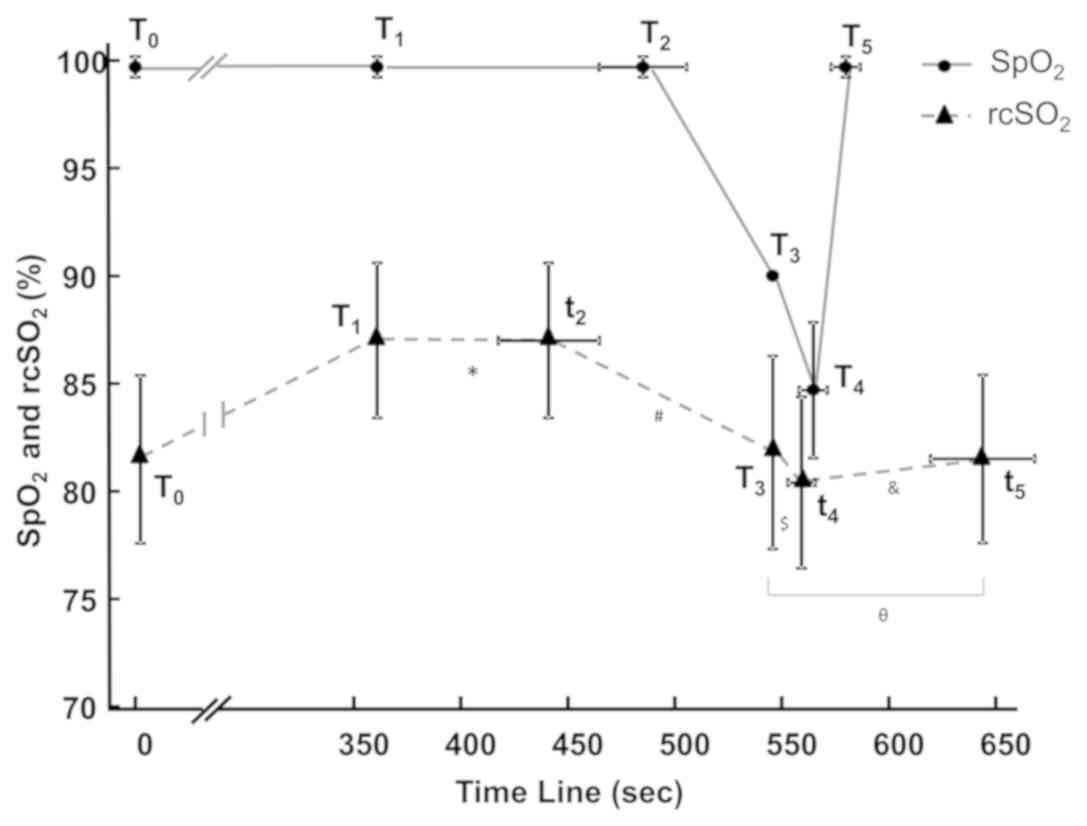 | Figure 4.Dynamic changes of SpO2
and rcSO2 during hypoxia. *P<0.001 vs.
T1/T2, #P<0.001 vs.
T2/T3, $P<0.001 vs.
T3/T4, &P<0.001 vs.
T4/T5, θP<0.001 vs.
T3/T5. SpO2, pulse oxygen
saturation; rcSO2, regional cerebral oxygen saturation
T0, time-point prior to application of any oxygen for
pre-oxygenation; T1, baseline, the time-point at which
mechanical ventilation was stopped; T2, the time-point
at which SpO2 began to drop from baseline;
t2, the time-point at which rcSO2 began to
drop from baseline; T3, the time-point at which
SpO2 decreased to 90% or rcSO2 decreased by
>10% of the baseline and mechanical ventilation was recovered;
T4, the time-point at which SpO2 began to
rise from the minimum value following ventilation; t4,
the time-point at which rcSO2 began to rise from the
minimum value following ventilation; T5, the time-point
at which SpO2 returned to the baseline level,
t5, the time-point at which rcSO2 returned to
the baseline level. |
| Table II.Dynamic changes of SpO2
and rcSO2 at different time-points (n=30). |
Table II.
Dynamic changes of SpO2
and rcSO2 at different time-points (n=30).
| Item | T0 | T1 |
T2/t2 | T3 |
T4/t4 |
T5/t5 |
|---|
| SpO2
(%) | 99.7±0.5 | 99.7±0.5 | 99.7±0.5 | 90±0.0 | 84.7±3.2 | 99.7±0.5 |
| rcSO2
(%) | 81.4±3.9 | 87.0±3.6 | 87.0±3.6 | 81.8±4.5 | 80.4±4.0 | 81.4±3.9 |
| Table III.Comparison of the time difference
between SpO2 and rcSO2 during the response to
hypoxia (sec). |
Table III.
Comparison of the time difference
between SpO2 and rcSO2 during the response to
hypoxia (sec).
| Duration |
SpO2 |
rcSO2 | P-value |
|---|
|
T2/t2-T1 | 124.4±20.5 | 80.2±23.6 | <0.001 |
|
T3-T2/t2 | 60.6±13.7 | 104.8±27.3 | <0.001 |
|
T4/t4-T3 | 18.9±6.5 | 13.4±6.2 | <0.001 |
|
T5/t5-T4/t4 | 15.2±6.8 | 84.8±24.3 | <0.001 |
|
T5/t5-T3 | 34.1±6.8 | 98.2±24.3 | <0.001 |
Discussion
The results of the present study demonstrated that
rcSO2 and SpO2 exhibited similar dynamics in
their changing curve patterns in response to acute apnea (no
ventilation), although rcSO2 decreased earlier and
declined slower than SpO2 during hypoxia. Furthermore,
rcSO2 increased earlier and slower than SpO2
following the recovery of ventilation.
It has been previously suggested that apneic
episodes in infants, which are known to cause an increase in
vascular resistance and a reduction of cerebral blood volume, may
be avoided with a threshold of SpO2 >85% for cerebral
circulation (12). A study performed
by Gupta et al (13) reported
that by increasing the vascular resistance where the threshold of
SpO2 was 90%, hypoxic load reduced the blood circulation
of the middle cerebral artery in normal healthy adults. Therefore,
in the present study, the threshold of SpO2 was set at
90%. It has been reported that a decline of >25% from the
baseline level, or the value of rcSO2 of <40%, may
influence neurologic dysfunction and exhibit adverse outcomes
(14). A reduction to the value of
50% or less or a decrease of 15–20% from the baseline has been used
as a critical threshold for interventions (15,16).
Therefore, in the present study, a 10% reduction of
rcSO2 from the baseline was used as a threshold to
ensure patients' safety.
The present study demonstrated that after pausing
mechanical ventilation (acute apnea), the rcSO2
decreased earlier and declined slower than SpO2. A
previous study revealed that with SpO2 maintained in the
normal range, a decrease of >20% may be observed in cerebral
oxygen saturation (17). Another
study indicated that SpO2 readings were 10–15 sec
delayed compared with rcSO2 readings in neonates
(9). Similar results were also
reported by Tanidir et al (18). In the present study, the decrease of
rcSO2 occurred ~40 sec earlier than that of
SpO2. Tobias (10)
suggested that these changes may be associated with different
‘blood beds’, which are evaluated using monitors. It has been
demonstrated that SpO2 only captures arterial
oxy-hemoglobin saturation and measures saturation in the arterial
bed, but there is a correlation of rcSO2 values with
mixed venous (70%) and arterial (30%) oxygen saturations (3). In contrast to SpO2,
rcSO2 depends on venous blood. The partial pressure of
oxygen would decrease at an approximately equal rate in venous and
arterial ‘blood beds’ during apnea. However, due to the lower
venous partial pressure of oxygen, it would reach the bend of the
oxy-hemoglobin dissociation curve more rapidly. Therefore, a
decrease in the rcSO2 would occur first. During hypoxia,
the decline of rcSO2 reflects a concurrent decrease in
arterial oxy-haemoglobin saturation and a rise in venous
deoxy-hemoglobin saturation (10).
In addition, Rasmussen et al (19) indicated that cerebral NIRS oximetry
responded poorly to changes in tissue oxygenation during
hypotension that was induced by decreased preloading. This may be
due to the increase in the artery-to-vein ratio that occurs
following the decrease in oxygen delivery, which is due to arterial
vasodilation and possibly cerebral venous collapse. This may cause
the arterial part of the NIRS signal to increase, leading to
rcSO2 values decreasing more slowly. During the period
of paused ventilation, the serum carbon dioxide increased and the
blood vessels of the brain became dilated. Venous deoxy-hemoglobin
saturation captured by rcSO2 may explain the early
change in rcSO2. The effect of perfusion on
rcSO2 levels has also been indicated by Schwaberger
et al (20).
After restarting ventilation, rcSO2 was
increased earlier than SpO2, but its increasing rate was
slower, with rcSO2 and SpO2 exhibiting
similar dynamic changing curve patterns. rcSO2 was
increased with a mean delay of 13.4 sec, whereas the increase of
SpO2 featured a significant delay of 18.9 sec. These
results are similar to those of previous studies (9,11). It is
well known that the brain responds to hypoxia through increasing
cerebral blood flow. To maintain adequate oxygen supply in organs
sensitive to hypoxia, including the brain, blood is being
re-distributed (11,21,22).
This may explain for the earlier increase of rcSO2 than
that of SpO2 following the recovery of ventilation, as a
result of the oxygenated blood preferentially being distributed to
the brain. Delayed vasodilatation in the periphery, in comparison
to the cerebral blood, may provide an additional explanation for
the time difference observed between the increase of
rcSO2 and that of SpO2 (11).
Of note, the present study has certain limitations.
First, the sample size of the present study was relatively small.
In addition, the experimental design was relatively simple and the
further mechanism exploration was not included. In conclusion,
during an episode of hypoxia, rcSO2 and SpO2
exhibited similar dynamics in their changing curve patterns, and
rcSO2 was more sensitive compared with peripheral
SpO2.
Acknowledgements
The authors would like to thank Professor Daqing Ma,
expert in Anaesthetics, Pain Medicine and Intensive Care,
Department of Surgery and Cancer, Faculty of Medicine, Imperial
College London and Chelsea and Westminster Hospital (London, UK)
for his critical comments provided throughout the preparation of
the manuscript.
Funding
No funding was received.
Availability of data and materials
The datasets used and/or analyzed during the present
study are available from the corresponding author on reasonable
request.
Authors' contributions
WS and YL contributed to the design of the study and
project administration. YL, CL and MD performed the experiments and
analyzed the data. MC contributed to data analysis. KY performed
the statistical analysis. YL and WS drafted, reviewed and edited
the manuscript. All authors read and approved the final
manuscript.
Ethics approval and consent to
participate
Ethical approval for this study was provided by the
Ethical Committee of The Second Affiliated Hospital and Yuying
Children's Hospital of Wenzhou Medical University (Wenzhou, China;
no. 2016-08 dated 1 March 2016). Signed informed consent was
obtained from the parents and/or guardians. Informed consent was
provided by the parents or legally authorized guardians.
Patient consent for publication
Not applicable.
Competing interests
The authors have no competing interests to
declare.
References
|
1
|
Sinex JE: Pulse oximetry: Principles and
limitations. Am J Emerg Med. 17:59–67. 1999. View Article : Google Scholar : PubMed/NCBI
|
|
2
|
Kenosi M, Naulaers G, Ryan CA and Dempsey
EM: Current research suggests that the future looks brighter for
cerebral oxygenation monitoring in preterm infants. Acta Paediatr.
104:225–231. 2015. View Article : Google Scholar : PubMed/NCBI
|
|
3
|
Jöbsis FF: Noninvasive, infrared
monitoring of cerebral and myocardial oxygen sufficiency and
circulatory parameters. Science. 198:1264–1267. 1977. View Article : Google Scholar : PubMed/NCBI
|
|
4
|
Goldman S, Sutter F, Ferdinand F and Trace
C: Optimizing intraoperative cerebral oxygen delivery using
noninvasive cerebral oximetry decreases the incidence of stroke for
cardiac surgical patients. Heart Surg Forum. 5:E376–E381. 2004.
View Article : Google Scholar
|
|
5
|
Steppan J and Hogue CW Jr: Cerebral and
tissue oximetry. Best Pract Res Clin Anaesthesiol. 28:429–439.
2014. View Article : Google Scholar : PubMed/NCBI
|
|
6
|
Abramo TJ, Zhou C, Estrada C, Meredith M,
Miller R, Pearson M, Tulipan N and Williams A: Innovative
application of cerebral rSO2 monitoring during shunt tap in
pediatric ventricular malfunctioning shunts. Pediatr Emerg Care.
31:479–486. 2015. View Article : Google Scholar : PubMed/NCBI
|
|
7
|
Watanabe T, Ito M, Miyake F, Ogawa R,
Tamura M and Namba F: Measurement of brain tissue oxygen saturation
in term infants using a new portable near-infrared spectroscopy
device. Pediatr Int. 59:167–170. 2017. View Article : Google Scholar : PubMed/NCBI
|
|
8
|
Koch HW and Hansen TG: Perioperative use
of cerebral and renal near-infrared spectroscopy in neonates: A
24-h observational study. Paediatr Anaesth. 26:190–198. 2016.
View Article : Google Scholar : PubMed/NCBI
|
|
9
|
Séguéla PE, Guillet E, Thambo JB and
Mauriat P: Ductal closure and near-infrared spectroscopy for
regional oxygenation monitoring in ductus-dependent congenital
heart disease. Arch Pediatr. 22:857–860. 2015. View Article : Google Scholar : PubMed/NCBI
|
|
10
|
Tobias JD: Cerebral oximetry monitoring
with near infrared spectroscopy detects alterations in oxygenation
before pulse oximetry. J Intensive Care Med. 23:384–388. 2008.
View Article : Google Scholar : PubMed/NCBI
|
|
11
|
Eichhorn L, Erdfelder F, Kessler F,
Doerner J, Thudium MO, Meyer R and Ellerkmann RK: Evaluation of
near-infrared spectroscopy under apnea-dependent hypoxia in humans.
J Clin Monit Comput. 29:749–757. 2015. View Article : Google Scholar : PubMed/NCBI
|
|
12
|
Yamamoto A, Yokoyama N, Yonetani M, Uetani
Y, Nakamura H and Nakao H: Evaluation of change of cerebral
circulation by SpO2 in preterm infants with apneic episodes using
near infrared spectroscopy. Pediatr Int. 45:661–664. 2003.
View Article : Google Scholar : PubMed/NCBI
|
|
13
|
Gupta AK, Menon DK, Czosnyka M, Smielewski
P and Jones JG: Thresholds for hypoxic cerebral vasodilation in
volunteers. Anesth Analg. 85:817–820. 1997. View Article : Google Scholar : PubMed/NCBI
|
|
14
|
Edmonds HL Jr, Ganzel BL and Austin EH
III: Cerebral oximetry for cardiac and vascular surgery. Semin
Cardiothorac Vasc Anesth. 8:147–166. 2004. View Article : Google Scholar : PubMed/NCBI
|
|
15
|
Samra SK, Dy EA, Welch K, Dorje P,
Zelenock GB and Stanley JC: Evaluation of a cerebral oximeter as a
monitor of cerebral ischemia during carotid endarterectomy.
Anesthesiology. 93:964–970. 2000. View Article : Google Scholar : PubMed/NCBI
|
|
16
|
Rigamonti A, Scandroglio M, Minicucci F,
Magrin S, Carozzo A and Casati A: A clinical evaluation of
near-infrared cerebral oximetry in the awake patient to monitor
cerebral perfusion during carotid endarterectomy. J Clin Anesth.
17:426–430. 2005. View Article : Google Scholar : PubMed/NCBI
|
|
17
|
Erdem AF, Kayabasoglu G, Tas Tuna A,
Palabiyik O, Tomak Y and Beyaz SG: Effect of controlled hypotension
on regional cerebral oxygen saturation during rhinoplasty: A
prospective study. J Clin Monit Comput. 30:655–660. 2016.
View Article : Google Scholar : PubMed/NCBI
|
|
18
|
Tanidir IC, Ozturk E, Ozyilmaz I, Saygi M,
Kiplapinar N, Haydin S, Guzeltas A and Odemis E: Near infrared
spectroscopy monitoring in the pediatric cardiac catheterization
laboratory. Artif Organs. 38:838–844. 2014. View Article : Google Scholar : PubMed/NCBI
|
|
19
|
Rasmussen MB, Eriksen VR, Andresen B,
Hyttel-Sørensen S and Greisen G: Quantifying cerebral hypoxia by
near-infrared spectroscopy tissue oximetry: The role of
arterial-to-venous blood volume ratio. J Biomed Opt. 22:250012017.
View Article : Google Scholar : PubMed/NCBI
|
|
20
|
Schwaberger B, Pichler G, Binder C, Avian
A, Pocivalnik M and Urlesberger B: Even mild respiratory distress
alters tissue oxygenation significantly in preterm infants during
neonatal transition. Physiol Meas. 35:2085–2099. 2014. View Article : Google Scholar : PubMed/NCBI
|
|
21
|
Joulia F, Lemaitre F, Fontanari P, Mille
ML and Barthelemy P: Circulatory effects of apnoea in elite
breath-hold divers. Acta Physiol (Oxf). 197:75–82. 2009. View Article : Google Scholar : PubMed/NCBI
|
|
22
|
Lindholm P and Lundgren CE: The physiology
and pathophysiology of human breath-hold diving. J Appl Physiol
(1985). 106:284–292. 2009. View Article : Google Scholar : PubMed/NCBI
|