Introduction
Coronary artery disease (CAD) is a common clinical
cardiovascular disease (1). The
American Heart Association has reported that in 2016 the number of
CAD patients ≥20 years of age had reached 15.5 million and the
incidence increased with age (2). At
present, the pathogenesis of CAD is not completely clear, however
it is certain that hypertension, diabetes, obesity and dyslipidemia
are risk factors for the onset of CAD (3,4). As
people's living standards and dietary habits change, unhealthy
diets lead to an increasing number of obese patients. A study has
shown that visceral obesity patients develop CAD more rapidly and
suffer a higher incidence of acute myocardial infarction (5). In addition, the risk of developing CAD
is not the same for individuals with the same body fat, which is
mainly caused by the different distribution of body fat (6).
Epicardial fat is a kind of adipose tissue, which
promotes remodeling of coronary artery. It has been reported that
the development of CAD is closely related to epicardial fat and its
volume change is an important index for the severity of CAD
(7). At present, the gold standard
for epicardial fat volume detection is magnetic resonance imaging
(MRI), multislice computed tomography (MSCT) and other imaging
methods (8). MRI and MSCT have a
relatively long detection time and high cost, while serological
detection is less expensive and requires shorter time than MRI and
MSCT (9). Therefore, it is critical
to find serum indexes to reflect the changes in the epicardial fat
volume of patients. Adiponectin is a protein secreted by adipocyte,
which can regulate glucose metabolism, improve insulin resistance
and fight atherosclerosis, and is expressed obviously lower in the
serum of CAD patients (10).
Chemerin belongs to the adipocyte-factor family, which has the
function of leukocyte chemotaxis and can promote the development of
inflammatory response in injured tissues by recruiting inflammatory
cells of chemerin receptors (11).
Vascular endothelial growth factor (VEGF) is a vascular endothelial
cell mitogen with high specificity, which plays an important
regulatory role in angiogenesis and is highly expressed in the
serum of CAD patients (12).
However, it is unclear whether adiponectin, chemerin and VEGF can
be adopted as observation indexes for changes in the epicardial fat
volume.
The present study explored the correlation of
adiponectin, chemerin, and VEGF with epicardial fat volume of CAD
patients and its potential clinical value to provide a reference
for clinicians in diagnosis and treatment.
Subjects and methods
Clinical data
A total of 50 CAD patients, treated in Chongzuo
People's Hospital (Chongzuo, China) from August 2017 to September
2018, were enrolled as the observation group, and additional 50
healthy subjects, who underwent physical examination in the
hospital at the same period, were enrolled as the control group.
Subjects in the control group exhibited normal values in all
clinical laboratory detection tests and were without combined
congenital organ dysfunction. This study was conducted with the
approval of the medical Ethics Committee of Chongzuo People's
Hospital. Inclusion criteria: All patients included met the
criteria of the 2012 USA Guideline for the Diagnosis and Management
of Patients With Stable Ischemic Heart Disease (13). The patients and their families
understood the purpose of the study, and an informed consent was
signed. Patients were diagnosed with CAD by imaging and their
clinical data were complete. Exclusion criteria: Patients with
angina pectoris, silent myocardial ischemia, heart failure,
arrhythmia, and sudden death; patients with abnormal thyroid
function, infectious diseases or tumors; patients with recent
trauma or history of surgery; pregnant women; patients with hepatic
and kidney function obstacle.
Reagents and instruments
EasyPure Blood RNA kit, TransScript II Green
Two-Step qRT-PCR SuperMix (both from Beijing TransGen Biotech Co.,
Ltd.; ER101-01 and AQ301-01, respectively), adiponectin, chemerin
and VEGF primers, and related sequences (all designed and
synthesized by Shanghai GenePharma Co., Ltd.), PCR instrument
(Applied Biosystems; Thermo Fisher Scientific, Inc.; ABI 7500) and
64-slice dual-source CT instrument (Siemens AG; SOMATOM Definition
Flash).
Methods
Collection of peripheral blood and
RT-qPCR detection
The study participants fasted from 8 p.m. on the day
before the test. Peripheral venous blood (5 ml) was collected from
both groups in the morning. Following standing for 30 min, the
blood was centrifuged at 1,500 × g, at 25°C for 10 min. The
supernatant was collected for PCR detection, and the total RNA of
the collected serum was extracted using the EasyPure Blood RNA kit.
Total RNA purity, concentration and integrity of the extracted
total RNA were detected via ultraviolet spectrophotometry and
agarose gel electrophoresis. Reverse transcription was performed by
5X TransScript® II All-in-One SuperMix for qPCR and gDNA
Remover kit (both from Beijing TransGen Biotech Co., Ltd.) in
strict accordance with the manufacturer's instructions. The
reaction system consisted of 1 µg of total RNA, 4 µg of 5X
TransScript® II All-in-One SuperMix, 1 µg of gDNA
Remover, and RNase-free Water (added for a total of 20 µl). The
reaction conditions were as follows: Incubation at 50°C for 15 min,
and at 85°C for 5 sec. Then, PCR amplification was carried out. PCR
reaction system: 1 µl of cDNA, 0.4 µl of upstream primers and 0.4
µl of downstream primers, 10 µl of 2X TransScript® Tip
Green qPCR SuperMix, Passive Reference Dye (50X) and Nuclease-free
Water (added for a total volume of 20 µl) (all from Beijing
TransGen Biotech Co., Ltd.). PCR reaction conditions: Initial
denaturation at 94°C for 30 sec, denaturation at 94°C for 5 sec and
annealing and extending at 60°C for 30 sec for a total of 40 cycles
(14). The upstream and downstream
primers of adiponectin were 5′-GCATTCAGTGTGGGATTGGAG-3′ and
5′-AGACTGTGATGTGGTAGGCAAAG-3′, respectively; the upstream and
downstream primers of chemerin were 5′-AAACCCGAGTGCAAAGTCAG-3′ and
5′-CCGCAGAACTTGGGTCTCTAT-3′, respectively; the upstream and
downstream primers of VEGF were 5′-GAAGGTGAAGGTCGGAGTC-3′ and
5′-TGGTTCCCGAAACGCTGAG-3′, respectively, and the upstream and
downstream primers of GAPDH were 5′-GAAGGTGAAGGTCGGAGTC-3′ and
5′-GAAGATGGTGATGGGATTTC-3′, respectively. Three multiple pores were
set for each sample, and the experiment was carried out 3 times.
GAPDH was the internal reference, and 2−ΔΔCq (14) was used to analyze the data.
Epicardial fat volume detection
Participants in both groups were subjected to
64-slice dual-source CT detection, and their epicardial fat volume
was detected by Volumer software (GE Healthcare). Contrast agent
was injected intravenously at 5–10 min before detection, and
nitroglycerin and metoprolol were administered orally to dilate
vessels and control the heart rate. Tissues with −250 to −30 HU in
CT were set as adipose tissues. The cardiac fiber membrane
identifiable from the lower apical edge in the left ventricular at
the origin of the left pulmonary artery of newly transverse sinus
midpoint was selected (namely the cardiac membrane boundary), and
it was selected at intervals of 0.5–1.0 cm layer by layer. Finally
the fat volume was calculated using the Volumer software.
Vascular remodeling detection
Contrast examination was performed on the left and
right coronary arteries of all participants. According to the data
obtained from the 64-slice dual-source CT detection, the vascular
remodeling index of the observation group was calculated: Vascular
remodeling index = (external elastic membranous area at
lesions)/(vascular area at reference site). At vascular remodeling
index ≥1 the patient developed remodeling.
Observation indexes
Main observation indexes: The two groups were
compared in expression of adiponectin, chemerin and VEGF in serum,
and in epicardial fat volume, and the correlation of adiponectin,
chemerin, and VEGF with epicardial fat volume in the observation
group was analyzed. Secondary observation indexes: The two groups
were compared in clinical data, and vascular remodeling of patients
in the observation group was observed and analyzed; risk factors
for vascular remodeling in CAD patients were analyzed, and receiver
operating characteristic (ROC) curve analysis was adopted to
analyze the value of indexes with multivariate significance in
vascular remodeling.
Statistical analysis
Collected data were analyzed by SPSS 20.0 software
(IBM Corp.), relevant graphs were created using GraphPad Prism 7
software (GraphPad Software, Inc.), and the distribution of data
was analyzed using the Kolmogorov-Smirnov test. Enumeration data
were expressed as n (%), and analyzed using Chi-square
(χ2) test. Measurement data were expressed as the mean ±
standard deviation (mean ± SD). Data in normal distribution were
subjected to t-test and were expressed by a t value. Comparisons
between groups were performed using the independent samples t-test.
Multivariate logistic regression was adopted to analyze the risk
factors for vascular remodeling. ROC analysis was adopted to map
the areas under the independent risk factor curves. Pearson's
correlation analysis was used to analyze the correlation of
adiponectin, chemerin, and VEGF with epicardial fat volume in the
observation group. P<0.05 was considered to indicate a
statistically significant difference.
Results
Clinical data analysis
The clinical data of the two groups were collected
for analysis. There was no statistical significance between the two
groups in sex, age, body mass index (BMI), family history of CAD,
smoking history, alcohol abuse history and place of residence (all
P>0.05) (Table I).
 | Table I.Comparison of baseline data between
the two groups [n (%), mean ± SD]. |
Table I.
Comparison of baseline data between
the two groups [n (%), mean ± SD].
| Factors | Observation group
(n=50) | Control group
(n=50) | t/χ2 | P-value |
|---|
| Sex |
|
| 1.099 | 0.295 |
| Male | 35 (70.00) | 30 (60.00) |
|
|
|
Female | 15 (30.00) | 20 (40.00) |
|
|
| Age (years) | 60.1±8.4 | 59.7±9.2 | 0.227 | 0.821 |
| BMI
(kg/m2) | 25.74±2.84 | 24.79±2.25 |
|
|
| Family history of
CAD |
|
| 3.241 | 0.072 |
| Yes | 20 (40.00) | 29 (58.00) |
|
|
| No | 30 (60.00) | 21 (42.00) |
|
|
| Smoking history |
|
| 0.713 | 0.398 |
| Yes | 35 (70.00) | 31 (62.00) |
|
|
| No | 15 (30.00) | 19 (38.00) |
|
|
| Alcohol abuse
history |
|
| 0.749 | 0.102 |
| Yes | 5
(10.00) | 6
(12.00) |
|
|
| No | 45 (90.00) | 44 (88.00) |
|
|
| Place of
residence |
|
| 0.694 | 0.405 |
| City | 30 (60.00) | 34 (68.00) |
|
|
|
Country | 20 (40.00) | 16 (32.00) |
|
|
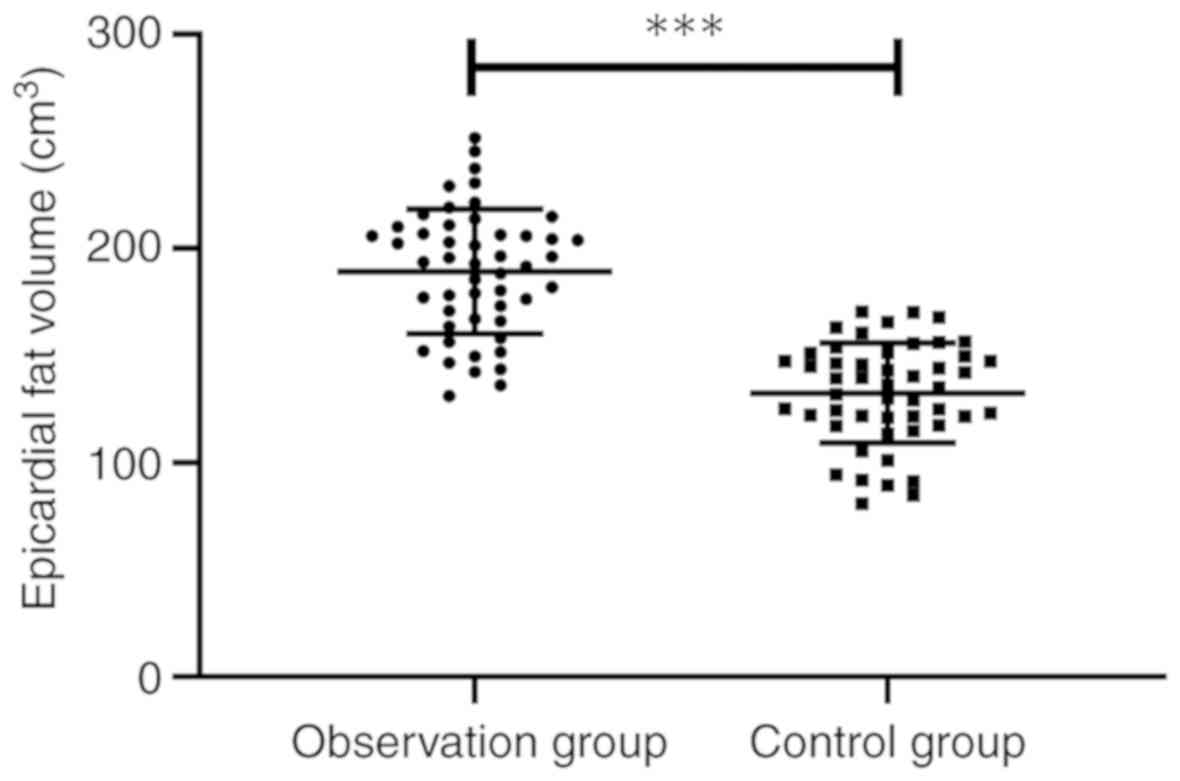
Epicardial fat volume of the two
groups
Epicardial fat volume of the two groups was
detected, and it was found that the observation group showed
obviously larger epicardial fat volume than the control group
(189.22±29.08 vs. 132.48±23.42 cm3) (P<0.001)
(Fig. 1).
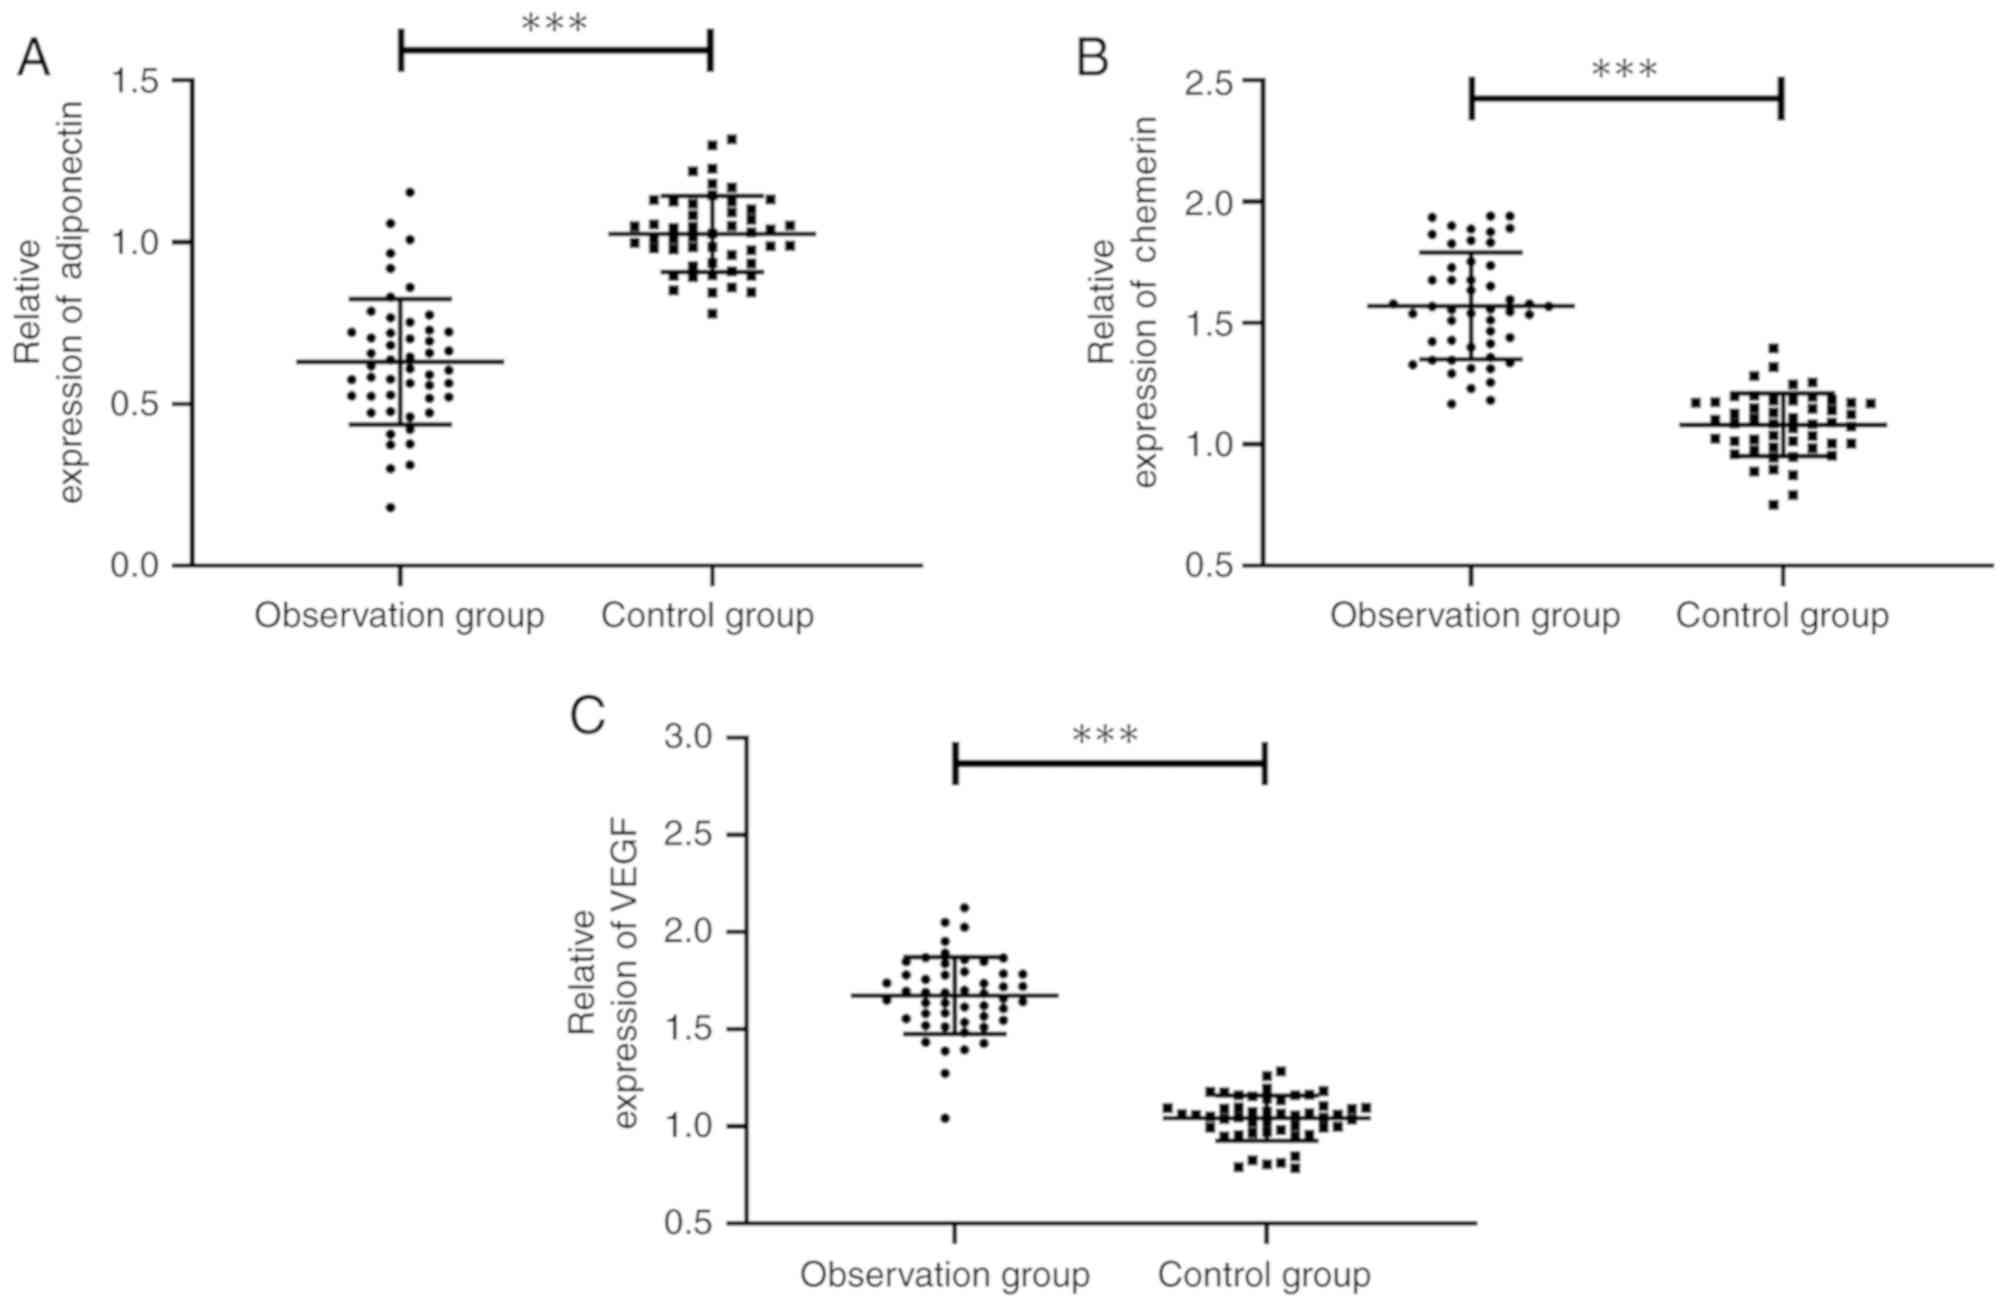
Expression of adiponectin, chemerin
and VEGF in the two groups
The expression of adiponectin, chemerin and VEGF in
the two groups was compared, and it was found that the observation
group showed obviously lower adiponectin expression than the
control group, with a significant difference (P<0.001), and
obviously higher expression of chemerin and VEGF than the control
group, with a significant difference (both P<0.001) (Fig. 2).
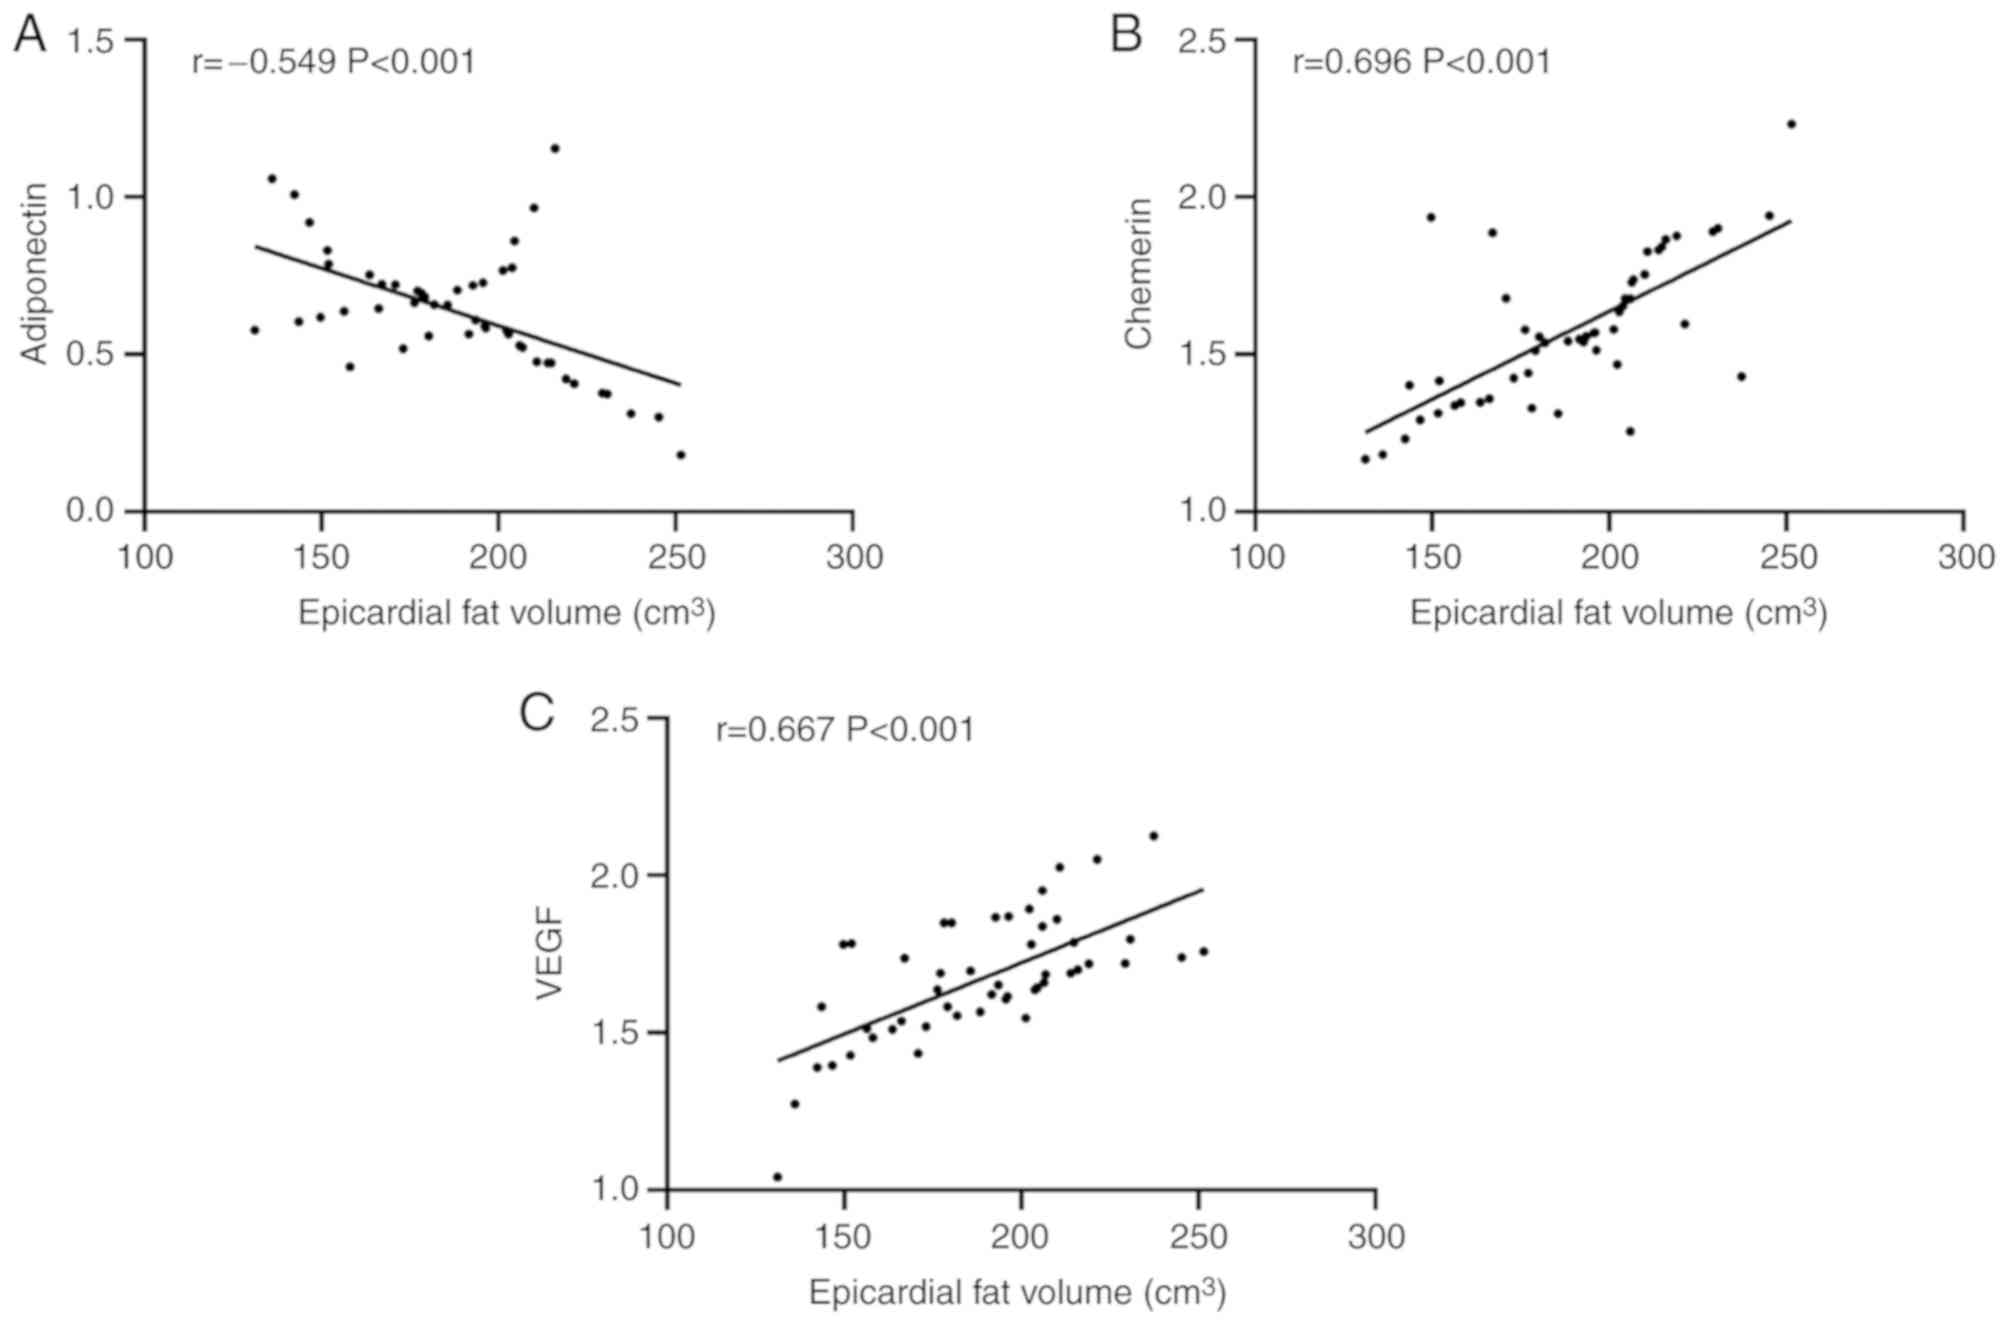
Correlation of adiponectin, chemerin
and VEGF with epicardial fat volume in the observation group
Pearson's correlation analysis showed that in the
observation group, the adiponectin expression gradually decreased
with the increase of epicardial fat volume, presenting a negative
correlation (P<0.001), and the expression levels of chemerin and
VEGF gradually increased with the increase of epicardial fat volume
presenting a positive correlation (both P<0.001) (Fig. 3).
Analysis of risk factors for vascular
remodeling in the observation group
Statistical analysis of vascular remodeling in the
observation group showed that 27 of the 50 patients developed
remodeling, and the patients were divided into a remodeling group
(n=27) and a non-remodeling group (n=23). Clinical data of patients
were collected for univariate analysis, and it was found that
adiponectin, chemerin, VEGF and epicardial fat volume were risk
factors for vascular remodeling (all P<0.05). Subsequently,
remodeling of patients was used as the independent variable and
factors with significance in univariate analysis were taken as
covariate, and assignment was performed. Binary logistic regression
was performed and forward logistic regression was adopted to
analyze the results. It was found that epicardial fat volume (OR:
6.945, 95% CI: 1.385–34.825), adiponectin (OR: 0.124, 95% CI:
0.022–0.689), chemerin (OR: 5.175, 95% CI: 1.079–24.834) and VEGF
(OR: 12.752, 95% CI: 2.146–75.760) were independent risk factors
for vascular remodeling in CAD patients (Tables II–IV).
| Table II.Univariate analysis of risk factors
for vascular remodeling [n (%), mean ± SD]. |
Table II.
Univariate analysis of risk factors
for vascular remodeling [n (%), mean ± SD].
| Factors | Patients in the
remodeling group (n=27) | Patients in the
non-remodeling group (n=23) |
t/χ2 | P-value |
|---|
| Sex |
|
| 0.004 | 0.951 |
|
Male | 19 (70.37) | 16 (69.57) |
|
|
|
Female | 8
(29.63) | 7
(30.43) |
|
|
| Age (years) |
|
| 0.080 | 0.777 |
|
≥60 | 13 (48.15) | 12 (52.17) |
|
|
|
<60 | 14 (51.85) | 11 (47.83) |
|
|
| BMI
(kg/m2) |
|
| 0.415 | 0.520 |
|
≥24 | 22 (81.48) | 17 (73.91) |
|
|
|
<24 | 5
(18.52) | 6
(26.09) |
|
|
| Family history of
CAD |
|
| 0.215 | 0.643 |
|
Yes | 10 (37.04) | 10 (43.48) |
|
|
| No | 17 (62.96) | 13 (56.52) |
|
|
| Smoking
history |
|
| 0.004 | 0.951 |
|
Yes | 19 (76.00) | 16 (69.57) |
|
|
| No | 8
(24.00) | 7
(30.43) |
|
|
| Alcohol abuse
history |
|
| 0.438 | 0.508 |
|
Yes | 2
(7.41) | 3
(13.04) |
|
|
| No | 25 (92.59) | 20 (86.96) |
|
|
| Place of
residence |
|
| 0.483 | 0.487 |
|
City | 15 (55.56) | 15 (65.22) |
|
|
|
Country | 12 (44.44) | 8
(34.78) |
|
|
| Adiponectin |
0.563±0.148 |
0.710±0.214 | 2.858 | 0.006 |
| Chemerin |
1.638±0.240 |
1.504±0.207 | 2.094 | 0.042 |
| VEGF |
1.735±0.161 |
1.601±0.215 | 2.516 | 0.015 |
| Epicardial fat
volume (cm3) | 198.57±27.11 | 178.25±27.95 | 2.604 | 0.012 |
| Table IV.Multivariate analysis. |
Table IV.
Multivariate analysis.
|
|
|
|
|
|
| 95% CI of Exp
(β) |
|---|
|
|
|
|
|
|
|
|
|---|
| Factors | β | S.E | Wals | Sig. | Exp (β) | Lower limit | Upper limit |
|---|
| Adiponectin | −2.089 | 0.876 | 5.692 | 0.017 | 0.124 | 0.022 | 0.689 |
| Chemerin | 1.644 | 0.800 | 4.221 | 0.040 | 5.175 | 1.079 | 24.834 |
| VEGF | 2.546 | 0.909 | 7.840 | 0.005 | 12.752 | 2.146 | 75.760 |
| Epicardial fat
volume | 1.938 | 0.823 | 5.551 | 0.018 | 6.945 | 1.385 | 34.825 |
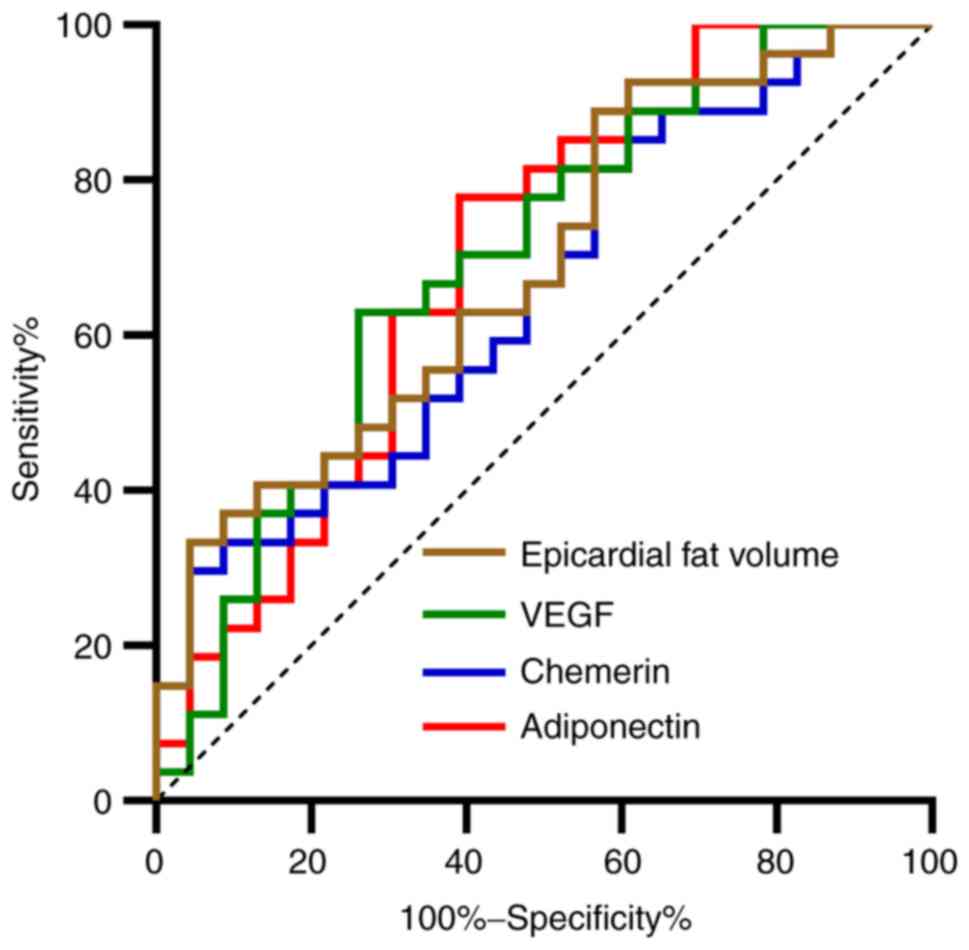
Multivariate ROC curve analysis
A ROC curve was drawn for indexes with
multifactorial significance. It was found that the areas under
adiponectin, chemerin, VEGF and epicardial fat volume curves were
0.697, 0.652, 0.696, and 0.689, respectively (Table V and Fig.
4).
| Table V.ROC parameters. |
Table V.
ROC parameters.
| Factors | Adiponectin | Chemerin | VEGF | Epicardial fat
volume |
|---|
| AUC | 0.697 | 0.652 | 0.696 | 0.689 |
| 95% CI | 0.548–0.846 | 0.500–0.804 | 0.547–0.844 | 0.542–0.836 |
| Sensitivity | 77.78% | 29.63% | 62.96% | 88.88% |
| Specificity | 60.87% | 95.65% | 73.91% | 43.48% |
| Youden index | 38.65% | 25.28% | 36.88% | 32.37% |
| Cut-off value | <0.661 | >1.837 | >1.694 | >168.91 |
Discussion
Epicardial adipose tissue is a relatively unique
visceral adipose tissue between myocardium and pericardium.
According to previous studies, there is a close relationship
between epicardial adipose tissue and vascular remodeling and
atherosclerosis (15), and
epicardial adipose tissue can be adopted as an independent risk
factor for coronary artery stenosis and plaque vulnerability
(16). However, epicardial fat
volume is mainly detected through imaging in clinic, which may
aggregate the burden of patients due to its long imaging time and
high cost. Compared with imaging, serological detection has the
advantages of requiring shorter time and have low cost. Therefore,
it is critical to find serum indexes to reflect changes in the
epicardial fat volume of patients.
The epicardial fat volumes of the observation and
control groups were first detected showing that the observation
group had obviously larger epicardial fat volume than the control
group. Previous studies have shown that epicardial fat accumulates
during the development of CAD, which may cause the release of a
large number of epicardial adipose cell cytokines and inflammatory
factors, promoting calcified plaque in coronary artery, leading
eventually to coronary artery occlusion in patients (17,18).
Therefore, the question is whether adipocyte factors or vascular
factors related to CAD can be detected to determine the epicardial
fat volume of patients. To find the answer, adiponectin, chemerin
and VEGF in the serum of CAD patients were detected. A study
conducted by Eiras and González-Juanatey (19) showed that low adiponectin expression
in CAD patients is expected to be a potential biomarker for CAD,
while a study conducted by Madonna et al (20) and Nakamura et al (21) showed that both chemerin and VEGF have
the effect of promoting blood vessel survival. The present study
detected the expression of adiponectin, chemerin and VEGF in the
serum of the observation group, finding that the expression of
chemerin and VEGF in the serum of the observation group was
significantly higher than those of the control group, while the
expression of adiponectin was significantly lower than that of the
control group, in consistency with previous studies (22,23). The
present study further detected and analyzed the correlation of
adiponectin, chemerin, and VEGF with epicardial fat volume by
performing a Pearson's correlation analysis. The results revealed
that adiponectin expression gradually decreased with the increase
of epicardial fat volume, showing a negative correlation, while the
expression of chemerin and VEGF gradually increased with the
increase of epicardial fat volume, showing a possitive correlation.
This suggests that adiponectin, chemerin, and VEGF could be taken
as potential observation indexes for changes in epicardial fat
volume. The relevant mechanisms of indexes and epicardial fat
volume may be the following: i) Both adiponectin and chemerin can
be produced by epicardial adipose tissue. The accumulation of
epicardial fat in patients after CAD will cause the release of a
large number of inflammatory factors and adipocyte factors,
promoting CAD (24). ii) VEGF is an
angiogenic growth factor. When a body is hypoxic-ischemic, VEGF
expression will significantly increase, which will alleviate
myocardial apoptosis induced by myocardial ischemia by promoting
angiogenesis and collateral circulation; while with the increase of
epicardial fat volume and gradual aggravation of CAD, VEGF
expression in serum increases (25).
Statistics on remodeling of CAD patients was
performed. Vascular remodeling is a morphological change in the
lumen for the change of structure of the patient's vascular wall.
Vascular remodeling can cause endothelial cell proliferation,
inflammatory cell aggregation and increase of atherosclerosis area
(26). Therefore, it is especially
important to explore the risk factors for vascular remodeling. We
conducted multivariate analysis, finding that increase of
epicardial fat volume, chemerin and VEGF and decrease of
adiponectin are independent risk factors for vascular remodeling,
and we mapped ROC curves, finding that each index has a certain
clinical diagnostic value in vascular remodeling.
The present study can preliminarily explain the
correlation between adiponectin, chemerin, VEGF and epicardial fat
volume of CAD patients, and the expression of adiponectin, chemerin
and VEGF can reflect epicardial fat volume in CAD patients.
Epicardial fat volume, adiponectin, chemerin and VEGF can be
adopted as potential observation indexes of vascular remodeling.
However, this study still has certain limitations. ROC curves of
adiponectin, chemerin, and VEGF in CAD patients were not drawn and
expression of adiponectin, chemeri and VEGF in adipose tissue of
CAD patients were not detected. Therefore, further study is still
required.
In summary, epicardial fat volume, adiponectin,
chemerin and VEGF are independent risk factors for vascular
remodeling, and the expression of adiponectin, chemerin and VEGF
can reflect the epicardial fat volume.
Acknowledgements
Not applicable.
Funding
The study was supported by the Foundation of Guangxi
Health Department (nos. Z20170726 and Z20170729) and the Programs
for Science and Technology Development of Chongzuo (no.
FA20170729).
Availability of data and materials
The datasets used and/or analyzed during the present
study are available from the corresponding author on reasonable
request.
Authors' contributions
QW and YC analyzed and interpreted the patient
general data. SC performed PCR. XW and WN were responsible for the
analysis of the observation indicators. QW and YC wrote the
manuscript. All the authors read and approved the final
manuscript.
Ethics approval and consent to
participate
The study was approved by the Ethics Committee of
Chongzuo People's Hospital (Chongzuo, China). Patients who
participated in this research had complete clinical data. Signed
informed consents were obtained from the patients or their
guardians.
Patient consent for publication
Not applicable.
Competing interests
The authors declare that they have no competing
interests.
References
|
1
|
Wong MCS, Zhang DX and Wang HH: Rapid
emergence of atherosclerosis in Asia: A systematic review of
coronary atherosclerotic heart disease epidemiology and
implications for prevention and control strategies. Curr Opin
Lipidol. 26:257–269. 2015. View Article : Google Scholar : PubMed/NCBI
|
|
2
|
Mozaffarian D, Benjamin EJ, Go AS, Arnett
DK, Blaha MJ, Cushman M, Das SR, de Ferranti S, Després JP,
Fullerton HJ, et al Writing Group Members; American Heart
Association Statistics Committee; Stroke Statistics Subcommittee, :
Executive summary: heart disease and stroke statistics-2016 update:
a report from the American Heart Association. Circulation.
133:447–454. 2016. View Article : Google Scholar : PubMed/NCBI
|
|
3
|
Laclaustra M, Casasnovas JA,
Fernández-Ortiz A, Fuster V, León-Latr M, Jiménez-Borreguero LJ,
Pocovi M, Hurtado-Roca Y, Ordovas JM, Jarauta E, et al: Femoral and
carotid subclinical atherosclerosis association with risk factors
and coronary calcium: The AWHS study. J Am Coll Cardiol.
67:1263–1274. 2016. View Article : Google Scholar : PubMed/NCBI
|
|
4
|
Blaha MJ, Cainzos-Achirica M, Greenland P,
McEvoy JW, Blankstein R, Budoff MJ, Dardari Z, Sibley CT, Burke GL,
Kronmal RA, et al: Role of coronary artery calcium score of zero
and other negative risk markers for cardiovascular disease: The
Multi-Ethnic Study of Atherosclerosis (MESA). Circulation.
133:849–858. 2016. View Article : Google Scholar : PubMed/NCBI
|
|
5
|
Piché ME, Poirier P, Lemieux I and Després
JP: Overview of epidemiology and contribution of obesity and body
fat distribution to cardiovascular disease: An update. Prog
Cardiovasc Dis. 61:103–113. 2018. View Article : Google Scholar : PubMed/NCBI
|
|
6
|
Meenakshi K, Rajendran M, Srikumar S and
Chidambaram S: Epicardial fat thickness: A surrogate marker of
coronary artery disease - Assessment by echocardiography. Indian
Heart J. 68:336–341. 2016. View Article : Google Scholar : PubMed/NCBI
|
|
7
|
McKenney-Drake ML, Rodenbeck SD, Bruning
RS, Kole A, Yancey KW, Alloosh M, Sacks HS and Sturek M: Epicardial
adipose tissue removal potentiates outward remodeling and arrests
coronary atherogenesis. Ann Thorac Surg. 103:1622–1630. 2017.
View Article : Google Scholar : PubMed/NCBI
|
|
8
|
Kianoush S, Al Rifai M, Cainzos-Achirica
M, Al-Mallah MH, Tison GH, Yeboah J, Miedema MD, Allison MA, Wong
ND, DeFilippis AP, et al: Thoracic extra-coronary calcification for
the prediction of stroke: The Multi-Ethnic Study of
Atherosclerosis. Atherosclerosis. 267:61–67. 2017. View Article : Google Scholar : PubMed/NCBI
|
|
9
|
Tamada T, Sone T, Higashi H, Jo Y,
Yamamoto A, Kanki A and Ito K: Prostate cancer detection in
patients with total serum prostate-specific antigen levels of 4–10
ng/ml: Diagnostic efficacy of diffusion-weighted imaging, dynamic
contrast-enhanced MRI, and T2-weighted imaging. AJR Am J
Roentgenol. 197:664–670. 2011. View Article : Google Scholar : PubMed/NCBI
|
|
10
|
Moazzami K, Ostovaneh MR, Ambale Venkatesh
B, Habibi M, Yoneyama K, Wu C, Liu K, Pimenta I, Fitzpatrick A,
Shea S, et al: Left ventricular hypertrophy and remodeling and risk
of cognitive impairment and dementia: MESA (Multi-Ethnic Study of
Atherosclerosis). Hypertension. 71:429–436. 2018. View Article : Google Scholar : PubMed/NCBI
|
|
11
|
Kaur J, Mattu HS, Chatha K and Randeva HS:
Chemerin in human cardiovascular disease. Vascul Pharmacol.
110:1–6. 2018. View Article : Google Scholar : PubMed/NCBI
|
|
12
|
Dashkevich A, Hagl C, Beyersdorf F,
Nykänen AI and Lemström KB: VEGF pathways in the lymphatics of
healthy and diseased heart. Microcirculation. 23:5–14. 2016.
View Article : Google Scholar : PubMed/NCBI
|
|
13
|
Fihn SD, Gardin JM, Abrams J, Berra K,
Blankenship JC, Dallas AP, Douglas PS, Foody JM, Gerber TC,
Hinderliter AL, et al: 2012 ACCF/AHA/ACP/AATS/PCNA/SCAI/STS
guideline for the diagnosis and management of patients with stable
ischemic heart disease: executive summary: A report of the American
College of Cardiology Foundation/American Heart Association task
force on practice guidelines, and the American College of
Physicians, American Association for Thoracic Surgery, Preventive
Cardiovascular Nurses Association, Society for Cardiovascular
Angiography and Interventions, and Society of Thoracic Surgeons. J
Am Coll Cardiol. 60:2564–2603. 2012. View Article : Google Scholar : PubMed/NCBI
|
|
14
|
Livak KJ and Schmittgen TD: Analysis of
relative gene expression data using real-time quantitative PCR and
the 2(−ΔΔC(T)) method. Methods. 25:402–408. 2001. View Article : Google Scholar : PubMed/NCBI
|
|
15
|
Nagy E, Jermendy AL, Merkely B and
Maurovich-Horvat P: Clinical importance of epicardial adipose
tissue. Arch Med Sci. 13:864–874. 2017. View Article : Google Scholar : PubMed/NCBI
|
|
16
|
Keresztesi AA, Asofie G, Simion MA and
Jung H: Correlation between epicardial adipose tissue thickness and
the degree of coronary artery atherosclerosis. Turk J Med Sci.
48:40–45. 2018. View Article : Google Scholar : PubMed/NCBI
|
|
17
|
Yamashita K, Yamamoto MH, Igawa W, Ono M,
Kido T, Ebara S, Okabe T, Saito S, Amemiya K, Isomura N, et al:
Association of epicardial adipose tissue volume and total coronary
plaque burden in patients with coronary artery disease. Int Heart
J. 59:1219–1226. 2018. View Article : Google Scholar : PubMed/NCBI
|
|
18
|
Tekin I and Edem E: Association of
epicardial fat tissue with coronary artery disease and left
ventricle diastolic function indicators. Med Sci Monit.
24:6367–6374. 2018. View Article : Google Scholar : PubMed/NCBI
|
|
19
|
Eiras S and González-Juanatey JR:
Adiponectin as biomarker in coronary artery disease. Biomarkers in
Cardiovascular Disease. Biomarkers in Disease: Methods, Discoveries
and Applications. Patel V and Preedy V: Springer; Dordrecht: pp.
635–651. 2016, View Article : Google Scholar
|
|
20
|
Madonna R, Petrov L, Teberino MA, Manzoli
L, Karam JP, Renna FV, Ferdinandy P, Montero-Menei CN,
Ylä-Herttuala S and De Caterina R: Transplantation of adipose
tissue mesenchymal cells conjugated with VEGF-releasing
microcarriers promotes repair in murine myocardial infarction.
Cardiovasc Res. 108:39–49. 2015. View Article : Google Scholar : PubMed/NCBI
|
|
21
|
Nakamura N, Naruse K, Kobayashi Y, Miyabe
M, Saiki T, Enomoto A, Takahashi M and Matsubara T: Chemerin
promotes angiogenesis in vivo. Physiol Rep. 6:e139622018.
View Article : Google Scholar : PubMed/NCBI
|
|
22
|
Lurins J, Lurina D, Tretjakovs P,
Mackevics V, Lejnieks A, Rapisarda V and Baylon V: Increased serum
chemerin level to predict early onset of aortic valve stenosis.
Biomed Rep. 8:31–36. 2018.PubMed/NCBI
|
|
23
|
İnci S, Aksan G and Doğan P: Chemerin as
an independent predictor of cardiovascular event risk. Ther Adv
Endocrinol Metab. 7:57–68. 2016. View Article : Google Scholar : PubMed/NCBI
|
|
24
|
Smekal A and Vaclavik J: Adipokines and
cardiovascular disease: A comprehensive review. Biomed Pap Med Fac
Univ Palacky Olomouc Czech Repub. 161:31–40. 2017. View Article : Google Scholar : PubMed/NCBI
|
|
25
|
Alber HF, Frick M, Dulak J, Dörler J,
Zwick RH, Dichtl W, Pachinger O and Weidinger F: Vascular
endothelial growth factor (VEGF) plasma concentrations in coronary
artery disease. Heart. 91:365–366. 2005. View Article : Google Scholar : PubMed/NCBI
|
|
26
|
Kul S, Karadeniz A, Dursun İ, Şahin S,
Faruk Çırakoğlu Ö, Raşit Sayın M, Turan T and Hakan Ateş A:
Non-alcoholic fatty pancreas disease is associated with increased
epicardial adipose tissue and aortic intima-media thickness. Acta
Cardiol Sin. 35:118–125. 2019.PubMed/NCBI
|