Introduction
Lung cancer is one of the most common tumor types
worldwide and adenocarcinoma is the most common histological
subtype. In 2011, the International Association for the Study of
Lung Cancer, the American Thoracic Society and the European
Respiratory Association proposed a novel international
multidisciplinary classification system for lung adenocarcinoma,
combined with the clinical, radiological, molecular biology and
pathological characteristics of lung adenocarcinoma (1). Lung adenocarcinoma is divided into
pre-invasive lesions (PIL), including atypical adenomatous
hyperplasia (AAH) and adenocarcinoma in situ (AIS), as well
as minimally invasive adenocarcinoma (MIA) and IA. The 5-year
disease-free survival of patients with PIL and MIA is 100% after
receiving segmentectomy of the lungs (2). However, for IA, lobectomy is the major
method and the prognosis is relatively poor (3). Therefore, early detection and
assessment of the invasiveness of lung adenocarcinoma are critical
for the selection of surgical procedure and improving the prognosis
(4).
Traditionally, pre-operative puncture biopsy and CT
image interpretation have been used to judge the degree of
infiltration of pulmonary adenocarcinoma appearing as ground-glass
opacity (GGO) nodules. However, due to limitations of biopsy
materials, it is difficult to accurately judge the invasiveness of
the entire lesion. Using CT imaging, the invasiveness of the lesion
is usually determined based on features including the size of the
lesion, size and proportion of solid components, morphology,
margin, internal features (vacuole sign, thickening of small
vessels) and peripheral features (thoracic model traction and
vascular aggregation). Studies have suggested that more solid
components in GGO indicate more malignant invasion. Lee et
al (5) suggested that the
stretch of the thoracic model, size of the solid component and
proportion of the solid component were all independent factors in
differentiating invasive lung adenocarcinoma. In clinical
application, differences exist in the understanding and recognition
of CT features among radiologists of varying levels and
qualifications. Until the last decade, it has been a challenge to
differentiate the degree of infiltration of pulmonary
adenocarcinoma through visual assessment of morphologic structures
based on CT imaging due to considerable ambiguity between PIL, MIA
and IA (6,7).
A considerable number of lung adenocarcinomas appear
as GGO nodules on CT images. When GGO nodules are small and
represent as AAH or AIS, they grow along the alveolar walls only to
appear as homogeneous GGO nodules (8). However, with the increase in invasive
components in MIA and IA, the tumors may still appear as GGO
nodules but may contain areas of regional voxel heterogeneity
within the tumor. Thus, MIA and IA may still be regarded as a GGO
nodule harboring a small central solid component measuring 5 mm or
less or a pure GGO nodule (9,10).
Therefore, it was hypothesized that texture analysis and improved
CT post-processing technology are feasible and valuable for the
diagnosis, treatment monitoring and prognostic evaluation with
several textural features, including skewness, kurtosis and
entropy. They help detect the physical voxel-level changes within
GGO nodules and may thus be used to distinguish IA from PIL or MIA.
Non-enhanced CT (NECT) images as well as contrast-enhanced CT
(CECT) images may be used for texture analysis. However, to the
best of our knowledge, no previous study has investigated and
confirmed which of the images are better.
Thus, the present study explored the value of
texture analysis in distinguishing IA from PIL/MIA and investigated
whether CT post-processing technology was better with NECT or CECT
imaging.
Materials and methods
Patients
An experienced radiologist (Y.L.) retrospectively
searched for patients between January 2015 and June 2018 including
the time when they were first checked, using the descriptive terms
‘GGO’, ‘GGN’, ‘ground-glass nodule’ and ‘ground-glass opacity’ in
the picture archiving and communication system of the Yangzhou
University Clinical College Subei People’s Hospital (Yangzhou,
China) and 221 patients with 257 GGOs were retrieved. Another
experienced radiologist (J.Y.) reviewed all of the CT scans. The
further selection criteria were as follows: First, they must have
undergone NECT and CECT scans with an interval time of no more than
3 months, and images must have been reconstructed with a thickness
of 1.25 mm. Furthermore, no operation or treatment, including
biopsy, radiotherapy or chemotherapy, was performed prior to CT
examination. Third, GGO nodules measured ≥5 mm and ≤3 cm. In
addition, the GGO nodules had none or little (regular, sharp) solid
component. As an additional criterion, GGO nodules had no
calcification, necrosis or cavitation, but a regular and sharp
border. Furthermore, GGO nodules had no obvious malignant signs,
including spiculation, lobulation, vacuolation, obvious solid
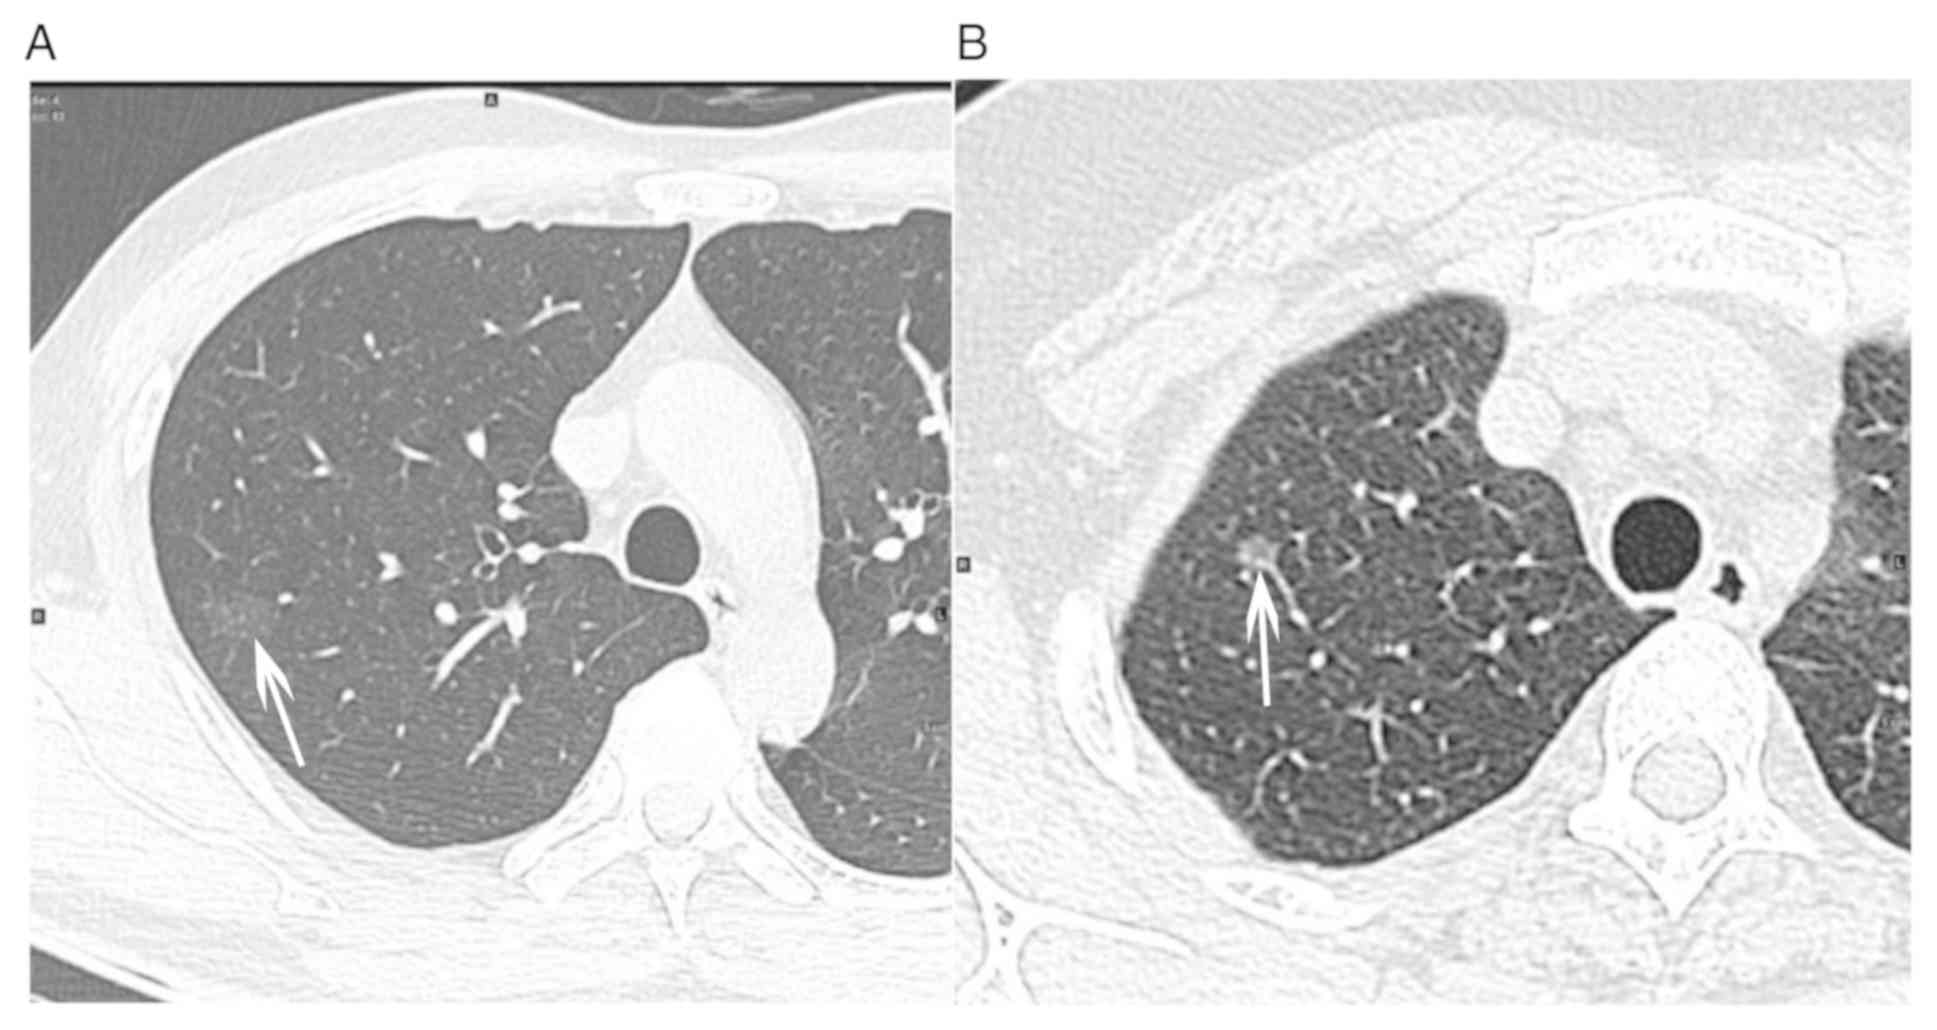
component or irregular shape of solid component (Fig. 1). Finally, the pathological results
following surgery were PIL, MIA or IA. Based on these criteria, 77
GGO nodules in 77 individuals (mean age, 53.40±11.13 years; range,
23-75 years) were selected as the study population. They included
25 males (mean age, 54.88±10.74 years; range, 28-75 years) and 52
females (mean age, 52.69±11.35 years; range, 23-72 years), and the
mean time interval between CECT and NECT was 11 days (range, 0-81
days). Of the 77 GGO nodules, 12 GGO nodules were PIL [12 were pure
GGO (pGGO) nodules], 36 were MIA [9 mixed pure GGP (mGGO) nodules
and 27 were pGGO] and 29 were IA (15 mGGO and 14 pGGO). The patient
characteristics are summarized in Table
I.
 | Table IPatient characteristics (n=77). |
Table I
Patient characteristics (n=77).
| Characteristics | Value |
|---|
| Age (years) | 53.40±11.13
(23-75) |
| Sex
(male/female) | 25/52 |
| Pathologic subtype
(mGGO/pGGO) | |
| Pre-invasive
lesion | 12 (0/12) |
| Minimally invasive
adenocarcinoma lesion | 36 (9/27) |
| Invasive
adenocarcinoma lesion | 29 (15/14) |
CT examination
All enrolled individuals underwent at least one CT
plain scan and one CT contrast-enhanced scan using one of these
three scanners [LightSpeed VCT, GE Medical Systems, Milwaukee;
Discovery CT 750 HD, GE Healthcare; GE Optima CT660(128T)], and the
interval time was no more than 3 months. All CT scans were
performed using the following parameters: 120 kVp, 210 mAsec,
0.984/1.375 pitch, a reconstruction interval of 1.25 mm and a scan
range from apex to the base of the lungs. When more than one CT
plain or contrast-enhanced examination was performed, the two
closest to each other were selected.
Feature extraction
All the thin-section CT images with pulmonary window
(non-enhanced and contrast-enhanced) were transferred and stored as
digital imaging and communications in medicine files. Nodule
segmentation was performed manually. Regions of interest were drawn
around the boundary of GGO nodules and the whole nodule volume was
included. The images were processed using the in-house developed
software coded in MATLAB (version 7.3.0) and the features were
extracted automatically. Subsequently, a three-dimensional nodule
was segmented and various texture features were calculated and
extracted automatically. Analyzed texture features included
histogram features and gray-level co-occurrence matrix (GLCM)
features. Histogram features included mean attenuation, standard
deviation (sd) of attenuation, skewness, kurtosis, CT attenuation
values at the 10, 25, 50, 75 and 90th percentile, energy, entropy,
correlation and uniformity. GLCM features included energy, entropy,
correlation and uniformity.
Statistical analysis
Differences between IA and PIL/MIA were analyzed
using the independent-samples t-test for differences in histograms
and GLCM features for NECT and CECT images. Furthermore,
multivariate regression and receiver operating characteristic (ROC)
analyses were performed to evaluate the performance of all of the
significant parameters obtained using the independent-samples
t-test. Statistical significance was assessed using software (SPSS
version 19.0; IBM Corp.). P<0.05 was considered to indicate a
statistically significant difference.
Results
Comparison of texture features between
IA and PIL/MIA
Significant differences were identified between IA
and PIL/MIA with NECT images in terms of the mean and sd of
attenuation, CT attenuation values at the 10, 25, 50, 75 and 90th
percentile, energy, entropy, correlation and uniformity
(P<0.05), but not for skewness (P=0.11) and kurtosis (P=0.06)
(Table II). With the CECT images,
mean and sd of attenuation, CT attenuation values at the 75 and
90th percentile, energy, entropy and correlation for IA were
significantly different from those for PIL/MIA, but no significant
differences were obtained for skewness (P=0.28), kurtosis (P=0.37),
CT attenuation values at the 10th (P=0.27), 25th (P=0.17) and 50th
percentile (P=0.08), and uniformity (P=0.11; Table II).
| Table IIComparison of texture features between
IA and PIL/MIA with non-enhanced images and contrast-enhanced
images. |
Table II
Comparison of texture features between
IA and PIL/MIA with non-enhanced images and contrast-enhanced
images.
| A, Non-enhanced
CT |
|---|
| Characteristics | IA | MIA or PIL | t | P-value |
|---|
| Histogram
analysis |
|
Mean
(HU) | -147.49±135.86 | -564.56±127.55 | -3.03 | 0.003 |
|
Sd (HU) | 200.38±42.38 | 167.85±44.30 | -3.17 | 0.002 |
|
Skewness | 0.51±0.54 | 0.72±0.55 | 1.63 | 0.108 |
|
Kurtosis | 0.71±1.22 | 1.43±1.97 | 1.96 | 0.053 |
|
10th
percentile (HU) | -708.35±99.69 | -757.37±91.89 | -2.20 | 0.031 |
|
25th
percentile (HU) | -609.34±125.48 | -680.44±106.20 | -2.66 | 0.010 |
|
50th
percentile (HU) | -491.24±149.18 | -581.00±134.13 | -2.73 | 0.008 |
|
75th
percentile (HU) | -351.65±163.59 | -470.46±157.30 | -3.16 | 0.002 |
|
90th
percentile (HU) | -202.75±172.55 | -346.26±181.87 | -3.42 | 0.001 |
| GLCM |
|
Energy | 0.009±0.02 | 0.012±0.03 | 5.64 | <0.001 |
|
Entropy | 7.10±0.20 | 6.69±0.35 | -6.50 | <0.001 |
|
Correlation
(x104) | 3.40±1.20 | 2.60±1.10 | -2.71 | 0.008 |
|
Uniformity | 1.49±0.23 | 1.33±0.18 | -3.21 | 0.002 |
| B,
Contrast-enhanced CT |
|
Characteristics | IA | MIA or PIL | t | P-value |
| Histogram
analysis |
|
Mean
(HU) | -459.26±134.12 | -524.40±140.46 | -2.01 | 0.049 |
|
Sd (HU) | 202.71±54.29 | 171.28±55.21 | -2.43 | 0.017 |
|
Skewness | 0.63±0.54 | 0.77±0.51 | 1.08 | 0.282 |
|
Kurtosis | 1.12±1.69 | 1.45±1.50 | 0.90 | 0.372 |
|
10th
percentile (HU) | -692.91±118.39 | -721.70±104.50 | -1.11 | 0.269 |
|
25th
percentile (HU) | -597.91±134.46 | -639.12±123.52 | -1.37 | 0.174 |
|
50th
percentile (HU) | -482.79±142.57 | -543.04±145.20 | -1.78 | 0.080 |
|
75th
percentile (HU) | -344.76±152.45 | -432.63±169.24 | -2.29 | 0.025 |
|
90th
percentile (HU) | -186.10±170.60 | -303.80±197.34 | -2.67 | 0.009 |
| GLCM |
|
Energy | 0.10±0.002 | 0.12±0.003 | 3.82 | <0.001 |
|
Entropy | 7.00±0.21 | 6.69±0.002 | -4.60 | <0.001 |
|
Correlation
(x104) | 3.50±0.90 | 2.70±1.20 | -3.11 | 0.002 |
|
Uniformity | 1.50±0.23 | 1.37±0.31 | -1.61 | 0.113 |
Multivariate logistic regression and
ROC curve analyses
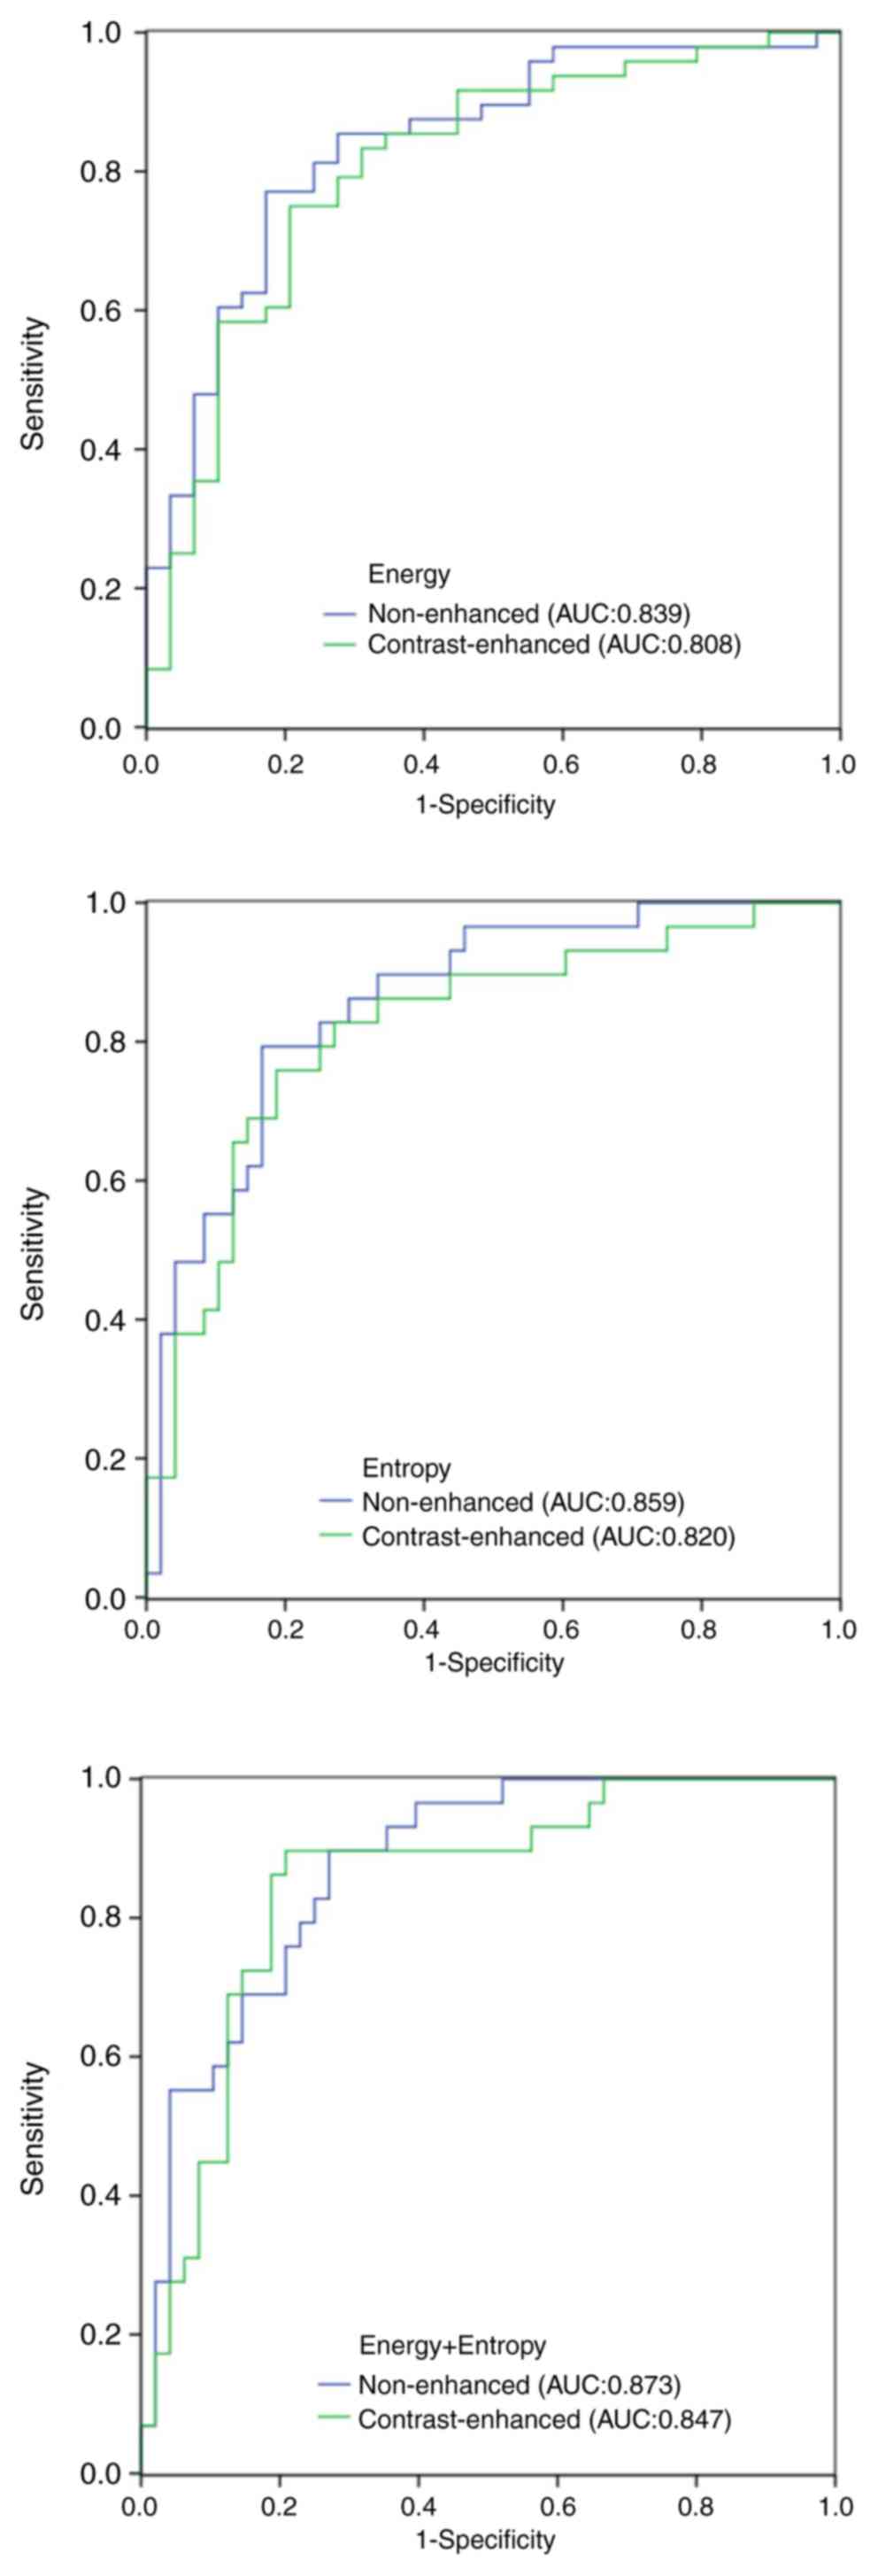
In the ROC curve analysis, the area under the curve
(AUC) values of all the significant parameters were obtained. For
the NECT images, the AUC of the mean and Sd of attenuation, CT
attenuation values at the 10, 25, 50, 75 and 90th percentile,
energy, entropy, correlation and uniformity was 0.708, 0.700,
0.656, 0.668, 0.682, 0.716, 0.734, 0.839, 0.859, 0.667 and 0.726,
respectively. For the CECT images, the AUC of the mean and sd of
attenuation, CT attenuation values at the 75 and 90th percentile,
energy, entropy and correlation was 0.649, 0.660, 0.675, 0.693,
0.808, 0.820 and 0.711, respectively (Table III). In the ROC analysis, when
energy and entropy were used as input data at the same time, the
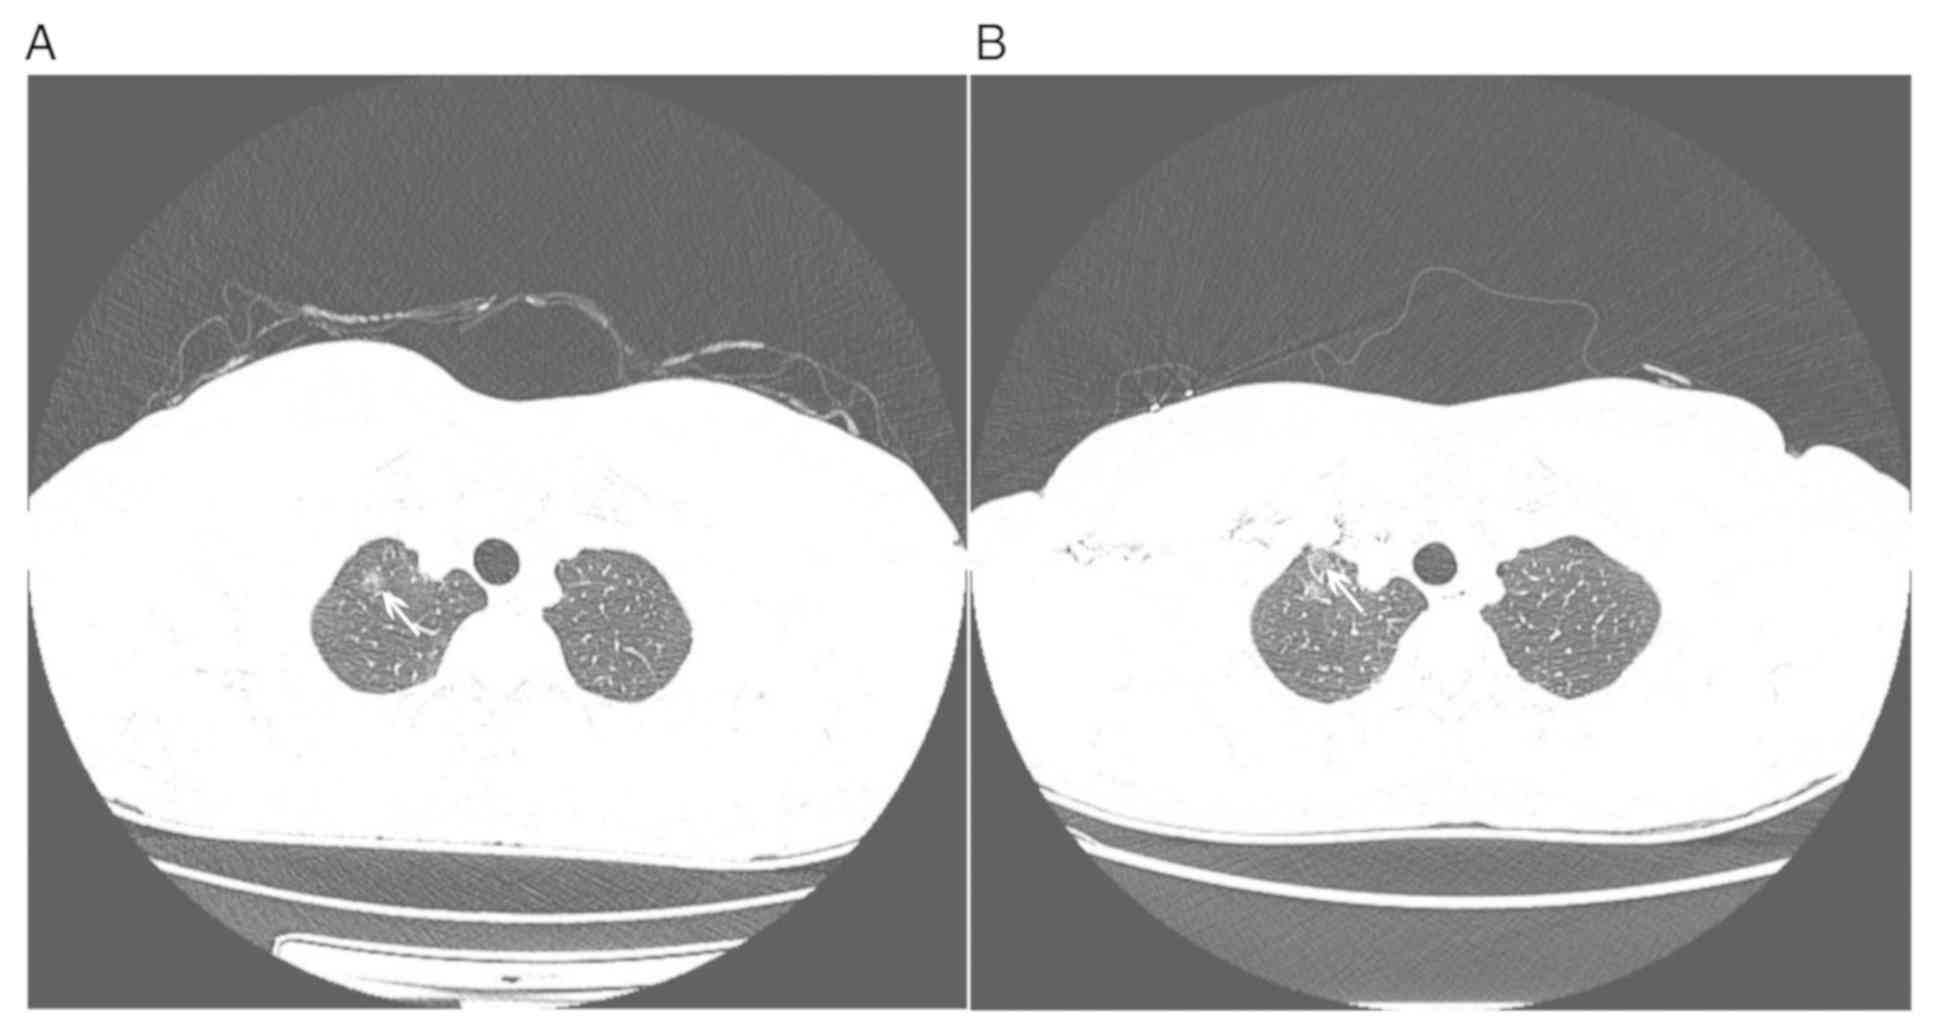
AUC was 0.873 with NECT images and 0.847 with CECT images (Fig. 2). On CECT images, the display of a
small part of GGOs near the axillary vein, subclavian vein or
superior vena cava may have been interfered due to beam hardening
artifacts (Fig. 3).
| Table IIIResults of receiver operating
characteristic curve analysis for differentiating between IA and
PIL/MIA with non-enhanced and contrast-enhanced CT images. |
Table III
Results of receiver operating
characteristic curve analysis for differentiating between IA and
PIL/MIA with non-enhanced and contrast-enhanced CT images.
| A, Non-enhanced
CT |
|---|
| Feature | AUC | Cutoff value | Sensitivity
(%) | Specificity
(%) |
|---|
| Mean (HU) | 0.708 | -612.55 | 89.7 | 50.0 |
| Sd (HU) | 0.700 | 161.17 | 86.2 | 47.9 |
| 10th percentile
(HU) | 0.656 | -762.73 | 72.4 | 46.2 |
| 25th percentile
(HU) | 0.668 | -670.67 | 69.0 | 66.7 |
| 50th percentile
(HU) | 0.682 | -535.53 | 69.0 | 66.7 |
| 75th percentile
(HU) | 0.716 | -520.38 | 86.2 | 56.2 |
| 90th percentile
(HU) | 0.734 | -508.67 | 82.8 | 59.2 |
| Energy | 0.839 | 0.009342 | 85.4 | 72.4 |
| Entropy | 0.859 | 6.87 | 89.7 | 66.7 |
| Correlation | 0.667 | 0.0002182 | 96.6 | 42.7 |
| Uniformity | 0.726 | 1.33 | 79.3 | 60.4 |
| B,
Contrast-enhanced CT |
| Feature | AUC | Cutoff value | Sensitivity
(%) | Specificity
(%) |
| Mean (HU) | 0.649 | -527.84 | 72.4 | 62.5 |
| Sd (HU) | 0.660 | 179.19 | 72.4 | 58.3 |
| 75th percentile
(HU) | 0.675 | -406.85 | 72.4 | 66.7 |
| 90th percentile
(HU) | 0.693 | -256.01 | 72.4 | 66.7 |
| Energy | 0.808 | 0.10 | 75.0 | 79.3 |
| Entropy | 0.820 | 6.85 | 82.8 | 72.9 |
| Correlation | 0.711 | 0.0002943 | 79.3 | 60.4 |
Discussion
The present study characterized GGO nodules using
NECT and CECT texture analyses. Each of the two methods had the
ability to differentiate IA from PIL/MIA. Pulmonary adenocarcinomas
displaying as GGO nodules are heterogeneous at the genetic and
histopathological level. Heterogeneity is a recognized feature of
malignancy, reflecting areas of high cell density, necrosis,
hemorrhage and myxoid change (11).
Texture analysis is an important method of medical image processing
that quantifies the information obtained from standard images by
detecting the distribution and association of subtle pixel or voxel
gray levels in the images, thus extracting numerous quantitative
parameters associated with tissue heterogeneity (12).
In the present study, all PIL presented as pGGO
nodules, certain MIA and IA presented as pGGO nodules and others
presented as mGGO nodules. The present results were similar to
those of Lee et al (13), in
which most mGGOs were MIA or IA, whilst pGGOs included a variety of
pathological types: A total of 20 out of 25 (80%) AIS, as did one
pleomorphic carcinoma and one AAH. Several studies indicated that
GGO nodules with spiculation, lobulation, or vacuolation sign are
suggestive of IA (14,15). GGO nodules containing solid
components or irregular morphology of solid components accurately
suggested IA. To better solve practical clinical problems, cases
with obvious signs of malignancy, including speculation,
lobulation, vacuolation, obvious solid component or irregular shape
of the solid component, were removed. Eventually, patients with
pGGO or mGGO nodules containing small amounts and regular
morphology of solid components were enrolled in the present
study.
Numerous studies have confirmed the application of
texture analysis in diagnosing pulmonary nodules. Lee et al
(16) demonstrated that the texture
analysis of par-solid GGO nodules has the potential to improve the
differentiation of transient from persistent par-solid GGO nodules
when used in addition to the clinical and CT feature analysis. In
the ROC analysis, when clinical and CT features were used as input
data, the AUC was 0.79, and when CT texture analysis features was
used as input data, the AUC was 0.81. However, when the features of
clinical, CT imaging and CT texture analysis were used as input
data, the AUC was calculated to be 0.93. A total of three studies
performed a texture analysis of CT imaging to help distinguish the
infiltration degree of pulmonary adenocarcinoma appearing as GGO
nodules with no or little solid component (17,18),
which were consistent with the present study. Li et al
(19) divided the samples into three
groups, namely PIL, MIA and IA. Son et al (17) and Chae et al (18) divided the samples into two groups,
namely PIL/MIA and IA, as in the present study. The 5-year
disease-free survival rate of patients with PIL and MIA is 100%
after receiving segmentectomy of the lungs (2,3).
However, for IA, lobectomy is the major method and the prognosis is
relatively poor (2,3). Therefore, early distinction of IA from
PIL or MIA is critical for the selection of the surgical procedure
and improvement of prognosis. Therefore, stratification into two
groups not only makes the experimental design simple, but also is
able to better solve practical clinical problems. The three studies
used NECT images for texture analysis, while certain other studies
on pulmonary nodules used CECT images (20,21).
However, none of them clearly explained why the NECT or CECT images
were chosen. The present study investigated and compared the value
of NECT and CECT texture analysis in differentiating IA from
PIL/MIA. Son et al (17)
concluded that the 75th percentile CT attenuation and entropy were
significant independent factors to predict IA. Chae et al
(18) concluded that the mass and
kurtosis were significant independent factors to predict IA.
In the present study, a total of 13 texture analysis
parameters were selected. Of these, 11 parameters exhibited a
statistically significant difference with NECT images between IA
and MIA/PIL, whilst smaller energy and higher entropy were
significant differentiators of IA from MIA/PIL. Furthermore, 8
parameters exhibited a statistically significant difference with
CECT images between IA and MIA/PIL and similarly, the smaller
energy and higher entropy were significant differentiators of IA
from MIA/PIL. Several studies have suggested that a higher entropy
is associated with malignancy in lung cancer (17,20),
liver cirrhosis (22) and adnexal
neoplasms (23,24). Entropy is the characteristic
parameter to measure the randomness of the gray-level distribution,
which represents the complexity of the image texture. A more
complex the image texture is associated with a higher entropy value
(25). Energy reflects the
uniformity of gray distribution and coarseness of texture. The more
uniform the image, the higher the energy. Increased infiltration of
lung adenocarcinoma is accompanied by changes in cell permeability,
abnormal angiogenesis, viscous liquefaction and necrosis, leading
to heterogeneity of the tumor. Therefore, IA is characterized by
mixed and heterogeneous components in pathology; it cannot be
accurately distinguished by intuitive CT image features, but it may
be detected and quantified by texture analysis. The present study
indicated that the energy of IA was smaller than that of PIL/MIA
and the entropy of IA was larger than that of PIL/MIA. Furthermore,
it indicated that the gray distribution of IA was relatively
heterogeneous, while the gray distribution of PIL/MIA was more
uniform.
It was initially assumed that skewness or kurtosis
may help differentiate IA from PIL/MIA, as indicated in numerous
previous studies (15,19,26,27).
However, the present results did not confirm this, as no
significant difference was obtained. It was presumed that the
variation of the histogram graphs of IA, PIL and MIA is too high to
provide a distinction between them.
Several studies confirmed the use of the whole
nodule, segmented slice-by-slice imaging of the lesion on
thin-section CT images until the entire GGO had been covered
instead of using the largest diameter of the GGO to extract
features (25,28,29),
despite the use of the largest diameter of the GGO being more
time-efficient. In addition, the selection of the largest diameter
of the GGO may vary among different radiologists. Therefore, in the
present study, the three-dimensional imaging of lesions was
extracted for texture analysis.
In the present study, more parameters from NECT
images exhibited statistically significant differences between IA
and PIL/MIA compared with those from CECT images. The diagnostic
efficiency of energy and entropy from NECT images were slightly
higher than those from CECT images, although they had an excellent
performance. The reasons may be as follows: First, CECT images
obtained with the use of iodine contrast agent provided insight
into lesion heterogeneity predominantly linked to the presence of
areas with different vascularization. However, texture analysis may
reflect cellular distribution on NECT images. Furthermore, on CECT
scanning, a high concentration of iodine contrast media in the
axillary vein, subclavian vein and superior vena cava may produce
an obvious beam hardening artifact and may interfere with the
display of GGO lesions that happen to be nearby. However, CECT
imaging has an essential role in the diagnosis of GGO nodules. It
may provide the blood supply of the lesion and judge whether the
pulmonary vessels are invaded. Therefore, for GGO nodules, CECT
scanning is necessary when deciding to perform surgical resection.
In the process of regular review and comparative observation of
GGO, NECT imaging may be the major method. On this basis, NECT
images were simpler to obtain and no contrast agent was required.
Thus, for CT texture analysis only, NECT texture analysis may be a
better choice.
The present study had certain limitations. First, it
had a retrospective design, leading to potential selection bias.
Furthermore, the sample size was relatively small. In addition, the
CT examinations were not performed with the same CT machine, but
three different machines, resulting in variability of the CT value
and, to a certain extent, affecting the accuracy of the texture
analysis. As another limitation, the boundary of GGO nodules was
manually segmented by the radiologist and may have been influenced
by the subjective trend or bias of the observer, particularly for
GGO nodules with a fuzzy boundary. Finally, in addition to
pulmonary adenocarcinoma, benign lesions, including focal
inflammation, edema or hemorrhage, may also display as GGO. The
present study only included GGO confirmed as pulmonary
adenocarcinoma. Therefore, a more extensive study will be the next
research focus.
In conclusion, lower energy and higher entropy are
significant differentiators of IA from PIA/MIA in pulmonary
adenocarcinoma displaying as GGO nodules. NECT and CECT texture
analyses have the potential to differentiate IA from PIA/MIA;
however, for texture analysis only, NECT texture analysis may be a
preferred choice.
Acknowledgements
Not applicable.
Funding
The present study was supported by funding from
Subei People's Hospital (grant no. yzucms201804; Yangzhou,
China).
Availability of data and materials
The datasets used and/or analyzed during the present
study are available from the corresponding author on reasonable
request.
Authors' contributions
JY and YL were involved in the conception, design,
definition of intellectual content, literature search, data
acquisition, data analysis and manuscript preparation. JL and JHC
provided assistance with data acquisition, data analysis and
statistical analysis. JC and MC performed the literature search,
data acquisition and manuscript editing. All authors read and
approved the content of the manuscript.
Ethics approval and consent to
participate
The present retrospective study was approved by the
institutional review board of Yangzhou University Clinical College
Subei People's Hospital (approval no. 2018KY-029; Yangzhou. China)
with a waiver of informed consent.
Patient consent for publication
Not applicable.
Competing interests
All authors declare that they have no competing
interests.
References
|
1
|
Travis WD, Brambilla E, Noguchi M,
Nicholson AG, Geisinger KR, Yatabe Y, Beer DG, Powell CA, Riely GJ,
Van Schil PE, et al: International association for the study of
lung cancer/american thoracic society/european respiratory society
international multidisciplinary classification of lung
adenocarcinoma. J Thorac Oncol. 6:244–285. 2011.PubMed/NCBI View Article : Google Scholar
|
|
2
|
Borczuk AC, Qian F, Kazeros A, Eleazar J,
Assaad A, Sonett JR, Ginsburg M, Gorenstein L and Powell CA:
Invasive size is an independent predictor of survival in pulmonary
adenocarcinoma. Am J Surg Pathol. 33:462–469. 2009.PubMed/NCBI View Article : Google Scholar
|
|
3
|
Zhang J, Wu J, Tan Q, Zhu L and Gao W: Why
do pathological stage IA lung adenocarcinomas vary from prognosis?:
A clinicopathologic study of 176 patients with pathological stage
IA lung adenocarcinoma based on the IASLC/ATS/ERS classification. J
Thorac Oncol. 8:1196–1202. 2013.PubMed/NCBI View Article : Google Scholar
|
|
4
|
Kim HY, Shim YM, Lee KS, Han J, Yi CA and
Kim YK: Persistent pulmonary nodular ground-glass opacity at
thin-section CT: Histopathologic comparisons. Radiology.
245:267–275. 2007.PubMed/NCBI View Article : Google Scholar
|
|
5
|
Lee SM, Park CM, Goo JM, Lee HJ, Wi JY and
Kang CH: Invasive pulmonary adenocarcinomas versus preinvasive
lesions appearing as ground-glass nodules: Differentiation by using
CT features. Radiology. 268:265–273. 2013.PubMed/NCBI View Article : Google Scholar
|
|
6
|
Lee HJ, Goo JM, Lee CH, Yoo CG, Kim YT and
Im JG: Nodular ground-glass opacities on thin-section CT: Size
change during follow-up and pathological results. Korean J Radiol.
8:22–31. 2007.PubMed/NCBI View Article : Google Scholar
|
|
7
|
Park CM, Goo JM, Lee HJ, Lee CH, Chun EJ
and Im JG: Nodular ground-glass opacity at thin-section CT:
Histologic correlation and evaluation of change at follow-up.
Radiographics. 27:391–408. 2007.PubMed/NCBI View Article : Google Scholar
|
|
8
|
Lee HY and Lee KS: Ground-glass opacity
nodules: Histopathology, imaging evaluation, and clinical
implications. J Thorac Imaging. 26:106–118. 2011.PubMed/NCBI View Article : Google Scholar
|
|
9
|
Travis WD, Garg K, Franklin WA, Wistuba
II, Sabloff B, Noguchi M, Kakinuma R, Zakowski M, Ginsberg M,
Padera R, et al: Evolving concepts in the pathology and computed
tomography imaging of lung adenocarcinoma and bronchioloalveolar
carcinoma. J Clin Oncol. 23:3279–3287. 2005.PubMed/NCBI View Article : Google Scholar
|
|
10
|
Lim HJ, Ahn S, Lee KS, Han J, Shim YM, Woo
S, Kim JH, Yie M, Lee HY and Yi CA: Persistent pure ground-glass
opacity lung nodules ≥ 10 mm in diameter at CT scan:
Histopathologic comparisons and prognostic implications. Chest.
144:1291–1299. 2013.PubMed/NCBI View Article : Google Scholar
|
|
11
|
Nelson DA, Tan TT, Rabson AB, Anderson D,
Degenhardt K and White E: Hypoxia and defective apoptosis drive
genomic instability and tumorigenesis. Genes Dev. 18:2095–2107.
2004.PubMed/NCBI View Article : Google Scholar
|
|
12
|
Ganeshan B and Miles KA: Quantifying
tumour heterogeneity with CT. Cancer Imaging. 13:140–149.
2013.PubMed/NCBI View Article : Google Scholar
|
|
13
|
Lee SW, Leem CS, Kim TJ, Lee KW, Chung JH,
Jheon S, Lee JH and Lee CT: The long-term course of ground-glass
opacities detected on thin-section computed tomography. Respir Med.
107:904–910. 2013.PubMed/NCBI View Article : Google Scholar
|
|
14
|
Lee HJ, Goo JM, Lee CH, Park CM, Kim KG,
Park EA and Lee HY: Predictive CT findings of malignancy in
ground-glass nodules on thin-section chest CT: The effects on
radiologist performance. Eur Radiol. 19:552–560. 2009.PubMed/NCBI View Article : Google Scholar
|
|
15
|
Aoki T, Tomoda Y, Watanabe H, Nakata H,
Kasai T, Hashimoto H, Kodate M, Osaki T and Yasumoto K: Peripheral
lung adenocarcinoma: Correlation of thin-section CT findings with
histologic prognostic factors and survival. Radiology. 220:803–809.
2001.PubMed/NCBI View Article : Google Scholar
|
|
16
|
Lee SH, Lee SM, Goo JM, Kim KG, Kim YJ and
Park CM: Usefulness of texture analysis in differentiating
transient from persistent part-solid nodules(PSNs): A retrospective
study. PLoS One. 9(e85167)2014.PubMed/NCBI View Article : Google Scholar
|
|
17
|
Son JY, Lee HY, Lee KS, Kim JH, Han J,
Jeong JY, Kwon OJ and Shim YM: Quantitative CT analysis of
pulmonary ground-glass opacity nodules for the distinction of
invasive adenocarcinoma from pre-invasive or minimally invasive
adenocarcinoma. PLoS One. 9(e104066)2014.PubMed/NCBI View Article : Google Scholar
|
|
18
|
Chae HD, Park CM, Park SJ, Lee SM, Kim KG
and Goo JM: Computerized texture analysis of persistent part-solid
ground-glass nodules: Differentiation of preinvasive lesions from
invasive pulmonary adenocarcinomas. Radiology. 273:285–293.
2014.PubMed/NCBI View Article : Google Scholar
|
|
19
|
Li W, Wang X, Zhang Y, Li X, Li Q and Ye
Z: Radiomic analysis of pulmonary ground-glass opacity nodules for
distinction of preinvasive lesions, invasive pulmonary
adenocarcinoma and minimally invasive adenocarcinoma based on
quantitative texture analysis of CT. Chin J Cancer Res. 30:415–424.
2018.PubMed/NCBI View Article : Google Scholar
|
|
20
|
Liu Y, Liu S, Qu F, Li Q, Cheng R and Ye
Z: Tumor heterogeneity assessed by texture analysis on
contrast-enhanced CT in lung adenocarcinoma: Association with
pathologic grade. Oncotarget. 8:53664–53674. 2017.PubMed/NCBI View Article : Google Scholar
|
|
21
|
Suo S, Cheng J, Cao M, Lu Q, Yin Y, Xu J
and Wu H: Assessment of heterogeneity difference between edge and
core by using texture analysis: Differentiation of malignant from
inflammatory pulmonary nodules and masses. Acad Radiol.
23:1115–1122. 2016.PubMed/NCBI View Article : Google Scholar
|
|
22
|
Fujimoto K, Tonan T, Azuma S, Kage M,
Nakashima O, Johkoh T, Hayabuchi N, Okuda K, Kawaguchi T, Sata M
and Qayyum A: Evaluation of the mean and entropy of apparent
diffusion coefficient values in chronic hepatitis C: Correlation
with pathologic fibrosis stage and inflammatory activity grade.
Radiology. 258:739–748. 2011.PubMed/NCBI View Article : Google Scholar
|
|
23
|
Kierans AS, Bennett GL, Mussi TC, Babb JS,
Rusinek H, Melamed J and Rosenkrantz AB: Characterization of
malignancy of adnexal lesions using ADC entropy: Comparison with
mean ADC and qualitative DWI assessment. J Magn Reson Imaging.
37:164–171. 2013.PubMed/NCBI View Article : Google Scholar
|
|
24
|
Cao MQ, Suo ST, Zhang XB, Zhong YC, Zhuang
ZG, Cheng JJ, Chi JC and Xu JR: Entropy of T2-weighted imaging
combined with apparent diffusion coefficient in prediction of
uterine leiomyoma volume response after uterine artery
embolization. Acad Radiol. 21:437–444. 2014.PubMed/NCBI View Article : Google Scholar
|
|
25
|
Ganeshan B, Miles KA, Young RC and Chatwin
CR: Hepatic entropy and uniformity: Additional parameters that can
potentially increase the effectiveness of contrast enhancement
during abdominal CT. Clin Radiol. 62:761–768. 2007.PubMed/NCBI View Article : Google Scholar
|
|
26
|
Chandarana H, Rosenkrantz AB, Mussi TC,
Kim S, Ahmad AA, Raj SD, McMenamy J, Melamed J, Babb JS, Kiefer B
and Kiraly AP: Histogram analysis of whole-lesion enhancement in
differentiating clear cell from papillary subtype of renal cell
cancer. Radiology. 265:790–798. 2012.PubMed/NCBI View Article : Google Scholar
|
|
27
|
Wang S, Kim S, Zhang Y, Wang L, Lee EB,
Syre P, Poptani H, Melhem ER and Lee JY: Determination of grade and
subtype of meningiomas by using histogram analysis of
diffusion-tensor imaging metrics. Radiology. 262:584–592.
2012.PubMed/NCBI View Article : Google Scholar
|
|
28
|
Ganeshan B, Abaleke S, Young RC, Chatwin
CR and Miles KA: Texture analysis of non-small cell lung cancer on
unenhanced computed tomography: Initial evidence for a relationship
with tumour glucose metabolism and stage. Cancer Imaging.
10:137–143. 2010.PubMed/NCBI View Article : Google Scholar
|
|
29
|
Ravanelli M, Farina D, Morassi M, Roca E,
Cavalleri G, Tassi G and Maroldi R: Texture analysis of advanced
non-small cell lung cancer (NSCLC) on contrast-enhanced computed
tomography: Prediction of the response to the first-line
chemotherapy. Eur Radiol. 23:3450–3455. 2013.PubMed/NCBI View Article : Google Scholar
|