Introduction
Epilepsy is a neurological disorder which affects
>50 million individuals worldwide (1). Temporal lobe epilepsy (TLE) is one of
the most common types of partial epilepsy in adults, in which the
epileptogenic foci are generally located in the temporal lobe
(2). TLE is associated with various
cognitive impairments such as attention deficit and memory
impairment, and impacts patient quality of life. Recurrent abnormal
neuronal discharges accelerate the risk of abnormal lesions in a
number of brain regions, including the temporal and extratemporal
regions, which may contribute to their functional impairment
(3). However, the underlying
pathophysiological and neurological mechanisms of TLE have remained
elusive.
Previous studies on TLE have identified abnormal
functional connectivity (FC) and structural abnormalities in
specific brain regions, including the cingulate cortex (4-6).
The cingulate cortex is a complex brain structure encompassing
diverse functional domains (7). With
a deeper understanding of TLE, diverse connectivity and functional
heterogeneity in brain subregions have been reported in numerous
studies (8,9), which indicates higher demand and new
challenges for future research.
The deep cingulate cortex encircles the corpus
callosum and is considered to be one of the most prominent features
of the inner brain (10). The
cingulate cortex is the core center of activity in TLE, and has a
crucial role in cognitive, sensory, motor and emotional processes
(11). In a previous study, the mean
diffusivity of the left cingulate cortex and parahippocampal cortex
in patients with TLE was indicated to be significantly higher than
that in the healthy control (HC) group (12). Another study revealed that in the TLE
group, patients with unilateral hippocampal sclerosis exhibited
lower fractional anisotropy of the ipsilateral cingulum than of the
contralateral cingulum, which was also lower than that in the
control group (4). In addition to
widespread hypometabolism in brain regions ipsilateral to the
epileptogenic focus, hypometabolism in areas including the anterior
cingulate gyrus (CG), the middle CG and the thalamus were also
observed on the contralateral epileptogenic foci of the TLE group
as compared to the HCs (13). A
functional MRI (fMRI) study revealed that decreased regional
homogeneity was present primarily in the default mode network (DMN;
including the precuneus, the posterior CG and the mesial prefrontal
cortex) in patients with TLE, relative to the HC subjects (14). In another fMRI study, functional
network abnormalities were identified in the limbic systems of
patients with TLE (including the ipsilateral ventral anterior
cingulate cortex and the hypothalamus, the subiculum and the
posterior cingulate cortex), which was significantly correlated
with seizure frequency (3). In
neuroimaging studies, functional and structural alterations are
frequently observed in the cingulate cortex of patients with TLE.
These changes have been associated with TLE seizure frequency,
disease duration (15) and attention
deficits (including executive control of attention) (5). The various regions of the cingulate
cortex are widely connected with different brain regions, and each
have different functions (10).
Hence, it was speculated that the cingulate cortex has a key role
in TLE. Although previous studies have reported alterations in
structural and functional connectivity of the cingulate cortex in
TLE, it remains elusive whether the cingulate subregions exhibit
differential intrinsic functional patterns in TLE. It should be
noted that the cingulate cortex is comprised of separate
subregions, and that there is a lack of a systematical
investigation into the differences in functional connectivity of
these subregions in TLE. The subregional specialization of the
cingulate cortex is considered to be linked to structural and
functional heterogeneity, as well as cytoarchitecture (16); Vogt et al (17) proposed that the cingulate cortex may
be divided into four subregions based on integrated neurobiological
assessments, which include the anterior cingulate cortex (ACC), the
posterior cingulate cortex (PCC), the middle cingulate cortex (MCC)
and the retrosplenial cingulate cortex (RSCC). In a diffusion
tractography study based on probabilistic connectivity, Beckmann
et al (18) identified nine
cingulate subregions and determined that the structural
connectivity of different subregions overlapped. Inspired by
previous studies, Fan et al (19) proposed the Human Brainnetome Atlas,
which is based on connectional architecture; the atlas divides the
cingulate cortex into seven subregions, with a total of 14
sub-regions in the bilateral cingulate cortex. Given the
differentiation of the cingulate subregions and their role in
processes including conflict monitoring, response selection and
memory, this may provide a foundation for further studies of the
cingulate subregions in TLE.
Based on the aforementioned studies, the functional
and structural alterations of the cingulate subregions are
considered to be closely associated with TLE. The purpose of the
present study was to investigate specific changes in the FC
patterns of the cingulate cortex (at the subregional level) in
patients with right-sided TLE (rTLE), using resting-state fMRI
(rs-fMRI). Subsequently, the attention network test (ANT) (20) was used to determine the executive
control performance of each participant. The potential association
between abnormal cingulate subregion connectivity and clinical
characteristics was also investigated.
Materials and methods
Study participants rTLE group
A total of 27 consecutively patients with rTLE (14
females and 13 males; mean age, 29.89±11.41 years) were recruited
between July 2015 and January 2018 at the Epilepsy Clinic of the
First Affiliated Hospital of Guangxi Medical University (Nanning,
China). The present study was approved by the Medical Research
Ethics Committee of the First Affiliated Hospital of Guangxi
Medical University and written informed consent was obtained from
each participant. The subjects were recruited based on standard and
video-electroencephalographic (EEG) evaluation, brain MRI results
and clinical data (including clinical characteristics, neurological
examination results and medication regimens). Each patient
exhibited typical temporal lobe seizures and was diagnosed with TLE
based on the criteria and therapeutic guidelines of the
International League Against Epilepsy (21). The diagnosis was based on clinical
characteristics, confirmative video-EEG monitoring and imaging
examinations, and was determined by two experienced neurologists.
Patients with rTLE met at least two of the following inclusion
criteria: i) The clinical symptoms of TLE indicated epileptic
lesions in the temporal lobe; ii) MRI results suggested atrophy,
sclerosis localized to the right hippocampus or other abnormalities
in the right temporal lobe; and iii) EEG abnormalities revealed
ictal or interictal discharges originating from the right temporal
lobe. The exclusion criteria were as follows: i) A Mini-Mental
State Examination (MMSE) score of <24; ii) any history of severe
neurological or mental diseases; iii) traumatic brain injury or
other serious medical conditions.
HC group
The HC group included 20 healthy subjects without
rTLE (8 females and 12 males; mean age, 27.70±2.79 years) who were
age-, sex- and education-matched with 20 of those from the rTLE
group. The HC group were recruited from the community between July
2015 and January 2018. In addition, the HCs had normal vision (or
at least it was corrected to normal) and no history of neurological
or psychiatric disorders. All participants recruited had an MMSE
score of >24, which was also closely matched with that of the
corresponding patients with rTLE. All participants were
right-handed.
fMRI data acquisition
All rs-fMRI data were acquired using a 3-T Achieva
MRI scanner (Philips Healthcare) with a 12-channel phased-array
head coil, and tight clamps were used to limit head movement.
Resting-state functional images were acquired using a gradient-echo
echo-planar imaging (EPI) sequence with the following scanning
parameters: Repetition time/echo time, 2,000/30 msec; flip angle,
90˚; number of slices, 31; pitch, 1 mm; field of view, 220x220 mm;
matrix, 64x64; voxel size, 3.44x3.44x6.00 mm; and 180 volumes.
During scanning, the subjects were instructed to lie still, keeping
their eyes closed but staying awake, and not to think of anything
in particular.
fMRI data processing
The DPABI software in MATLAB® (22) was utilized for pre-processing the
resting-state fMRI data, and the first 10 time-points were removed.
Slice timing and head motion corrections were subsequently
performed. Functional data were spatially normalized to the
Montreal Neurological Institute EPI template, resampled to a
resolution of 3x3x3 mm, and smoothed with a 6-mm Gaussian kernel;
this was followed by bandpass filtering (range, 0.01-0.08 Hz).
Sources of spurious variance, including averaging signals from
white matter, cerebrospinal fluid, the global brain and the six
head-motion parameters, were removed from the imaging data
(7). Data from participants with
head motion >2 mm or head rotations >2˚ were excluded from
further calculations.
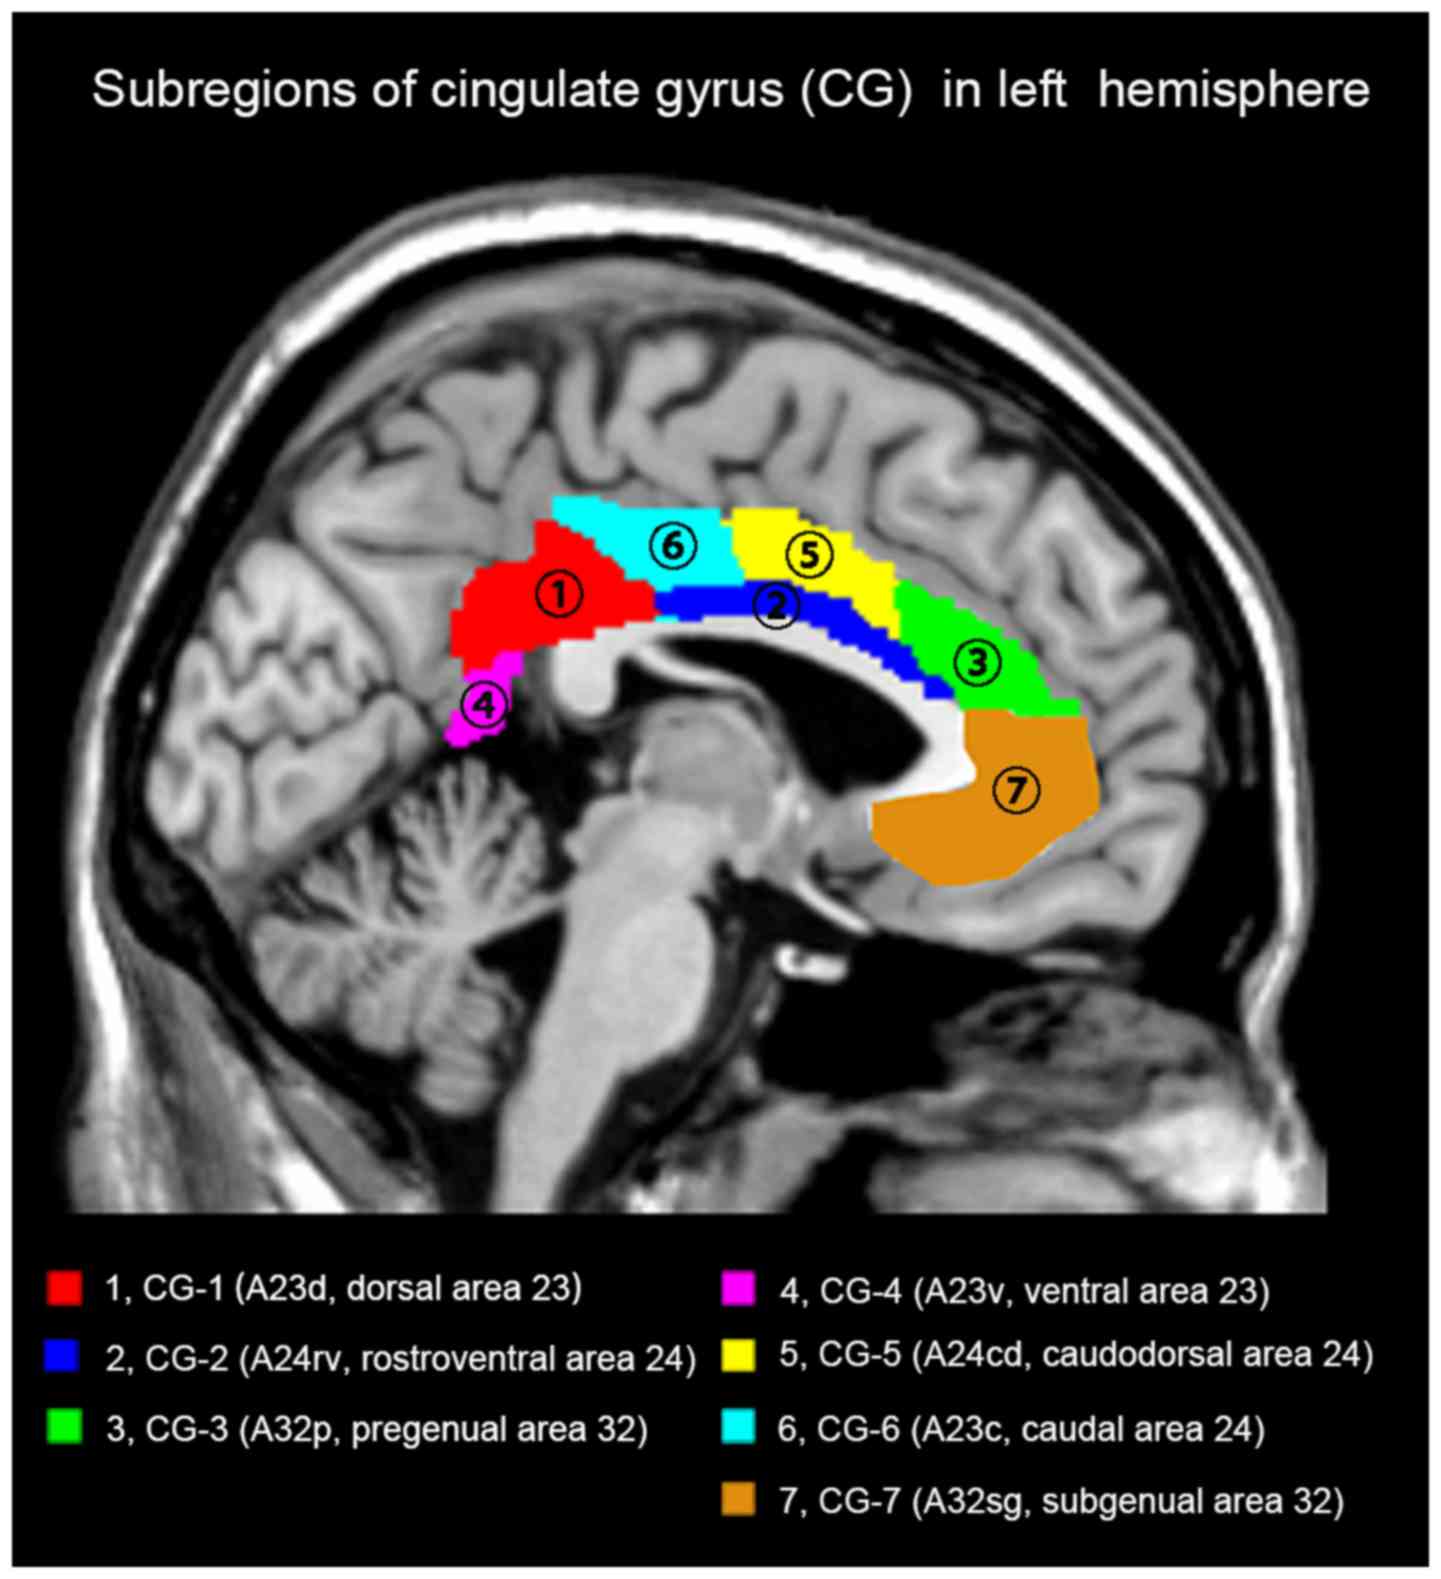
Definition of cingulate gyrus (CG)
subregions
The cingulate subregions were defined according to
the Human Brainnetome Atlas based on connectional architecture and
applying multimodal neuroimaging techniques (19). In each hemisphere, the CG was divided
into the following subregions: CG-1 (dorsal area 23; A23d), CG-2
(rostroventral area 24; A24rv), CG-3 (pregenual area 32; A32p),
CG-4 (ventral area 23; A23v), CG-5 (caudodorsal area 24; A24cd),
CG-6 (caudal area 24; A23c) and CG-7 (subgenual area 32; A32sg).
Thus, a total of 14 regions of interest (ROIs) were defined for the
bilateral CG. The list of ROIs and the atlas details are displayed
in Fig. 1 and Table I.
 | Table IName and coordinates of the cingulate
subregions in the Human Brainnetome Atlas. |
Table I
Name and coordinates of the cingulate
subregions in the Human Brainnetome Atlas.
| MNI
coordinates |
|---|
| Label ID/subregion,
hemisphere | Abbreviation | X | Y | Z |
|---|
| CG-1/dorsal area
23 |
|
L | L-A23d | -4 | -39 | 31 |
|
R | R-A23d | 4 | -37 | 32 |
| CG-2/ rostroventral
area 24 |
|
L | L-A24rv | -3 | 8 | 25 |
|
R | R-A24rv | 5 | 22 | 12 |
| CG-3/pregenual area
32 |
|
L | L-A32p | -6 | 34 | 21 |
|
R | R-A32p | 5 | 28 | 27 |
| CG-4/ventral area
23 |
|
L | L-A23v | -8 | -47 | 10 |
|
R | R-A23v | 9 | -44 | 11 |
| CG-5/caudodorsal
area 24 |
|
L | L-A24cd | -5 | 7 | 37 |
|
R | R-A24cd | 4 | 6 | 38 |
| CG-6/caudal area
24 |
|
L | L-A23c | -7 | -23 | 41 |
|
R | R-A23c | 6 | -20 | 40 |
| CG-7/subgenual area
32 |
|
L | L-A32sg | -4 | 39 | -2 |
|
R | R-A32sg | 5 | 41 | 6 |
Functional connectivity analysis
The voxel-wise whole-brain FC maps for each of the
cingulate subregions were investigated using the Dynamic BC
software package (23). The average
time series were extracted from each ROI. Subsequently, Pearson's
correlation coefficients between the mean time courses of each ROI
and the signal time series of each voxel in other parts of the
brain were calculated. The results were subsequently converted to
z-values using Fisher's r-to-z transformation, to generate a
z-score FC map of improved normality (24). FC analysis was performed to identify
aberrant FC characteristics for each ROI.
The ANT for executive control
performance
Executive control performance was evaluated using
the ANT. Stimuli in the ANT are visually displayed on a screen and
participants are required to identify the direction in which a
central target arrow points, as efficiently as possible. The
reaction time (RT) of all participants was recorded. After all
participants had completed a practice module of 24 trials, a formal
test was performed, which included 3 modules comprising 96 trials
each. A detailed description of the ANT has been published
previously (25). The efficiency of
the executive control network was determined as follows (26): Conflict
effect=RTincongruent-RTcongruent. A longer RT
of conflict effect suggested inferior executive control
performance.
Statistical analysis
Statistical analysis of the demographic and clinical
data was performed using SPSS version 18.0 (SPSS, Inc.) and the
Statistical Parametric Mapping software package (SPM12; http://www.fil.ion.ucl.ac.uk/spm) was used to
analyze the rs-fMRI data. Differences in demographic data and
clinical features between the two groups were analysed using an
independent two-samples t-test and the sex distribution was
analysed using the χ2 test. The differences in FC
between the patient and control groups were compared using a
two-samples t-tests in SPM12. Age, sex, education level and MMSE
scores were used as covariates to be regressed in the two-sample
t-tests (27). The results of
statistical FC mapping were further corrected for multiple
comparisons using Gaussian random fields (GRF) to a significant
voxel level of P<0.001, and a joint cluster level of P<0.01,
which was implemented using RESTplus software (http://resting-fmri.sourceforge.net)).
In order to explore the association between the
significant FC values and the clinical characteristics in the rTLE
group, Pearson's correlation analysis was performed between the
rsFC of the cingulate sub-regions and clinical variables of the
patients (including executive control function and duration of
disease). P<0.05 was considered to indicate a statistically
significant difference.
Results
Demographic and clinical data
The demographic and clinical data of all
participants are summarized in Table
II. No significant differences were present between the rTLE
patients and HCs with regard to sex, age, education level or MMSE
score.
| Table IIDemographic information and clinical
characteristics of patients with rTLE and healthy controls. |
Table II
Demographic information and clinical
characteristics of patients with rTLE and healthy controls.
| Variable | rTLE group
(n=27) | Control group
(n=20) | Test statistic,
t/χ2-value | df | P-value |
|---|
| Sex | | |
χ2=0.648 | 1 | 0.421 |
|
Male | 13(48) | 12(60) | | | |
|
Female | 14(52) | 8(49) | | | |
|
Right-handedness | 27(100) | 20(100) | N/A | N/A | N/A |
| Age (years) | 29.89±11.41 | 27.70±2.79 | t=0.959 | 30.11 | 0.345 |
| Education
(years) | 14.33±4.43 | 16.25±3.47 | t=-1.605 | 45.00 | 0.116 |
| Duration of
epilepsy (years) | 7.87±6.26 | N/A | N/A | N/A | N/A |
| Mini-Mental-State
Examination | 28.89±0.80 | 28.80±0.77 | t=0.383 | 45.00 | 0.704 |
| RT (msec) |
|
Congruent | 622.72±109.82 | 528.49±52.10 | t=3.905 | 39.24 | <0.001 |
|
Incongruent | 745.48±120.82 | 602.41±55.15 | t=5.436 | 38.51 | <0.001 |
|
Executive
control (conflict effect) | 122.76±41.20 | 73.92±20.59 | t=5.327 | 40.23 | <0.001 |
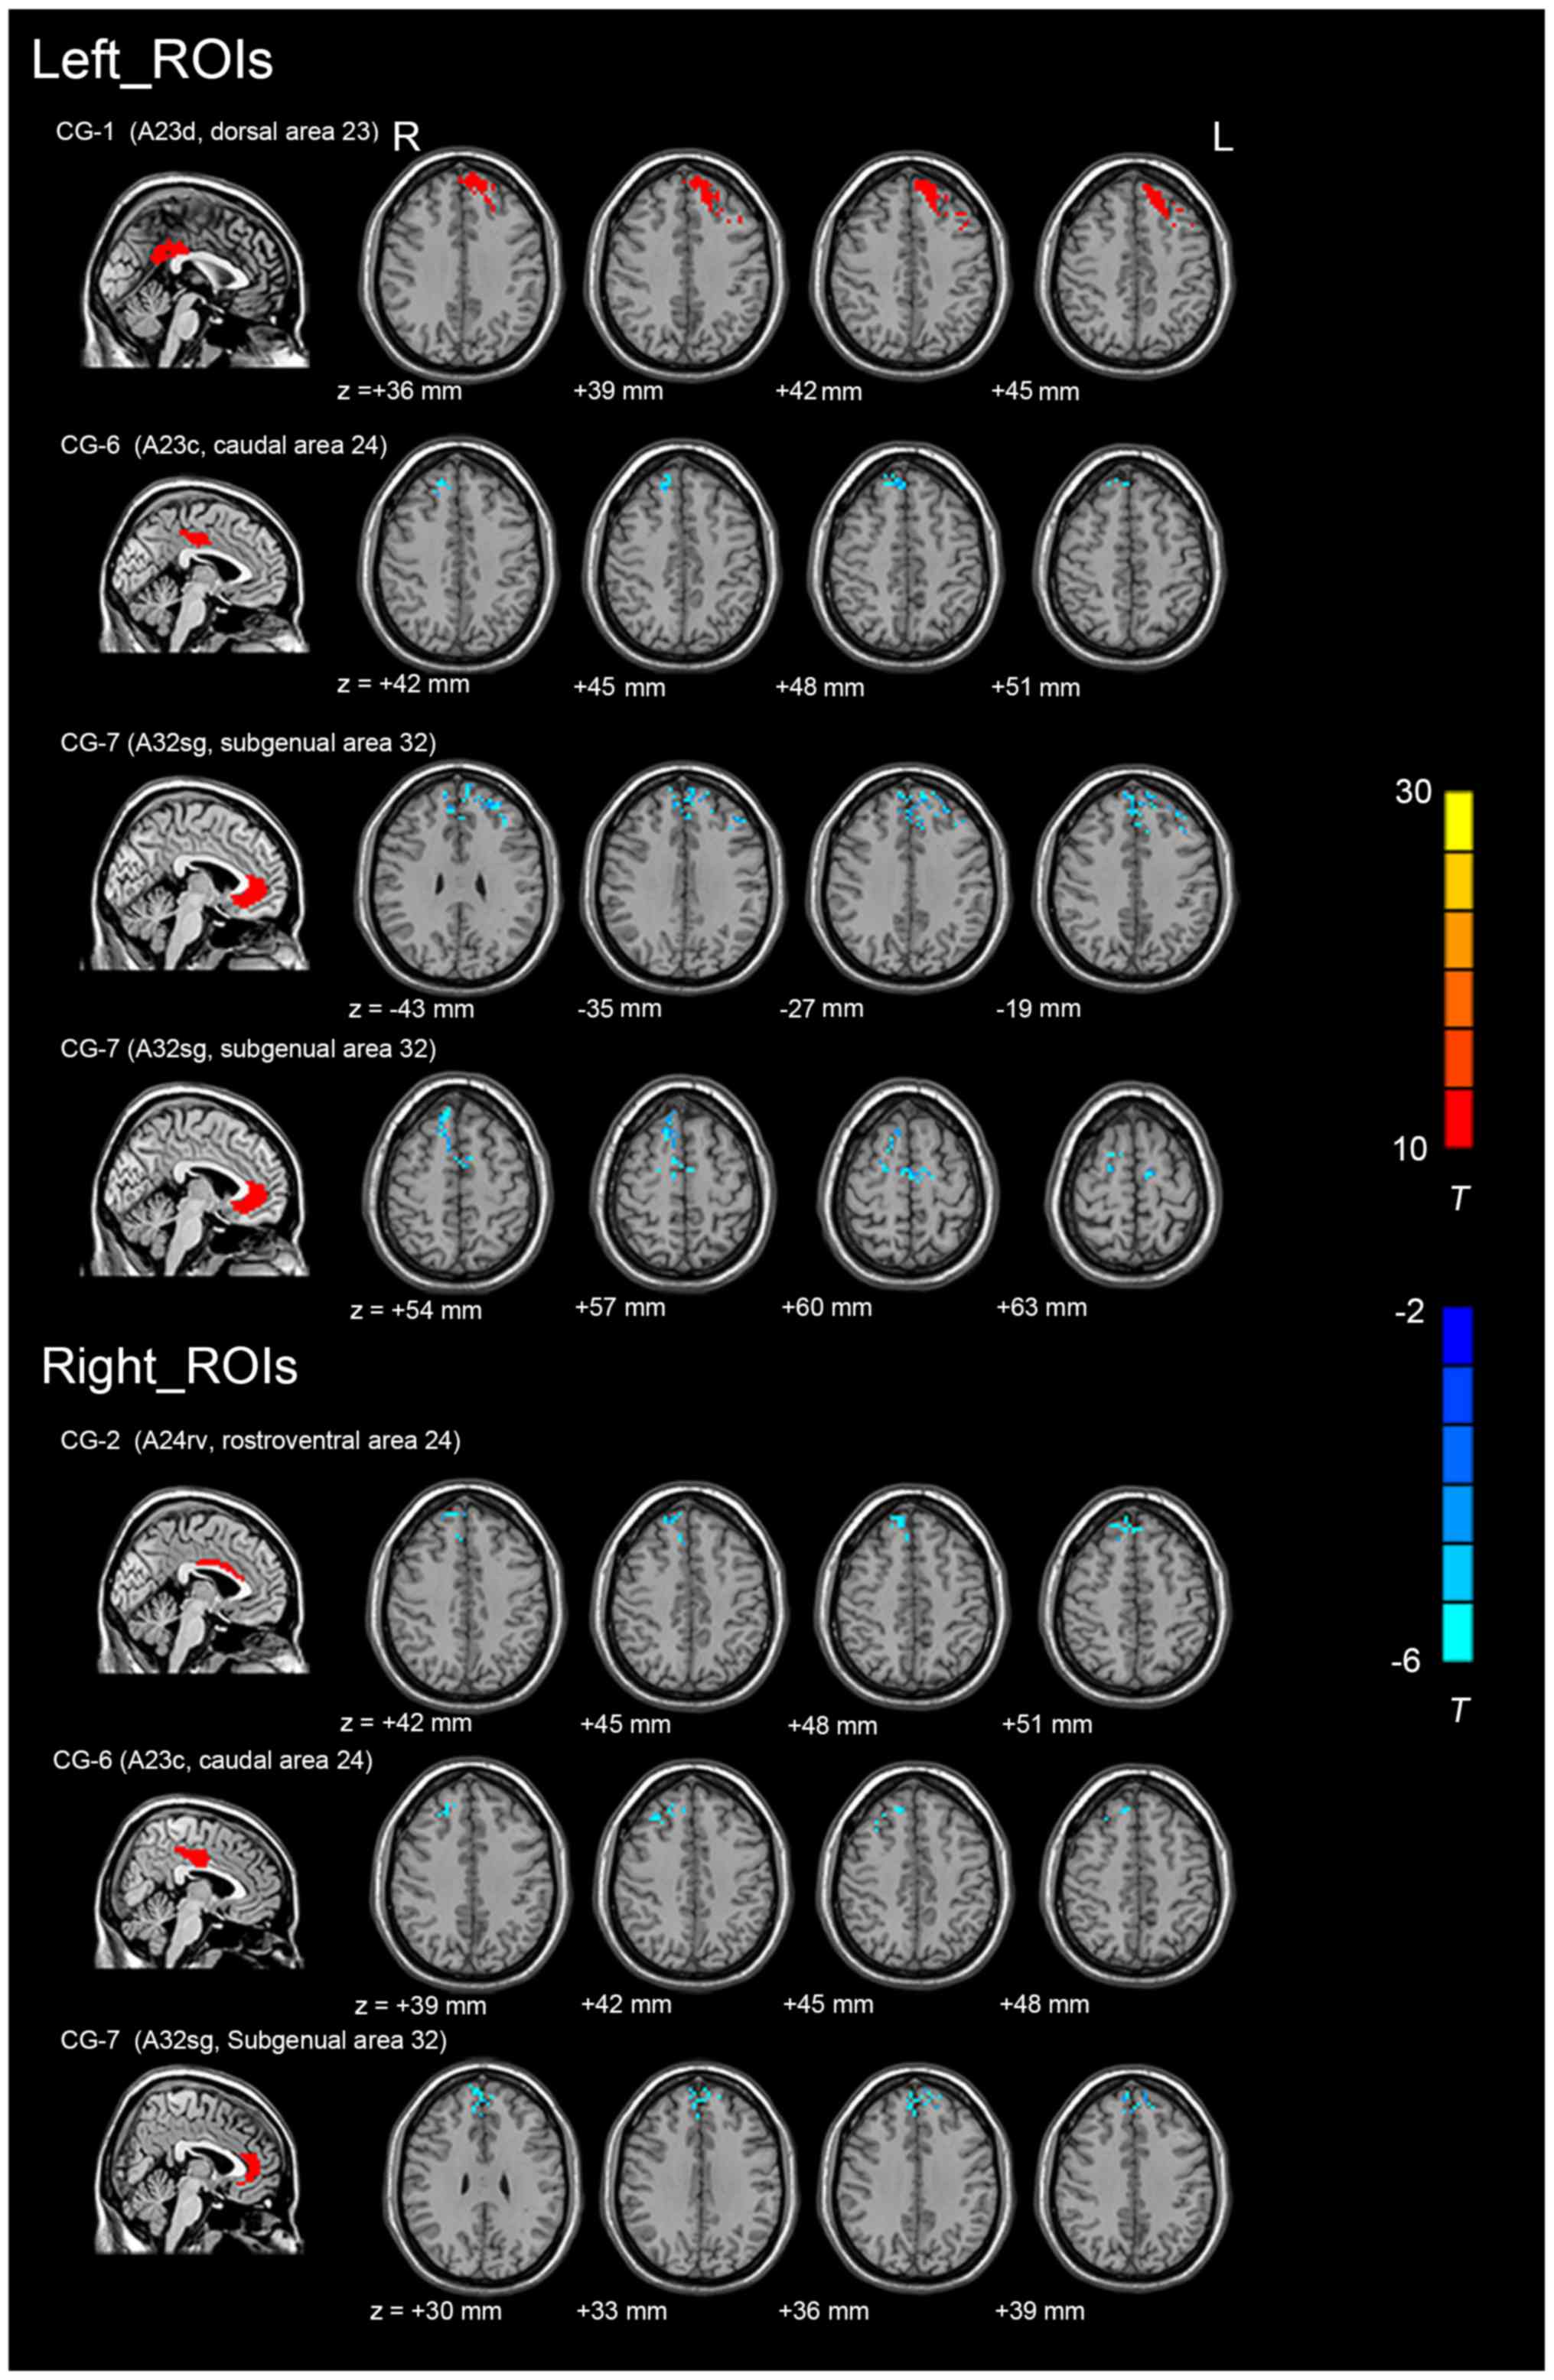
Imaging data
The differences in the FC values between patients
with rTLE and HCs were analysed for the 14 cingulate subregions
(Table III). The FC maps of the
left CG-1, bilateral CG-6, bilateral CG-7 and right CG-2 exhibited
significant inter-group differences in connectivity [voxel-level
threshold P<0.001 and cluster-level threshold P<0.01,
GRF-corrected], as indicated in Fig.
2 (for regional details, see Table
III). However, the FC values in the other 8 cingulate
subregions were not significantly different between patients with
rTLE and the HCs. Compared with that in the HCs, one region in rTLE
patients exhibited an enhanced FC, and five regions exhibited a
decreased FC (primarily in the prefrontal cortex). Reduced FC
values in patients with rTLE were detected in the following
regions: i) Between the right CG-2 and the right superior frontal
gyrus [SFG; extending to the right medial (m)SFG and the right
medial frontal gyrus]; ii) between the left CG-6 and the right SFG
(extending to the bilateral medial superior frontal gyrus); iii)
between the right CG-6 and the right SFG [extending to the right
middle frontal gyrus (MFG)]; iv) between the left CG-7 and the left
SFG (extending to the left MFG, the right mSFG); v) between the
left CG-7 and the right SFG (extending to the right MFG and the
bilateral supplementary motor area); and vi) between the right CG-7
and the left SFG (extending to the left MFG and the mSFG). In
addition, an increase in the FC value was observed between the left
CG-1 and the left SFG (extending to the left MFG, the left
supplementary motor area and the left MFG).
| Table IIIAberrant functional connectivity of
cingulate subregions in rTLE vs. healthy controls (voxel-level
P<0.001 and cluster-level P<0.05; Gaussian random
field-corrected). |
Table III
Aberrant functional connectivity of
cingulate subregions in rTLE vs. healthy controls (voxel-level
P<0.001 and cluster-level P<0.05; Gaussian random
field-corrected).
| Peak voxel MNI
coordinates | |
|---|
| Region of interest
name/abbreviation | Brain region of FC
difference | X | Y | Z | t-value | Cluster size (total
voxels, mm3) | Breakdown (number
of voxels) |
|---|
| L CG-1, |
| L-A23d | L cerebrum/frontal
lobe/middle frontal gyrus | -39 | 27 | 42 | 14.7498 | 1,323 | Superior frontal
gyrus L (620) |
| Medial frontal
gyrus L (306) |
| Sup motor area L
(153) |
| Middle frontal
gyrus L (108) |
| L CG-6, |
| L-A23c | R cerebrum/frontal
lobe/medial frontal gyrus | 6 | 39 | 48 | -5.1967 | 83 | Superior frontal
gyrus R (70) |
| Frontal sup medial
R (32) |
| Frontal sup medial
L (11) |
| L CG-7, |
| L-A32sg | L cerebrum/frontal
lobe/superior frontal gyrus | -9 | 57 | 36 | -6.1627 | 248 | Superior frontal
gyrus L (125) |
| Middle frontal
gyrus L (54) |
| Frontal sup medial
R (32) |
| L CG-7, |
| L-A32sg | R cerebrum/frontal
lobe/superior frontal gyrus | 18 | 9 | 60 | -6.1728 | 186 | Superior frontal
gyrus R (102) |
| Supp motor area R
(67) |
| Medial frontal
gyrus R (57) |
| Sup motor area L
(35) |
| R CG-2, |
| R-A24rv | R cerebrum/frontal
lobe/superior frontal gyrus | 12 | 45 | 48 | -5.4672 | 172 | Superior frontal
gyrus R (118) |
| Frontal sup medial
R (83) |
| Medial frontal
gyrus R (37) |
| R CG-6, |
| R-A23c | R cerebrum/frontal
lobe/middle frontal gyrus | 33 | 27 | 45 | -4.7652 | 71 | Superior frontal
gyrus R (44) |
| Middle frontal
gyrus R (22) |
| R CG-7, |
| R-A32sg | L cerebrum/frontal
lobe/superior frontal gyrus | -9 | 57 | 36 | -5.2422 | 131 | Superior frontal
gyrus L (83) |
| Frontal sup medial
R (64) |
| Medial frontal
gyrus L (34) |
Table IV presents the statistical analysis of the FC
z-scores using the cingulate subregions as ROIs. The results
indicated that the mean z-scores of certain cingulate subregions in
the rTLE group were lower than those for the HC group, whereas the
mean z-scores of other cingulate subregions were higher than those
for the HCs. These were significantly different in cingulate
subregions including the left CG-1, the left CG-3 and the left CG-7
(between patients with rTLE and HCs; P<0.05). These abnormal
regions were more common in the left (three subregions) than in the
right cingulate cortex.
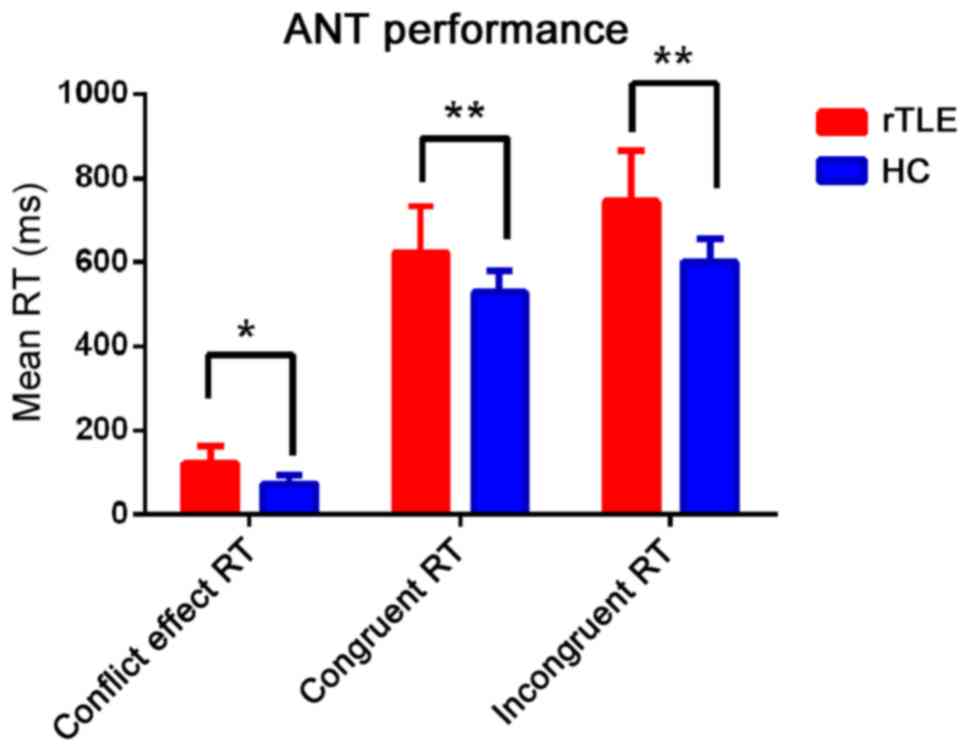
Behavioral results during ANT
performance
Compared with that in the HC group, patients with
rTLE exhibited significantly poorer accuracy when assessing
congruent and incongruent conditions (P<0.001; Fig. 3 and Table
II). Furthermore, the executive control efficiency (conflict
effect) RT of the patients was significantly longer than that from
the HC group (P<0.05; Fig. 3 and
Table II).
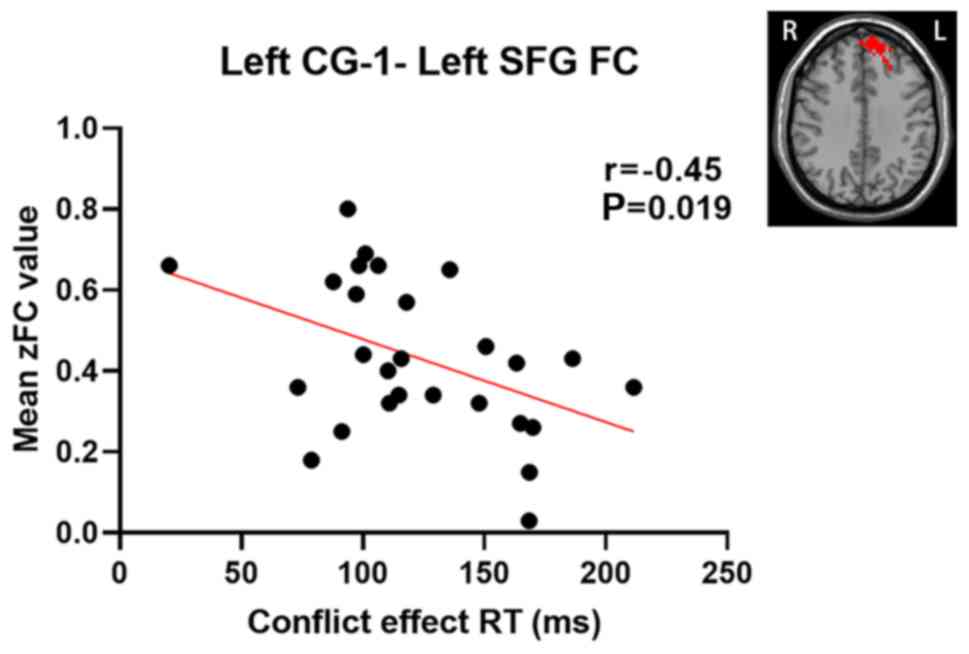
Correlation between abnormal FC and
clinical characteristics
A correlation analysis was performed between the
altered cingulate subregions with significantly different FC values
and clinical characteristics (including executive control
performance) in patients with rTLE. Pearson's correlation analysis
revealed that the zFC values of the left CG-1 and left SFG were
negatively correlated with the conflict effect (r=-0.45; P=0.019,
uncorrected) (Fig. 4). The other
cingulate subregions with abnormal FC values were not significantly
correlated with executive control performance or any other clinical
variables. Furthermore, no significant correlation was obtained
within the HC group.
Discussion
To the best of our knowledge, the present study was
the first to use rs-fMRI to systematically investigate alterations
in the rsFC of cingulate subregions in rTLE. It was revealed that
patients with rTLE had altered patterns of connectivity between
different cingulate subregions and cortical brain regions
(primarily in the prefrontal lobe). The patients also exhibited
executive control impairment. The number of cingulate subregions
with statistically significant FC changes was slightly higher in
the left than in the right cingulate cortex, and the FC variations
of the cingulate subregions were determined to be specific to rTLE.
It was also indicated that increased connectivity in the left CG-1
and left SFG were negatively correlated with executive control
performance in rTLE.
Due to its cytoarchitectural and functional
framework, the cingulate cortex is considered to be a complex brain
structure (10,19), and is divided into four subregions
based on function and anatomy (a popular means of classification)
(17). Numerous studies have
identified that the ACC has a predominant role in control,
monitoring, executive control of attention (28) and affective functions (29); the ACC is associated with the frontal
and limbic regions of the brain, which are associated with these
functions, particularly in the prefrontal cortex (30). The MCC is engaged in decision-making
and multisensory orientation, as well as conflict monitoring. The
PCC is an important interactive core between the DMN and the
sensorimotor network (31), which is
also associated with the precuneus, anterior and medial regions of
the SFG (32,33). The RSCC is located at the interface
of the ACC, MCC and PCC, and is associated with the parahippocampal
memory system. According to the Human Brainnetome Atlas (19), which was utilized in the present
study, the CG-7 and the CG-3 correspond to the ACC. In addition,
the locations of the CG-6, the CG-5 and the CG-2 in the present
study are akin to that of the MCC in previous studies (34,35).
Furthermore, the CG-1 in the present study belongs to the PCC and
the CG-4 is located deep within the CG and corresponds to the
RSCC.
As the anterior part of the cingulate cortex, the
CG-7 is one of the key regions of the dorsal attention network,
which is active during cognitive tasks (36). The ACC, which is associated with
high-level cognitive and emotional processing, has distinct
connections with various cortical areas, including the prefrontal
cortex (37). The anterior portion
of the ACC has also been viewed as ‘executive’ in function
(38), and in line with previous
studies, the CG-7 may be involved in monitoring the response to
conflict (39). In the present
study, patients with rTLE showed reduced CG-7-SFG connectivity
compared with HCs. The SFG has been reported to be associated with
cognitive and motor control processes, execution and attention
(40). Another study suggested that
TLE with executive control impairment resulted in hypoperfusion in
the extratemporal areas (including the SFG) in patients with TLE
(41). Another fMRI study revealed
decreased FC of the affected hippocampus and SFG in patients with
TLE (42). A reduction in FC was
also reported within the right superior frontal lobe (BA 8), though
FC enhancement was observed within the right superior frontal lobe
(BA 11) in patients with rTLE when performing the Visuospatial
Working Memory N-back task (43). In
addition, decreased FC between the ACC and the frontal lobe has
been reported in patients with generalized tonic-clonic seizure
epilepsy, and is associated with cognition impairment (44). Execution control activities are
frequently associated with the frontal cortex, particularly in the
ACC and prefrontal cortex (45). The
results of the present study are consistent with those of previous
studies, suggesting that decreased FC of the bilateral CG-7 and the
bilateral SFG may be one of the underlying mechanisms of executive
control impairment.
The CG-2 and the CG-6 belong to the middle region of
the cingulate cortex, and are involved in feedback-mediated
decision making and attention monitoring (46). According to the theory of Vogt, these
regions are associated with modulating cognitive motor responses
and integrating various sources from cognitive and emotional
networks, which improves decision-making efficiency and execution
(34). The present study revealed
that the rTLE group exhibited reduced FC in the right CG-2 and the
right SFG, as well as decreased FC between the bilateral CG-6 and
the right SFG, with stronger connections to the prefrontal
lobe.
The SFG is considered to be part of the DMN and
evidence indicates that they may have a crucial role in
goal-directed behavior by regulating the connection between the DMN
and the fronto-parietal control network (47). The SFG has been reported to be
strongly associated with cognitive control functions, including
executive control (40). A previous
study suggested that significant cortical thinning was present in
the bilateral sensorimotor cortex, including in the bilateral SFG
in patients with TLE (48). Afzali
et al (49), performed a
diffusion tensor imaging study and revealed that the SFG and MFG
are regions with reduced fractional anisotropy in patients with
TLE, suggesting that the microstructure of white matter was
impaired. In patients with TLE, abnormalities of dynamic functional
network interactions were identified between the left superior
medial frontal cortex and the left middle frontal gyrus, which
indicated that network modulation failure may be associated with
cognitive impairment in epilepsy (50). The results of the present study are
consistent with those of previous studies, indicating that this
disruption in connectivity may be linked to executive control
impairment in rTLE.
The CG-1 belongs to the posterior region of the
cingulate cortex and is considered to be a hub region within the
DMN (32). The DMN is characterized
by its maintenance of brain activity in the resting state (when the
individual is not focused) and exhibits decreased activity during
attention-demanding tasks (51).
Disruptions of the functional and structural connectivity between
the DMN have been reported in TLE (52), which may promote the cognitive
impairments associated with TLE (53-55).
Using probabilistic fiber tracking, Khalsa et al (56) investigated the underlying structural
connectivity within the DMN and demonstrated stronger structural
connections between the PCC and the mesial prefrontal cortex in
normal subjects. Evidence suggests that the SFG, the superior
region of the prefrontal cortex, is composed of several different
subregions, which account for its diverse connection patterns and
specific function (40). Koshino
et al (57) observed
increased activation of the medial prefrontal cortex and the
posterior cingulate cortex during task preparation, suggesting that
according to the task requirements, the allocation of attentional
resources to the task-associated areas affected the activation of
these network sites. Another study indicated that increased
connectivity between the left superior frontal gyrus and the
posterior cingulate cortex predicted faster RT during task
performance. In addition, the interaction and dynamic
reconfiguration in functional connections of the DMN indicates that
they are involved in the processing of current tasks at a higher
global level (33). The present
study indicated increased connectivity between the left CG-1 and
the left SFG in rTLE, compared with that in the HC group, which is
in keeping with the results of previous studies (58). The increased FC in these regions may
be interpreted as a compensation mechanism for executive control
deficits (59).
Attention deficit is one of the most common symptoms
of TLE (60). Executive control is
an important component of attention but is frequently neglected and
is rarely reported in rTLE. The executive control network governs
the capacity to achieve intended goals and responses to resolve
conflict. In the present study, executive control was evaluated by
a flanker trial where participants were asked to identify the
direction of a central arrow, which was ‘flanked’ by congruent or
incongruent stimuli (arrows that are the same or opposed to the
target direction, respectively). When the target arrow and the
flanking arrows are congruent, participants typically respond
faster than when the arrows are incongruent. The results suggested
that patients with rTLE and HCs responded more rapidly during
congruent than during incongruent flanker conditions, suggesting a
typical flanker congruent efficiency. Of note, patients with rTLE
exhibited longer RTs for task-irrelevant stimuli than the HCs,
which indicates that patients with rTLE have difficulties in
resolving the conflict between task-relevant and task-irrelevant
stimuli. The RT of the executive control network in patients with
rTLE was significantly longer than that of the HCs. This indicates
that patients with rTLE took longer to resolve conflict than the
HCs, suggesting that the executive control network efficiency of
patients with rTLE is lower. The results of the present study
revealed poorer executive control performance in patients with
rTLE, which is in line with a previous study (61). The results also demonstrated a
moderate but significant negative correlation between the executive
control performance and the abnormal zFC between the left CG-1 and
left SFG in patients with rTLE. The results of a previous
functional neuroimaging study suggested that prefrontal areas,
including the SFG, are involved in response conflicts and response
errors. A previous study supported that the SFG is part of the DMN
and may mediate the connection between the default network and the
fronto-parietal control network to facilitate goal-directed
executive processes (47).
The results of the present study are consistent with
those of a previous study in which increased connectivity between
the PCC and medial prefrontal cortex was associated with improved
working memory performance (62).
The present study suggested that the left SFG may serve a potential
compensatory role in executive processing in rTLE, which is in line
with the previous studies (60,63).
However, due to the small sample size, the results of the
correlation analysis were not corrected for multiple comparisons,
and hence, the results should be considered preliminary. In
addition, the brain regions exhibiting FC variations (using the
left CG-1, CG-3 and CG-7 as the seed point) were located in the
left hemisphere. There appears to be no reasonable interpretation
for these results and this observation may be attributed to the
altered structure of the CG; additional structural research is
required to confirm this hypothesis. The total number of cingulate
subregions with significant FC alterations was also higher in the
left than in the right CG, indicating potential left CG dominance.
A previous study used the ANT to investigate hemisphere dominance
for the executive control network and indicated greater executive
control efficiency in the right hemisphere relative to the left,
regarding the reaction time (64).
Another rs-fMRI study based on graph theory examined the
differences in limbic network connectivity between left-sided TLE
(lTLE) and rTLE, revealing a more significant reduction in limbic
network connectivity in rTLE than in lTLE (65). The results of the aforementioned
studies are inconsistent with those of the present study, which may
be due to the heterogeneity of the CG, as well as differences in
sample size and analysis methods. However, further studies are
required to confirm this speculation.
The present study had several limitations. First,
the patients were treated with different anti-epileptic drugs at
the time of recruitment, which may have exerted different effects
on the brain. The possible effects of anti-epileptic therapy on FC
analysis cannot be excluded. Furthermore, the small sample size may
have resulted in reduced statistical power; in addition, only rTLE
was investigated and the absence of a lTLE group may have limited
the results of the study. Furthermore, the small sample size
prevented any subgroup analyses and studies with larger samples are
required to validate the present results. Although various results
were consistent with the Brainnetome Atlas, it should be noted that
the underlying inter-individual variability of the cingulate
subregions may have influenced the results of the present study
(19). Finally, the present study
only used rs-FC to investigate alterations to the cingulate
subregions in rTLE; in future studies, multimodal data fusion
analysis will be performed to explore abnormalities in cingulate
subregion connectivity in TLE, and as such, the present results
should be considered as preliminary data and treated with
caution.
To the best of our knowledge, the present study was
the first to systematically investigate the rsFC patterns of the
cingulate subregions in patients with rTLE. Executive control
dysfunction was observed in patients with rTLE, compared with the
HCs. Significant alterations in rsFC between the cingulate
subregion and the brain regions were mostly decreased (though some
were slightly increased), suggesting that FC may have a left-side
advantage in patients with rTLE. The FC variations of the cingulate
subregions were reported to be specific to rTLE. Furthermore, the
correlation between the altered FC values and executive control
performance suggests a compensatory mechanism on executive control
deficits in pathological conditions. The information on the
differentially altered functional connectivity patterns of
cingulate subregions revealed in the present study may provide a
deeper understanding of the complex neurological mechanisms and
executive control dysfunctions underlying rTLE.
Acknowledgements
Not applicable.
Funding
The present study was supported by The National
Natural Science Foundation of China (grant no. 81560223) and
Guangxi Natural Science Foundation (grant no.
2018GXNSFAA050149).
Availability of data and materials
The datasets used and/or analysed during the current
study are available from the corresponding author upon reasonable
request.
Authors' contributions
ZZ and JZ conceived and designed the research study.
XZ, JL, LQ and WY performed the research. ZZ, XZ and LQ analysed
the data. XZ, JL and WY supervised the data analysis. ZZ wrote the
original draft. JZ, XZ, JL, WY and LQ reviewed and edited the
manuscript. All authors read and approved the manuscript.
Ethics approval and informed consent to
participate
All subjects were informed in detail about the
research and they provided written informed consent. The study was
approved by The Ethics Committee of the First Affiliated Hospital
of Guangxi Medical University (Nanning, China).
Patient consent for publication
Not applicable.
Competing interests
The authors declare that they have no competing
interests.
References
|
1
|
Behr C, Goltzene M, Kosmalski G, Hirsch E
and Ryvlin P: Epidemiology of epilepsy. Rev Neurol (Paris).
172:27–36. 2016.PubMed/NCBI View Article : Google Scholar
|
|
2
|
Téllez-Zenteno JF and Hernández-Ronquillo
L: A review of the epidemiology of temporal lobe epilepsy. Epilepsy
Res Treat. 2012(630853)2012.PubMed/NCBI View Article : Google Scholar
|
|
3
|
Jo HJ, Kenney-Jung DL, Balzekas I, Welker
KM, Jones DT, Croarkin PE, Benarroch EE and Worrell GA:
Relationship between seizure frequency and functional abnormalities
in limbic network of medial temporal lobe epilepsy. Front Neurol.
10(488)2019.PubMed/NCBI View Article : Google Scholar
|
|
4
|
Urbach H, Egger K, Rutkowski K, Nakagawa
JM, Schmeiser B, Reisert M, Brandt A, Steinhoff BJ, Schulze-Bonhage
A and Hammen T: Bilateral cingulum fiber reductions in temporal
lobe epilepsy with unilateral hippocampal sclerosis. Eur J Radiol.
94:53–57. 2017.PubMed/NCBI View Article : Google Scholar
|
|
5
|
Guo L, Bai G, Zhang H, Lu D, Zheng J and
Xu G: Cognitive functioning in temporal lobe epilepsy: A BOLD-fMRI
study. Mol Neurobiol. 54:8361–8369. 2017.PubMed/NCBI View Article : Google Scholar
|
|
6
|
Coan AC, Appenzeller S, Bonilha L, Li LM
and Cendes F: Seizure frequency and lateralization affect
progression of atrophy in temporal lobe epilepsy. Neurology.
73:834–842. 2009.PubMed/NCBI View Article : Google Scholar
|
|
7
|
Fox MD, Snyder AZ, Vincent JL, Corbetta M,
Van Essen DC and Raichle ME: The human brain is intrinsically
organized into dynamic, anticorrelated functional networks. Proc
Natl Acad Sci USA. 102:9673–9678. 2005.PubMed/NCBI View Article : Google Scholar
|
|
8
|
Yu C, Zhou Y, Liu Y, Jiang T, Dong H,
Zhang Y and Walter M: Functional segregation of the human cingulate
cortex is confirmed by functional connectivity based
neuroanatomical parcellation. Neuroimage. 54:2571–2581.
2011.PubMed/NCBI View Article : Google Scholar
|
|
9
|
Peterson BS, Skudlarski P, Gatenby JC,
Zhang H, Anderson AW and Gore JC: An fMRI study of Stroop
word-color interference: Evidence for cingulate subregions
subserving multiple distributed attentional systems. Biol
Psychiatry. 45:1237–1258. 1999.PubMed/NCBI View Article : Google Scholar
|
|
10
|
Shackman AJ, Salomons TV, Slagter HA, Fox
AS, Winter JJ and Davidson RJ: The integration of negative affect,
pain and cognitive control in the cingulate cortex. Nat Rev
Neurosci. 12:154–167. 2011.PubMed/NCBI View
Article : Google Scholar
|
|
11
|
Torta DM and Cauda F: Different functions
in the cingulate cortex, a meta-analytic connectivity modeling
study. Neuroimage. 56:2157–2172. 2011.PubMed/NCBI View Article : Google Scholar
|
|
12
|
Narenmandula B, Zhou X, Li Y, Tu D, Bao Y,
Zheng R and Xu H: Effects of white matter microstructure lesions on
language and memory function in magnetic resonance imaging-negative
temporal lobe epilepsy determined by diffusion tensor imaging.
Neurol India. 64:1233–1242. 2016.PubMed/NCBI View Article : Google Scholar
|
|
13
|
Kojan M, Doležalová I, Koriťáková E,
Mareček R, Řehák Z, Hermanová M, Brázdil M and Rektor I: Predictive
value of preoperative statistical parametric mapping of regional
glucose metabolism in mesial temporal lobe epilepsy with
hippocampal sclerosis. Epilepsy Behav. 79:46–52. 2018.PubMed/NCBI View Article : Google Scholar
|
|
14
|
Zeng H, Pizarro R, Nair VA, La C and
Prabhakaran V: Alterations in regional homogeneity of resting-state
brain activity in mesial temporal lobe epilepsy. Epilepsia.
54:658–666. 2013.PubMed/NCBI View Article : Google Scholar
|
|
15
|
Chiang S, Stern JM, Engel J Jr and Haneef
Z: Structural-functional coupling changes in temporal lobe
epilepsy. Brain Res. 1616:45–57. 2015.PubMed/NCBI View Article : Google Scholar
|
|
16
|
Vogt BA, Nimchinsky EA, Vogt LJ and Hof
PR: Human cingulate cortex: Surface features, flat maps, and
cytoarchitecture. J Comp Neurol. 359:490–506. 1995.PubMed/NCBI View Article : Google Scholar
|
|
17
|
Vogt BA: Pain and emotion interactions in
subregions of the cingulate gyrus. Nat Rev Neurosci. 6:533–544.
2005.PubMed/NCBI View
Article : Google Scholar
|
|
18
|
Beckmann M, Johansen-Berg H and Rushworth
MF: Connectivity-based parcellation of human cingulate cortex and
its relation to functional specialization. J Neurosci.
29:1175–1190. 2009.PubMed/NCBI View Article : Google Scholar
|
|
19
|
Fan L, Li H, Zhuo J, Zhang Y, Wang J, Chen
L, Yang Z, Chu C, Xie S, Laird AR, et al: The human brainnetome
atlas: A new brain atlas based on connectional architecture. Cereb
Cortex. 26:3508–3526. 2016.PubMed/NCBI View Article : Google Scholar
|
|
20
|
Fan J, McCandliss BD, Sommer T, Raz A and
Posner MI: Testing the efficiency and independence of attentional
networks. J Cogn Neurosci. 14:340–347. 2002.PubMed/NCBI View Article : Google Scholar
|
|
21
|
Manford M, Fish DR and Shorvon SD: An
analysis of clinical seizure patterns and their localizing value in
frontal and temporal lobe epilepsies. Brain. 119:17–40.
1996.PubMed/NCBI View Article : Google Scholar
|
|
22
|
Yan CG, Wang XD, Zuo XN and Zang YF:
DPABI: Data processing and analysis for (Resting-State) brain
imaging. Neuroinformatics. 14:339–351. 2016.PubMed/NCBI View Article : Google Scholar
|
|
23
|
Liao W, Wu GR, Xu Q, Ji GJ, Zhang Z, Zang
YF and Lu G: DynamicBC: A MATLAB toolbox for dynamic brain
connectome analysis. Brain Connect. 4:780–790. 2014.PubMed/NCBI View Article : Google Scholar
|
|
24
|
Lowe MJ, Mock BJ and Sorenson JA:
Functional connectivity in single and multislice echoplanar imaging
using resting-state fluctuations. Neuroimage. 7:119–132.
1998.PubMed/NCBI View Article : Google Scholar
|
|
25
|
Li J, Chen X, Ye W, Jiang W, Liu H and
Zheng J: Alteration of the alertness-related network in patients
with right temporal lobe epilepsy: A resting state fMRI study.
Epilepsy Res. 127:252–259. 2016.PubMed/NCBI View Article : Google Scholar
|
|
26
|
Fan J, McCandliss BD, Fossella J, Flombaum
JI and Posner MI: The activation of attentional networks.
Neuroimage. 26:471–479. 2005.PubMed/NCBI View Article : Google Scholar
|
|
27
|
Li R, Liu K, Ma X, Li Z, Duan X, An D,
Gong Q, Zhou D and Chen H: Altered functional connectivity patterns
of the insular subregions in psychogenic nonepileptic seizures.
Brain Topogr. 28:636–645. 2015.PubMed/NCBI View Article : Google Scholar
|
|
28
|
Heilbronner SR and Hayden BY: Dorsal
anterior cingulate cortex: A bottom-up view. Annu Rev Neurosci.
39:149–170. 2016.PubMed/NCBI View Article : Google Scholar
|
|
29
|
Braem S, King JA, Korb FM, Krebs RM,
Notebaert W and Egner T: The role of anterior cingulate cortex in
the affective evaluation of conflict. J Cogn Neurosci. 29:137–149.
2017.PubMed/NCBI View Article : Google Scholar
|
|
30
|
Boschin EA, Brkic MM, Simons JS and
Buckley MJ: Distinct roles for the anterior cingulate and
dorsolateral prefrontal cortices during conflict between abstract
rules. Cereb Cortex. 27:34–45. 2017.PubMed/NCBI View Article : Google Scholar
|
|
31
|
Cui F, Zhou L, Wang Z, Lang C, Park J, Tan
Z, Yu Y, Sun C, Gao Y and Kong J: Altered functional connectivity
of striatal subregions in patients with multiple sclerosis. Front
Neurol. 8(129)2017.PubMed/NCBI View Article : Google Scholar
|
|
32
|
Yang R, Gao C, Wu X, Yang J, Li S and
Cheng H: Decreased functional connectivity to posterior cingulate
cortex in major depressive disorder. Psychiatry Res Neuroimaging.
255:15–23. 2016.PubMed/NCBI View Article : Google Scholar
|
|
33
|
Vatansever D, Menon DK, Manktelow AE,
Sahakian BJ and Stamatakis EA: Default mode network connectivity
during task execution. Neuroimage. 122:96–104. 2015.PubMed/NCBI View Article : Google Scholar
|
|
34
|
Vogt BA: Midcingulate cortex: Structure,
connections, homologies, functions and diseases. J Chem Neuroanat.
74:28–46. 2016.PubMed/NCBI View Article : Google Scholar
|
|
35
|
Caruana F, Gerbella M, Avanzini P, Gozzo
F, Pelliccia V, Mai R, Abdollahi RO, Cardinale F, Sartori I, Lo
Russo G and Rizzolatti G: Motor and emotional behaviours elicited
by electrical stimulation of the human cingulate cortex. Brain.
141:3035–3051. 2018.PubMed/NCBI View Article : Google Scholar
|
|
36
|
Fox MD, Corbetta M, Snyder AZ, Vincent JL
and Raichle ME: Spontaneous neuronal activity distinguishes human
dorsal and ventral attention systems. Proc Natl Acad Sci USA.
103:10046–10051. 2006.PubMed/NCBI View Article : Google Scholar
|
|
37
|
Bush G, Luu P and Posner MI: Cognitive and
emotional influences in anterior cingulate cortex. Trends Cogn Sci.
4:215–222. 2000.PubMed/NCBI View Article : Google Scholar
|
|
38
|
Vogt BA, Finch DM and Olson CR: Functional
heterogeneity in cingulate cortex: The anterior executive and
posterior evaluative regions. Cereb Cortex. 2:435–443.
1992.PubMed/NCBI View Article : Google Scholar
|
|
39
|
Breton F, Planté A, Legauffre C, Morel N,
Ades J, Gorwood P, Ramoz N and Dubertret C: The executive control
of attention differentiates patients with schizophrenia, their
first-degree relatives and healthy controls. Neuropsychologia.
49:203–208. 2011.PubMed/NCBI View Article : Google Scholar
|
|
40
|
Li W, Qin W, Liu H, Fan L, Wang J, Jiang T
and Yu C: Subregions of the human superior frontal gyrus and their
connections. Neuroimage. 78:46–58. 2013.PubMed/NCBI View Article : Google Scholar
|
|
41
|
Dupont P, Zaknun JJ, Maes A, Tepmongkol S,
Vasquez S, Bal CS, Van Paesschen W, Carpintiero S, Locharernkul C
and Dondi M: Dynamic perfusion patterns in temporal lobe epilepsy.
Eur J Nucl Med Mol Imaging. 36:823–830. 2009.PubMed/NCBI View Article : Google Scholar
|
|
42
|
Pittau F, Grova C, Moeller F, Dubeau F and
Gotman J: Patterns of altered functional connectivity in mesial
temporal lobe epilepsy. Epilepsia. 53:1013–1023. 2012.PubMed/NCBI View Article : Google Scholar
|
|
43
|
Lv ZX, Huang DH, Ye W, Chen ZR, Huang WL
and Zheng JO: Alteration of functional connectivity within
visuospatial working memory-related brain network in patients with
right temporal lobe epilepsy: A resting-state fMRI study. Epilepsy
Behav. 35:64–71. 2014.PubMed/NCBI View Article : Google Scholar
|
|
44
|
Ke M, Jin B, Liu G and Yang X: Impairments
of cingulated cortex in the generalized tonic-clonic seizure
epilepsy by combining morphological and functional connectivity
magnetic resonance imaging. J Integr Neurosci. 16:429–439.
2017.PubMed/NCBI View Article : Google Scholar
|
|
45
|
Casey BJ, Thomas KM, Welsh TF, Badgaiyan
RD, Eccard CH, Jennings JR and Crone EA: Dissociation of response
conflict, attentional selection, and expectancy with functional
magnetic resonance imaging. Proc Natl Acad Sci USA. 97:8728–8733.
2000.PubMed/NCBI View Article : Google Scholar
|
|
46
|
Pardo JV, Fox PT and Raichle ME:
Localization of a human system for sustained attention by positron
emission tomography. Nature. 349:61–64. 1991.PubMed/NCBI View Article : Google Scholar
|
|
47
|
Spreng RN, Stevens WD, Chamberlain JP,
Gilmore AW and Schacter DL: Default network activity, coupled with
the frontoparietal control network, supports goal-directed
cognition. Neuroimage. 53:303–317. 2010.PubMed/NCBI View Article : Google Scholar
|
|
48
|
Labate A, Cerasa A, Aguglia U, Mumoli L,
Quattrone A and Gambardella A: Neocortical thinning in ‘benign’
mesial temporal lobe epilepsy. Epilepsia. 52:712–717.
2011.PubMed/NCBI View Article : Google Scholar
|
|
49
|
Afzali M, Soltanian-Zadeh H and Elisevich
KV: Tract based spatial statistical analysis and voxel based
morphometry of diffusion indices in temporal lobe epilepsy. Comput
Biol Med. 41:1082–1091. 2011.PubMed/NCBI View Article : Google Scholar
|
|
50
|
Tailby C, Kowalczyk MA and Jackson GD:
Cognitive impairment in epilepsy: The role of reduced network
flexibility. Ann Clin Transl Neurol. 5:29–40. 2017.PubMed/NCBI View Article : Google Scholar
|
|
51
|
Raichle ME: The brain's default mode
network. Annu Rev Neurosci. 38:433–447. 2015.PubMed/NCBI View Article : Google Scholar
|
|
52
|
Haneef Z, Lenartowicz A, Yeh HJ, Engel J
Jr and Stern JM: Effect of lateralized temporal lobe epilepsy on
the default mode network. Epilepsy Behav. 25:350–357.
2012.PubMed/NCBI View Article : Google Scholar
|
|
53
|
Hsiao FJ, Yu HY, Chen WT, Kwan SY, Chen C,
Yen DJ, Yiu CH, Shih YH and Lin YY: Increased intrinsic
connectivity of the default mode network in temporal lobe epilepsy:
Evidence from resting-state MEG recordings. PLoS One.
10(e0128787)2015.PubMed/NCBI View Article : Google Scholar
|
|
54
|
Yang H, Zhang C, Liu C, Yu T, Zhang G,
Chen N and Li K: Brain network alteration in patients with temporal
lobe epilepsy with cognitive impairment. Epilepsy Behav. 81:41–48.
2018.PubMed/NCBI View Article : Google Scholar
|
|
55
|
Liu M, Bernhardt BC, Hong SJ, Caldairou B,
Bernasconi A and Bernasconi N: The superficial white matter in
temporal lobe epilepsy: A key link between structural and
functional network disruptions. Brain. 139:2431–2440.
2016.PubMed/NCBI View Article : Google Scholar
|
|
56
|
Khalsa S, Mayhew SD, Chechlacz M, Bagary M
and Bagshaw AP: The structural and functional connectivity of the
posterior cingulate cortex: Comparison between deterministic and
probabilistic tractography for the investigation of
structure-function relationships. Neuroimage. 102:118–127.
2014.PubMed/NCBI View Article : Google Scholar
|
|
57
|
Koshino H, Minamoto T, Yaoi K, Osaka M and
Osaka N: Coactivation of the default mode Network regions and
Working Memory Network regions during task preparation. Sci Rep.
4(5954)2014.PubMed/NCBI View Article : Google Scholar
|
|
58
|
Zhou X, Zhang Z, Liu J, Qin L and Zheng J:
Aberrant topological organization of the default mode network in
temporal lobe epilepsy revealed by graph-theoretical analysis.
Neurosci Lett. 708(134351)2019.PubMed/NCBI View Article : Google Scholar
|
|
59
|
Haneef Z, Lenartowicz A, Yeh HJ, Engel J
Jr and Stern JM: Network analysis of the default mode network using
functional connectivity MRI in temporal lobe epilepsy. J Vis Exp.
90(e51442)2014.PubMed/NCBI View
Article : Google Scholar
|
|
60
|
Zhang Z, Lu G, Zhong Y, Tan Q, Yang Z,
Liao W, Chen Z, Shi J and Liu Y: Impaired attention network in
temporal lobe epilepsy: A resting FMRI study. Neurosci Lett.
458:97–101. 2009.PubMed/NCBI View Article : Google Scholar
|
|
61
|
Li X, Hou Y, Ren Y, Tian X and Song Y:
Alterations of theta oscillation in executive control in temporal
lobe epilepsy patients. Epilepsy Res. 140:148–154. 2018.PubMed/NCBI View Article : Google Scholar
|
|
62
|
Hampson M, Driesen NR, Skudlarski P, Gore
JC and Constable RT: Brain connectivity related to working memory
performance. J Neurosci. 26:13338–13343. 2006.PubMed/NCBI View Article : Google Scholar
|
|
63
|
Gregory S, Long JD, Tabrizi SJ and Rees G:
Measuring compensation in neurodegeneration using MRI. Curr Opin
Neurol. 30:380–387. 2017.PubMed/NCBI View Article : Google Scholar
|
|
64
|
Spagna A, Kim TH, Wu T and Fan J: Right
hemisphere superiority for executive control of attention. Cortex.
Dec 29. 2018.(Epub ahead of print). doi:
10.1016/j.cortex.2018.12.012. PubMed/NCBI View Article : Google Scholar
|
|
65
|
Chiang S, Stern JM, Engel J Jr, Levin HS
and Haneef Z: Differences in graph theory functional connectivity
in left and right temporal lobe epilepsy. Epilepsy Res.
108:1770–1781. 2014.PubMed/NCBI View Article : Google Scholar
|