Introduction
Due to the rapid development of medical imaging
technology, the clinical detection of thyroid nodules has increased
worldwide, allowing for higher rates of thyroid cancer diagnosis
(1-3).
Acar et al (4) reported 51%
of patients who had been referred to their radiology department
undergoing high-resolution ultrasonography (US) were found to have
at least one thyroid nodule. Managing these thyroid nodules, making
a treatment plan and predicting patient prognosis all require the
clinician to accurately distinguish malignant from benign nodules,
which remains a challenge for both doctors and sonographers
(5). Medical imaging is critical to
the diagnosis of thyroid nodules. However, the limited resolution
of cross-sections from computed tomography, magnetic resonance
imaging and positron emission tomography provide little useful
information for the diagnosis of small nodules (6-8).
Technological advances, including higher resolution and
reproducibility, and the advantages associated with the lack of
radiation, have pushed US imaging toward the frontline of
differential diagnosis. The use of high-resolution US could remove
the need for excessive fine needle aspiration (FNA) and also supply
information for the design of appropriate surgical programs for
cases of undetermined cytology (9).
In the past several years, the US-based diagnosis of
thyroid nodules has relied primarily upon conventional gray-scale
US. Using this method, malignancy was shown to be associated with
hypoechogenicity, height greater than length, blur margin and
micro-calcification (10,11). However, small nodules, which make up
the majority of observed nodules, appear with more atypical
features on conventional gray-scale US. Fortunately, new US
techniques have been developed and clinically applied. For example,
contrast-enhanced US (CEUS) employs a microbubble agent to enhance
the backscatter signals of red blood cells and can be used to
characterize local vascular perfusion. Several studies have
explored the perfusion patterns of thyroid nodules using CEUS
(12-14).
Elastosonography (ES) can be used to estimate malignancy by
assessing the hardness of tissues (15). Although the diagnostic accuracy of ES
alone is not optimal, the information it supplies is useful when
combined with that obtained via other US techniques (16). These advanced integrative techniques
reportedly improved the diagnostic accuracy of the thyroid image
reporting and data system (TI-RADS) (17). However, to the best of our knowledge,
no previous study has provided a systematic method for integrating
US parameters from multiple techniques; physicians and sonographers
are sometimes overwhelmed by the large amount of information
acquired (18).
In the present preliminary study, to establish an
efficient strategy for differential diagnosis of thyroid nodules
using a combination of US techniques, multiple features presented
by conventional gray-scale US, color Doppler US (CDUS), ES and CEUS
were assessed using univariate and multivariate logistic
regression. The significant factors obtained were then integrated
using a decision tree (DT) model.
Materials and methods
Patients
The current study was approved by The Ethics
Committee of the First Affiliated Hospital of the Fourth Military
Medical University and approval for using the medical records of
the patients was acquired. Patients who had undergone thyroid US
examination in the department of ultrasound in Xijing Hospital
during the period between January 2014 and January 2016 were
enrolled retrospectively, according to the following criteria: i)
The diagnosis of nodules was confirmed using pathological results
after surgery or cytological evidence after FNA; and ii) these
nodules were scanned using 2D gray-scale US, CDUS, CEUS and ES. The
scanning sequence of 2D gray-scale US, CDUS, CEUS and ES had no
influence on results. The images from the patients were
retrospectively reviewed for analysis.
Patients were excluded if no pathological or
cytological results had been acquired, or if a US scan was not
available due to patient refusal or inappropriate physiological
conditions, such as nodules that were too large to be measured on
ES or unsuppressed swallowing action.
The final cohort included 296 patients with 321
nodules, the final diagnosis of which was confirmed by pathology
after surgery (n=289) and cytology after FNA (n=32; Table I). Taking into consideration the
pathological, cytological and laboratory results, 24 of the 321
nodules in this study were confirmed as inflammatory nodules caused
by Hashimoto's thyroiditis, subacute thyroiditis or granuloma. Of
321 nodules, 222 (74 benign and 148 malignant) were used to build
the DT model. The other 99 nodules (27 benign and 72 malignant)
were used to assess the diagnostic accuracy of the DT model.
 | Table IFinal diagnosis of nodules. |
Table I
Final diagnosis of nodules.
| Final diagnosis | Total no. of
nodules | Pathological
category | No. of nodules |
|---|
| Histological results
after surgery | 289 | Follicular
carcinomas | 5 |
| | | Medullary
carcinoma | 1 |
| | | Papillary
carcinomas | 204 |
| | | Nodular goiter | 51 |
| | | Adenoma | 5 |
| | | Inflammatory changes
(Hashimoto's thyroiditis, subacute thyroiditis or granuloma) | 23 |
| Cytological results
after FNA | 32 | Benign follicular
epithelial cells | 31 |
| | | Papillary
carcinomas | 1 |
The excluded cases included 10 nodules that could
not be measured using ES because of maximum diameters >3.5 cm,
three nodules that yielded unsatisfactory ES images because of
their isthmus location, and four nodules with unsuccessful CEUS
cineloops owing to unsuppressed swallowing behavior.
Equipment and US examination
The patients were positioned in a supine position
with their necks hyperextended to expose the anterior cervical
region. The Mylab™ 90 (Esaote SpA) ultrasound image
system was used for US examination, the L522 probe (4-9 MHz; Esaote
SpA) for CEUS and the L523 probe (7.5-13.0 MHz, Esaote SpA) for
conventional gray-scale US, CDUS and ES. Conventional gray-scale US
was performed to count, localize and characterize nodules. The CDUS
scale was set at 5 cm/sec. Real-time ES was completed manually
using a vibrating transducer (Esaote SpA). The rectangular region
of interest was set to include the nodule as well as surrounding
areas. The degree of tissue hardness was indicated by a color
scale, wherein blue represented hard and red soft. Images from
conventional gray-scale US, CDUS and ES were stored for later
use.
For CEUS, the contrast agent SonoVue®
(Bracco Imaging SpA) was administered through a forearm vein in a
bolus of 1 ml followed by 5 ml of 0.9% saline. The cineloops from
0-90 sec after agent administration were stored. If multiple
lesions existed, only one or two suspicious or representative
nodules were scanned, because microbubbles emerge in thyroid tissue
for only seconds and because the injection times were limited. One
sonographer with 10 years of experience in US examination, who was
blinded to all patient data, performed all four techniques.
Image analysis
The four categories of images (conventional
gray-scale US, ES, CDUS and CEUS) were reviewed offline by two
sonographers, each with 15 years of experience in US examination.
The analysis of each category was separated by 2 weeks to avoid
recall bias. The reviewers were blinded to clinical history, the
results of other examinations and pathology. Any disagreement
between reviewers was settled by consultation with a third
sonographer.
The parameters of the four imaging techniques are
shown in Table II. The CEUS
procedure occurred in three phases: The early phase, comprising the
initial microbubble appearance to ~2 sec later; the peak phase, at
the time-point when the enhancement intensity of nodules reached
its maximum; and the late phase, from ~5 sec after the peak phase
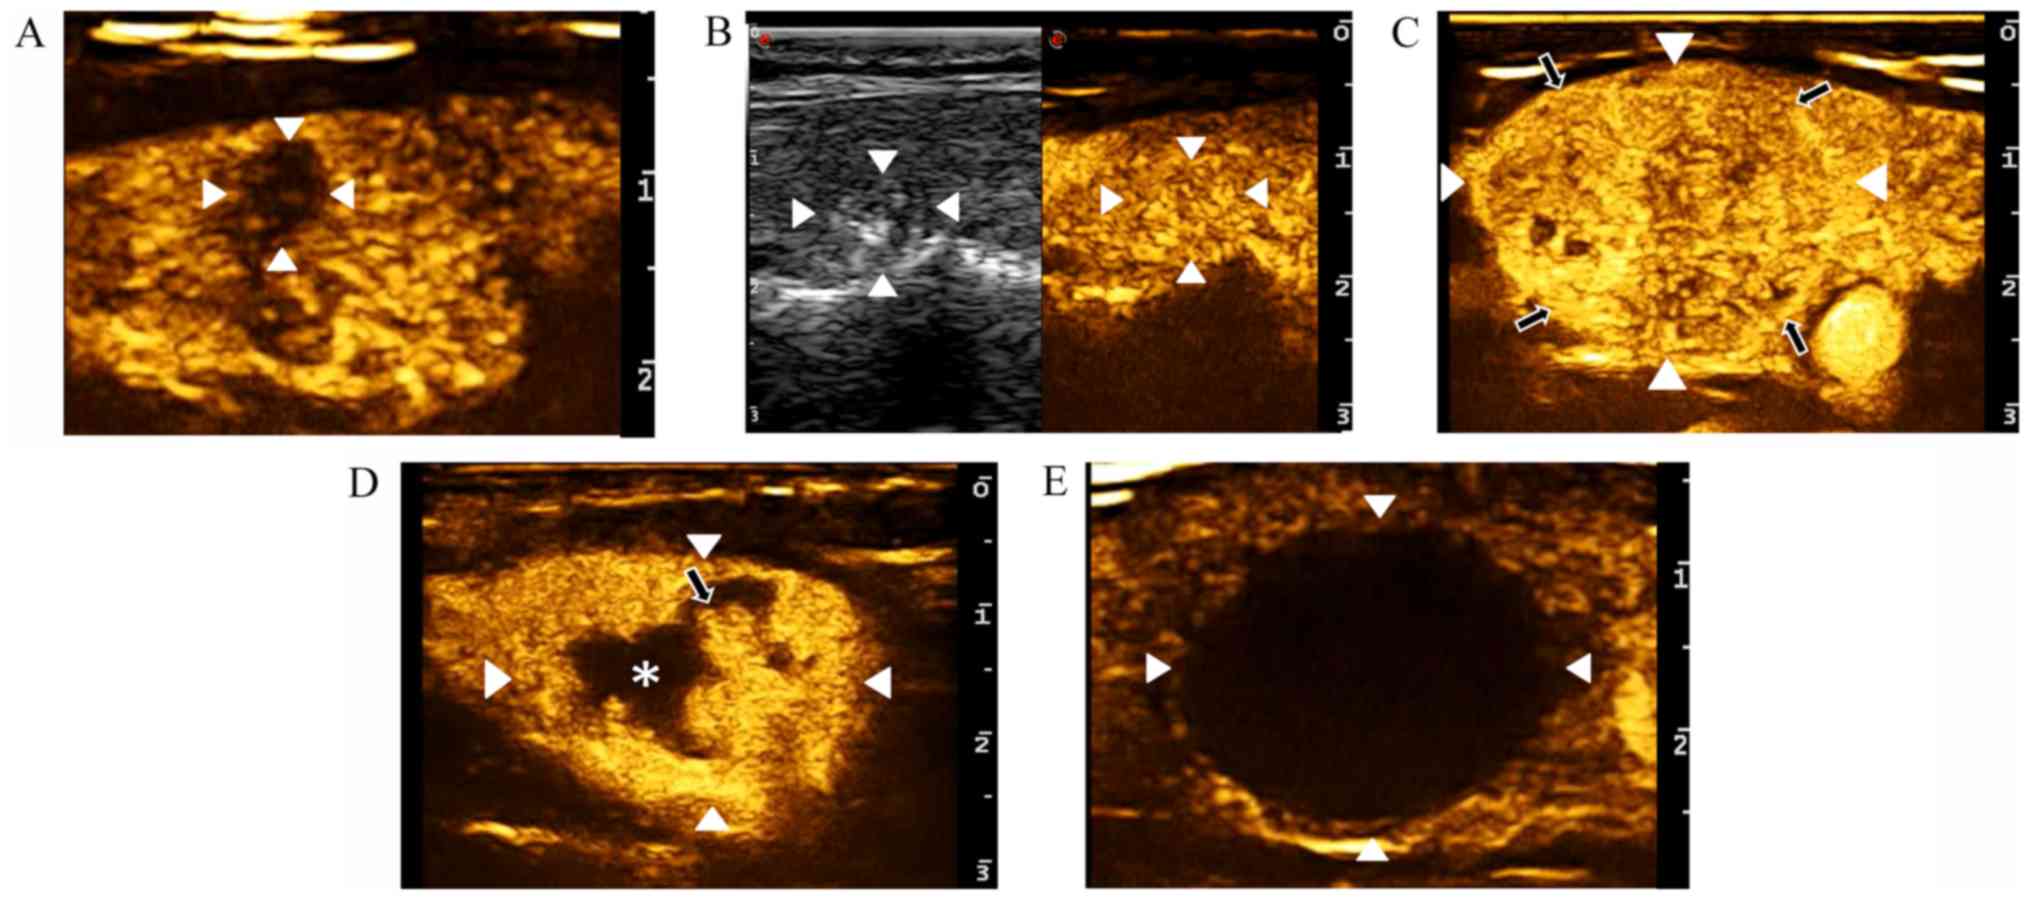
to the end of the recording. Each phase exhibited unique
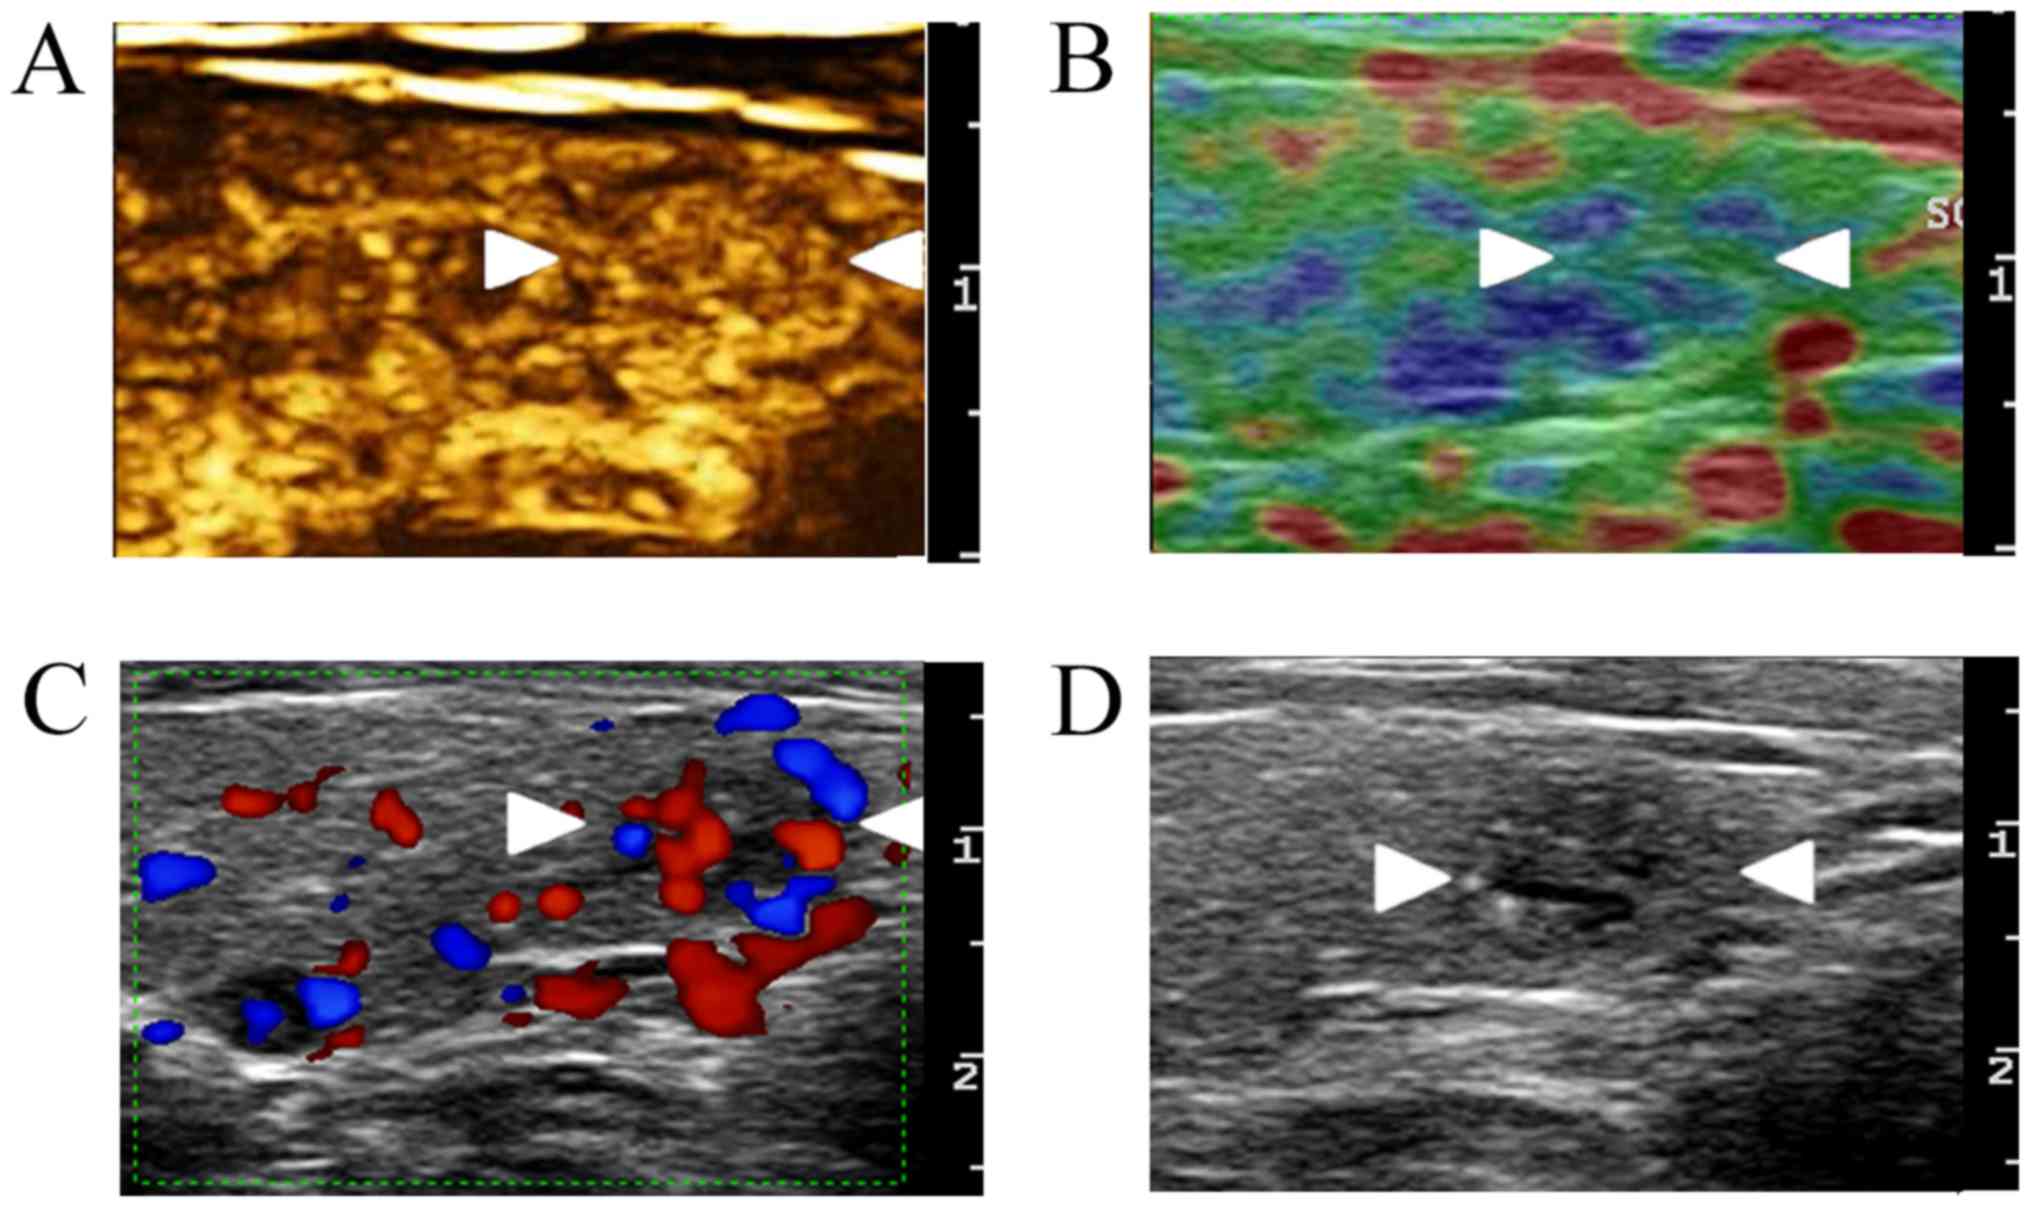
enhancement patterns. Pattern I was characterized by heterogeneous
hypoenhancement (echogenicity less than that of surrounding thyroid
tissue; Fig. 1A), Pattern II by
homogeneous isoenhancement (echogenicity equal to that of
surrounding thyroid tissue; Fig. 1B)
and Pattern III by homogeneous enhancement with ring-like
surrounding vascularity (Fig. 1C),
mixed island-like enhancement (Fig.
1D) or no perfusion (Fig. 1E).
Mixed island-like enhancement describes conditions in which
perfusion within the nodules contains an anechoic portion (also
termed a ‘lake’) and a portion with echogenicity equal to that of
the surrounding thyroid tissue (also termed an ‘island’; Fig. 1D); these two areas are clearly
demarcated.
| Table IICategories and parameters assessed on
2D gray-scale US, CD US, elastosonography and CE US. |
Table II
Categories and parameters assessed on
2D gray-scale US, CD US, elastosonography and CE US.
| A, Demographic
data |
|---|
| Parameter | Benign (n=74) | Malignant
(n=148) | P-value |
|---|
| Sex | | | 0.646a |
|
Male | 16 | 38 | |
|
Female | 58 | 110 | |
| Age | 45.9±11.3 | 43.5±11.5 | 0.136b |
| Nodule number | | | 0.886b |
|
Multiple | 43 | 83 | |
|
Single | 31 | 65 | |
| Diameter mm | 1.98±1.14 | 0.87±0.46 |
<0.001b |
| B, CE US |
| Parameter | Benign (n=74) | Malignant
(n=148) | P-value |
| Early phase | | |
<0.001a |
|
Pattern
I | 11 | 120 | |
|
Pattern
II | 22 | 27 | |
|
Pattern
III | 41 | 1 | |
| Peak phase | | |
<0.001a |
|
Pattern
I | 10 | 114 | |
|
Pattern
II | 12 | 33 | |
|
Pattern
III | 52 | 1 | |
| Late phase | | |
<0.001a |
|
Pattern
I | 19 | 107 | |
|
Pattern
II | 27 | 35 | |
|
Pattern
III | 28 | 6 | |
| C, Conventional
gray-scale US |
| Echogenecity | | |
<0.001a |
|
Pattern A:
Hyper-/iso-echogenecity; or mixed with anechogenecity | 39 | 3 | |
|
Pattern B:
Hypoechogenicity similar to that of SCM | 9 | 22 | |
|
Pattern C:
Echogenicity lower than that of SCM | 26 | 123 | |
| Halo ring | | |
<0.001a |
|
Yes | 34 | 9 | |
|
No | 40 | 139 | |
| Margin | | |
<0.001a |
|
Clear | 50 | 32 | |
|
Unclear | 24 | 116 | |
| Shape | | |
<0.001a |
|
Regular | 50 | 17 | |
|
Irregular | 24 | 131 | |
| A/T ratio | | | 0.005a |
|
≥1 | 26 | 82 | |
|
<1 | 48 | 66 | |
| Diffuse
disease | | | 0.503a |
|
Yes | 15 | 37 | |
|
No | 59 | 111 |
|
Micro-calcification | | |
<0.001a |
|
Yes | 8 | 79 | |
|
No | 66 | 69 | |
| D. ES. |
| Elasticity
ratio | 1.37±0.39 | 1.86±0.91 |
<0.001b |
| Area ratio (%) | 35.09±21.63 | 50.19±25.25 |
<0.001b |
| E. CD US. |
| Blood flow
extent | | |
<0.001b |
|
Low: A
little ‘dot-like’ blood flow detected | 23 | 125 | |
|
Moderate:
Area of vascularity detected occupied about one-half of the
nodules | 34 | 11 | |
|
High: Area
of vascularity was demonstrated in more than one-half of
nodules | 17 | 11 | |
| Central
vessels | | |
<0.001b |
|
Yes | 46 | 30 | |
|
No | 28 | 118 | |
| Surrounding
vascular ring | | |
<0.001b |
|
Yes | 46 | 7 | |
|
No | 28 | 141 | |
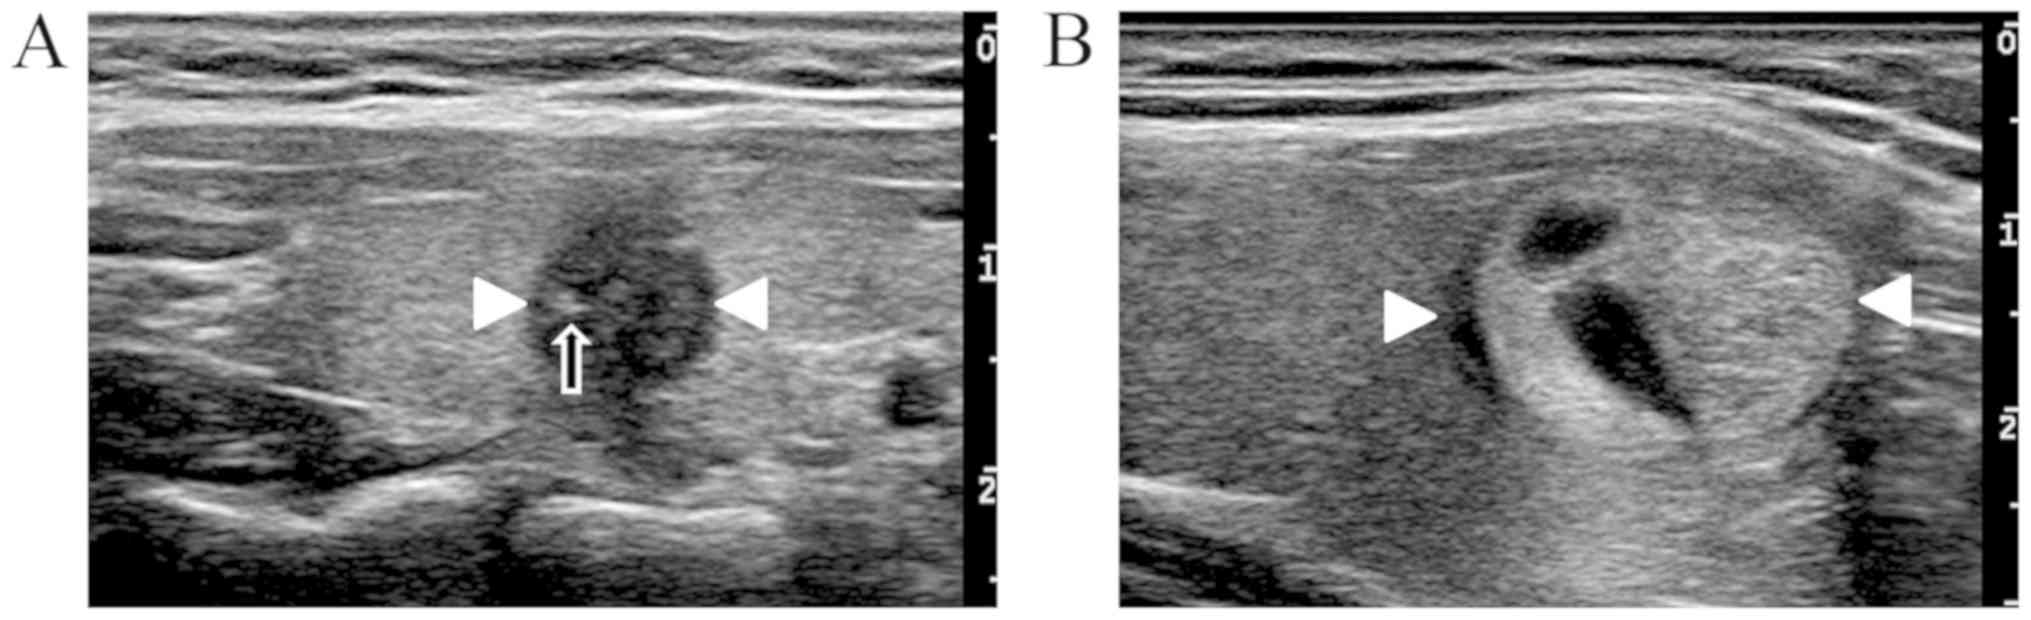
On conventional gray-scale US, echogenicity was
categorized as follows: Pattern A, hyperechogenecity higher than or
isoechogenecity equal to that of the surrounding thyroid tissue, or
mixed with an echogenecity; Pattern B, hypoechogenicity, similar to
that of the sternocleidomastoid (SCM); and Pattern C,
hypoechogenicity lower than that of the SCM. Additional nodule
parameters investigated included shape, margin, halo ring
(hypoechoic area surrounding the nodules), micro-calcification and
ratio of anteroposterior to transverse dimension (A/T ratio;
Fig. 2). Diffuse change (the
heterogeneous echogenicity of surrounding thyroid tissue) was also
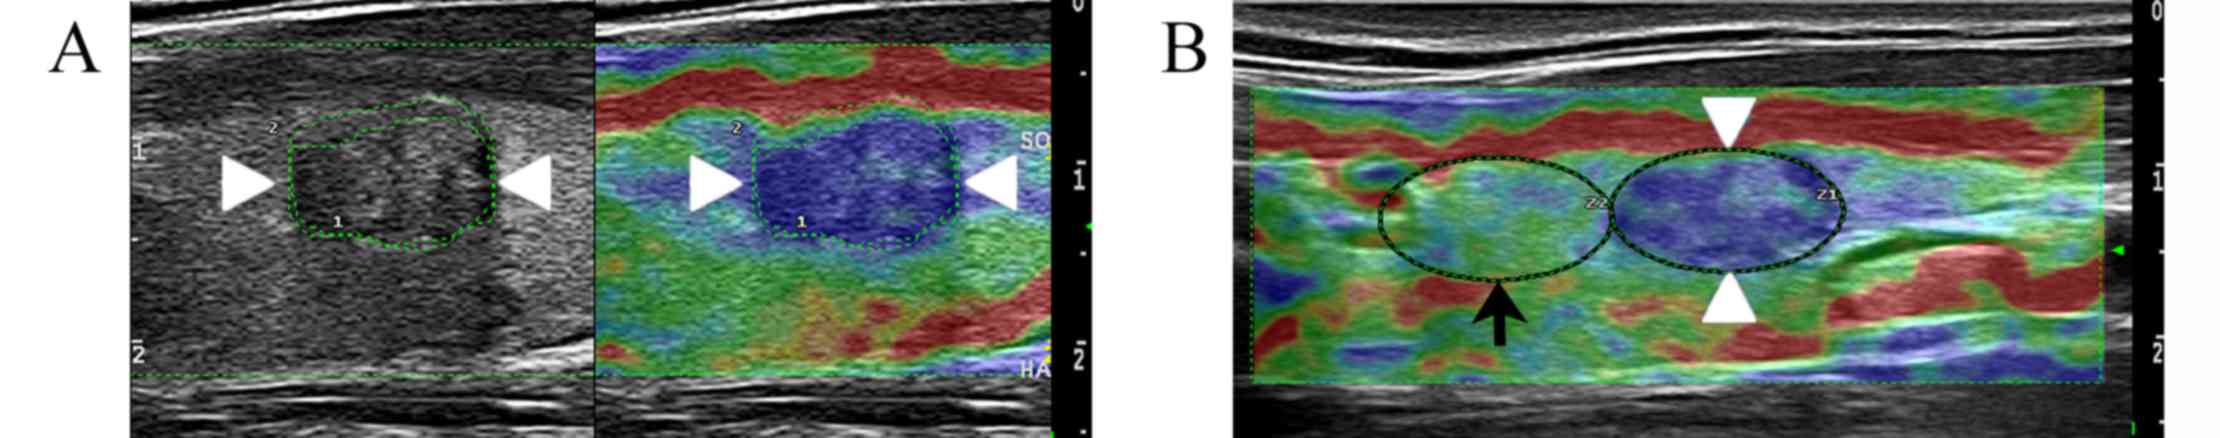
evaluated. On ES, the area ratio was calculated as the area of blue
(high tissue hardness) within the nodule divided by the area of the
entire nodule (Fig. 3A). Areas were
manually traced by two sonographers using US equipment. After
tracing, the area ratio was calculated automatically on-site. To
calculate the elasticity index, an elliptical region of interest
was manually adjusted in size so that it contained the entire
nodule. The elasticity index was calculated as nodule elasticity
divided by the elasticity of surrounding areas at similar depth
(Fig. 3B). Each nodule was traced
five times by each sonographer. The average result was
recorded.
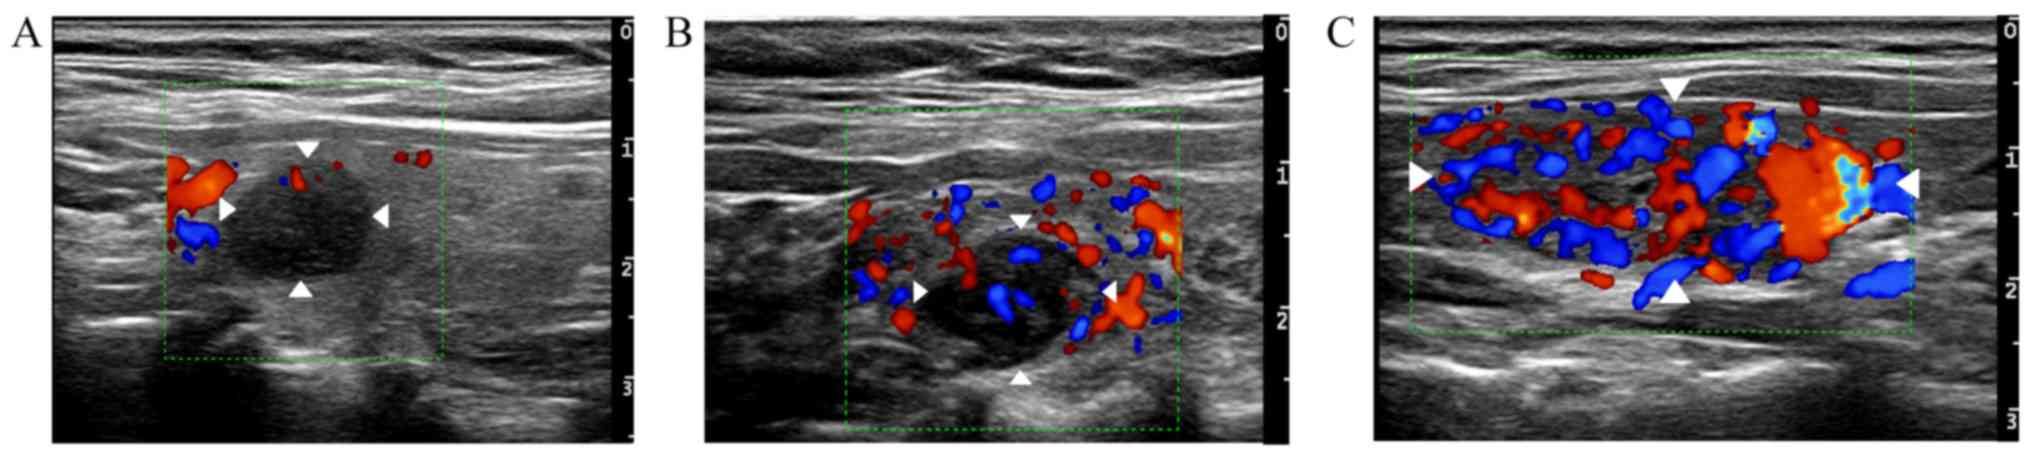
On CDUS, the extent of blood flow was defined as
either low (minimal ‘dot-like’ blood flow detected), moderate (area
of vascularity occupied about half the nodule), or high (area of
vascularity covered more than half the nodule; Fig. 4). The presence of central vessels
within nodules as well as ‘ring-like’ vascularity surrounding
nodules was additionally reviewed.
Statistical analysis
All statistical analyses were performed using SPSS
13.0 (SPSS, Inc.) software. Descriptive analysis was performed
using an independent sample t-test for continuous variables and the
χ2 test for categorical variables. Univariate logistic
analysis was used to select the parameters with significance
(P<0.10). Multivariate logistic analysis was then used to
identify factors with the strongest association (P<0.05).
Finally, exhaustive χ2 Automatic Interaction Detection
analysis was used to develop the DT using the data of the 222
nodules collected between January 2014 and April 2015. In the
current study, any nodes with <10 subjects were considered as
the final stop; there were at least five subjects in each leaf.
For elasticity index and area ratio on ES, the
receiver operating characteristic (ROC) curve was used to determine
the cutoff point, which was employed to change continuous variables
to categorical variables when the DT model was set.
Characteristics of the DT, including sensitivity,
specificity, positive predictive value, negative predictive value
and their 95% confidence intervals (CI), were calculated using the
data of the 99 nodules collected between May 2015 and January
2016.
The statistical analysis of the present manuscript
included two parts, the first was to establish a DT algorithm using
the data of 222 nodules; the second was to verify the diagnostic
accuracy of the DT algorithm by using the data of 99 nodules.
Results
The demographic data and features of the US images
obtained for 289 nodules are shown in Table I.
For ES as a continuous variable, the cutoff point
obtained using the ROC curve was 46.5% for area ratio and 1.215 for
elasticity index. According to these values, area ratio was divided
into two groups: ≥46.5% (55 benign and 93 malignant) and <46.5%
(56 benign and 18 malignant). Elasticity index was categorized as
follows: ≥1.215 (33 benign and 115 malignant) and <1.215 (38
benign and 36 malignant), which was used for logistic analysis
(Table II).
After univariate logistic analysis, as indicated in
Table II, the P-values for sex,
number of nodules and diffuse disease were >0.1 and so these
factors were excluded from further analysis. The following
parameters, with P<0.001, were employed for multivariate
logistic analysis: Diameter, echogenicity, ring-halo sign, margin,
shape, A/T ratio, micro-calcification, extent of blood flow,
central vessels, surrounding vascularity, area ratio, elasticity
index and enhancement patterns during the early, peak and late
phases. The results of the multivariate logistic analysis
demonstrated the significant effects of four parameters (Table III), which were selected for use in
developing the DT (Fig. 5).
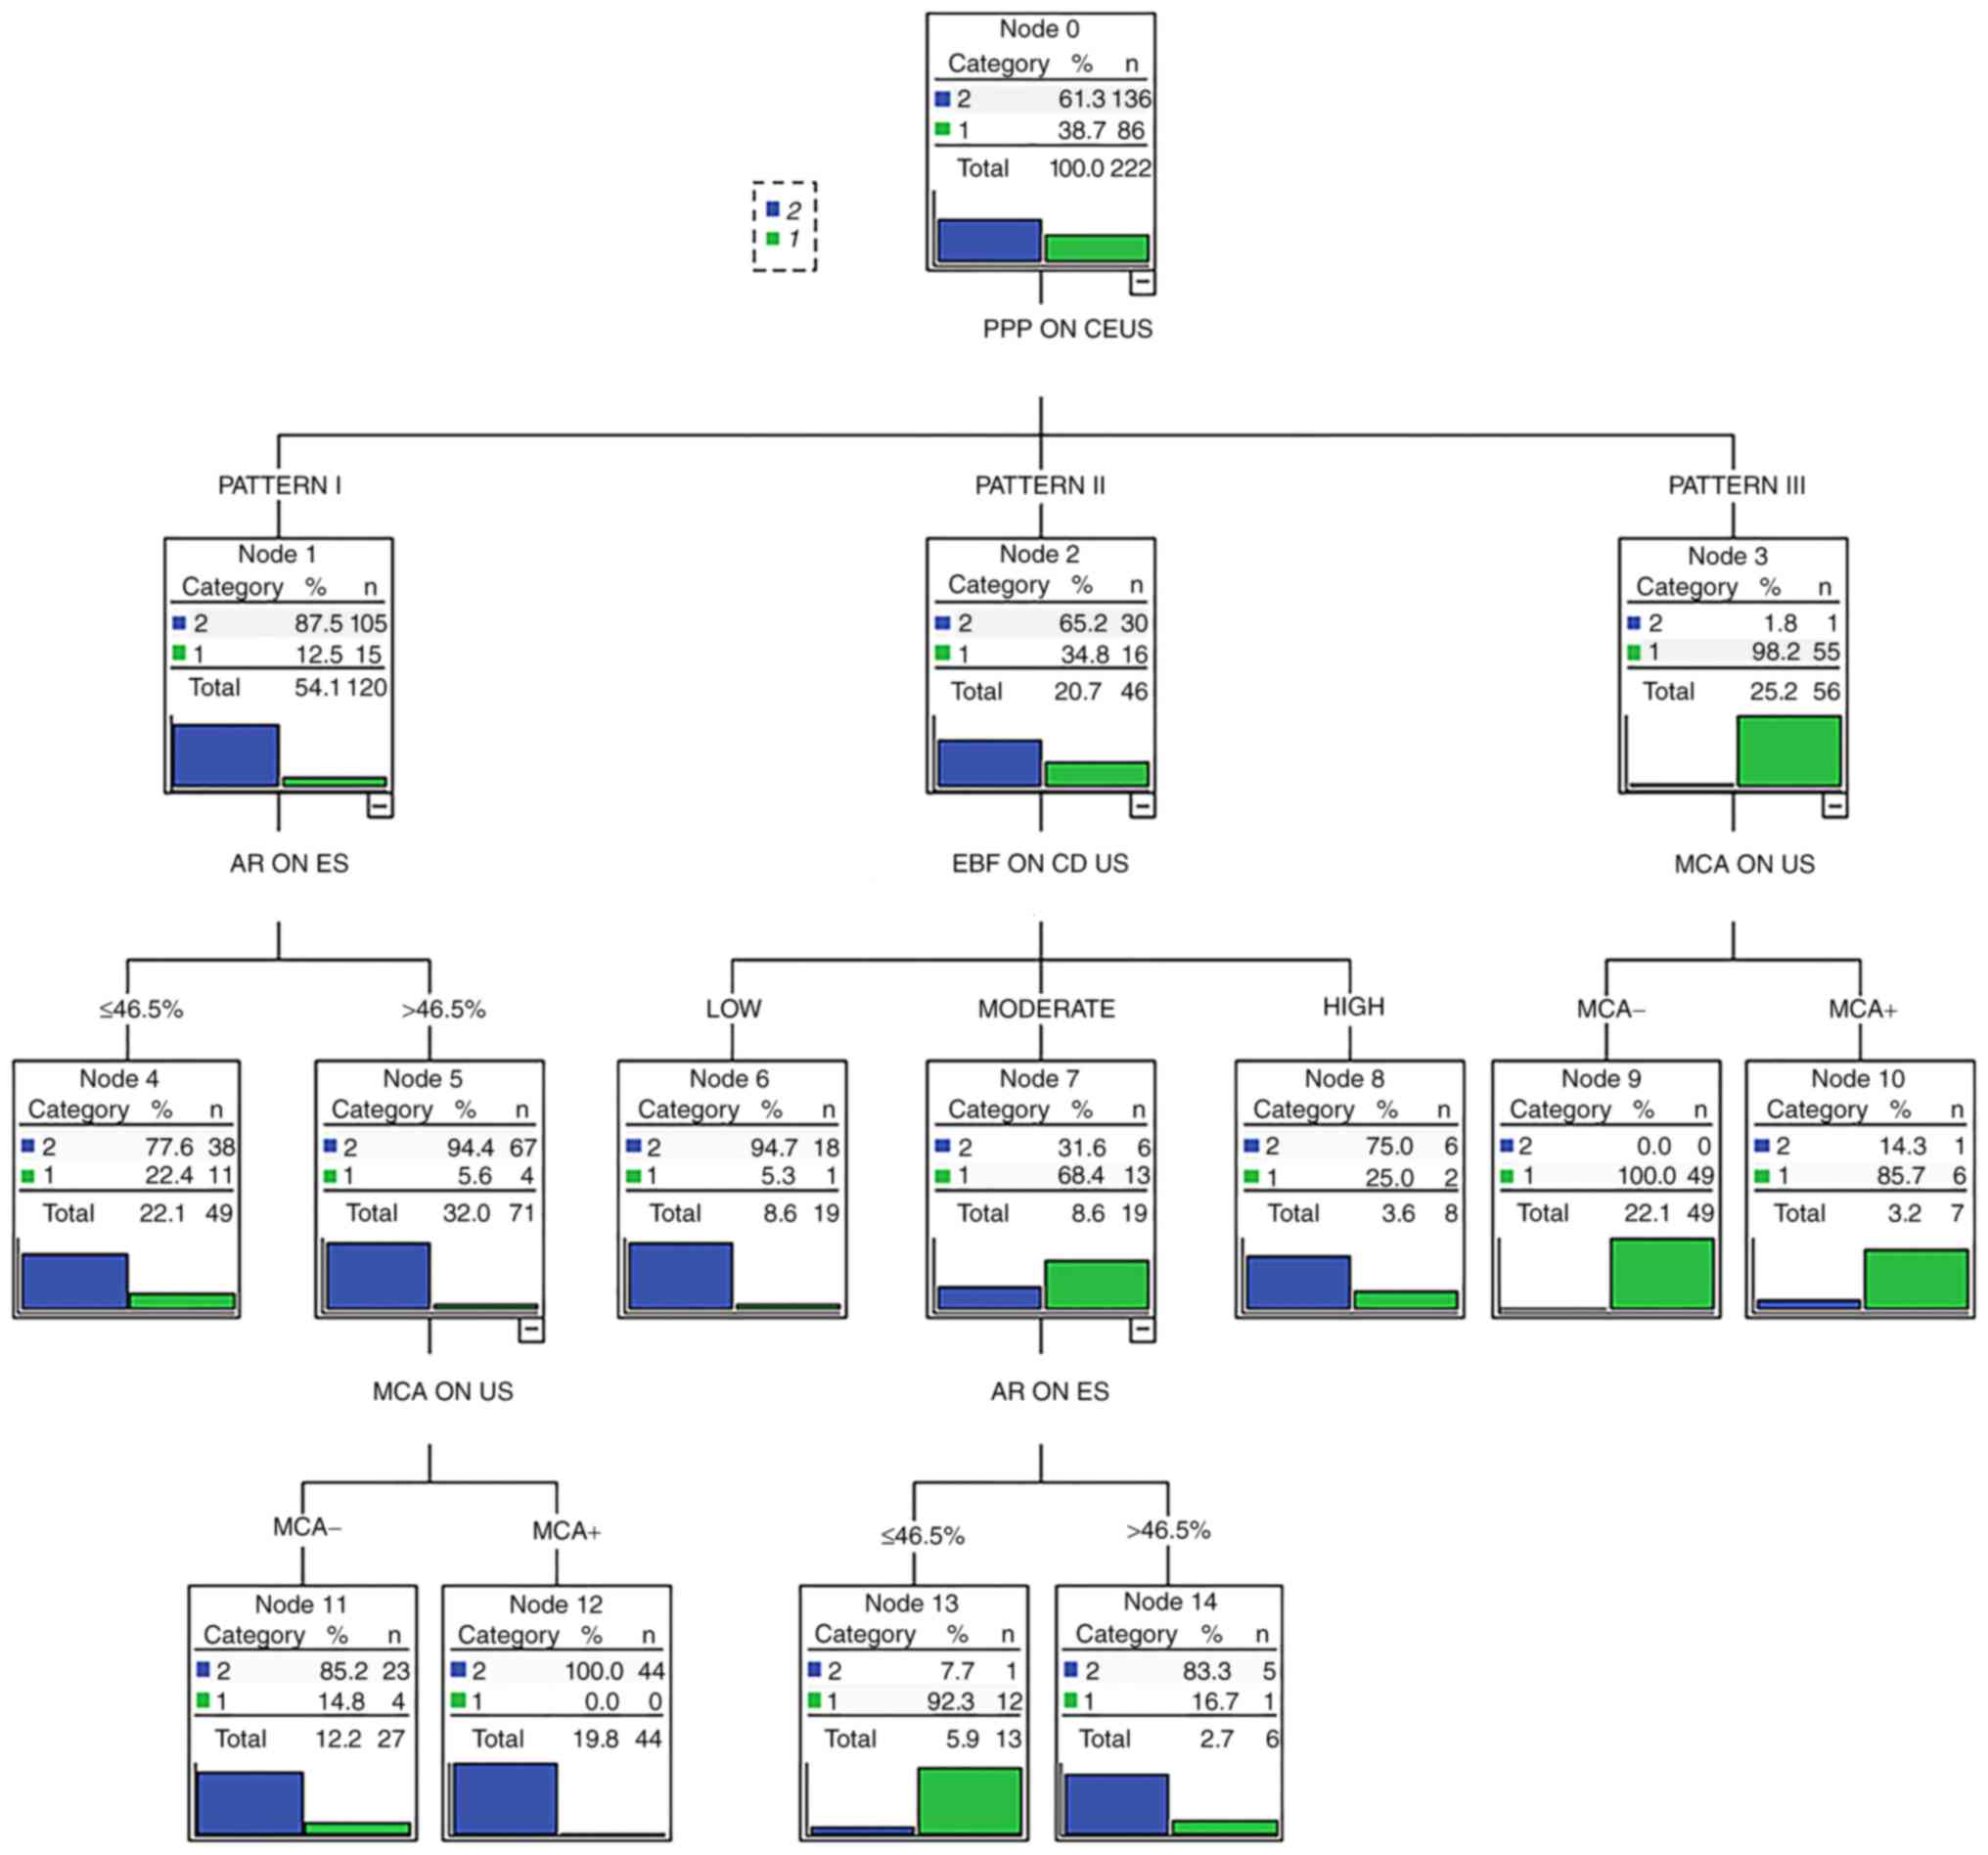 | Figure 5Decision tree obtained using
parameters from gray-scale US, color Doppler US, ES and CEUS.
Pattern I, heterogeneous hypoenhancement on CEUS. Pattern II,
homogeneous isoenhancement on CEUS. Pattern III, homogeneous
enhancement with ring-like surrounding vascularity, mixed
island-like enhancement, or no perfusion on CEUS. PPP, peak phase
pattern; AR, area ratio; CEUS, contrast-enhanced ultrasonography;
ES, elastosonography; EBF, extent of blood flow; US,
ultrasonography; MCA, micro-calcification. |
| Table IIIParameters selected for use in
developing the decision tree after multivariate logistic
analysis. |
Table III
Parameters selected for use in
developing the decision tree after multivariate logistic
analysis.
| Parameters | P-value | Odds ratio | 95% confidence
interval |
|---|
| Peak-phase patterns
on contrast enhanced ultrasonography | <0.01 | 245.52 | 23.72-2541.63 |
| Area ratio on
ES | 0.03 | 3.26 | 1.10-9.71 |
| Extent of blood
flow | <0.01 | 0.144 | 0.02-1.12 |
| Micro-calcification
on conventional gray-scale ultrasonography | 0.015 | 4.73 | 1.35-16.61 |
In the DT, peak-phase patterns on CEUS were
evaluated as the first step, followed by area ratio on ES. CDUS and
micro-calcification on conventional gray-scale US were then used
for further diagnosis (Fig. 5). When
the DT was retrospectively applied to the pathology or cytology
results of the 99 test nodules, it displayed a sensitivity of 98.6%
(95% CI: 91.6-99.9%), specificity of 80.1% (95% CI: 60.0-92.7%),
positive predictive value of 93.5% (95% CI: 84.8-97.6%) and
negative predictive value of 95.5% (95% CI: 75.1-99.8%) (Fig. 6).
Discussion
US techniques offer much useful information for
differentiating benign from malignant thyroid nodules (19,20).
However, in some cases the information obtained from various US
techniques can be contradictory and these various pieces of
information need to be integrated efficiently. Although the
combined application of multiple US techniques has been reported
previously (21,22), the current study established a novel
algorithm to integrate four different techniques to improve the
differential diagnosis of thyroid nodules.
CEUS patterns have been shown to be useful in
differentiating benign from malignant thyroid lesions (23-25).
Ring enhancement was mostly considered a predictive sign of
benignity, whereas heterogeneous hypoenhancement was predictive of
malignant lesions (24,25). The results of the present study were
consistent with these findings, and malignant nodules were also
detectable by homogeneous isoenhancement. Some inflammatory nodules
presented hypoenhancement similar to that of malignant nodules.
Thus, the CEUS patterns of thyroid nodules with overlapping
characteristics between benign and malignancy appear to be
relatively more complex than those of liver lesions. Additional
parameters will need to be considered for the development of a
thorough predictive model.
Previously developed algorithms for diagnosing
thyroid nodules have integrated ES analysis (26,27). In
a study of 141 nodules, most of the benign nodules scored in the
range 2-3, while malignant nodules scored ~5(26). Giusti et al (28) reported that the information added by
CEUS is less sensitive than that provided by US and ES. However,
the results of that study may have been influenced by the
relatively small number of malignant lesions. In the current study,
area ratio was found to be a useful factor in logistic multivariate
regression. In the DT algorithm, nodules with homogenous
isoenhancement, moderate blood flow and ES area ratio >46.5%
were classified as malignant.
On conventional gray-scale US, spongiform and cystic
features seem to provide sufficient information to confidently rule
out cancer (29) and calcification
is regarded as a significant indicator of malignancy (30). In the current study, on conventional
gray-scale US only ‘micro-calcification’ was included in the final
algorithm, while shape, margin and echogenicity were excluded. This
may be explained in several ways. First, there could be a parallel
statistical influence of a given parameter on multiple techniques.
For example, the US ‘halo-ring’ may also be related to ring
enhancement on CEUS. Second, in this retrospective study, some
patients underwent CEUS only after uncovering an atypical
appearance using conventional gray-scale US. Thus, the data from
conventional gray-scale US were not necessarily the most useful.
Finally, 52 of 222 nodules were depicted with diffuse changes to
the thyroid gland, influencing appearance and the diagnostic
accuracy of conventional gray-scale US.
As some nodules appear to show atypical features on
conventional gray-scale US, especially in the background of an
inflamed thyroid, it has always been a challenge to confirm
diagnosis using conventional gray-scale US. In the current study,
18 of these 24 inflammatory nodules were depicted with
hypoenhancement with a low to medium level of blood flow, a similar
appearance to that observed in malignant nodules. However, most of
these nodules (15 of 18) had an area ratio <46.5% on ES, which
meant there was low stiffness within these nodules, implying
benignity. These findings imply that a DT algorithm combining four
US techniques may supply a new method for the diagnosis of
inflammatory nodules.
The current preliminary study has several
limitations. First, as this is a retrospective study, the patients
were examined as part of routine work and their images were
reviewed. Therefore, the number of nodules was limited as cases
lacking pathological or cytological results were excluded. Second,
nodules identified as ‘typical’ by US were not further examined
using CEUS and thus were not included in this study, perhaps
influencing the results of the DT. Finally, in testing 99 nodules
with the final DT, five nodules were falsely identified as
malignant, including four with diameter <10 mm. One false benign
nodule <10 mm in diameter presented isoenhancement on CEUS. The
results of this study therefore need to be verified in more
patients and future analysis of typical and very small nodules
would be beneficial.
In conclusion, combining the parameters available on
CEUS, conventional gray-scale US and ES with CDUS in this
preliminary study allowed establishment of a DT algorithm that
could be helpful for the differential diagnosis of thyroid nodules.
Use of this algorithm could allow clinicians to integrate
information from multiple US techniques and clarify an otherwise
ambiguous diagnosis, leading to improved treatment options and
prognosis.
Acknowledgements
Not applicable.
Funding
This study was funded by the financial support of
the National Natural Science Fund (grant no. 81671691).
Availability of data and materials
The datasets used and/or analyzed during the current
study are available from the corresponding author on reasonable
request.
Authors' contributions
WL was responsible for the study design, data
analysis, data acquisition and manuscript preparation. YZ was
responsible for study design, data analysis and manuscript
preparation. JY was responsible for data analysis and manuscript
editing. XY was responsible for literature research and data
acquisition. LP was responsible for acquisition of data, data
analysis and manuscript editing. LD was responsible for statistical
analysis and the layout and correction of the parts of the article.
PZ was responsible for data analysis and figure adjustment. LL was
responsible for manuscript editing and data acquisition. XZ was
responsible for the study design and data analysis, is the
guarantor of the integrity of the entire study and gave manuscript
final version approval.
Ethics approval and consent to
participate
This study was approved by The Ethics Committee of
the First Affiliated Hospital of the Fourth Military Medical
University and the requirement for patients to provide written
informed consent was waived by the hospital because this was a
retrospective study.
Patient consent for publication
Not applicable.
Competing interests
The authors declare that they have no competing
interests.
References
|
1
|
Moon WJ, Baek JH, Jung SL, Moon WJ, Baek
JH, Jung SL, Kim DW, Kim EK, Kim JY, Kwak JY, et al:
Ultrasonography and the ultrasound-based management of thyroid
nodules: Consensus statement and recommendations. Korean J Radiol.
12:1–14. 2011.PubMed/NCBI View Article : Google Scholar
|
|
2
|
Wang Y and Wang W: Increasing incidence of
thyroid cancer in Shanghai. China, 1983-2007. Asia Pac J Public
Health. 27:NP223–NP229. 2015.PubMed/NCBI View Article : Google Scholar
|
|
3
|
Kitahara CM and Sosa JA: The changing
incidence of thyroid cancer. Nat Rev Endocrinol. 12:646–653.
2016.PubMed/NCBI View Article : Google Scholar
|
|
4
|
Acar T, Ozbek SS and Acar S: Incidentally
discovered thyroid nodules: Frequency in an adult population during
Doppler ultrasonographic evaluation of cervical vessels. Endocrine.
45:73–78. 2014.PubMed/NCBI View Article : Google Scholar
|
|
5
|
Paschke R, Hegedüs L, Alexander E, Valcavi
R, Papini E and Gharib H: Thyroid nodule guidelines: Agreement,
disagreement and need for future research. Nat Rev Endocrinol.
7:354–361. 2011.PubMed/NCBI View Article : Google Scholar
|
|
6
|
Hoang JK, Riofrio A, Bashir MR, Kranz PG
and Eastwood JD: High variability in radiologists' reporting
practices for incidental thyroid nodules detected on CT and MRI.
AJNR Am J Neuroradiol. 35:1190–1194. 2014.PubMed/NCBI View Article : Google Scholar
|
|
7
|
Lim HK, Park ST, Ha H and Choi SY: Thyroid
nodules detected by contrast-enhanced magnetic resonance
angiography: Prevalence and clinical significance. PLoS One.
11(e0149811)2016.PubMed/NCBI View Article : Google Scholar
|
|
8
|
Kim TH, Ji YB, Song CM, Kim JY, Choi YY,
Park JS and Tae K: SUVmax of 18F-FDG PET/CT in the differential
diagnosis of benign and malignant thyroid nodules according to
tumor volume. World J Surg Oncol. 13(217)2015.PubMed/NCBI View Article : Google Scholar
|
|
9
|
Richmond B, Statler K, Judhan R, Mangano W
and Thompson S: Sonographic appearance is useful in predicting the
extent of initial operative therapy for thyroid nodules classified
as ‘suspicious for malignancy’. Am Surg. 82:692–697.
2016.PubMed/NCBI
|
|
10
|
Palaniappan MK, Aiyappan SK and Ranga U:
Role of gray scale, color Doppler and spectral Doppler in
differentiation between malignant and benign thyroid nodules. J
Clin Diagn Res. 10:TC01–TC06. 2016.PubMed/NCBI View Article : Google Scholar
|
|
11
|
Zhang Y, Luo YK, Tang J, Li M, Wang ZL and
Wen Q: Clinical value of ultrasonography in diagnosing diffuse
thyroid diseases accompanied with suspicious nodules. Zhongguo Yi
Xue Ke Xue Yuan Xue Bao. 37:290–293. 2015.PubMed/NCBI View Article : Google Scholar
|
|
12
|
Chen HY, Liu WY, Zhu H, Jiang DW, Wang DH,
Chen Y, Li W and Pan G: Diagnostic value of contrast-enhanced
ultrasound in papillary thyroid microcarcinoma. Exp Ther Med.
11:1555–1562. 2016.PubMed/NCBI View Article : Google Scholar
|
|
13
|
He Y, Wang XY, Hu Q, Chen XX, Ling B and
Wei HM: Value of Contrast-enhanced ultrasound and acoustic
radiation force impulse imaging for the differential diagnosis of
benign and malignant thyroid nodules. Front Pharmacol.
27(1363)2018.PubMed/NCBI View Article : Google Scholar
|
|
14
|
Zhan J and Ding H: Application of
contrast-enhanced ultrasound for evaluation of thyroid nodules.
Ultrasonography. 37:288–297. 2018.PubMed/NCBI View Article : Google Scholar
|
|
15
|
Magri F, Chytiris S and Chiovato L: The
role of elastography in thyroid ultrasonography. Curr Opin
Endocrinol Diabetes Obes. 23:416–422. 2016.PubMed/NCBI View Article : Google Scholar
|
|
16
|
Cantisani V, D'Andrea V, Biancari F,
Medvedyeva O, Di Segni M, Olive M, Patrizi G, Redler A, De Antoni
EE, Masciangelo R, et al: Prospective evaluation of multiparametric
ultrasound and quantitative elastosonography in the differential
diagnosis of benign and malignant thyroid nodules: Preliminary
experience. Eur J Radiol. 81:2678–2683. 2012.PubMed/NCBI View Article : Google Scholar
|
|
17
|
Zhang Y, Zhou P, Tian SM, Zhao YF, Li JL
and Li L: Usefulness of combined use of contrast-enhanced
ultrasound and TI-RADS classification for the differentiation of
benign from malignant lesions of thyroid nodules. Eur Radiol.
4:1527–1536. 2017.PubMed/NCBI View Article : Google Scholar
|
|
18
|
Sui X, Liu HJ, Jia HL and Fang QM:
Contrast-enhanced ultrasound and real-time elastography in the
differential diagnosis of malignant and benign thyroid nodules. Exp
Ther Med. 12:783–791. 2016.PubMed/NCBI View Article : Google Scholar
|
|
19
|
Ferrari FS, Megliola A, Scorzelli A,
Guarino E and Pacini F: Ultrasound examination using contrast agent
and elastosonography in the evaluation of single thyroid nodules:
Preliminary results. J Ultrasound. 11:47–54. 2008.PubMed/NCBI View Article : Google Scholar
|
|
20
|
Zhang YZ, Xu T, Gong HY, Li CY, Ye XH, Lin
HJ, Shen MP, Yang DT and Wu XH: Application of high-resolution
ultrasound, real-time elastography, and contrast-enhanced
ultrasound in differentiating solid thyroid nodules. Medicine
(Baltimore). 95(e5329)2016.PubMed/NCBI View Article : Google Scholar
|
|
21
|
Reginelli A, Urraro F, di Grezia G,
Napolitano G, Maggialetti N, Cappabianca S, Brunese L and Squillaci
E: Conventional ultrasound integrated with elastosonography and
B-flow imaging in the diagnosis of thyroid nodular lesions. Int J
Surg. 12 (Suppl 1):S117–S122. 2014.PubMed/NCBI View Article : Google Scholar
|
|
22
|
Zhao RN, Zhang B, Yang X, Jiang YX, Lai XJ
and Zhang XY: Logistic regression analysis of contrast-enhanced
ultrasound and conventional ultrasound characteristics of
sub-centimeter thyroid nodules. Ultrasound Med Biol. 41:3102–3108.
2015.PubMed/NCBI View Article : Google Scholar
|
|
23
|
Argalia G, De Bernardis S, Mariani D,
Abbattista T, Taccaliti A, Ricciardelli L, Faragona S, Gusella PM
and Giuseppetti GM: Ultrasonographic contrast agent: Evaluation of
time-intensity curves in the characterisation of solitary thyroid
nodules. Radiol Med. 103:407–413. 2002.PubMed/NCBI(In English, Italian).
|
|
24
|
Zhang Y, Luo YK, Zhang MB, Li J, Li J and
Tang J: Diagnostic accuracy of contrast-enhanced ultrasound
enhancement patterns for thyroid nodules. Med Sci Monit.
22:4755–4764. 2016.PubMed/NCBI View Article : Google Scholar
|
|
25
|
Jiang J, Shang X, Zhang H, Ma W, Xu Y,
Zhou Q, Gao Y, Yu S and Qi Y: Correlation between maximum intensity
and microvessel density for differentiation of malignant from
benign thyroid nodules on contrast-enhanced sonography. J
Ultrasound Med. 33:1257–1263. 2014.PubMed/NCBI View Article : Google Scholar
|
|
26
|
Tatar IG, Kurt A, Yilmaz KB, Doğan M,
Hekimoglu B and Hucumenoglu S: The role of elastosonography,
gray-scale and colour flow Doppler sonography in prediction of
malignancy in thyroid nodules. Radiol Onco. 48:348–353.
2014.PubMed/NCBI View Article : Google Scholar
|
|
27
|
Li F, Zhang J, Wang Y and Liu L: Clinical
value of elasticity imaging and contrast-enhanced ultrasound in the
diagnosis of papillary thyroid microcarcinoma. Oncol Lett.
10:1371–1377. 2015.PubMed/NCBI View Article : Google Scholar
|
|
28
|
Giusti M, Campomenosi C, Gay S, Massa B,
Silvestri E, Monti E and Turtulici G: The use of semi-quantitative
ultrasound elastosonography in combination with conventional
ultrasonography and contrast-enhanced ultrasonography in the
assessment of malignancy risk of thyroid nodules with indeterminate
cytology. Thyroid Res. 7(9)2014.PubMed/NCBI View Article : Google Scholar
|
|
29
|
Brito JP, Gionfriddo MR, Nofa AA, Boehmer
KR, Leppin AL, Reading C, Callstrom M, Elraiyah TA, Prokop LJ, Stan
MN, et al: The accuracy of thyroid nodule ultrasound to predict
thyroid cancer: Systemic review and meta-analysis. J Clin
Endocrinol Metab. 99:1253–1263. 2014.PubMed/NCBI View Article : Google Scholar
|
|
30
|
Li JW, Chang C, Chen M, Zeng W, Gao Y,
Zhou SC, Wang F, Hu N and Chen YL: Is ultrasonography more
sensitive than computed tomography for identifying calcifications
in thyroid nodules? J Ultrasound Med. 35:2183–2190. 2016.PubMed/NCBI View Article : Google Scholar
|