Introduction
Parkinson's disease (PD) is a common
neurodegenerative disease whose primary clinical characteristics
include tremor, bradykinesia, muscle rigidity and abnormal posture
and pace (1). Approximately 1% of
people over 60 years old in industrialized countries have PD
(2). The selective depletion of
dopaminergic neurones in the substantia nigra (SN) (3), the primary region of the brain that is
impaired in PD, the presence of α-synuclein containing Lewy bodies
and increased iron deposition in the SN, are the most common
pathological features of PD (4,5).
However, the role of increased iron deposition in the pathogenesis
of PD is unclear and increased iron deposition may be a cause or
by-product of cellular death or dysfunction in PD (6). A recent pooled iron-related gene study
suggested that increased iron deposition in PD-related brain
regions such as SN played a role in the aetiology of PD (7). Sian-Hulsmann et al (8) and Andersen (9) reported that iron-mediated cellular
destruction is mediated primarily via reactive oxygen and/or
nitrogen species-induced oxidative stress, which can induce
neuronal vulnerability.
At present, the diagnosis of PD is based on the
presence of motor symptoms and a set of clinical evaluations [for
example, Unified Parkinson's Disease Rating Scale (UPDRS)], but the
lack of objective and accessible diagnostic indicators may lead to
missed diagnosis, misdiagnosis and delayed treatment (1,10). As a
result, objective, accessible and non-invasive diagnostic
biomarkers are required. Several magnetic resonance imaging (MRI)
techniques, such as transverse relaxation rate (R2), effective
transverse relaxation rate (R2*) and phase imaging, have
been used to evaluate iron content in the brain, as the direct
measurement of cerebral iron content in vivo is not
feasible. Hardy et al (11)
compared the R2 and the tissue iron concentration in selected grey
matter regions of the brains of 12 female rhesus monkeys. Their
results indicated that R2 was highly correlated with the total iron
concentration and that this correlation appeared to depend upon the
iron concentration. Aquino et al (12) determined the values of iron
accumulation in the basal ganglia of healthy volunteers of
different ages (range, 1-80 years) using R2* mapping and
good correlation coefficients were found for GP
(R2=0.64), PT (R2=0.51), and SN
(R2=0.53) when compared with findings in a
previous post-mortem study (13). A
multi-center study was performed to assess the inter-scanner and
inter-subject variability of R2* mapping. The results
indicated that R2* is a robust and reproducible measure
in a multi-center setting provided that a standardized MRI protocol
is used (14). Conventional
gradient-echo (GRE) imaging methods (e.g. phase imaging,
R2* mapping) have demonstrated increased iron content in
the SN of PD patients (15,16), consistent with previous post-mortem
studies in PD (4,5). However, there are several limitations
in R2* mapping and phase imaging. R2* values
are susceptible to numerous additional factors, such as the sizes
and spacing of inhomogeneities, the rate of water diffusion, field
strength and echo times (17,18), and
phase is nonlocal and orientation dependent (19). A novel MRI technique, quantitative
susceptibility mapping (QSM), overcomes the limitations mentioned
above and provides a reliable method to evaluate the iron content
in the brain (19-21).
A post-mortem study (22)
demonstrated a strong linear correlation between the chemically
determined iron concentration and the magnetic susceptibility in
grey matter structures (r=0.84, P<0.001) and QSM more
effectively depicted deep grey nuclei compared with current
standard-of-care sequences (For example, T2-weighted,
T2*-weighted, R2* mapping, and phase images)
(23).
Increased iron deposition in the SN of PD patients
has been confirmed by both biochemical and imaging methods
(4,5,24,25). The
iron content in other deep grey nuclei (For example, red nucleus
and putamen) of PD patients has also been measured, but the results
have been conflicting (25,26). In the present study, QSM was utilized
to investigate iron homeostasis disorder in PD patients compared
with normal controls, while a correlation analysis between observed
susceptibility changes and clinical features was conducted in PD
patients. To investigate the ability of QSM to measure brain iron,
conventional MRI-R2* mapping was also performed in the
present study. The diagnostic performances of QSM and
R2* mapping to separate PD patients from normal controls
were also determined.
Materials and methods
Subjects
A total of 31 patients diagnosed with idiopathic PD
were prospectively recruited from the Neurology Department of The
First Affiliated Hospital of Jinan University from July 2017 to
December 2018. The patients were diagnosed by two experienced
neurologists according to the UK Parkinson's Disease Society Brain
Bank clinical diagnostic criteria (27). The following inclusion criteria for
patients with PD were used: i) Diagnosis with primary PD; ii) the
presence of clear cognitive ability according to a recent clinical
assessment; iii) no presence of any other neurological or
psychiatric disorder, such as depression or anxiety; and iv) no
history of cerebral trauma, cerebrovascular disease or intracranial
space-occupying lesions. A total of 6 patients were excluded for
poor image quality (e.g. considerable or significant motion
artefacts). Ultimately 25 patients with PD were recruited. A total
of 28 age- and sex-matched volunteers without a history of
neurological disease or brain trauma were recruited as normal
controls.
The Hoehn and Yahr (H and Y) score (28) was used by an experienced neurological
physician to assess disease severity in the patients with PD.
Disease duration was determined from the first occurrence of
PD-related symptoms to the date of the study visit. All patients
accepted dopaminergic replacement therapy in the present study to
improve symptoms. The ethics committee of The First Affiliated
Hospital of Jinan University approved the present study, and all
subjects provided written informed consent.
MRI data acquisition
All participants underwent MR examinations on a 3.0
T MR scanner (MR750; GE Healthcare) equipped with an 8-channel
phased-array head coil. During MRI scanning, foam padding and
earplugs were used by the patients to prevent head movement and
reduce scanner noise. An axial three-dimensional multi-echo GRE
sequence was acquired for the reconstruction of QSM and
R2* maps. The following imaging parameters for the
multi-echo GRE sequence were used: Repetition time (TR), 49.3 msec;
ten echoes (echo time, 4.2, 8.8, 13.4, 18.0, 22.7, 27.3, 31.9,
36.5, 41.1 and 45.7 msec); bandwidth, 62.5 Hz/pixel; flip angle,
20; field of view, 24x24 cm; matrix, 512x512; resolution,
0.47x0.47x2.0 mm3; acceleration factor, 1; and slices,
62. Furthermore, routine MR images, including T1-weighted images,
T2-weighted images and T2-weighted fluid-attenuated inversion
recovery, were acquired for scanning cerebrovascular diseases.
Image reconstruction
QSM images were reconstructed as previously
described (20). In brief, the phase
image for each channel of the coil was acquired and fitted; then,
phase unwrapping was performed using the Laplacian method (20,29). As
the significant background phase was mixed with the true tissue
phase contrast, the sophisticated harmonic artefact reduction for
phase data was used to remove the background phase before
calculating the tissue susceptibility distribution, and the filter
radius was set as 8(30). Finally,
the resulting true tissue phase image was used to compute the
susceptibility maps using an improved least squares with
QR-factorization (LSQR) method (iLSQR) (20,31) with
a regularization parameter of 0.04 for Laplace filtering. The
magnetic susceptibility distribution map reconstructed by the iLSQR
method provided more local details of the brain tissue with
negligible streaking artefacts compared to multiple orientation QSM
reconstruction (31).
R2* maps were reconstructed using the
multi-echo GRE magnitude images in the ADW 4.5 post-processing
workstation (GE Healthcare) and quantitative R2* values
were calculated with a mono-exponential fit in the Functool 9
platform version 4.5 (GE Healthcare).
Image analysis
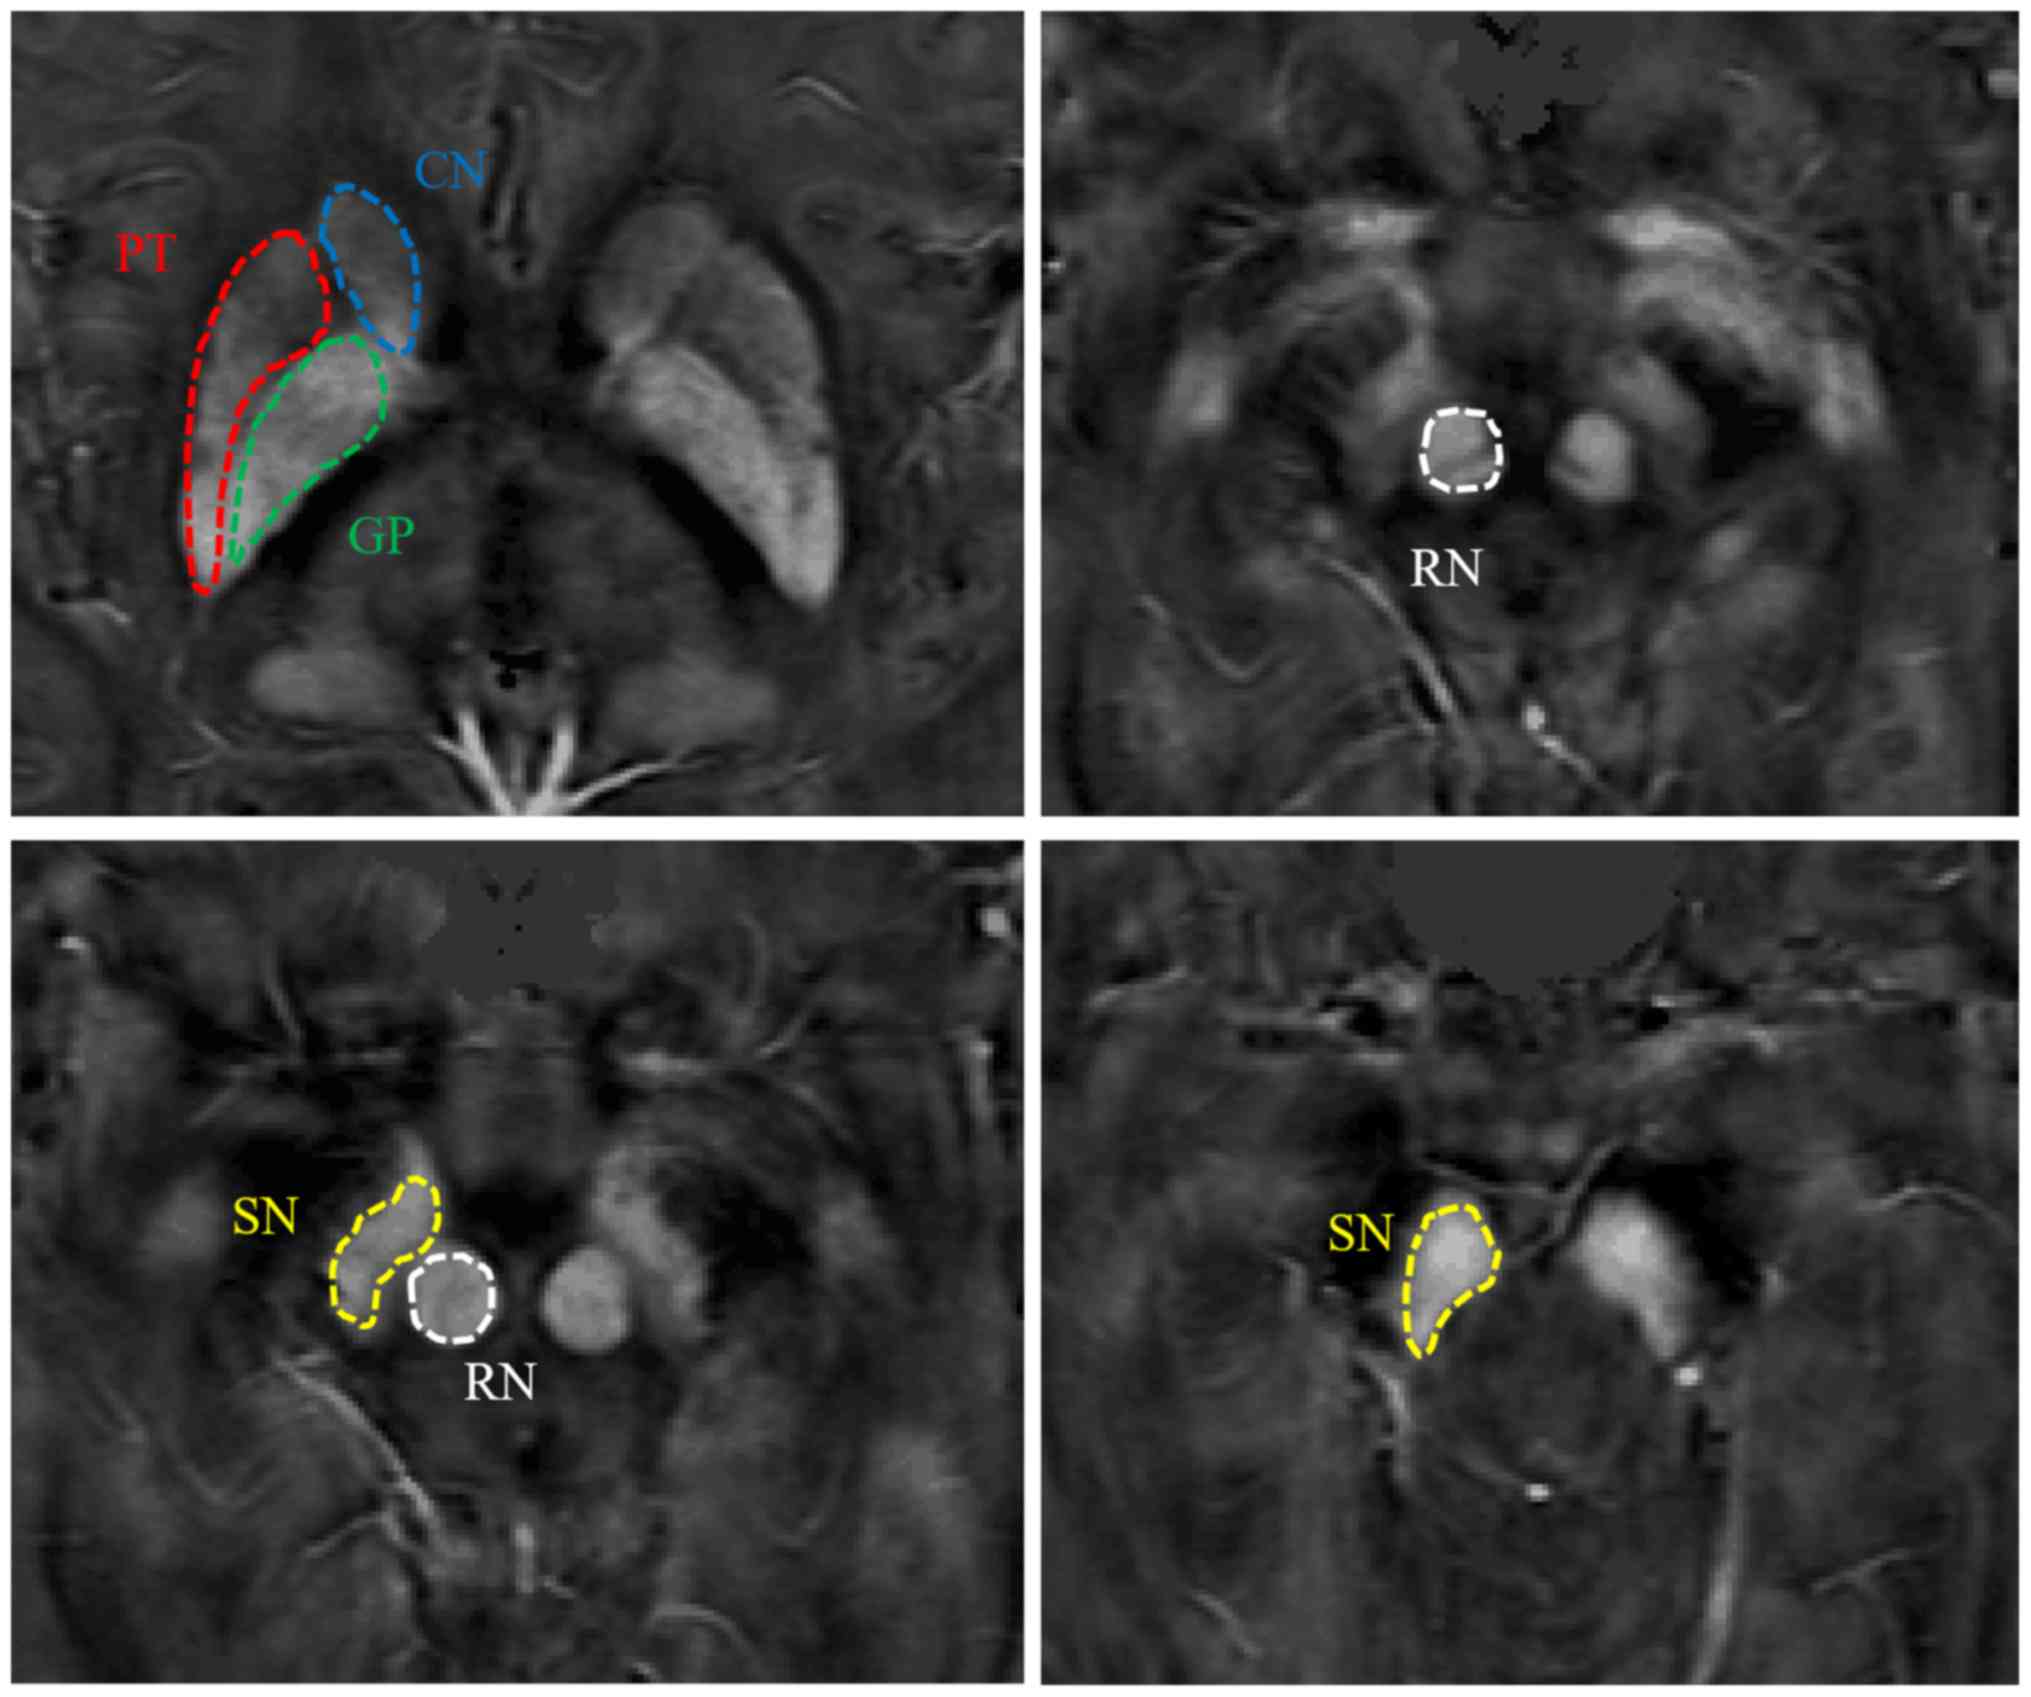
The regions of interest (ROIs) were manually added
onto the susceptibility maps using ImageJ software 1.46 (National
Institutes of Health) by two neuro-radiologists, who were blinded
to the information of subjects. The ROIs in the deep grey nucleus
covered the bilateral head of the caudate nucleus (CN), SN, red
nucleus (RN), globus pallidus (GP) and putamen (PT). The same ROI
was applied to obtain R2* values in each region. To
minimize measurement errors, the susceptibility and R2*
values for each nucleus were only obtained from more representative
slices in which the ROIs were clearly visible and then the mean of
the values from all slices in each region and the bilateral
cerebral hemispheres were calculated for subsequent analysis. In
the present study, the susceptibility values obtained from the QSM
images were used for direct comparison without reference to any
selected structure, which is similar to previous studies (32,33).
Statistical analysis
To compare the differences in age and sex
distribution between the patients with PD and normal controls,
independent samples t-test and the Pearson χ2 test were
used. To evaluate the inter-observer reliability of the QSM and
R2* measurement by two neuro-radiologists, the
intra-class correlation coefficient (ICC) was calculated. An
ICC>0.81 was considered for excellent agreement; 0.61-0.80, good
agreement; 0.41-0.60, moderate agreement; and <0.40, poor
agreement. The normality of the data was analyzed using the
Kolmogorov-Smirnov test. Measurement data were expressed as mean ±
standard deviation. The group differences in the regional
susceptibility and R2* values between patients with PD
and normal controls were compared using an independent samples
t-test. When significant differences were found between the two
groups, the diagnostic characteristics of QSM and R2*
mapping were analyzed for the corresponding region using receiver
operating characteristic (ROC) curves. A correlation analysis
between susceptibility and R2* values and clinical
features in patients with PD was performed. Pearson's correlation
analysis was also utilized to investigate the correlation between
the average susceptibility or R2* values in each
targeted region for all the normal controls in the present study,
and the mean iron concentration in the corresponding regions of
normal individuals determined in a previous post-mortem study
(13). P<0.05 was considered to
indicate a statistically significant difference. SPSS v13.0 (SPSS,
Inc.) was used for all statistical analyses.
Results
Demographic and clinical data
assessment
A total of 25 patients (14 males and 11 females;
mean age 65.28±8.32 years) with PD and 28 sex- and age-matched
volunteers (10 males and 18 females; mean age 63.67±9.58 years)
were recruited in the present study. No significant differences in
age (P=0.521) or sex (P=0.152) between the patients with PD and
controls were found.
The primary clinical characteristics in patients
with PD include rest tremor, bradykinesia, muscle rigidity and
abnormal posture and pace (1). All
of the 25 patients with PD had varying degrees of the
aforementioned symptoms. Of the 25 cases, 6 had mild symptoms that
involved only one limb. A further 19 patients had bilateral limb
involvement and 10 had moderate symptoms. The disease duration and
the H and Y scores for the patients with PD are listed in Table I.
 | Table IClinical data from patients with
Parkinson's disease. |
Table I
Clinical data from patients with
Parkinson's disease.
| Patient number | Disease duration,
years | Hoen and Yahr
stage |
|---|
| 1 | 7 | 3 |
| 2 | 0.33 | 2 |
| 3 | 1 | 1 |
| 4 | 3 | 2 |
| 5 | 3 | 3 |
| 6 | 4 | 1.5 |
| 7 | 2 | 3 |
| 8 | 5 | 1.5 |
| 9 | 4 | 3 |
| 10 | 0.66 | 3 |
| 11 | 3 | 2.5 |
| 12 | 4 | 1.5 |
| 13 | 5 | 3 |
| 14 | 3 | 3 |
| 15 | 5 | 3 |
| 16 | 3 | 2 |
| 17 | 11 | 2 |
| 18 | 10 | 3 |
| 19 | 10 | 2.5 |
| 20 | 2 | 2 |
| 21 | 2 | 2 |
| 22 | 1 | 1.5 |
| 23 | 5 | 2 |
| 24 | 2 | 1.5 |
| 25 | 18 | 3 |
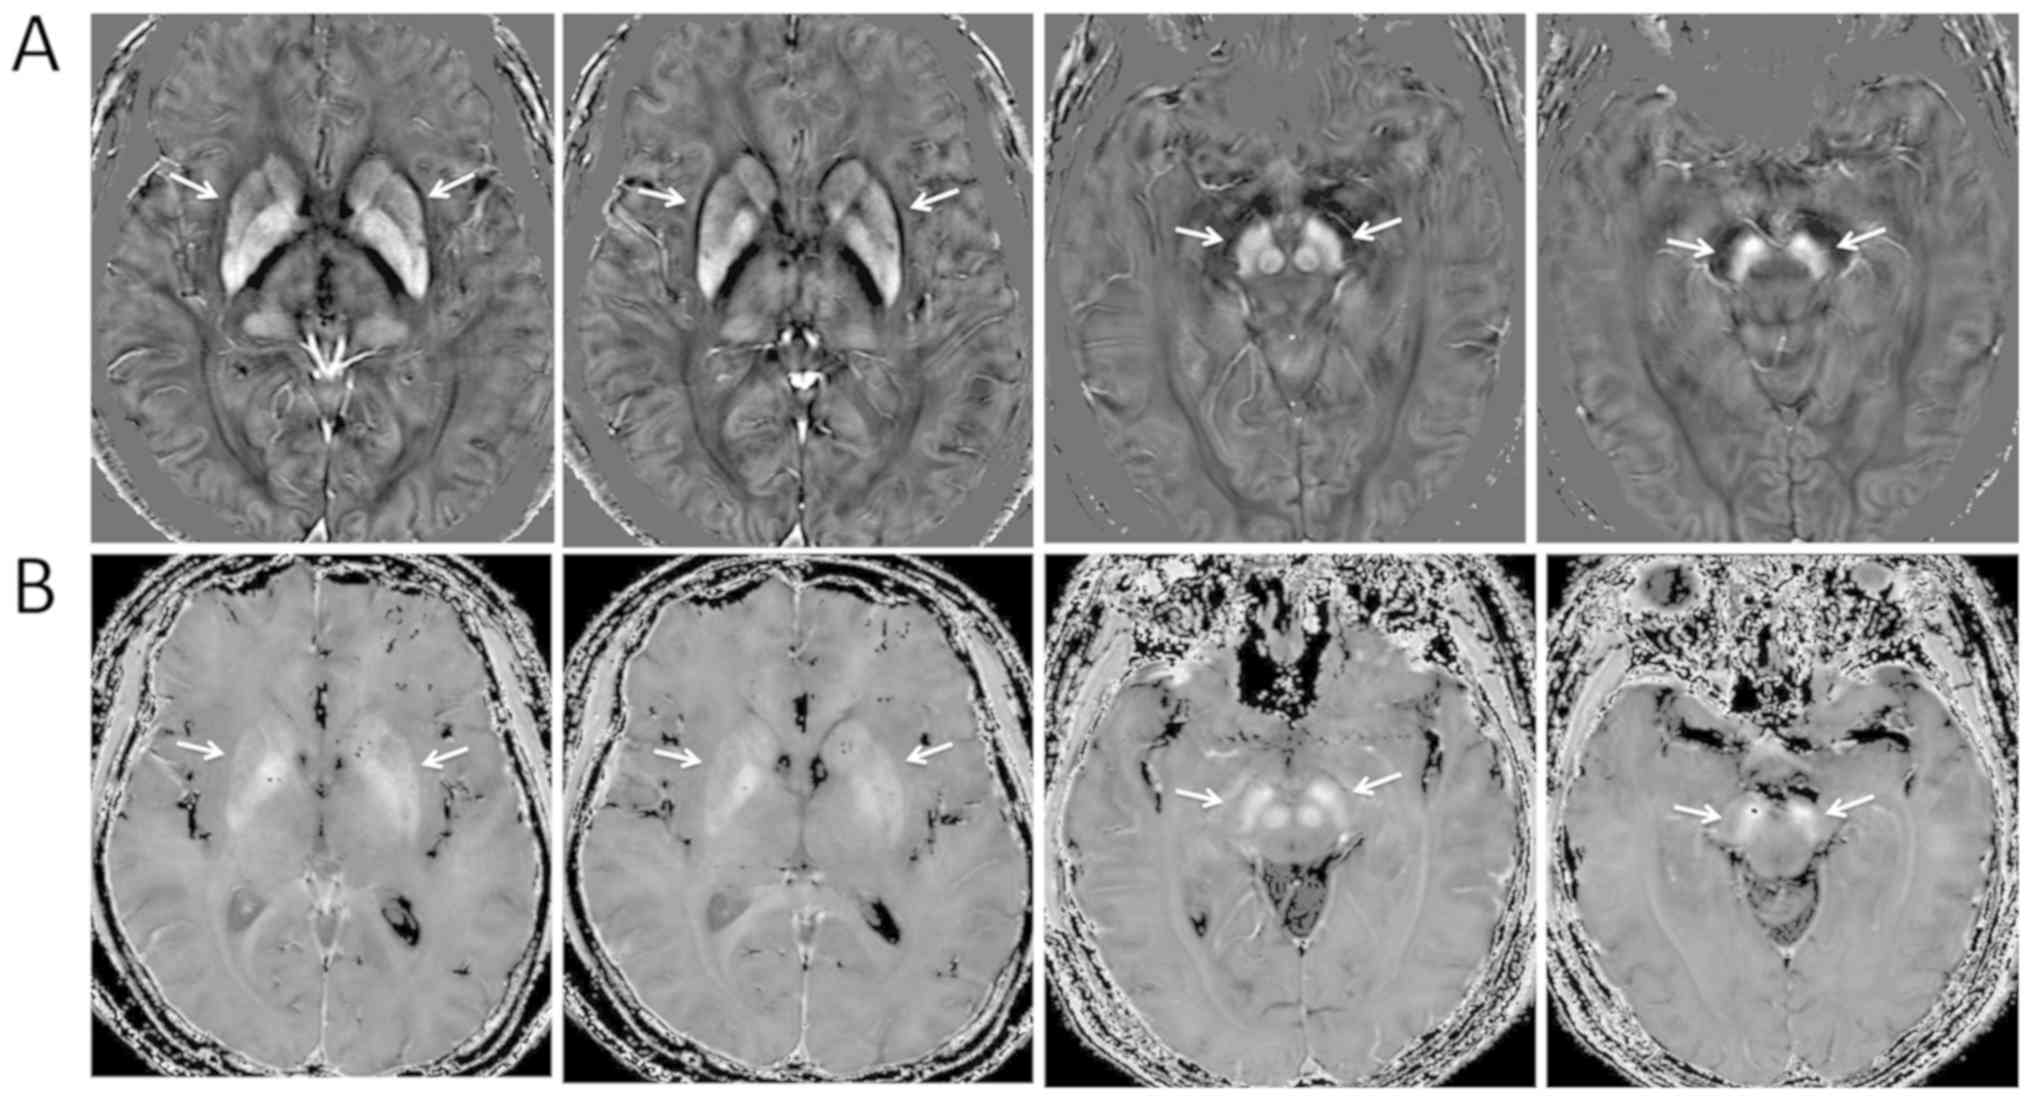
Brain iron distribution in QSM and
R2* mapping
The targeted deep grey matter nuclei in the basal
ganglia and midbrain appeared hyper-intense in both QSM and
R2* images, and the boundaries of the ROIs appeared
clearer in the QSM images compared with that in the R2*
images (Fig. 1; images from a
patient with PD). Therefore, targeted structures could be manually
segmented directly on the QSM images (Fig. 2; images from a normal control).
Interrater agreement
The ICCs of regional magnetic susceptibilities (ICC,
0.977; P<0.001) and R2* rate constants (ICC, 0.945;
P<0.001) between two neuro-radiologists were >0.81, revealing
excellent inter-rater agreement.
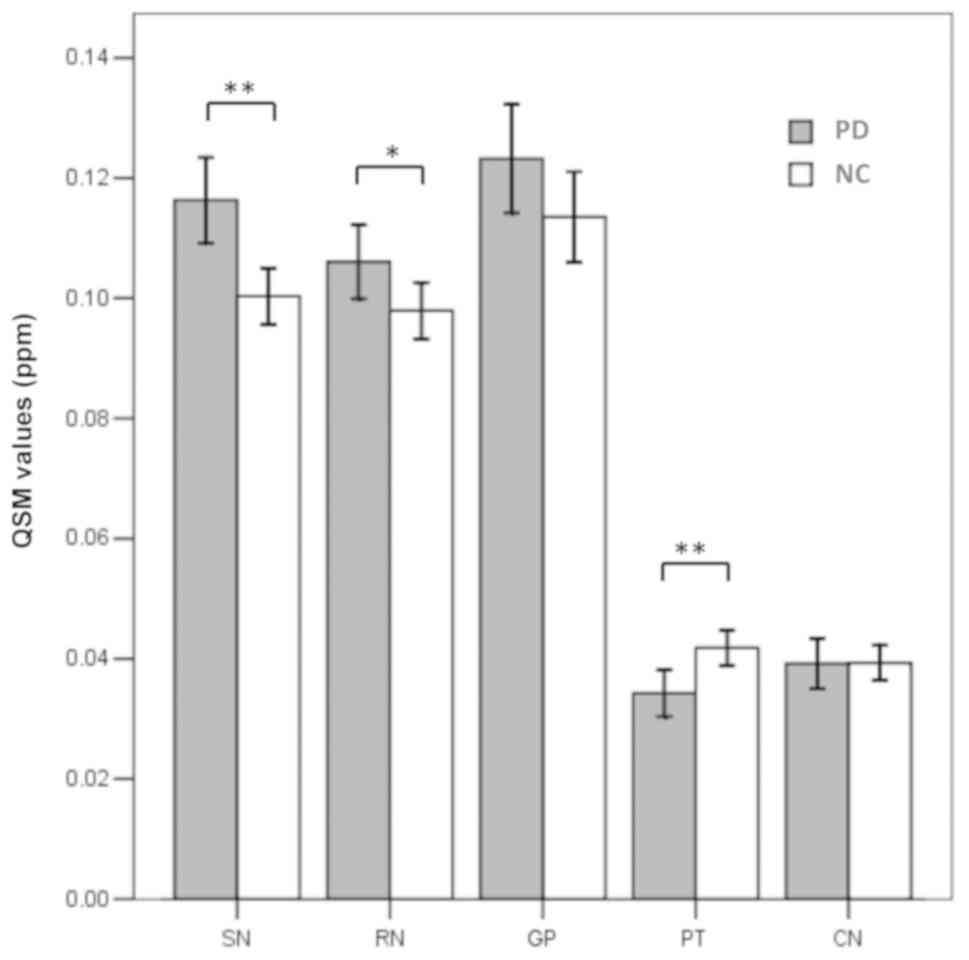
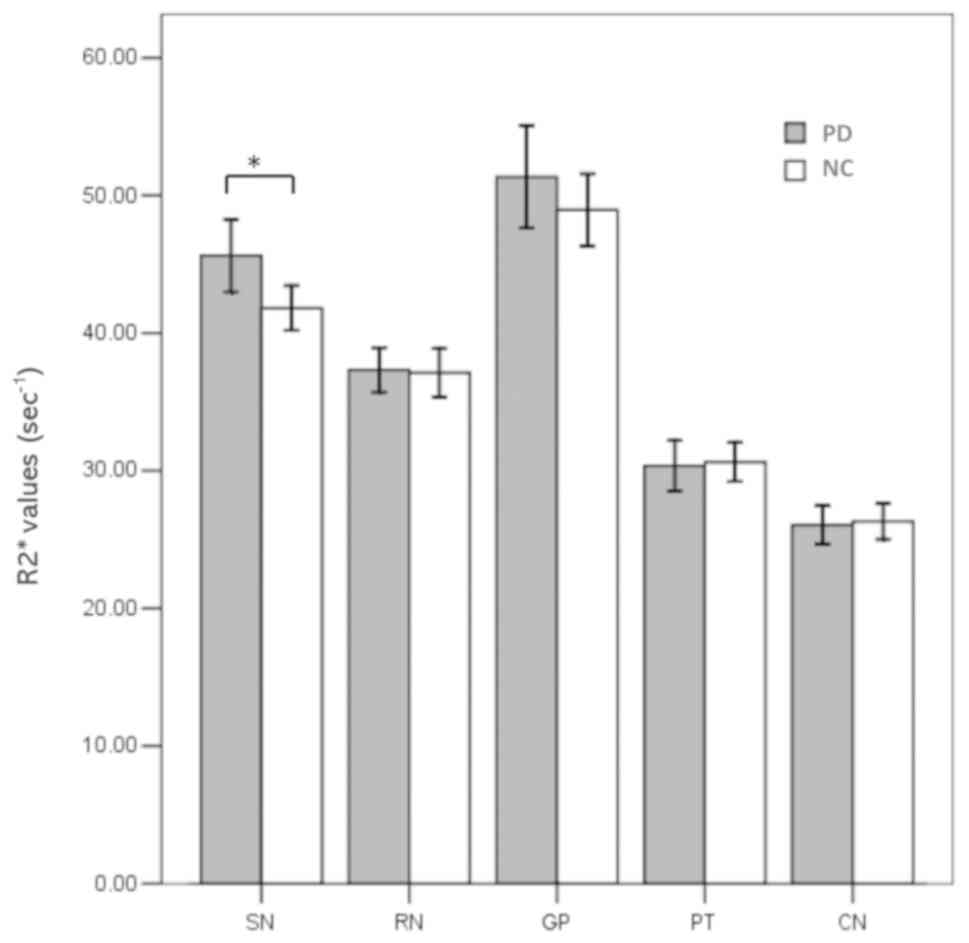
Group differences as assessed by
R2* mapping and QSM
The regional magnetic susceptibilities and
R2* values in the patients with PD and normal controls
were successfully calculated and are listed in Table II. The susceptibility values were
significantly higher in the SN (P<0.001) and RN (P=0.035) in the
patients with PD compared with that in the controls (Fig. 3). However, the susceptibility values
in the PT were significantly lower in the patients with PD
(P=0.002; Fig. 3). No significant
differences in magnetic susceptibilities were observed in any other
region between the patients with PD and normal controls. Increased
R2* values were observed only in the SN of the patients
with PD compared with that in the controls (P=0.013; Fig. 4).
| Table IIRegional magnetic susceptibilities
and R2* values in patients with PD and normal
controls. |
Table II
Regional magnetic susceptibilities
and R2* values in patients with PD and normal
controls.
| | Susceptibility,
ppm | R2*
value, sec-1 |
|---|
| Region of
interest | PD | NCs | P-value | PD | NCs | P-value |
|---|
| SN | 0.116±0.025 | 0.100±0.018 | <0.001 | 45.63±9.32 | 41.81±6.08 | 0.013 |
| RN | 0.106±0.022 | 0.098±0.018 | 0.035 | 37.33±5.71 | 37.11±6.51 | 0.857 |
| CN | 0.039±0.015 | 0.039±0.011 | 0.961 | 26.06±4.89 | 26.31±4.84 | 0.792 |
| PT | 0.034±0.014 | 0.042±0.011 | 0.002 | 30.36±6.43 | 30.62±5.29 | 0.817 |
| GP | 0.123±0.032 | 0.115±0.027 | 0.164 | 51.35±13.13 | 48.95±9.82 | 0.286 |
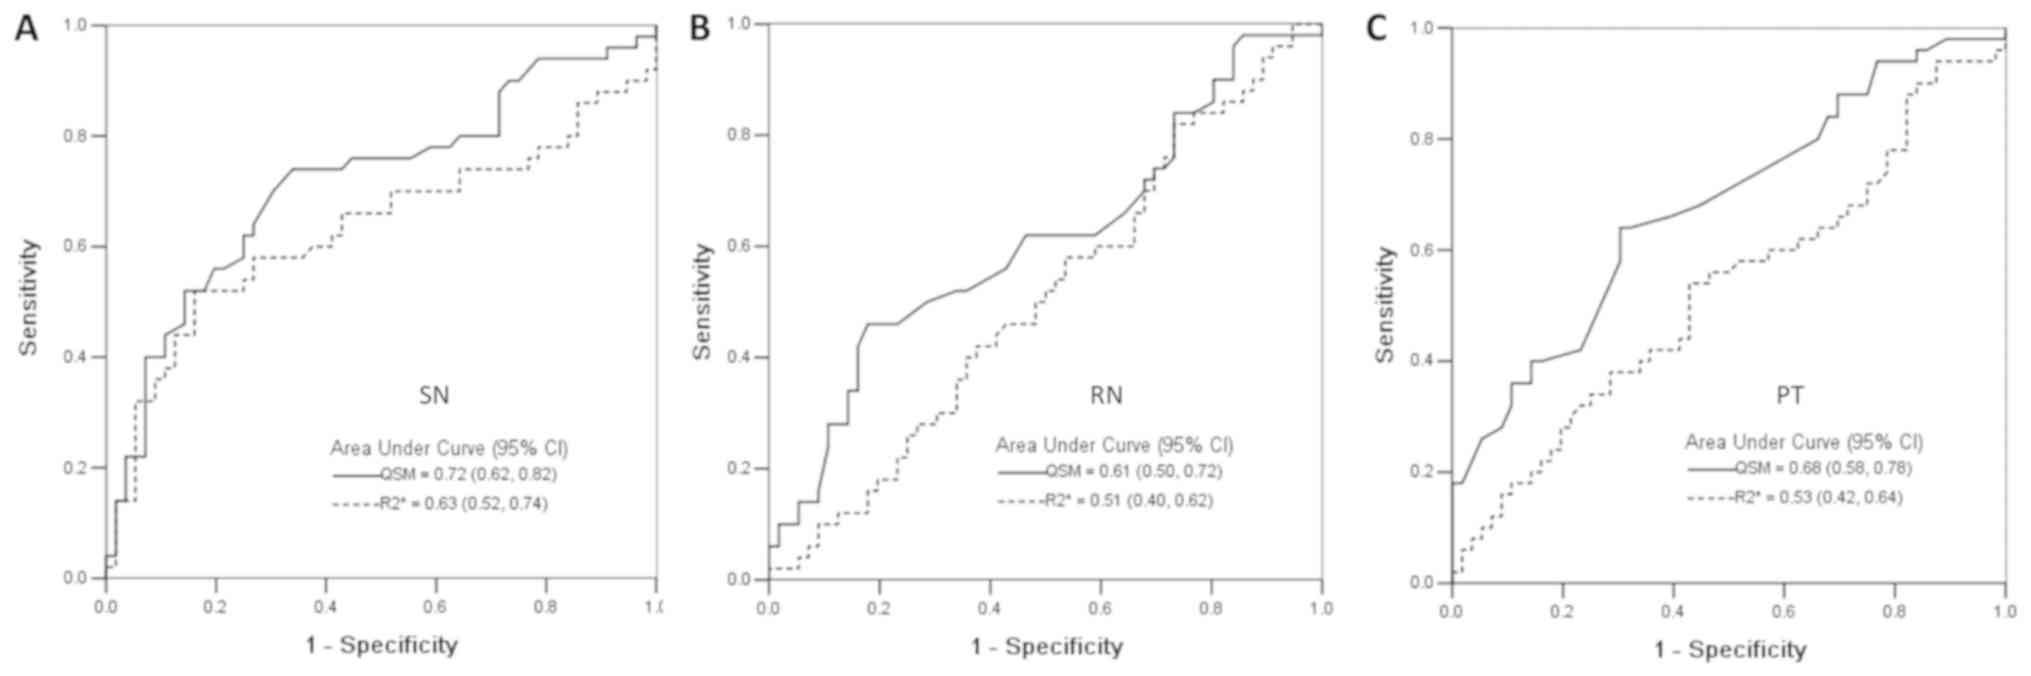
Diagnostic performance of QSM and
R2* mapping to classify PD patients and normal
controls
The abilities of QSM and R2* mapping to
classify patients with PD and normal controls were analyzed in the
SN, RN and PT using ROC curves (Fig.
5). The area under the curve and respective standard deviations
are shown in Fig. 5. The QSM (SN
area, 0.72±0.05; RN area, 0.61±0.05; PT area, 0.68±0.06) had higher
sensitivity in classifying patients with PD compared with that for
R2* mapping (SN area, 0.63±0.05; RN area, 0.51±0.06; PT
area, 0.53±0.06).
Regional susceptibility and
R2* values correlate with brain iron levels
Significant positive correlations were observed
between the regional susceptibility values and the iron
concentrations (R2=0.92; P=0.009) as well as the
R2* values and the iron concentrations
(R2=0.86; P=0.023) in normal individuals (Data not
shown). The iron concentrations were referenced to the Hallgren
study (13), who measured the iron
concentrations with biochemical methods in normal individuals. This
finding indicated that QSM and R2* mapping techniques
accurately calculated the regional iron levels in the human
brain.
Correlations of QSM and of
R2* mapping with clinical feature
No significant correlations between the imaging
parameters (e.g., susceptibility and R2* values) and
clinical features described by disease durations and the H and Y
stages were found in the patients with PD in any targeted region
(P>0.10).
Discussion
PD is a common neurodegenerative disease and its
pathogenesis is still unclear (2,10). A
review published in 2006 reported that the prevalence of PD
increased with age, and that PD affects 1% of the population >60
years old (2). One of the major
pathological changes in PD is iron deposition in the SN (4). Iron protein and haemosiderosis in the
brain are strong paramagnetic substances that cause a strong
reduction in T2* relaxation time (34). Therefore, conventional GRE imaging
approaches (magnitude-, phase-, and R2*-imaging) have
been used to assess iron changes in the brains of patients with PD.
The most commonly used method is R2* mapping, which can
be used for quantitative measurement (15,18,35).
QSM, as a novel technique, overcomes several non-local restrictions
of susceptibility-weighted and phase imaging (For example, the
nonlocality of the magnetic field distribution) and provides a
non-invasive and quantitative method to assess diseases
characterized by variations in iron and/or myelin concentrations
(25,36).
Elevated iron deposition in the SN of patients with
PD compared with that in controls was demonstrated by QSM in the
present study. Increased iron accumulation in the SN is one of the
major pathological changes that occurs in patients with PD and has
been reported in both post-mortem (4,5,37) and MRI studies (25,26,38).
Another major pathological feature in patients with PD is a loss of
dopaminergic neurons in the SN (4).
Neuromelanin (NM), a dark-coloured pigment produced in the
dopaminergic neurons of the human SN, has the ability to bind a
variety of metals, including iron, and increased NM-bound iron has
previously been reported in the SN of patients with PD (39,40). The
biochemical mechanisms causing this phenomenon in PD are unclear;
however, it is hypothesized that redox-active iron could be
released under conditions of oxidative stress and high
concentrations of reactive iron lead to further oxidative damage,
which induces neuronal vulnerability (41,42).
Elevated susceptibility values were also observed in
the RN of patients with PD, which is consistent with previous
studies (24,26). A previous study identified higher
R2* values in both the SN and RN (34). The RN, located in the midbrain near
the SN, is similarly iron-rich (43)
and is easily recognized on QSM and R2* images. The RN
receives significant somatotopically organized input from the
ipsilateral motor cortex and contralateral cerebellum (44), thus serving as an essential
intersection between primary and cerebellar motor pathways
(45,46). Lewis et al (34) reported that as an integral part of
cerebellar circuitry, the RN might mediate PD-related compensatory
changes and the occurrence of dyskinesia. The underlying
biochemical mechanism for the increased susceptibility values in
the RN remains unclear. It is hypothesized that this mechanism may
be similar to that for the SN, due to increased iron deposition in
patients with PD. Further histopathological and imaging studies are
required to examine the role of iron deposition in the RN in the
pathogenesis of PD.
Notably, reduced susceptibility values in the PT
were observed in patients with PD when compared with that in the
controls. A consistently reduced iron level in the PT of patients
with PD has been reported in both post-mortem and MRI studies
(5,47). However, another study demonstrated
increased iron deposition in the PT of patients with PD (4), and numerous additional studies did not
find a significant difference in iron levels in the PT between
patients with PD and healthy controls (5,24).
Variations in the iron levels in sub-regions of the PT and iron
migration, through unclear pathways between different brain regions
during the progression of PD may be the causes of these
contradictory findings. Moreover, different methods (For example,
atomic absorption spectrophotometry, R2* mapping and
QSM) for quantifying brain iron levels and the heterogeneity of
patients with PD in these studies may also be sources of this
discrepancy.
In the present study, increased R2*
values were only observed in the SN of the patients with PD
compared with that in the controls and previous studies (25,26,34) have
demonstrated consistent findings. The increased iron deposition in
the SN of patients with PD has been confirmed by previous studies
(4,37). Iron is paramagnetic and causes a
strong increase in R2* relaxation rates (48). Therefore, it is feasible to
distinguish PD patients from healthy controls using R2*
mapping. The difference in R2* values in other regions
was not observed between the PD patients and normal controls. This
finding may indicate that R2* mapping is less sensitive
than QSM to iron changes in the brains of PD patients. The
R2* relaxation rate is affected not only by iron but
also by numerous additional factors, such as the size and spacing
of the inhomogeneities, the rate of water diffusion, field strength
and echo times (17,18). These factors will reduce the
sensitivity and accuracy of R2* mapping in detecting
susceptibility changes caused by iron (25).
The regional susceptibility values were positively
correlated with the iron concentrations determined in previous
post-mortem studies (13) of healthy
individuals (r=0.957; P=0.011). Similarly, a post-mortem QSM study
(22) also demonstrated a strong
linear correlation between chemically determined iron
concentrations and magnetic susceptibility in grey matter
structures (r=0.84; P<0.001). This finding confirmed that the
QSM was sensitive and reliable for assessing the iron level in the
human brain. A positive correlation between R2* values
and iron concentrations (13) was
also observed (r=0.904; P=0.035), but this correlation was slightly
weaker compared with the correlation between susceptibility values
and iron concentrations. The targeted deep grey matter nuclei in
the basal ganglia and midbrain appeared hyper-intense in both QSM
and R2* images, and the boundary of the ROIs was clearer
in QSM maps, consistent with a previous QSM study (23). These findings indicate that QSM can
detect iron levels and depict the deep grey nuclei in the human
brain more effectively compared with R2* mapping.
To date, only two studies (49,50) have
analyzed the abilities of QSM and R2* mapping to
classify healthy individuals and patients with PD in the SN using
the ROC curve, which displayed areas under the curve of 0.77 and
0.54 for QSM and R2* mapping (50) and an area under the curve of 0.72 for
R2* mapping (49). In the
present study, the ROC analysis displayed an area under the curve
of 0.72 and 0.63 for QSM and R2* mapping in the SN. The
diagnostic characteristics of QSM and R2* mapping in the
RN and PT were further investigated in addition to the SN, as the
susceptibility values in the RN and PT were also significantly
different between patients with PD and normal controls. To the best
of our knowledge, this is the first time that the diagnostic
characteristics of QSM and R2* mapping in the RN and PT
have been investigated. The QSM showed higher sensitivity to
classify patients with PD compared with that for R2*
mapping for all regions analyzed. The area under the curve for QSM
and R2* mapping in the SN was also found to be higher
compared with that in the RN and PT.
There were no significant correlations between the
imaging parameters in all targeted regions and clinical features
described by disease duration and the H and Y stages in the
patients with PD. These results suggest that in patients with
different H and Y stages, and disease durations, the changes in
iron levels were not significant. Previous studies (16,50) also
did not find a significant correlation between the regional iron
levels and disease durations. He et al (26) reported a positive correlation between
increased susceptibility values in the SN and disease duration in
patients with PD, but the elevated R2* values in the SN
were not correlated with clinical features. Langkammer et al
(24) demonstrated that the SN
susceptibility values were correlated with H and Y stages but were
not correlated with disease duration in patients with PD. However,
the aforementioned correlation between increased iron levels in the
SN and the clinical features in patients with PD was low (r=0.29).
Therefore, it is debatable whether it is reliable to evaluate the
progression of PD using QSM or R2* mapping.
There are several limitations to the present study.
First, the sample size was small, so a contrast analysis between
patients with early-stage and advanced-stage PD was not performed.
PD is asymmetrical and patients with early-stage PD often suffer
from unilateral limb involvement (26). As the number of patients with
early-stage PD was limited, a contrast analysis between the
ipsilateral and the contralateral regions was not performed. In
future studies, more patients with early-stage PD will be recruited
and contrast analysis between the ipsilateral and the contralateral
regions will be performed. Previous studies (51-53)
separated the SN into pars compacta and pars reticulata with ultra
high-field, 7 Tesla MRI and showed iron deposition was primarily
located in the pars compacta; however, in the present study, the SN
was evaluated as a whole to analyse the clinical GRE data. Another
limitation of the present study is the lack of pathological
confirmation in the patients with PD. However, all patients who may
clinically have idiopathic PD undergo a longitudinal clinical
assessment and their assessment is reassessed over time.
In conclusion, the results indicate that both QSM
and R2* mapping are feasible techniques to calculate
iron levels in human brains, although QSM provides a more sensitive
and accurate method to assess regional abnormal iron distribution
in patients with PD. QSM has a higher sensitivity in the
classification of patients with PD from normal controls compared
with that in R2* mapping.
Acknowledgements
Not applicable.
Funding
The present study was supported by Department of
science and Technology of Guangdong province [grant. nos.
2014A020212689].
Availability of data and materials
The datasets used and/or analyzed during the current
study are available from the corresponding author on reasonable
request.
Authors' contributions
LL and CS contributed to the design and conception
of the study. JL and XL designed MR inspection sequence parameters
and participated in implementation inspections. QC, JH, and MM
obtained, analyzed and interpreted the data. QC and JH were
responsible for the writing of the manuscript. JL and XL reviewed
the manuscript and critically revised important intellectual
content. QZ was in charge of the statistical analysis. All authors
agreed to be accountable for all aspects of the work in ensuring
that questions related to the accuracy or integrity of any part of
the work are appropriately investigated and resolved. All authors
read and approved the final version.
Ethics approval and consent to
participate
The Ethics Committee of The First Affiliated
Hospital of Jinan University approved the present study, and all
subjects provided written informed consent.
Patient consent for publication
Not applicable.
Competing interests
The authors declare that they have no competing
interests.
References
|
1
|
Marino BLB, Souza LR, Sousa KPA, Ferreira
JV, Padilha EC, Silva CHTP, Taft CA and Hage-Melim LIS: Parkinson's
disease: A Review from the Pathophysiology to Diagnosis, New
Perspectives for Pharmacological Treatment. Mini Rev Med Chem: Nov
3, 2019 (Epub ahead of print). doi:
10.2174/1389557519666191104110908.
|
|
2
|
de Lau LM and Breteler MM: Epidemiology of
Parkinson's disease. Lancet Neurol. 5:525–535. 2006.PubMed/NCBI View Article : Google Scholar
|
|
3
|
Fasano M, Bergamasco B and Lopiano L:
Modifications of the iron-neuromelanin system in Parkinson's
disease. J Neurochem. 96:909–916. 2006.PubMed/NCBI View Article : Google Scholar
|
|
4
|
Griffiths PD and Crossman AR: Distribution
of iron in the basal ganglia and neocortex in postmortem tissue in
Parkinson's disease and Alzheimer's disease. Dementia. 4:61–65.
1993.PubMed/NCBI View Article : Google Scholar
|
|
5
|
Dexter DT, Carayon A, Javoy-Agid F, Agid
Y, Wells FR, Daniel SE, Lees AJ, Jenner P and Marsden CD:
Alterations in the levels of iron, ferritin and other trace metals
in Parkinson's disease and other neurodegenerative diseases
affecting the basal ganglia. Brain. 114:1953–1975. 1991.PubMed/NCBI View Article : Google Scholar
|
|
6
|
Dusek P, Jankovic J and Le W: Iron
dysregulation in movement disorders. Neurobiol Dis. 46:1–18.
2012.PubMed/NCBI View Article : Google Scholar
|
|
7
|
Rhodes SL, Buchanan DD, Ahmed I, Taylor
KD, Loriot MA, Sinsheimer JS, Bronstein JM, Elbaz A, Mellick GD,
Rotter JI and Ritz B: Pooled analysis of iron-related genes in
Parkinson's disease: Association with transferrin. Neurobiol Dis.
62:172–178. 2014.PubMed/NCBI View Article : Google Scholar
|
|
8
|
Sian-Hulsmann J, Mandel S, Youdim MB and
Riederer P: The relevance of iron in the pathogenesis of
Parkinson's disease. J Neurochem. 118:939–957. 2011.PubMed/NCBI View Article : Google Scholar
|
|
9
|
Andersen JK: Oxidative stress in
neurodegeneration: Cause or consequence? Nat Med. 10
(Suppl):S18–S25. 2004.PubMed/NCBI View Article : Google Scholar
|
|
10
|
Tysnes OB and Storstein A: Epidemiology of
Parkinson's disease. J Neural Transm (Vienna). 124:901–905.
2017.PubMed/NCBI View Article : Google Scholar
|
|
11
|
Hardy PA, Gash D, Yokel R, Andersen A, Ai
Y and Zhang Z: Correlation of R2 with total iron concentration in
the brains of rhesus monkeys. J Magn Reson Imaging. 21:118–127.
2005.PubMed/NCBI View Article : Google Scholar
|
|
12
|
Aquino D, Bizzi A, Grisoli M, Garavaglia
B, Bruzzone MG, Nardocci N, Savoiardo M and Chiapparini L:
Age-related iron deposition in the basal ganglia: Quantitative
analysis in healthy subjects. Radiology. 252:165–172.
2009.PubMed/NCBI View Article : Google Scholar
|
|
13
|
Hallgren B and Sourander P: The effect of
age on the non-haemin iron in the human brain. J Neurochem.
3:41–51. 1958.PubMed/NCBI View Article : Google Scholar
|
|
14
|
Ropele S, Wattjes MP, Langkammer C,
Kilsdonk ID, Graaf WL, Frederiksen JL, Fuglø D, Yiannakas M,
Wheeler-Kingshott CA, Enzinger C, et al: Multicenter R2*
mapping in the healthy brain. Magn Reson Med. 71:1103–1107.
2014.PubMed/NCBI View Article : Google Scholar
|
|
15
|
Du G, Lewis MM, Styner M, Shaffer ML, Sen
S, Yang QX and Huang X: Combined R2* and diffusion
tensor imaging changes in the substantia nigra in Parkinson's
disease. Mov Disord. 26:1627–1632. 2011.PubMed/NCBI View Article : Google Scholar
|
|
16
|
Martin WR, Wieler M and Gee M: Midbrain
iron content in early Parkinson disease: A potential biomarker of
disease status. Neurology. 70:1411–1417. 2008.PubMed/NCBI View Article : Google Scholar
|
|
17
|
Kennan RP, Zhong J and Gore JC:
Intravascular susceptibility contrast mechanisms in tissues. Magn
Reson Med. 31:9–21. 1994.PubMed/NCBI View Article : Google Scholar
|
|
18
|
Fernandez-Seara MA and Wehrli FW:
Postprocessing technique to correct for background gradients in
image-based R*(2) measurements. Magn Reson Med.
44:358–366. 2000.PubMed/NCBI View Article : Google Scholar
|
|
19
|
Liu C, Li W, Tong KA, Yeom KW and
Kuzminski S: Susceptibility-weighted imaging and quantitative
susceptibility mapping in the brain. J Magn Reson Imaging.
42:23–41. 2015.PubMed/NCBI View Article : Google Scholar
|
|
20
|
Li W, Wu B and Liu C: Quantitative
susceptibility mapping of human brain reflects spatial variation in
tissue composition. NeuroImage. 55:1645–1656. 2011.PubMed/NCBI View Article : Google Scholar
|
|
21
|
Liu T, Spincemaille P, de Rochefort L,
Kressler B and Wang Y: Calculation of susceptibility through
multiple orientation sampling (COSMOS): A method for conditioning
the inverse problem from measured magnetic field map to
susceptibility source image in MRI. Magn Reson Med. 61:196–204.
2009.PubMed/NCBI View Article : Google Scholar
|
|
22
|
Langkammer C, Schweser F, Krebs N,
Deistung A, Goessler W, Scheurer E, Sommer K, Reishofer G, Yen K,
Fazekas F, et al: Quantitative susceptibility mapping (QSM) as a
means to measure brain iron? A post mortem validation study.
NeuroImage. 62:1593–1599. 2012.PubMed/NCBI View Article : Google Scholar
|
|
23
|
Liu T, Eskreis-Winkler S, Schweitzer AD,
Chen W, Kaplitt MG, Tsiouris AJ and Wang Y: Improved subthalamic
nucleus depiction with quantitative susceptibility mapping.
Radiology. 269:216–223. 2013.PubMed/NCBI View Article : Google Scholar
|
|
24
|
Langkammer C, Pirpamer L, Seiler S,
Deistung A, Schweser F, Franthal S, Homayoon N, Katschnig-Winter P,
Koegl-Wallner M, Pendl T, et al: Quantitative Susceptibility
Mapping in Parkinson's Disease. PLoS One.
11(e0162460)2016.PubMed/NCBI View Article : Google Scholar
|
|
25
|
Murakami Y, Kakeda S, Watanabe K, Ueda I,
Ogasawara A, Moriya J, Ide S, Futatsuya K, Sato T, Okada K, et al:
Usefulness of quantitative susceptibility mapping for the diagnosis
of Parkinson disease. AJNR Am J Neuroradiol. 36:1102–1108.
2015.PubMed/NCBI View Article : Google Scholar
|
|
26
|
He N, Ling H, Ding B, Huang J, Zhang Y,
Zhang Z, Liu C, Chen K and Yan F: Region-specific disturbed iron
distribution in early idiopathic Parkinson's disease measured by
quantitative susceptibility mapping. Hum Brain Mapp. 36:4407–4420.
2015.PubMed/NCBI View Article : Google Scholar
|
|
27
|
Hughes AJ, Daniel SE, Kilford L and Lees
AJ: Accuracy of clinical diagnosis of idiopathic Parkinson's
disease: A clinico-pathological study of 100 cases. J Neurol
Neurosurg Psychiatry. 55:181–184. 1992.PubMed/NCBI View Article : Google Scholar
|
|
28
|
Hoehn MM and Yahr MD: Parkinsonism: Onset,
progression, and mortality. 1967. Neurology. 57 (10 Suppl
3):S11–S26. 2001.PubMed/NCBI
|
|
29
|
Wu B, Li W, Guidon A and Liu C: Whole
brain susceptibility mapping using compressed sensing. Magn Reson
Med. 67:137–147. 2012.PubMed/NCBI View Article : Google Scholar
|
|
30
|
Schweser F, Deistung A, Lehr BW and
Reichenbach JR: Quantitative imaging of intrinsic magnetic tissue
properties using MRI signal phase: An approach to in vivo brain
iron metabolism? NeuroImage. 54:2789–2807. 2011.PubMed/NCBI View Article : Google Scholar
|
|
31
|
Li W, Wang N, Yu F, Han H, Cao W, Romero
R, Tantiwongkosi B, Duong TQ and Liu C: A method for estimating and
removing streaking artifacts in quantitative susceptibility
mapping. NeuroImage. 108:111–122. 2015.PubMed/NCBI View Article : Google Scholar
|
|
32
|
Li W, Langkammer C, Chou YH, Petrovic K,
Schmidt R, Song AW, Madden DJ, Ropele S and Liu C: Association
between increased magnetic susceptibility of deep gray matter
nuclei and decreased motor function in healthy adults. NeuroImage.
105:45–52. 2015.PubMed/NCBI View Article : Google Scholar
|
|
33
|
Li W, Wu B, Batrachenko A, Bancroft-Wu V,
Morey RA, Shashi V, Langkammer C, De Bellis MD, Ropele S, Song AW
and Liu C: Differential developmental trajectories of magnetic
susceptibility in human brain gray and white matter over the
lifespan. Hum Brain Mapp. 35:2698–2713. 2014.PubMed/NCBI View Article : Google Scholar
|
|
34
|
Lewis MM, Du G, Kidacki M, Patel N,
Shaffer ML, Mailman RB and Huang X: Higher iron in the red nucleus
marks Parkinson's dyskinesia. Neurobiol Aging. 34:1497–1503.
2013.PubMed/NCBI View Article : Google Scholar
|
|
35
|
Zywicke HA, van Gelderen P, Connor JR,
Burdo JR, Garrick MD, Dolan KG, Frank JA and Bulte JW: Microscopic
R2* mapping of reduced brain iron in the Belgrade rat.
Ann Neurol. 52:102–105. 2002.PubMed/NCBI View Article : Google Scholar
|
|
36
|
Liu C, Wei H, Gong NJ, Cronin M, Dibb R
and Decker K: Quantitative susceptibility mapping: Contrast
mechanisms and clinical applications. Tomography. 1:3–17.
2015.PubMed/NCBI View Article : Google Scholar
|
|
37
|
Griffiths PD, Dobson BR, Jones GR and
Clarke DT: Iron in the basal ganglia in Parkinson's disease. An in
vitro study using extended X-ray absorption fine structure and
cryo-electron microscopy. Brain. 122:667–673. 1999.PubMed/NCBI View Article : Google Scholar
|
|
38
|
Meineke J, Rauscher A, Marques JP, Bilgic
B and Langkammer C: Quantitative Susceptibility Mapping in
Parkinson's Disease. Magnetic Resonance Med.
11(e0162460)2016.PubMed/NCBI View Article : Google Scholar
|
|
39
|
Double KL, Gerlach M, Youdim MB and
Riederer P: Impaired iron homeostasis in Parkinson's disease. J
Neural Transm Suppl. S37–S58. 2000.PubMed/NCBI View Article : Google Scholar
|
|
40
|
Gerlach M, Double KL, Ben-Shachar D, Zecca
L, Youdim MB and Riederer P: Neuromelanin and its interaction with
iron as a potential risk factor for dopaminergic neurodegeneration
underlying Parkinson's disease. Neurotox Res. 5:35–44.
2003.PubMed/NCBI View Article : Google Scholar
|
|
41
|
Zecca L, Youdim MB, Riederer P, Connor JR
and Crichton RR: Iron, brain ageing and neurodegenerative
disorders. Nat Rev Neurosci. 5:863–873. 2004.PubMed/NCBI View Article : Google Scholar
|
|
42
|
Gerlach M, Double KL, Youdim MB and
Riederer P: Potential sources of increased iron in the substantia
nigra of parkinsonian patients. J Neural Transm Suppl. S133–S142.
2006.PubMed/NCBI View Article : Google Scholar
|
|
43
|
Drayer B, Burger P, Darwin R, Riederer S,
Herfkens R and Johnson GA: MRI of brain iron. AJR Am J Roentgenol.
147:103–110. 1986.PubMed/NCBI View Article : Google Scholar
|
|
44
|
Habas C and Cabanis EA: Cortical
projection to the human red nucleus: Complementary results with
probabilistic tractography at 3 T. Neuroradiology. 49:777–784.
2007.PubMed/NCBI View Article : Google Scholar
|
|
45
|
Lapresle J and Hamida MB: The
dentato-olivary pathway. Somatotopic relationship between the
dentate nucleus and the contralateral inferior olive. Arch Neurol.
22:135–143. 1970.PubMed/NCBI View Article : Google Scholar
|
|
46
|
Bird TD and Shaw CM: Progressive myoclonus
and epilepsy with dentatorubral degeneration: A clinicopathological
study of the Ramsay Hunt syndrome. J Neurol Neurosurg Psychiatry.
41:140–149. 1978.PubMed/NCBI View Article : Google Scholar
|
|
47
|
Graham JM, Paley MN, Grunewald RA, Hoggard
N and Griffiths PD: Brain iron deposition in Parkinson's disease
imaged using the PRIME magnetic resonance sequence. Brain 123 Pt.
12:2423–2431. 2000.PubMed/NCBI View Article : Google Scholar
|
|
48
|
Wood JC, Enriquez C, Ghugre N, Tyzka JM,
Carson S, Nelson MD and Coates TD: MRI R2 and R2*
mapping accurately estimates hepatic iron concentration in
transfusion-dependent thalassemia and sickle cell disease patients.
Blood. 106:1460–1465. 2005.PubMed/NCBI View Article : Google Scholar
|
|
49
|
Homayoon N, Pirpamer L, Franthal S,
Katschnig-Winter P, Kögl M, Seiler S, Wenzel K, Hofer E,
Deutschmann H, Fazekas F, et al: Nigral iron deposition in common
tremor disorders. Mov Disord. 34:129–132. 2019.PubMed/NCBI View Article : Google Scholar
|
|
50
|
Barbosa JH, Santos AC, Tumas V, Liu M,
Zheng W, Haacke EM and Salmon CE: Quantifying brain iron deposition
in patients with Parkinson's disease using quantitative
susceptibility mapping, R2 and R2. Magn Reson Imaging. 33:559–565.
2015.PubMed/NCBI View Article : Google Scholar
|
|
51
|
Lotfipour AK, Wharton S, Schwarz ST, Gontu
V, Schäfer A, Peters AM, Bowtell RW, Auer DP, Gowland PA and Bajaj
NP: High resolution magnetic susceptibility mapping of the
substantia nigra in Parkinson's disease. J Magn Reson Imaging.
35:48–55. 2012.PubMed/NCBI View Article : Google Scholar
|
|
52
|
Eapen M, Zald DH, Gatenby JC, Ding Z and
Gore JC: Using high-resolution MR imaging at 7T to evaluate the
anatomy of the midbrain dopaminergic system. AJNR Am J Neuroradiol.
32:688–694. 2011.PubMed/NCBI View Article : Google Scholar
|
|
53
|
Schafer A, Forstmann BU, Neumann J,
Wharton S, Mietke A, Bowtell R and Turner R: Direct visualization
of the subthalamic nucleus and its iron distribution using
high-resolution susceptibility mapping. Hum Brain Mapp.
33:2831–2842. 2012.PubMed/NCBI View Article : Google Scholar
|