Introduction
At the dawn of 2019 the World Health Organization
(WHO) was notified by the Chinese authorities on novel coronavirus
(2019-nCoV) causing severe respiratory illness emerging from Hubei
Providence of China and particularly linked to the seafood market
of Wuhan city (1). The clinical
characteristics of the disease are non-specific and comprise fever,
cough, fatigue and shortness of breath in the majority of cases
(2). Other factors that contribute
to the lethality and severity of the cases include obesity
(3), chronic cardiovascular diseases
(4) and smoking habits (5). Many attempts for an effective vaccine
are currently under development (6)
and traditional antiviral antibacterial and anti-inflammatory
agents such as zinc (7) has been
used to reduce the risk of co-infections. Imaging investigation, in
the context of chest X-rays or computed tomography (CT) has a vital
role in disease management. Bilateral airspace opacities showing a
peripheral and lower-zone predominance represent the most frequent
findings on both modalities (1,8-10).
Additionally, it has been reported that chest X-ray screening for
asymptomatic carriers of COVID-19 may serve as a viable substitute
for the available reverse transcription-quantitative polymerase
chain reaction (RT-qPCR) tests (11,12). The
high infection rate of COVID-19 caused, in a short period of time,
an unprecedented burden on the healthcare systems, pushing
intensive care units (ICU) treating multimorbid or other high-risk
patients to the limits. Therefore, as recently reported, given the
shortages and delays in PCR tests, chest X-rays have become one of
the fastest and most affordable ways for doctors to triage patients
(13). As a result, faced with staff
shortages and overwhelming patient loads, a growing number of
hospitals are turning to automated tools to support them manage the
pandemic. In such a context artificial intelligence (AI) COVID-19
classification systems based on chest X-rays represent a
cost-beneficial solution for the early detection/diagnosis of
infection and timely risk stratifications of patients.
The recent COVID-19 pandemic initiated an abundance
of unpublished preprints available on open databases claiming
accuracy (ACC) scores up to 99% (14-20)
for COVID-19 screening on chest X-rays. These deep learning models
incorporate a variety of architectures such as Generative
Adversarial Networks (GANs) for data augmentation, capsule networks
and transfer learning techniques. Most notably, SqueezeNet was used
with Bayesian hyperparameter optimization achieving an ACC of 98.3%
(21). Transfer learning techniques
are crucial for deep learning model convergence on limited data,
since there is a scarcity of a large and widely available COVID-19
imaging repository. Many transfer learning models have been tested
on small X-ray datasets with ACC up to 98.75% for binary (COVID and
normal) and among three classes, with pneumonia being the third, up
to 93.48% (22). Moreover, GANs have
been used jointly with transfer learning (23) to further augment the limited COVID
X-ray pool improving the prediction performance with an ACC of
99.9%. Additionally, CT semantic features related to COVID-19 were
similarly observed (9) and a
significant detection sensitivity (SEN) of the disease of 88% was
reported (10).
A self-supervised encoder deep learning architecture
was deployed on raw CT slices achieving an area under the curve
(AUC) of 94% (24). This impressive
performance was challenged by the poor results of Grad-CAM
attention maps mainly denoting regions with high contrast but
irrelevant to the lung parenchyma. This effect can be attributed to
the lack of a proper preprocessing protocol including image
resolution normalization and lung segmentation, as well as
limitations in the proposed interpretable framework. Zhao et
al (25) composed a COVID-19 CT
dataset with selected lesion slices achieving an AUC of 82.9%. On
the other hand, deep models trained with similar data but evaluated
on external testing sets reported AUC up to 90% (26,27).
Current scientific evidence suggests that AI can provide the
necessary tools for a fast, accessible and accurate screening
process based on imaging data such as X-rays or CT examinations,
although a robust interpretability framework, which is also
evaluated by clinical experts with years of experience, remains an
unmet need.
This study proposes a deep learning-based COVID-19
classification system based on X-rays. The main novelty of our
proposed model lies in the classification of COVID-19 against
common pneumonia cases and not normal (healthy) ones. The
discrimination between COVID-19 and other, especially those of
viral origin, pneumonias is intuitively more complex given the
non-specific clinical signs and symptoms (2). Another advantage of our proposed
pipeline relies on the evaluation of the attention maps that are
created for each prediction, which represents a basic
interpretability step aiming to increase trust in the final
decision. The proposed method outperforms the state of the art with
respect to the binary and quaternary classification tasks of
Pneumonia vs COVID-19, achieving an average AUC=1, ACC=100%,
SEN=99%, specificity (SPC)=100% for the binary classification and
AUC=93, ACC=76%, SEN=93%, SPC=87% for the quaternary
classification, across 5 folds. The model also performs close to
the state of the art with respect to the ternary classification
task (i.e., normal, pneumonia, COVID-19). To assess the relevance
of the generated attention maps, they were rated by expert
radiologists in order to evaluate whether the proposed solution
could evolve into an interpretable diagnostic framework.
Materials and methods
Dataset
In this study, we used two fully anonymized chest
X-ray datasets of COVID-19 cases. The first one is the publicly
available dataset shared by Cohen et al (28), which is continually updated with new
cases. It consists of chest X-ray and CT images of several
syndromes, such as acute respiratory distress syndrome (ARDS),
COVID-19, Middle East respiratory syndrome (MERS), pneumonia, and
severe acute respiratory syndrome (SARS). The X-ray dataset was
accessed on the 11th of April 2020, when it included 216 COVID-19
positive cases. For this study, 115 postero-anterior (PA) X-ray
views were extracted. We have chosen only the PA view, because as
it represents the most commonly used radiological investigation in
the emergency department (29), it
is available in the corresponding pneumonia dataset. The second
COVID-19 dataset originated from the QUIBIM imagingcovid19 platform
database and various public repositories, including RSNA, IEEE,
RadioGyan and the British Society of Thorathic Imaging. All these
sources provided data mostly from Italy, Argentina, Mexico, and
India, and consist of 22 PA X-ray views of patients with determined
COVID-19 pneumonia. These two datasets were subsequently combined
into one set, effectively forming the final COVID-19 dataset of 137
images used in this study. In addition, we used a publicly
available X-ray dataset of patients with pneumonia (30,31),
since our ultimate objective was to perform a multiclass
classification between normal, COVID-19 and pneumonia subjects
utilizing sole X-ray data. The pneumonia dataset consisted of 5,856
X-ray images categorized into 3 classes, i.e., 1,583 normal
(healthy) cases, 2,780 and 1,493 pneumonia positive cases caused by
bacteria and viruses (other viruses apart from COVID-19),
respectively. In order to ensure balance in sample size across
datasets (Table I), we randomly
selected 150 images from each class, for the purposes of our
study.
 | Table IDataset examined patient cohort. |
Table I
Dataset examined patient cohort.
| Examined
classes |
|---|
| Normal | COVID-19 | Bacteria
pneumonia | Virus
pneumonia |
|---|
| 150 | 122 | 150 | 150 |
Preprocessing and augmentation
The images were resized to 512 by 512 pixels, and
were sample-wise normalized to zero mean and unit variance. A
real-time image augmentation technique was used during training, in
order to enhance the size and quality of the training dataset.
Specifically, we utilized the ImageDataGenerator class of Keras
(https://keras.io). The augmentation options included
geometrical distortions such as small rotations, shearing and
zooming up to a factor of 20%.
Model architecture
Hyperparameter optimization was used to identify the
highest performing pretrained model (Inception V3) for
differentiating the examined COVID-19 X-rays. The proposed model's
pipeline includes two main deep learning components. The first one
is a convolutional neural network (CNN) backbone network without
its fully connected layers, namely the Inception-V3(32). The Inception-V3 was trained on the
ImageNet database (33), which
consists of approximately 14 million images divided into a thousand
classes. It is worth stating that transfer learning has been
successfully utilized in numerous medical imaging problems, such as
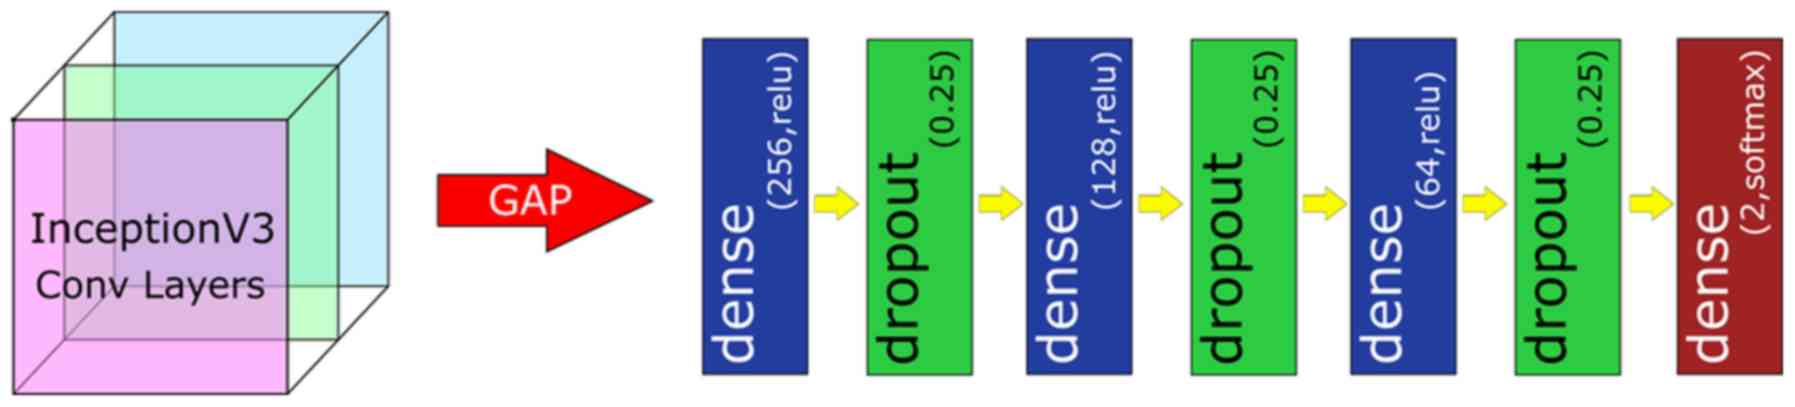
diabetic retinopathy detection from fundus images (34). The second component of the model's
pipeline is a standard deep neural network classifier (Fig. 1). It consists of a global average
pooling (GAP) layer, 3 fully-connected layers of 256, 128 and 64
neurons, respectively, each activated by a ReLU function, and
followed by a Dropout layer with 25% dropout rate. The GAP layer
computes the mean value of each feature map, effectively
downscaling and flattening the output of InceptionV3. A final
n-neuron layer follows, which includes 2-neurons for binary
classification, 3-neurons for ternary classification and 4-neurons
for quaternary classification, with softmax activation function
being applied.
Evaluation of transfer learning
methods
The trained models were evaluated in the unseen
testing sets across 5 folds. The metrics used are prediction ACC,
SEN, precision (PRE), AUC score for the binary, AUC one versus rest
(AUC OvR) and AUC one versus one (AUC OvO) for the multiclass
classification:
Interpretability
In order to enhance the model's interpretability, we
applied the GradCAM (35) algorithm
to visualize the importance of each pixel on the final decision.
GradCAM examines the gradient information flowing from the input
layer up to the last convolutional layer, for a given class label,
providing a qualitative attention map for assessing the performance
of the network. In particular, in order to generate the
class-discriminative localization map Grad-CAM computes the
gradients of the score for class c before the softmax,
yc, with respect to the last set of feature maps
of the CNN Ak (i.e., the output of the last
convolutional block, exactly before the FCN), i.e.,
∂yc / ∂Ak. To obtain the
weights of the neurons importance, the new gradients are computed
by the global average pooling layer over the dimensions of the
image akc. Finally, a linear
combination of the weights and the feature maps is applied,
followed by a ReLU function, to produce the heatmap. The heatmap
was subsequently resized to the initial dimension of the image and
overlaid on it. It should be noted that these visualizations are
based on the output of the convolutional part of the network but
not on the classification part. Thus, the fully connected layers of
the classification network may further process these features,
effectively applying a selection strategy on them, in order to
predict the final outcome. As a result, caution is required when
interpreting the visualizations, as they are simply indications of
where the Deep Learning System is ‘looking at’ in order to make its
decision.
In order to validate the interpretability of the
generated attention maps, we asked two experienced radiologists to
rate these attention maps, based on how close they are with respect
to the actual region of diagnostic interest. For each image they
provided two grades, one for each hemithorax (lung). The grading
scale ranged from 0 to 4. Details regarding the utilized grading
scale are provided in Table II. Any
difference between the grading of each expert was resolved via
consensus between both experts.
| Table IIEvaluation grading system of
Attention maps. |
Table II
Evaluation grading system of
Attention maps.
| Grades | |
|---|
| 0 | The attention map
is mostly homogeneous across the entire imagea |
| 1 | The attention map
is focusing on totally irrelevant areas outside the
lungb |
| 2 | The attention map
is focusing on the lung areas but also on other extrapulmonary
structuresc |
| 3 | The attention map
is focusing mostly on the lung areasd |
| 4 | The attention map
is focusing exclusively on the lung arease |
Results
Model convergence
Our model was trained for 20 epochs, using the
categorical cross-entropy loss function (equation 1) and Adam
optimizer (36) with a batch size of
8.
where C is the total number of classes,
ti is the one-hot-encoded ground truth and
f(si) is the prediction probability for a given
sample s.
Also, we used an exponentially decaying learning
rate with an initial value of 0.001 and a decay rate of 0.96. The
CNN InceptionV3 backbone's layers were ‘frozen’, so that only our
custom classifier would be trained. The model was trained on a
stratified 5-fold cross validation schema, utilizing one fold for
the independent testing and the rest for training and validation
purposes. The validation set was used for early-stopping during the
training phase. The k-fold separation schema ensured that we can
iteratively test the trained models on the whole dataset providing
a clearer insight on its performance, while at the same time the
training, validation and testing sets do not overlap amongst
themselves on the one hand, and across all folds on the other. The
validation set was randomly selected as a 10% subset of the
training/validation folds, while 90% was used for training. The
model was trained on a server with an AMD EPYC 7251 8-core 2.9GHz
CPU, RTX 2080Ti 11GB GPU and 64GB RAM, and it was implemented on
Tensorflow 2.1, utilizing the Keras module. The source code is
available at the following GitHub repository (https://github.com/tsikup/COVID-19-xray-cnn).
Binary classification
We initially trained the model for detecting
pneumonia and COVID-19 cases. Given that our COVID-19 dataset has a
size of 137 and since our pneumonia dataset consisted of 300 cases
(150 of each subclass i.e., bacteria and virus), we randomly
sampled 75 images from each pneumonia subclass, so that we
generated balanced datasets. As a result, the dataset for binary
classification consisted of 150 pneumonia (75 of each pneumonia
subclass) and 137 COVID-19 X-ray images. Table III (Binary row) provides
information regarding the average performance of the models trained
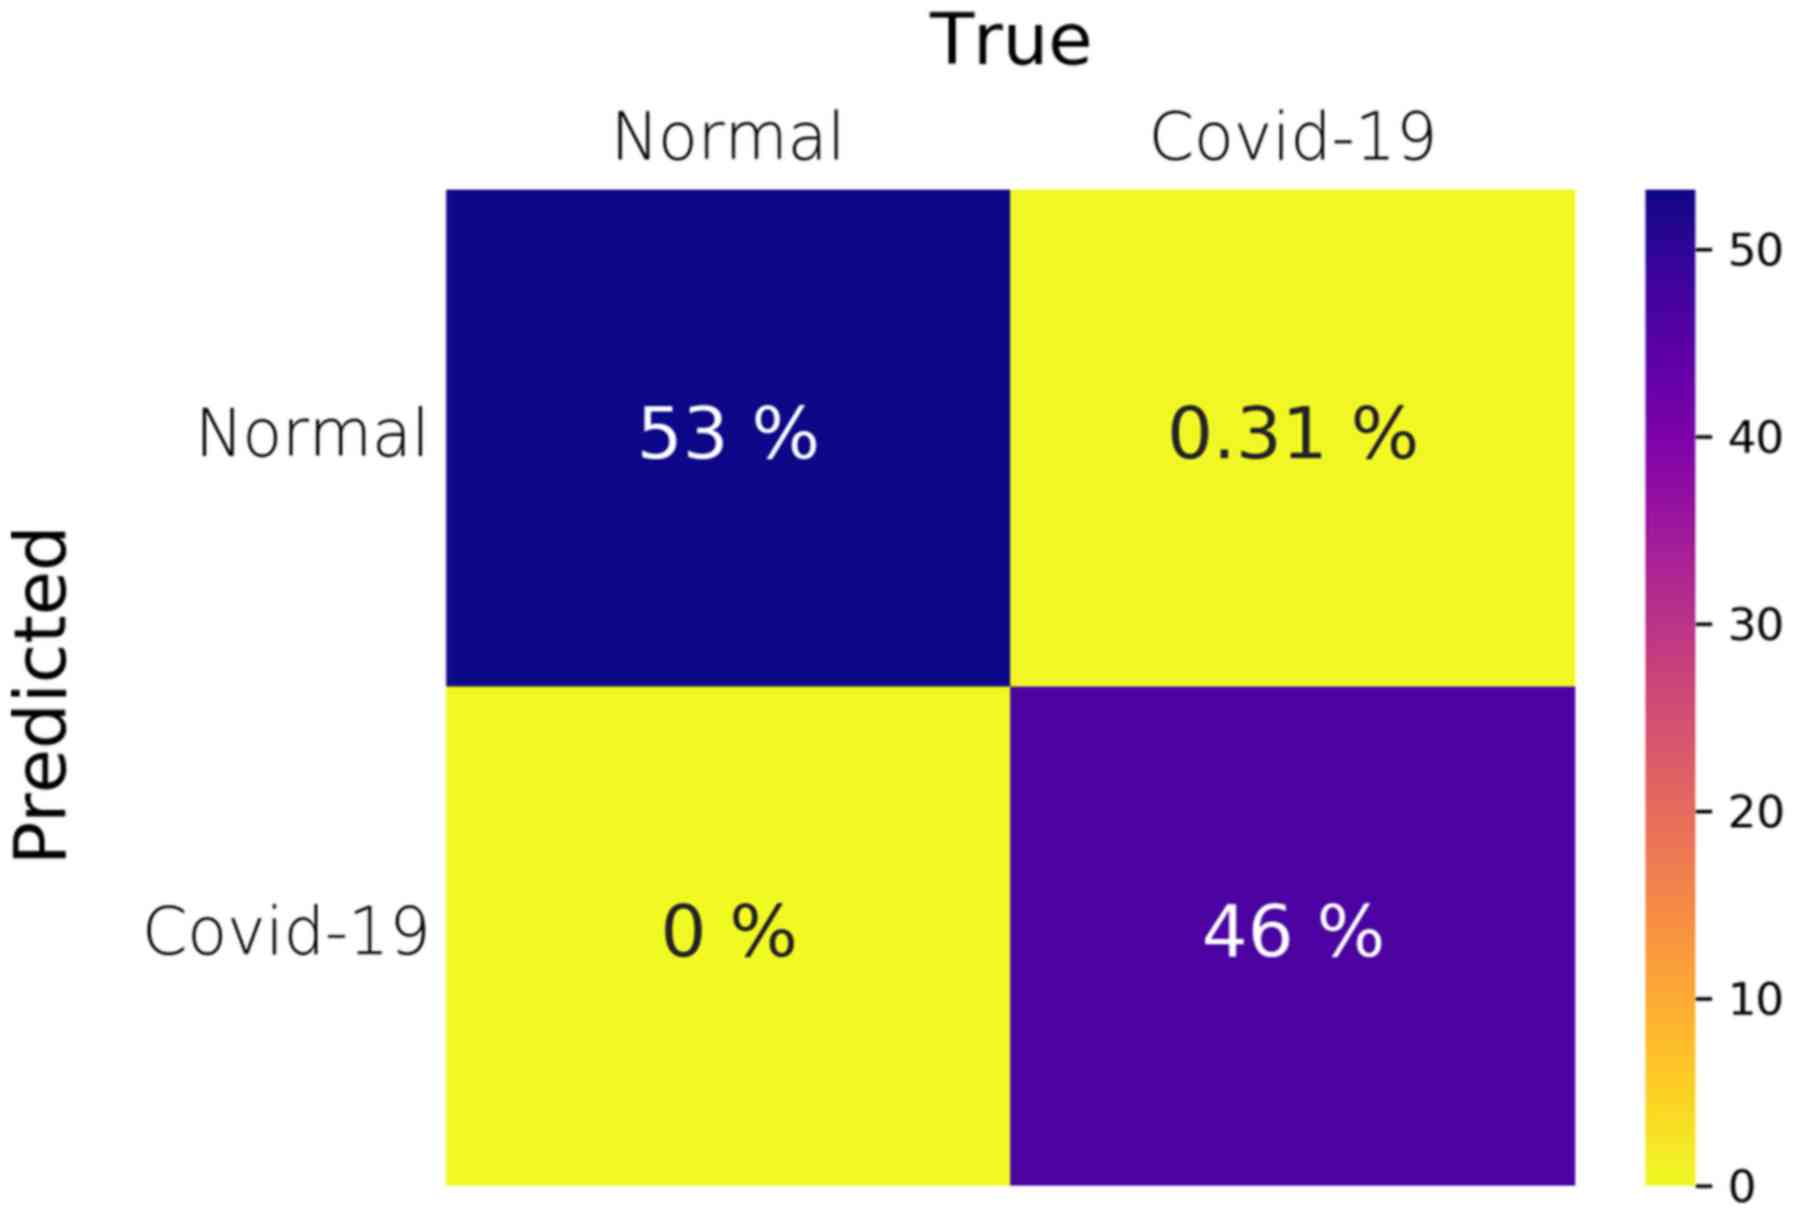
and tested on their respective folds. Our method consistently
achieves 100% in all metrics for every fold except the third one,
in which the model displayed only one false negative and no false
positive results, achieving a SEN of 99%, SPC of 100%, PRE of 100%,
an ACC of 100% and an AUC of 1. It is evident from these results
that the model can successfully distinguish and correctly detect
the two classes, i.e., pneumonia versus COVID-19. Fig. 2 illustrates the average confusion
matrix across the 5 folds. The confusion matrix of each individual
fold can be found in the supplementary document (Fig. S1). It should be noted that, although
the SEN is 99% due to the one false-negative prediction, the ACC
and AUC are reported as 100% and 1, respectively, due to the 2nd
floating point rounding procedure of the metrics.
| Table IIIPerformance evaluation of the current
literature and the proposed transfer learning model in terms of
binary (COVID vs. pnemonia), ternary (normal, COVID, pnemonia),
quaternary (normal, COVID, bacterial pnemonia, viral pnemonia)
classification.a |
Table III
Performance evaluation of the current
literature and the proposed transfer learning model in terms of
binary (COVID vs. pnemonia), ternary (normal, COVID, pnemonia),
quaternary (normal, COVID, bacterial pnemonia, viral pnemonia)
classification.a
| Type % | ACC | SEN | SPC | AUC |
|---|
| Binary |
|
Proposed | 100±1.0 | 99±2.0 | 100±0.0 | 100±0.0 |
|
Zhang et
al (14) | - | up to 96 | 70.6 | 95.1 |
|
Narin et
al (15) | 98.0 | 96.0 | 100.0 | - |
|
Afshar et
al (17) | 98.3 | 80.0 | 98.6 | - |
|
Khalifa
et al (19) | 98.7 | 98.7 | 98.7 | - |
|
Apostolopoulos
et al (22) | 96.7 | 98.6 | 96.46 | - |
|
Chowdhury
et al (37) | 98.3 | 96.7 | 100.0 | 99.8 |
| Ternary |
|
Proposed | 85±7.0 | 94±6 | 92.7±7.6 | 96±2.0 |
|
Wang et
al (16) | 92.6 | 91.3 | - | - |
|
Abbas et
al (18) | 95.1 | 97.9 | 91.8 | - |
|
Ucar et
al (21) | 98.2 | - | 99.1 | - |
|
Apostolopoulos
et al (22) | 94.7 | - | - | - |
|
Chowdhury
et al (37) | 98.3 | 96.7 | 99.0 | 99.0 |
| Quaternary |
|
Proposed | 76±8.0 | 93±9 |
91.8±7.6 | 93±3.0 |
Ternary classification
Subsequently, we trained the model for detecting
normal, pneumonia and COVID-19 cases. We also utilized the
subsampled pneumonia dataset, as previously explained in the Binary
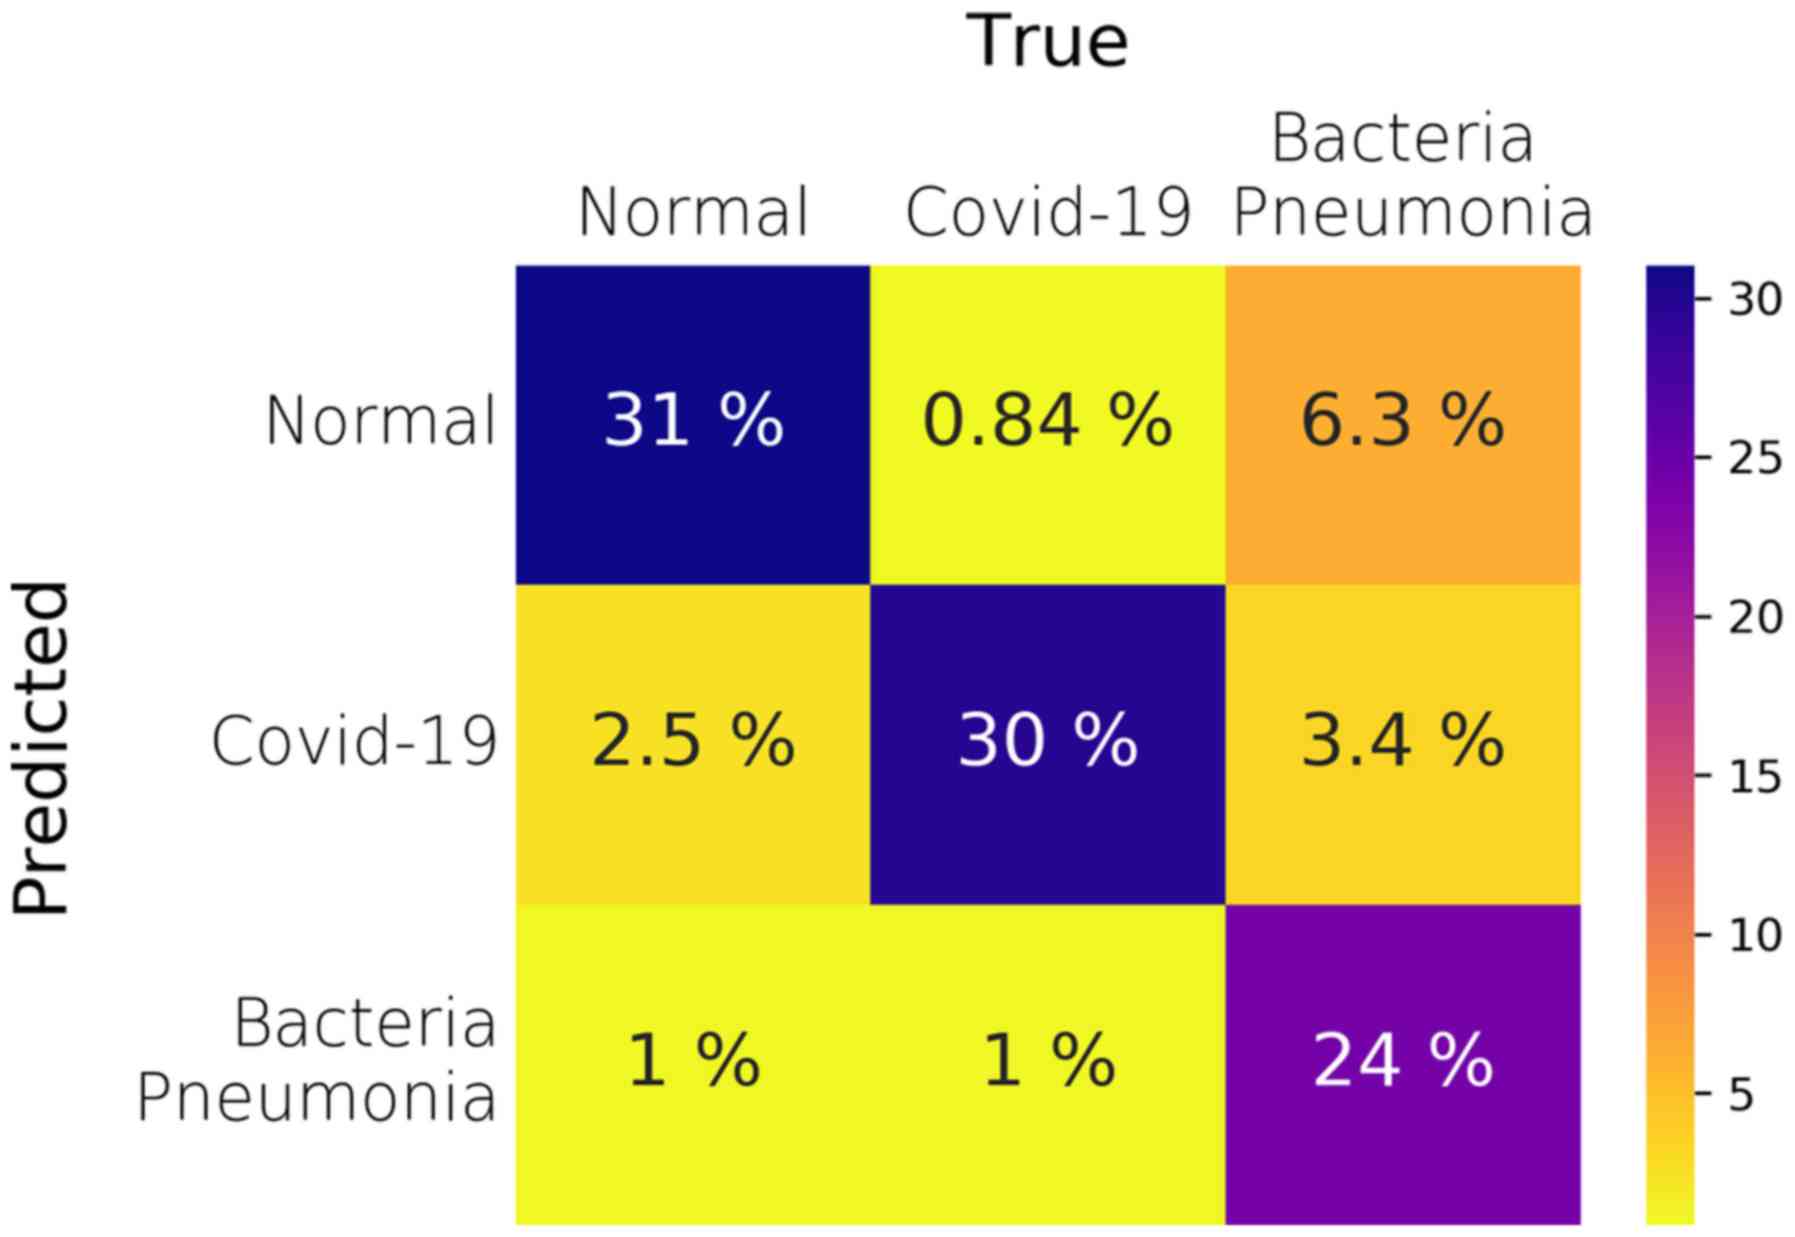
classification section. Fig. 3
illustrates the average confusion matrix across the 5 folds. The
proposed model performs very well in terms of the AUC metric in the
One-vs-Rest testing schema, achieving a mean value of 96% across
all testing folds (Table III -
Ternary row). However, the mean ACC across all folds and classes is
85%, which is lower than that observed in the Binary classification
task. In order to better understand the performance of the model,
we present the per-class analysis across all folds in supplementary
Tables
SI-SIII. It becomes evident that the model performs better when
it comes to predicting the COVID-19 cases instead of the Pneumonia
cases, since the COVID-19 SEN has a mean value of 94% as compared
to the Pneumonia one of only 72%, as reported in supplementary
Tables SII and SIII. However, the false positives and the
SPC values are worse for the COVID-19 class than those of the
pneumonia. Thus, although the model performs well on predicting the
true COVID-19 cases, it is possible that it can misclassify some
normal and pneumonia cases as COVID-19 ones. Such false positives
need to be eliminated, since in real deployment they could
potentially lead to exposing healthy or non-COVID-19 pneumonia
patients, to COVID-19 patients risking infection expansion. As a
result, the presented ternary classification requires further
improvement before it can be safely used in clinical routine.
Nonetheless, the model performs quite well regarding
the COVID-19 class, achieving an SPC of 92%, SEN of 94%, PRE of 86%
and ACC of 92% (Table SII). As seen
in the confusion matrices of each fold (Fig. S2), the COVID-19 false positives for
the first fold (a) are 18, which is much higher than the other 4
folds, in which the false positives are 0 (folds 2 and 5) and 5
(folds 3 and 4). It is our view that in order to properly verify
the model and explain such an inconsistency, a much larger training
and testing datasets are needed.
Quaternary classification
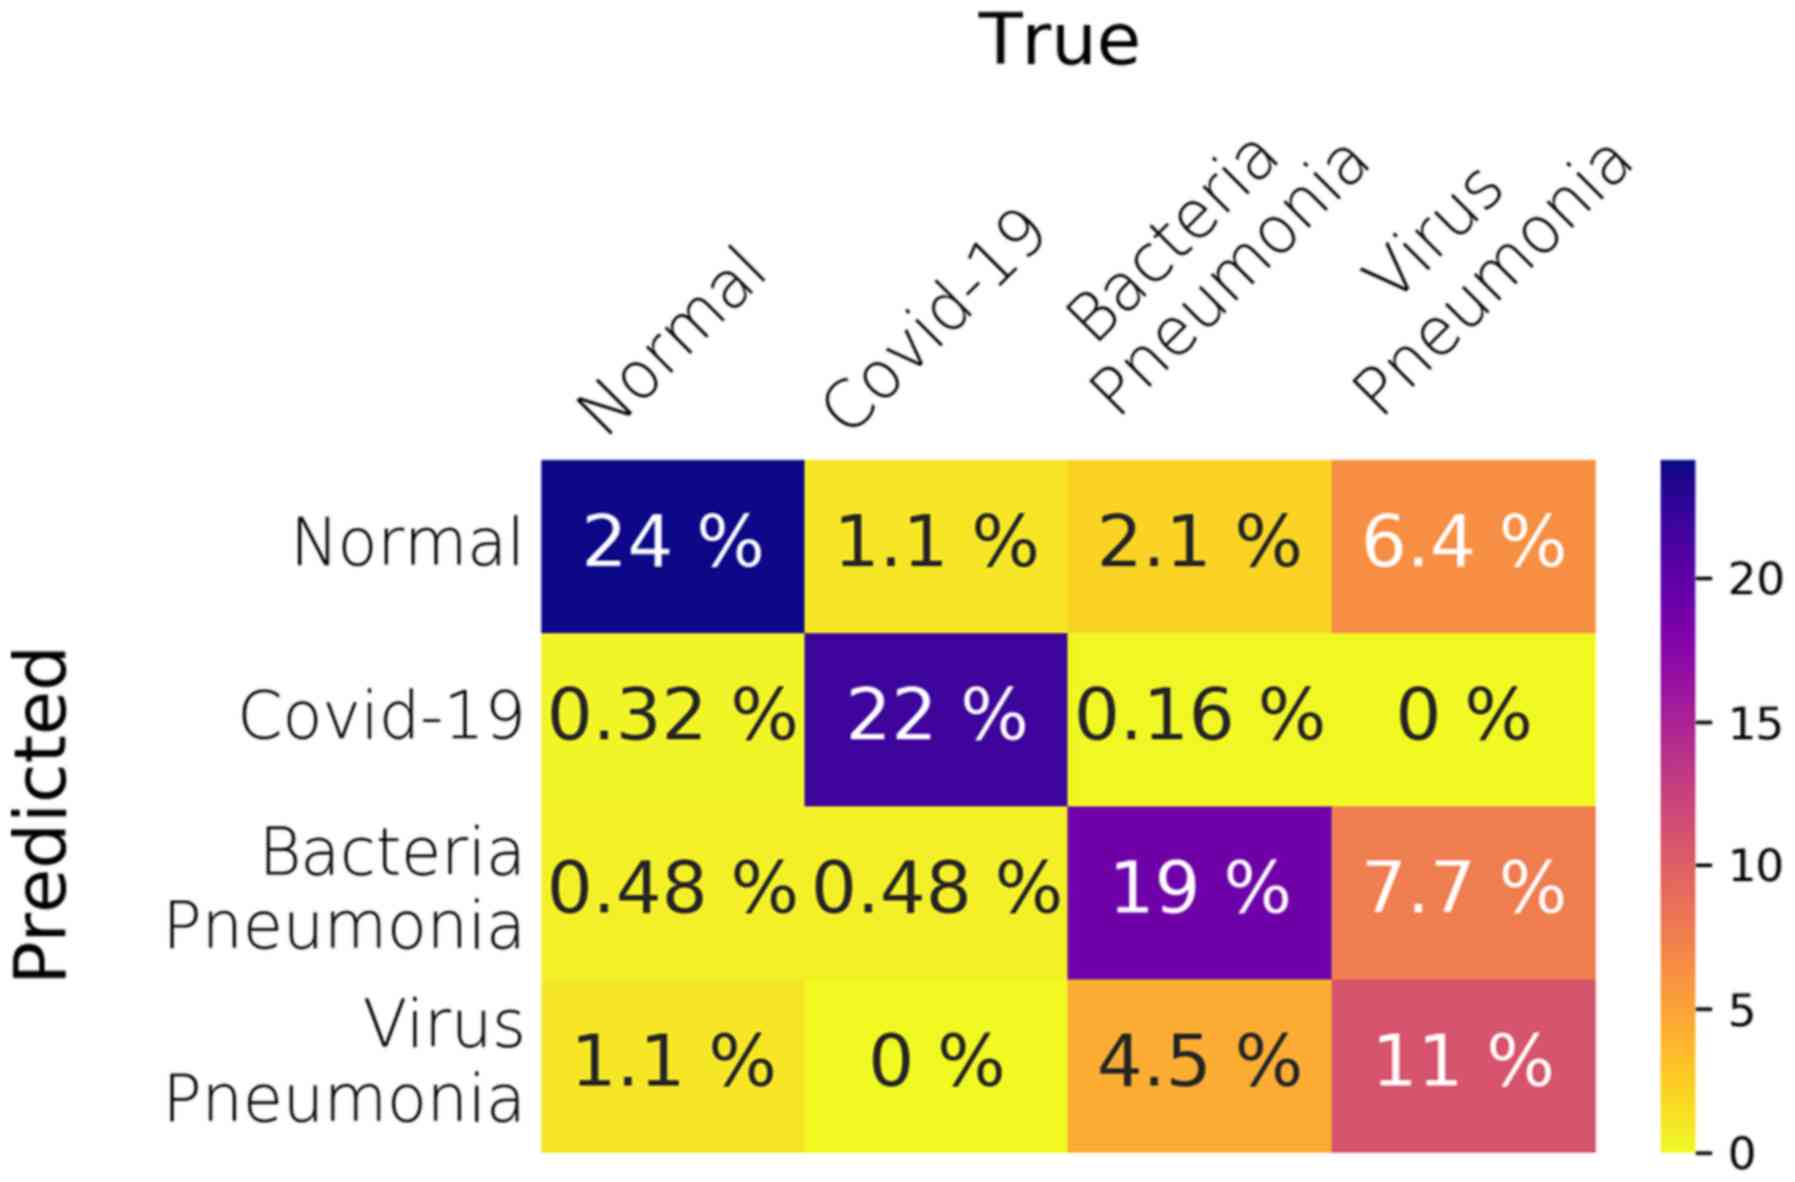
The final experiment regards the quaternary
classification between all classes of the dataset, i.e., normal,
COVID-19, bacterial pneumonia and viral pneumonia cases. The
overall performance of the model for the quaternary classification
is worse than any of the previous tasks, with a mean ACC of 76% and
an AUC of 93%. Fig. 4 illustrates
the average confusion matrix across the 5 folds.
However, as shown in the per-class performance
tables (Tables
SIV-SVII), the model performs far better regarding the COVID-19
class with less false positives than the one in the ternary
classification task, which leads to higher SPC (99%). In addition,
the performance of the model regarding the normal class is
approximately the same as the one in the ternary
classification.
The model's performance degrades in the last two
classes, i.e., bacterial and viral pneumonia cases. Especially in
the viral pneumonia, the SEN of the model is far worse than any
other class, reaching a mean value of 44% and a median value of
48%. By looking at the relevant confusion matrices, Fig. S3, the viral pneumonia cases are
misclassified as either bacteria pneumonia or normal healthy cases.
In addition, in fold 3 many bacterial pneumonia cases are
misclassified as viral pneumonia. Overall, splitting the pneumonia
cases in two separate subclasses, i.e., bacterial or viral, has
helped the model to better predict the COVID-19 cases against all
other, which is the desired task in this preliminary study.
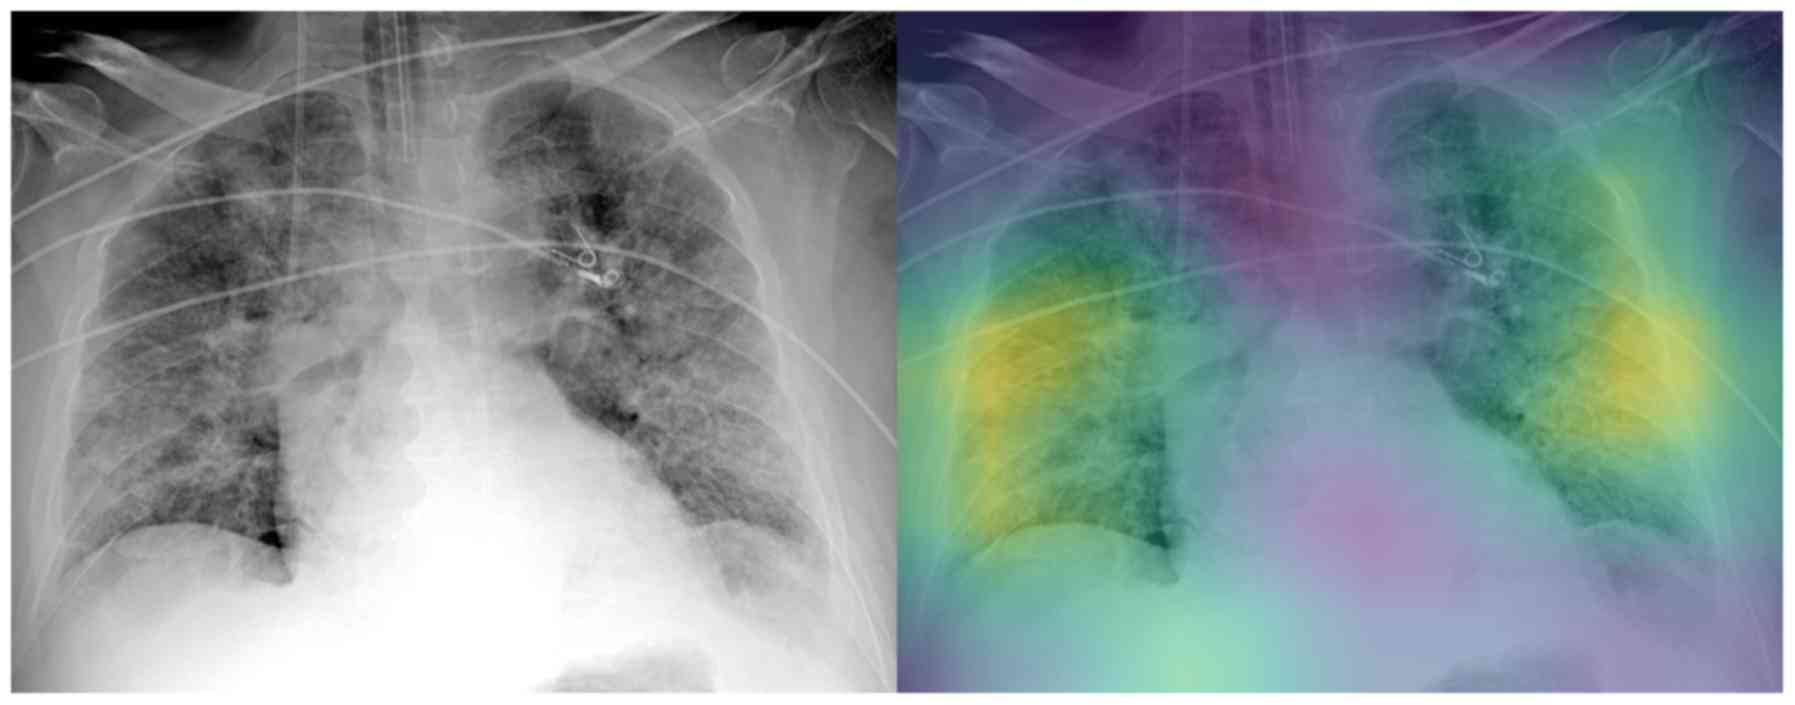
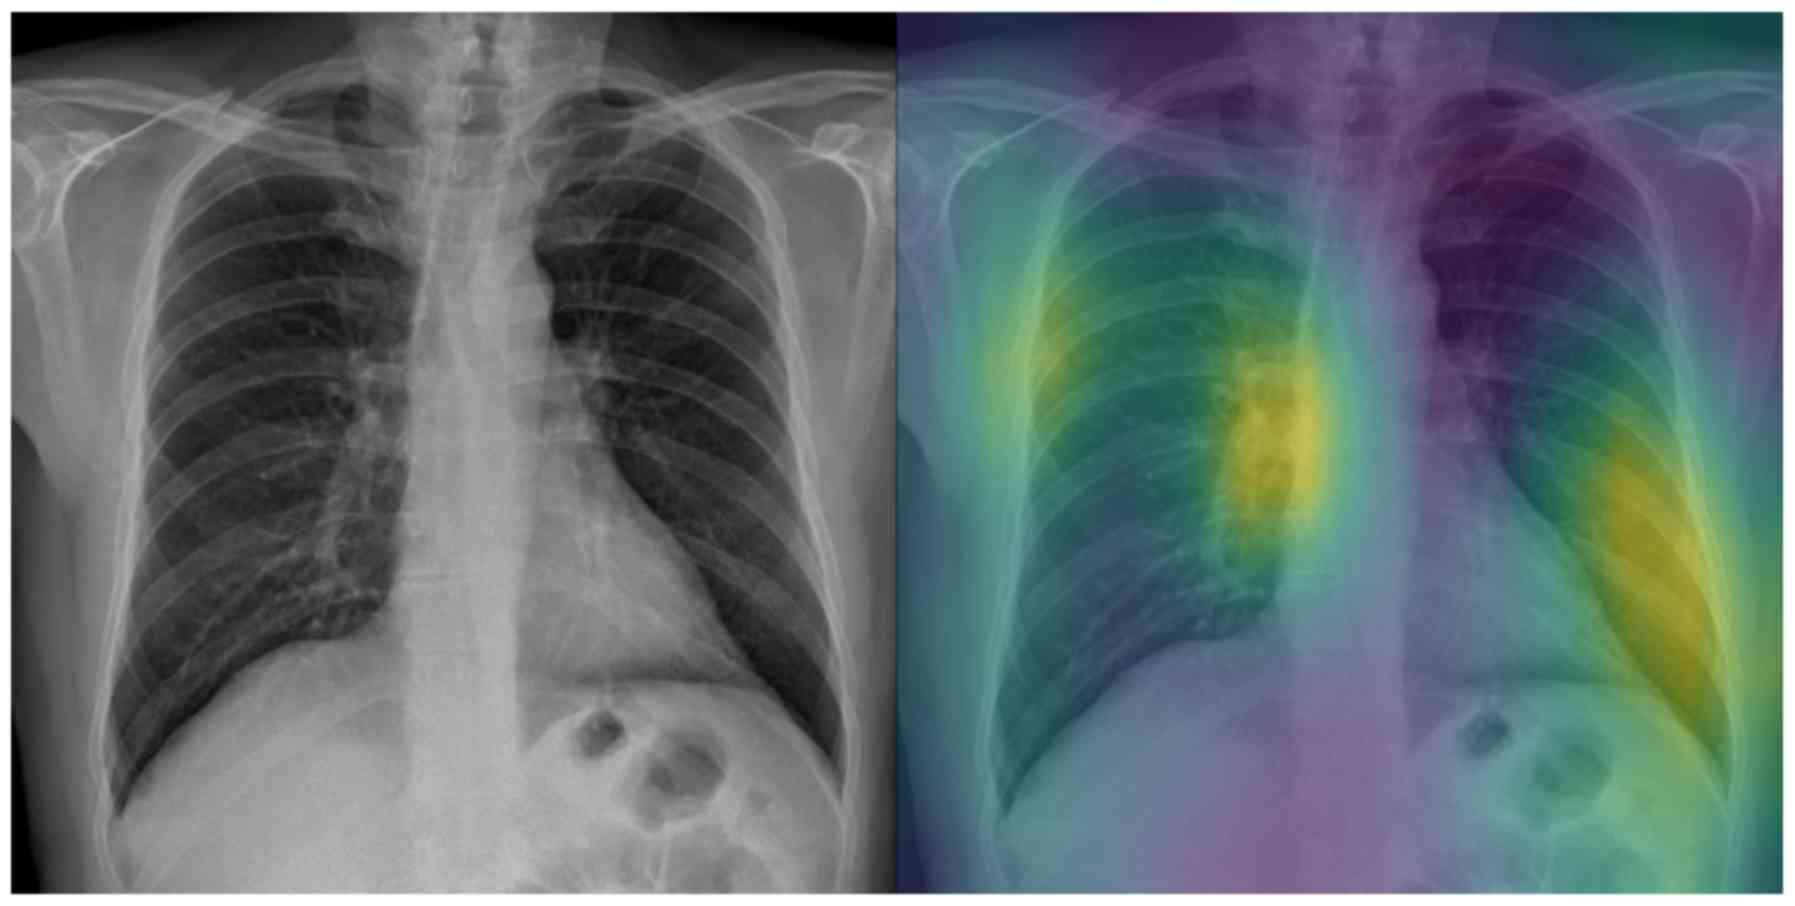
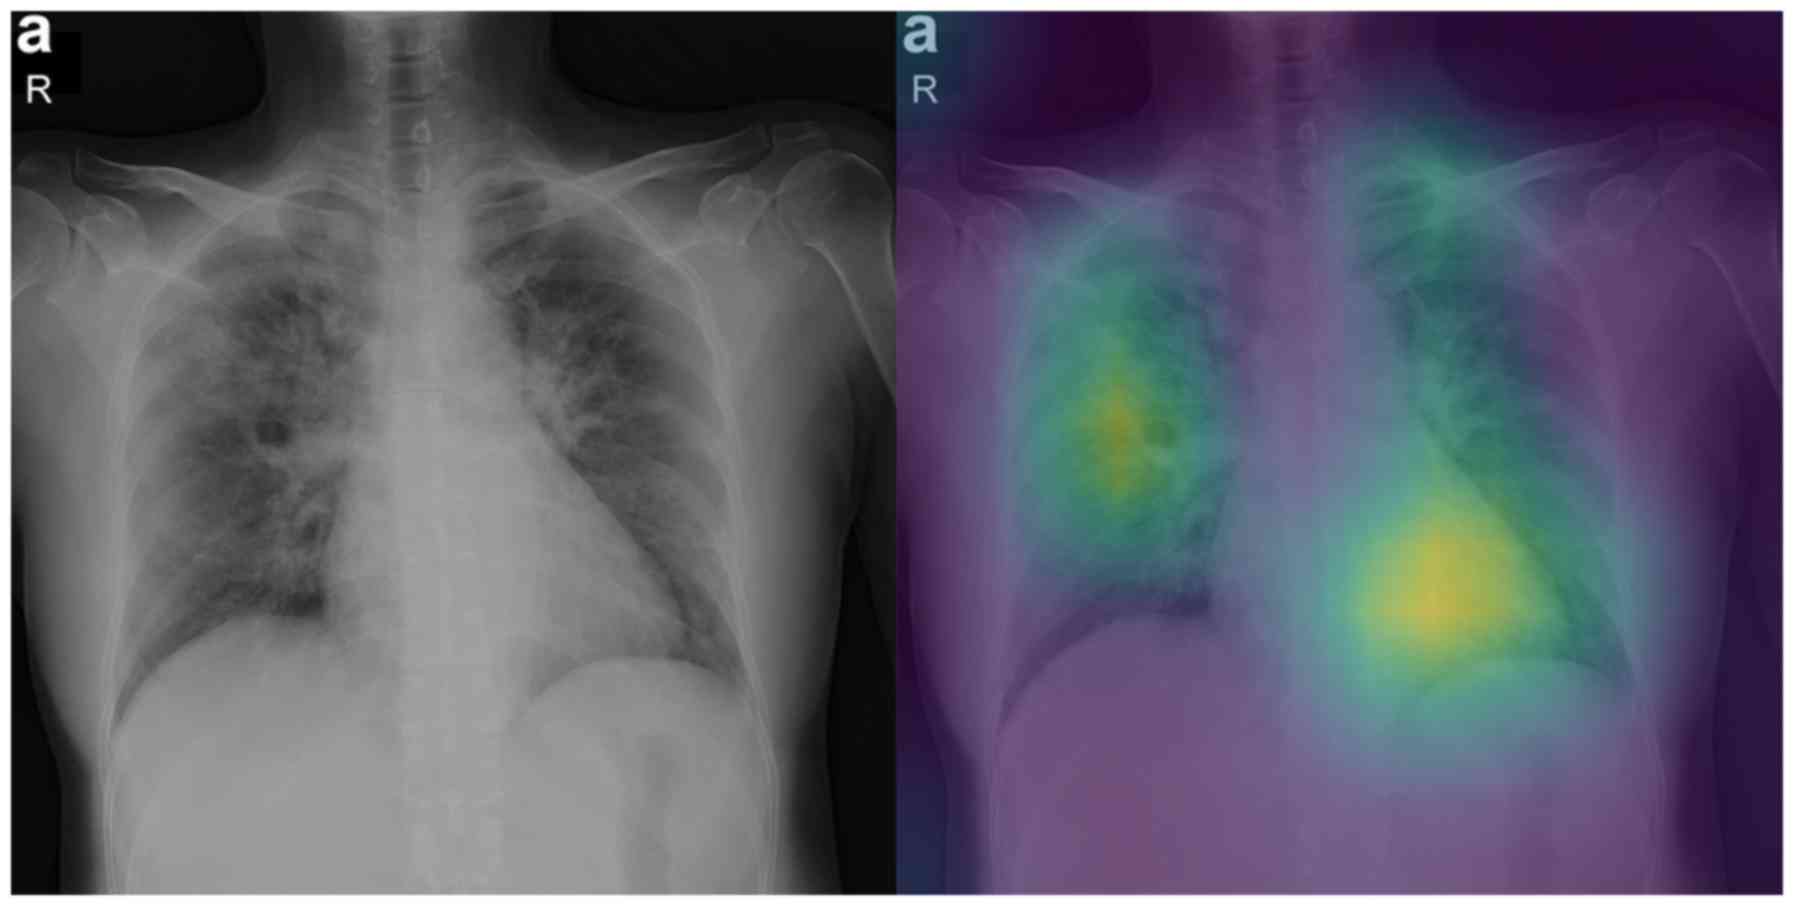
Attention maps
In this section we report some of the exported
attention maps, which visualize the convolutional part of the
network as previously discussed in the Interpretability section.
Figs. 5 and 6 visualize the attention maps of two
COVID-19 patients regarding the binary classification model, while
Figs. 7-10 present the results for the ternary classification
task. In order to accelerate the clinical acceptance of AI
classification systems there is an ongoing effort to assess the
interpretability potential of the proposed solutions. In our case,
we hypothesize that ‘attention’ to diagnostically irrelevant
regions in the image is an indication of randomness and reduced
generalizability.
The evaluation of the attention maps from two expert
radiologists is presented here. Rating was done on two randomly
selected testing sets of positively COVID-19 classified images from
the binary and the ternary classification tasks. The model had
predicted all of the images as COVID-19 correctly for the binary
classification and all but 4 for the ternary classification task.
Regarding the ternary classification the model had misclassified 2
images as pneumonia and 2 as normal.
The evaluation results can be found in Tables IV and V, while Tables
VI and VII report the
disagreements of the experts on the first and second testing set,
respectively. Regarding the binary classification testing set, the
model focuses on relevant regions mostly inside the lung for half
of the samples (grade 3). The fact that the model ‘looks’ at these
regions is very promising because they may be relevant to
diagnosing COVID-19. The fact that the model also focuses on other
regions outside the lungs (grade 2) for the other half of samples
indicates that training on a much larger dataset is needed, so that
the model exhibits a more robust performance in that respect.
| Table IVEvaluation of Attention maps by 2
radiologists regarding the Binary classification. |
Table IV
Evaluation of Attention maps by 2
radiologists regarding the Binary classification.
| | Grades |
|---|
| | Lung | 0 | 1 | 2 | 3 | 4 |
|---|
| Expert 1 | Left | 0 | 0 | 16 | 12 | 0 |
| | Right | 0 | 0 | 9 | 18 | 1 |
| Expert 2 | Left | 0 | 0 | 14 | 14 | 0 |
| | Right | 0 | 0 | 9 | 19 | 0 |
| Consensus | Left | 0 | 0 | 17 (60%) | 11 (40%) | 0 |
| | Right | 0 | 0 | 9 (32%) | 19 (68%) | 0 |
| Table VEvaluation of Attention maps by 2
radiologists regarding the Ternary classification. |
Table V
Evaluation of Attention maps by 2
radiologists regarding the Ternary classification.
| | Grades |
|---|
| | Lung | 0 | 1 | 2 | 3 | 4 |
|---|
| Expert 1 | Left | 2 | 0 | 14 | 11 | 0 |
| | Right | 1 | 0 | 5 | 17 | 4 |
| Expert 2 | Left | 2 | 0 | 15 | 10 | 0 |
| | Right | 2 | 0 | 7 | 16 | 2 |
| Consensus | Left | 2 (7%) | 0 | 14 (52%) | 11 (41%) | 0 |
| | Right | 1 (4%) | 0 | 6 (22%) | 16 (59%) | 4 (15%) |
| Table VIEvaluation of Attention map
disagreements regarding the Binary classification. |
Table VI
Evaluation of Attention map
disagreements regarding the Binary classification.
| Disagreement
no. | Expert 1 grade | Expert 2 grade | Consensus
grade |
|---|
| 1 (left lung of
patient 2) | 2 | 3 | 2 |
| 2 (left lung of
patient 16) | 2 | 2 | 2 |
| 3 (left lung of
patient 18) | 2 | 3 | 2 |
| 4 (left lung of
patient 24) | 2 | 3 | 2 |
| 5 (left lung of
patient 27) | 3 | 2 | 2 |
| 6 (right lung of
patient 4) | 4 | 3 | 3 |
| Table VIIEvaluation of Attention map
disagreements regarding the Ternary classification. |
Table VII
Evaluation of Attention map
disagreements regarding the Ternary classification.
| Disagreement
no. | Expert 1 grade | Expert 2 grade | Consensus
grade |
|---|
| 1 (left lung of
patient 6) | 3 | 2 | 3 |
| 2 (right lung of
patient 7) | 3 | 2 | 3 |
| 3 (right lung of
patient 14) | 3 | 2 | 2 |
| 4 (right lung of
patient 27) | 4 | 0 | 4 |
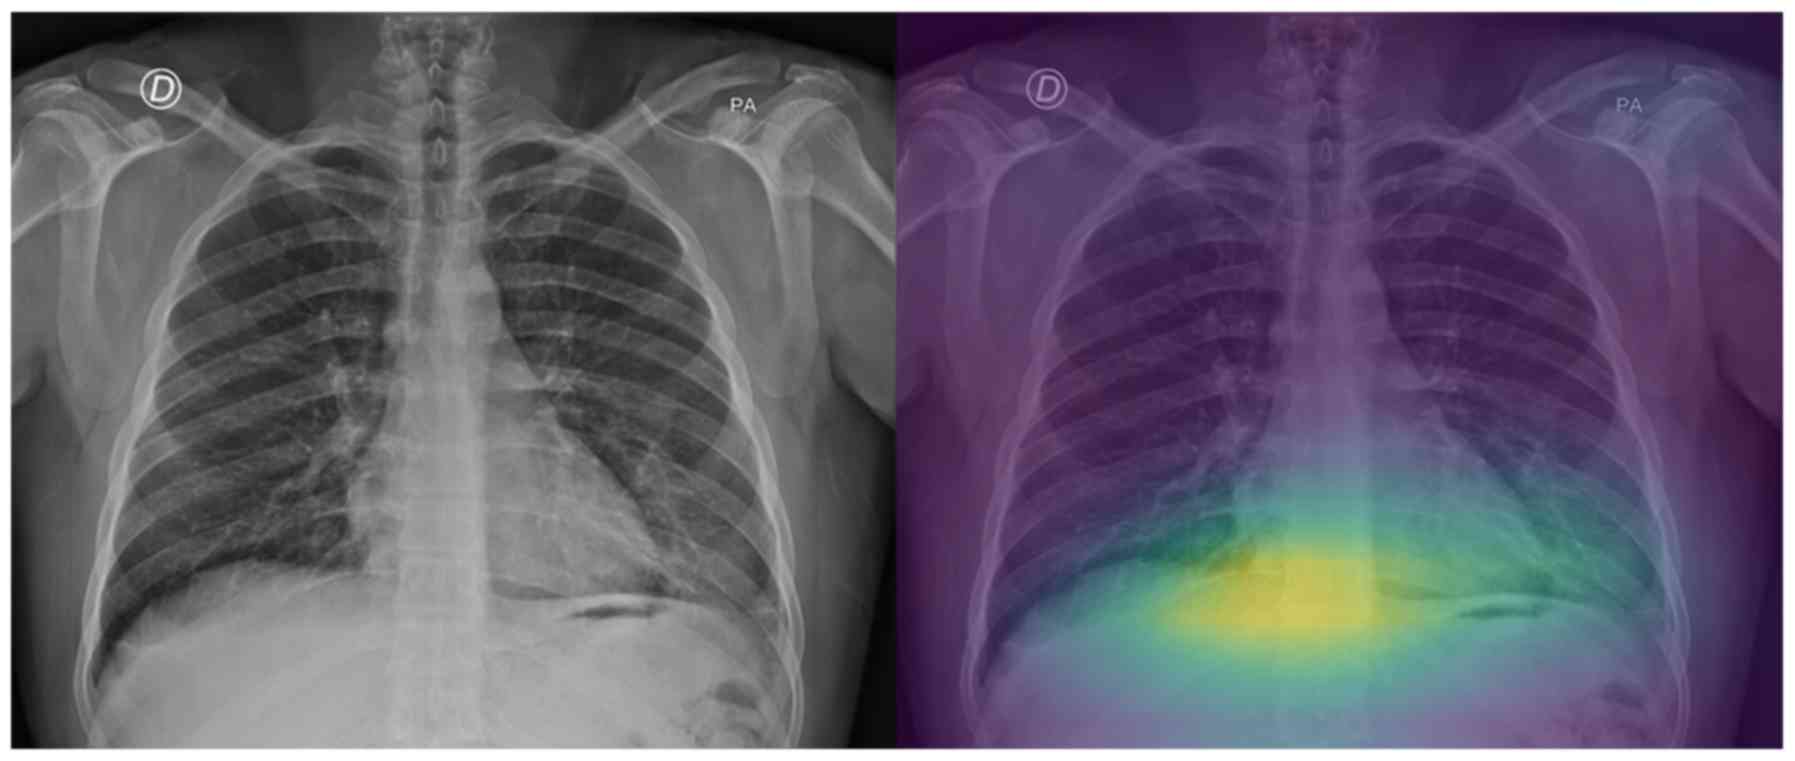
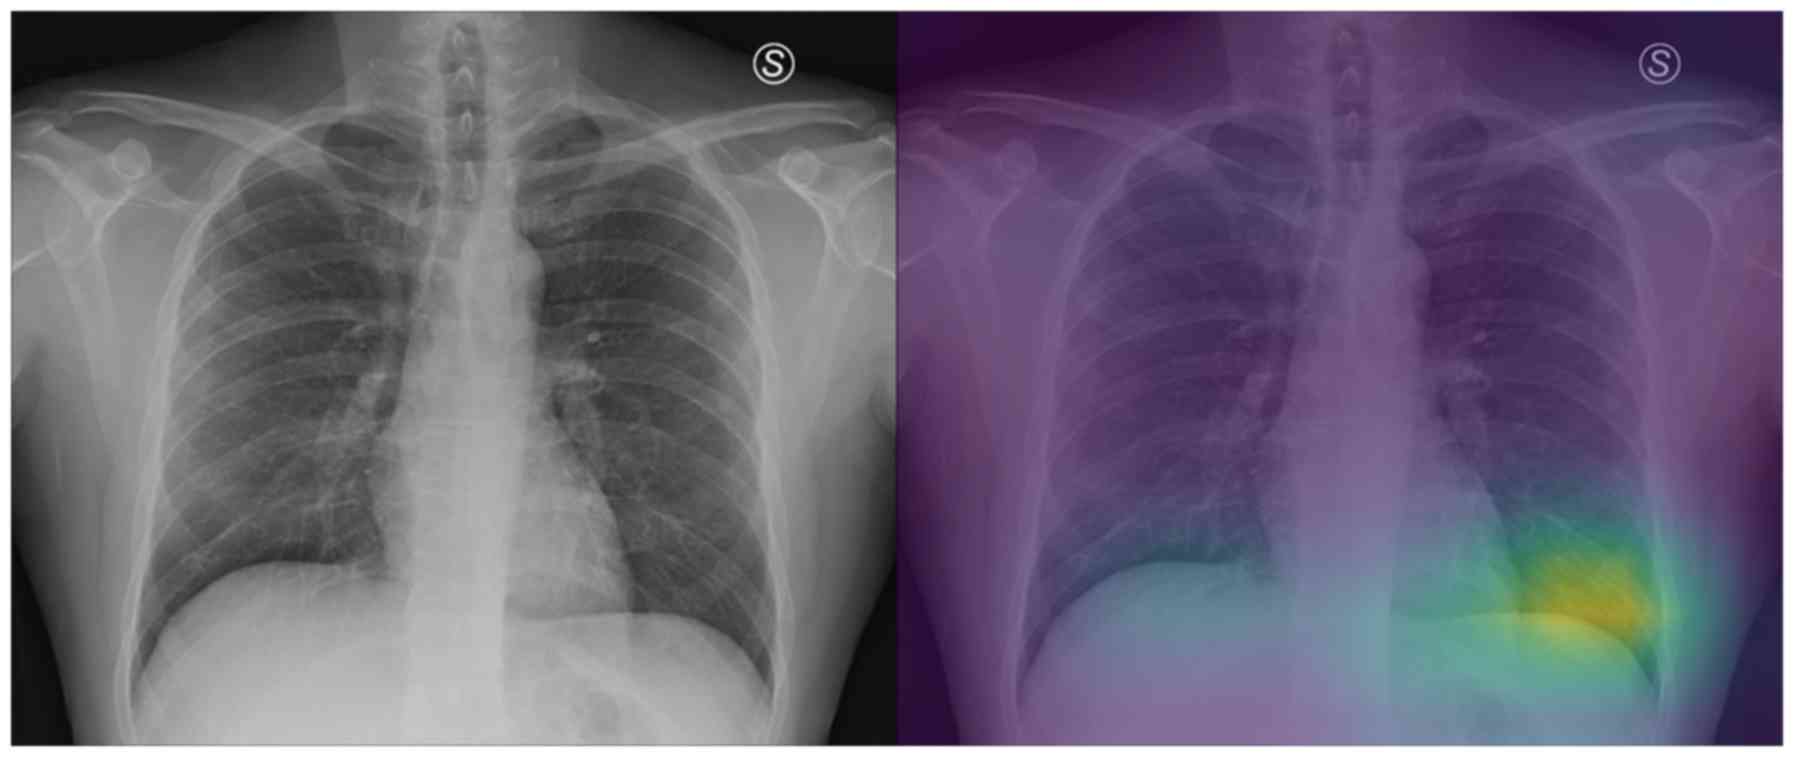
On the other hand, regarding the second testing set,
there are a few cases that the model does not focus on a specific
region of the X-ray image for predicting COVID-19 (grade 0 - e.g.,
patient's left lung, Fig. 7), while
there are also some perfectly focused attention maps (grade 4).
However, most of the gradings are reported, similarly to those in
the binary classification, to be grades 2 and 3, indicating yet
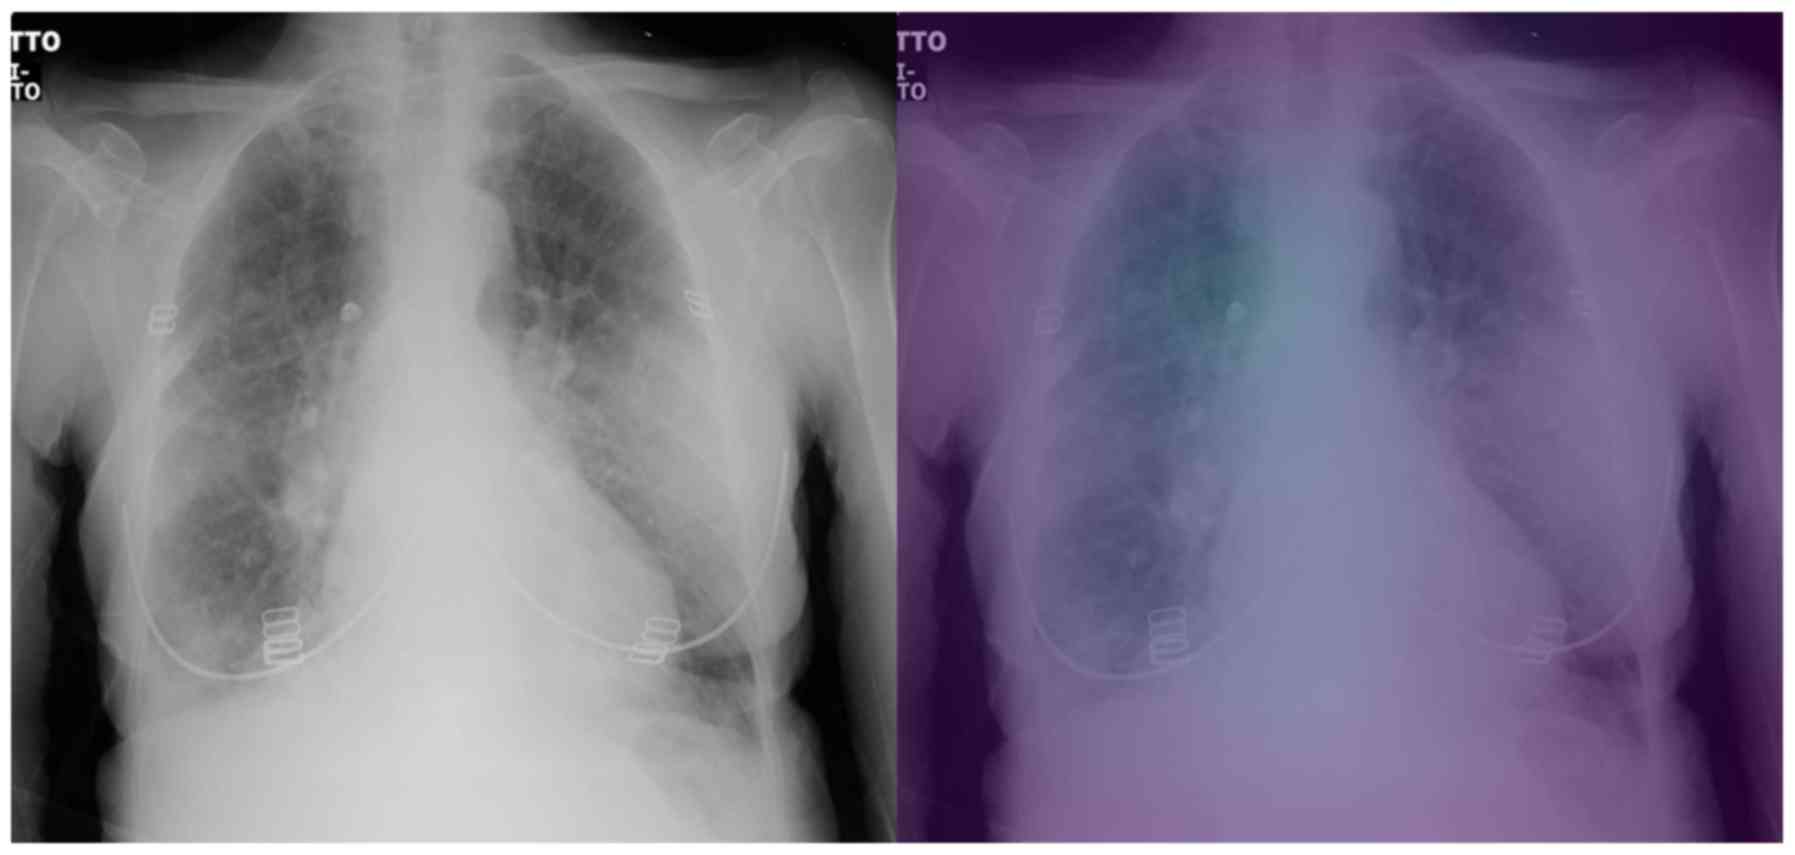
again the need for further training. The model misclassified the
COVID-19 patients 8 and 15 as ‘pneumonia’. The experts graded the
attention map as 3 and 4 for the left and right lung of patient 8
(Fig. 8) and 2 and 4 for patient 15
(Fig. 9), respectively. This in our
view is interesting, because although the model focuses correctly
at the relevant lung regions (amongst others such as the occlusion
due to the heart), it does not manage to take the proper decision
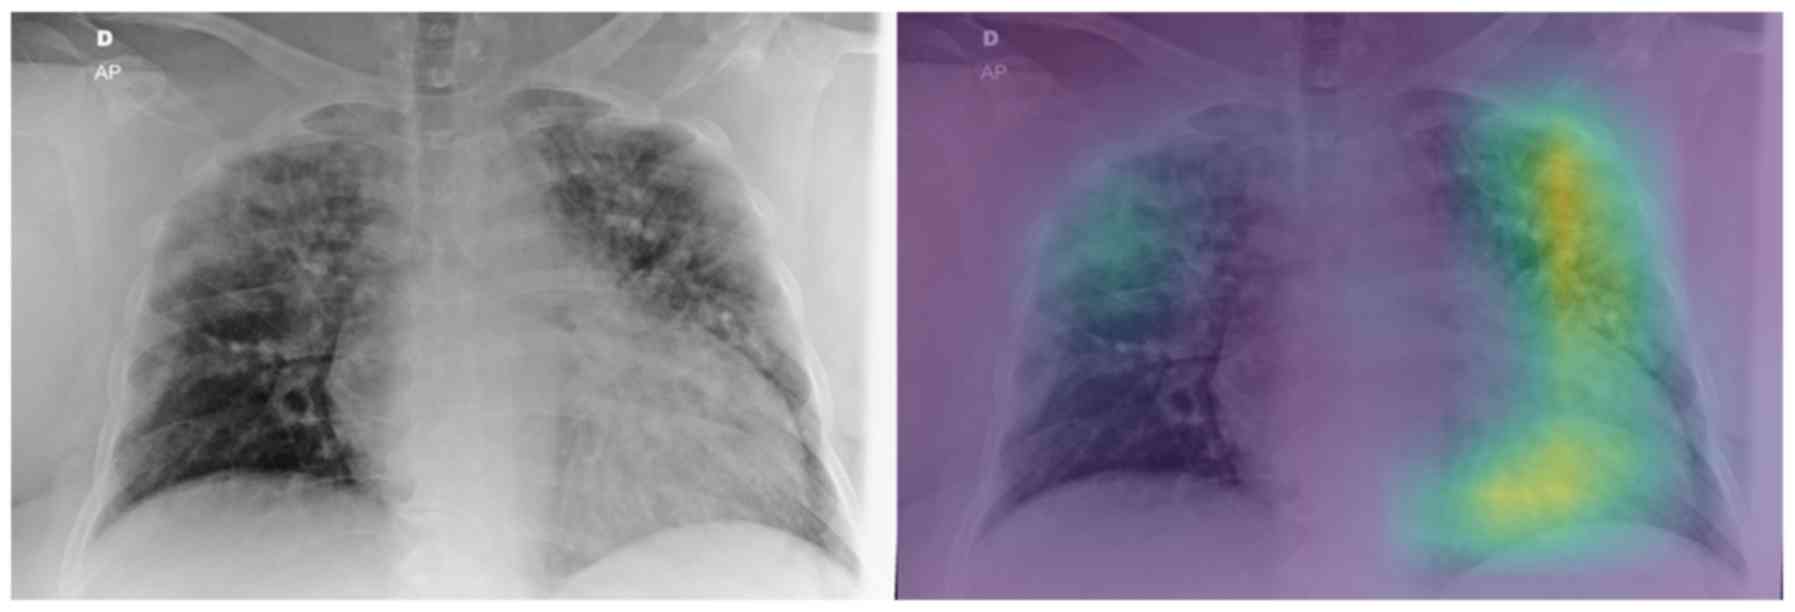
and to correctly classify these two images. Also, the model
misclassified the COVID-19 patients 10 and 23 as healthy/normal.
The experts graded the attention maps as grade 2 for each lung of
both patients. Given the fact that the model does not focus on the
proper lung regions (as seen in Figs.
10 and 11), this
misclassification can be partly attributed to this lack of
focus.
Discussion
The present study focused on COVID-19 classification
from routine X-ray examinations without any segmentation
pre-processing step. The AI framework was evaluated in terms of
quantitative metrics but also in a qualitative fashion by expert
radiologists, who rated the diagnostic relevance of the attention
maps of the model's convolutional part on unseen testing sets. The
examined attention maps constitute an important tool in deep
learning analysis, highlighting a highly probable region of deep
feature extraction. Thus, according to the evaluation (criteria in
Table II) by radiologists as
presented in Tables IV and V, the proposed architecture mostly focuses
in the lung region despite the presence of high intensity
extrapulmonary areas across the X-ray images. In both binary and
ternary classification around half of the cases received grade
equal to 2, with the remaining half receiving grades 3-4 (Tables IV and V). No outliers (grade 0 or 1) were found in
pneumonia versus COVID but three zero-graded cases were identified
in ternary classification, a result that was rather expected due to
the slightly lower performance achieved by those models. Despite
the limited dataset in this study, the proposed framework has the
potential to enhance the decision-making process by providing
trustworthy predictions in terms of prediction confidence and
visual cues representative of the deep learning analysis.
The results of each experiment are presented and
compared to the current literature in Table III. In particular, the pre-trained
Inception-v3 models achieved an AUC performance of 100% in
pneumonia versus COVID-19, 96% in normal versus pneumonia versus
COVID-19 and 93% for quaternary classification. It is worth
mentioning that the transfer learning technique provided a strong
baseline for the examined lesion, in addition to data augmentation
mitigating the limited set of COVID-19 X-rays. The proposed
fine-tuning scheme achieved better model adaptation for the neural
and classification layers reaching state-of-the-art performance in
binary classification (pneumonia versus COVID-19). Despite these
encouraging results, efforts should be put into building a much
larger public database of COVID-19 X-ray images, on which the
research community will train and evaluate the performance of their
proposed models.
Following this study, an extensive examination of
modelling other imaging modalities will be explored, particularly
deep learning analysis on available datasets with selected
tomographic data (23) and on open
databases with no data curation (https://radiopaedia.org/). For instance, He et
al (24) developed a CT decision
support system with attention map interpretation. The results of
the study are similar to ours, at least in terms of classification
performance (AUC 94%) but in their Grad-CAM attention maps a
qualitative discrepancy was observed as the majority of the
presented maps include regions (other high contrast tissue) outside
the lung parenchyma. This issue is probably due to the lack of lung
segmentation or detection prior to training leading the model to
learn redundant information unrelated to the lung and COVID-19
infected area. These current limitations call for more advanced and
interpretable deep learning and preprocessing techniques applied in
large datasets in order to provide AI empowered clinical tools that
can significantly contribute in the fight against COVID-19.
Supplementary Material
Binary classification - Testing set
confusion matrices for all 5 folds.
Ternary classification - Testing set
confusion matrices for all 5 folds.
Quaternary classification - Testing
set confusion matrices for all 5 folds.
Ternary classification - Normal class
performance on the testing sets across all folds.
Ternary classification - COVID-19
class performance on the testing sets across all folds.
Ternary classification - Pneumonia
class performance on the testing sets across all folds.
Quaternary classification - Normal
class performance on the testing sets across all folds.
Quaternary classification - COVID-19
class performance on the testing sets across all folds.
Quaternary classification - Bacteria
Pneumonia class performance on the testing sets across all
folds.
Quaternary classification - Virus
Pneumonia class performance on the testing sets across all
folds.
Acknowledgements
Not applicable.
Funding
Part of this study was financially supported by the
Stavros Niarchos Foundation within the framework of the project
ARCHERS (Advancing Young Researchers’ Human Capital in Cutting Edge
Technologies in the Preservation of Cultural Heritage and the
Tackling of Societal Challenges).
Availability of data and materials
Not applicable.
Authors' contributions
NT, ET and KM conceived and designed the study. NT,
ET and KM researched the literature, performed analysis and
interpretation of data and drafted the manuscript. EEV and AHK
developed the attention map grading system and performed the
evaluation of the attention maps. JSG and RLG collected and
provided us with the private COVID-19 dataset. EEV, GZP, AHK, NP,
DAS and AT critically revised the article for important
intellectual content, and assisted in the literature search for
this article. All authors agree to be accountable for all aspects
of the work in ensuring that questions related to the accuracy or
integrity of any part of the work are appropriately investigated,
and finally approved the version of the manuscript to be
published.
Ethics approval and consent to
participate
Not applicable.
Patient consent for publication
Not applicable.
Competing interests
DAS is the Editor-in-Chief for the journal, but had
no personal involvement in the reviewing process, or any influence
in terms of adjudicating on the final decision, for this article.
All the other authors declare that they have no competing
interests.
References
|
1
|
Chen N, Zhou M, Dong X, Qu J, Gong F, Han
Y, Qiu Y, Wang J, Liu Y, Wei Y, et al: Epidemiological and clinical
characteristics of 99 cases of 2019 novel coronavirus pneumonia in
Wuhan, China: A descriptive study. Lancet. 395:507–513.
2020.PubMed/NCBI View Article : Google Scholar
|
|
2
|
World Health Organization (WHO): Report of
the WHO-China joint mission on coronavirus disease 2019 (COVID-19).
WHO, Geneva, 2020. https://www.who.int/docs/default-source/coronaviruse/who-china-joint-mission-on-covid-19-final-report.pdf.
Accessed February 28, 2020.
|
|
3
|
Petrakis D, Margină D, Tsarouhas K, Tekos
F, Stan M, Nikitovic D, Kouretas D, Spandidos DA and Tsatsakis A:
Obesity a risk factor for increased COVID 19 prevalence, severity
and lethality (Review). Mol Med Rep. 22:9–19. 2020.PubMed/NCBI View Article : Google Scholar
|
|
4
|
Docea AO, Tsatsakis A, Albulescu D,
Cristea O, Zlatian O, Vinceti M, Moschos SA, Tsoukalas D, Goumenou
M, Drakoulis N, et al: A new threat from an old enemy: Re-emergence
of coronavirus (Review). Int J Mol Med. 45:1631–1643.
2020.PubMed/NCBI View Article : Google Scholar
|
|
5
|
Farsalinos K, Niaura R, Le Houezec J,
Barbouni A, Tsatsakis A, Kouretas D, Vantarakis A and Poulas K:
Editorial: Nicotine and SARS-CoV-2: COVID-19 may be a disease of
the nicotinic cholinergic system. Toxicol Rep: Apr 30, 2020 (Epub
ahead of print).
|
|
6
|
Calina D, Docea AO, Petrakis D, Egorov AM,
Ishmukhametov AA, Gabibov AG, Shtilman MI, Kostoff R, Carvalho F,
Vinceti M, et al: Towards effective COVID 19 vaccines: Updates,
perspectives and challenges (Review). Int J Mol Med. 46:3–16.
2020.PubMed/NCBI View Article : Google Scholar
|
|
7
|
Skalny AV, Rink L, Ajsuvakova OP, Aschner
M, Gritsenko VA, Alekseenko SI, Svistunov AA, Petrakis D, Spandidos
DA, Aaseth J, et al: Zinc and respiratory tract infections:
Perspectives for COVID-19 (Review). Int J Mol Med. 46:17–26.
2020.PubMed/NCBI View Article : Google Scholar
|
|
8
|
Wong HYF, Lam HYS, Fong AH, Leung ST, Chin
TW, Lo CSY, Lui MM, Lee JCY, Chiu KW, Chung T, et al: Frequency and
distribution of chest radiographic findings in COVID-19 positive
patients. Radiology. 27(201160)2019.PubMed/NCBI View Article : Google Scholar
|
|
9
|
Huang C, Wang Y, Li X, Ren L, Zhao J, Hu
Y, Zhang L, Fan G, Xu J, Gu X, et al: Clinical features of patients
infected with 2019 novel coronavirus in Wuhan, China. Lancet.
395:497–506. 2020.PubMed/NCBI View Article : Google Scholar
|
|
10
|
Kong W and Agarwal PP: Chest imaging
appearance of COVID-19 infection. Radiol Cardiothorac Imaging.
2(e200028)2020.
|
|
11
|
Bandirali M, Sconfienza LM, Serra R,
Brembilla R, Albano D, Ernesto PF and Messina C: Chest radiograph
findings in asymptomatic and minimally symptomatic quarantined
patients in Codogno, Italy during COVID-19 pandemic. Radiology.
295(E7)2020.PubMed/NCBI View Article : Google Scholar
|
|
12
|
Ai T, Yang Z, Hou H, Zhan C, Chen C, Lv W,
Tao Q, Sun Z and Xia L: Correlation of chest CT and RT-PCR testing
in coronavirus disease 2019 (COVID-19) in China: A Report of 1014
cases. Radiology: Feb 26, 2020 (Epub ahead of print).
|
|
13
|
Hao K: Doctors are using AI to triage
covid-19 patients. The tools may be here to stay. MIT Technology
Review, 2020. https://www.technologyreview.com/2020/04/23/1000410/ai-triage-covid-19-patients-health-care/.
Accessed April 23, 2020.
|
|
14
|
Zhang J, Xie Y, Li Y, Shen C and Xia Y:
COVID-19 Screening on chest X-ray images using deep learning based
anomaly detection. arXiv: 2003.12338.
|
|
15
|
Narin A, Kaya C and Pamuk Z: Automatic
detection of coronavirus disease (COVID-19) using X-ray images and
deep convolutional neural networks. arXiv: 2003.10849.
|
|
16
|
Wang L and Wong A: COVID-Net: A tailored
deep convolutional neural network design for detection of COVID-19
cases from chest X-ray images. arXiv: 2003.09871.
|
|
17
|
Afshar P, Heidarian S, Naderkhani F,
Oikonomou A, Plataniotis KN and Mohammadi A: COVID-CAPS: A capsule
network-based framework for identification of COVID-19 cases from
X-ray images. arXiv: 2004.02696.
|
|
18
|
Abbas A, Abdelsamea MM and Gaber MM:
Classification of COVID-19 in chest X-ray images using DeTraC deep
convolutional neural network. arXiv: 2003.13815.
|
|
19
|
Khalifa NEM, Taha MHN, Hassanien AE and
Elghamrawy S: Detection of coronavirus (COVID-19) associated
pneumonia based on generative adversarial networks and a fine-tuned
deep transfer learning model using chest X-ray dataset. arXiv:
2004.01184.
|
|
20
|
Ghoshal B and Tucker A: Estimating
uncertainty and interpretability in deep learning for coronavirus
(COVID-19) detection. arXiv: 2003.10769.
|
|
21
|
Ucar F and Korkmaz D: COVIDiagnosis-Net:
Deep Bayes-SqueezeNet based diagnosis of the coronavirus disease
2019 (COVID-19) from X-ray images. Med Hypotheses.
140(109761)2020.PubMed/NCBI View Article : Google Scholar
|
|
22
|
Apostolopoulos ID and Mpesiana TA:
Covid-19: automatic detection from X-ray images utilizing transfer
learning with convolutional neural networks. Phys Eng Sci Med:
https://doi.org/10.1007/s13246-020-00865-4.
|
|
23
|
Loey M, Smarandache F and M. Khalifa NE:
Within the lack of chest COVID-19 X-ray dataset: A novel detection
model based on GAN and deep transfer learning. Symmetry (Basel).
12(651)2020.
|
|
24
|
He X, Yang X, Zhang S, Zhao J, Zhang Y,
Xing E and Xie P: Sample-efficient deep learning for COVID-19
diagnosis based on CT scans. medRxiv: doi: https://doi.org/10.1101/2020.04.13.20063941.
|
|
25
|
Zhao J, Zhang Y, He X and Xie P:
COVID-CT-dataset: A CT scan dataset about COVID-19. arXiv:
2003.13865.
|
|
26
|
Wang S, Kang B, Ma J, Zeng X, Xiao M, Guo
J, Cai M, Yang J, Li Y, Meng X and Xu B: A deep learning algorithm
using CT images to screen for corona virus disease (COVID-19).
medRxiv: doi: https://doi.org/10.1101/2020.02.14.20023028.
|
|
27
|
Bai HX, Wang R, Xiong Z, Hsieh B, Chang K,
Halsey K, Tran TML, Choi JW, Wang DC, Shi LB, et al: AI
augmentation of radiologist performance in distinguishing COVID-19
from pneumonia of other etiology on chest CT. Radiology (In
Press).
|
|
28
|
Cohen JP, Morrison P and Dao L: COVID-19
image data collection. arXiv: 2003.11597.
|
|
29
|
Jeffrey RB Jr, Manaster BJ, Osborn AG,
Rosado-de-Christenson ML and Woodward PJ: Diagnostic Imaging:
Emergency. 2nd edition. Lippincott Williams & Wilkins,
2013.
|
|
30
|
Kermany DS, Goldbaum M, Cai W, Valentim
CCS, Liang H, Baxter SL, McKeown A, Yang G, Wu X, Yan F, et al:
Identifying medical diagnoses and treatable diseases by image-based
deep learning. Cell. 172:1122–1131.e9. 2018.PubMed/NCBI View Article : Google Scholar
|
|
31
|
Mooney P: Chest X-ray images (Pneumonia).
https://www.kaggle.com/paultimothymooney/chest-xray-pneumonia.
Accessed March 24, 2018.
|
|
32
|
Szegedy C, Vanhoucke V, Ioffe S, Shlens J
and Wojna Z: Rethinking the Inception Architecture for Computer
Vision. In: Proceedings of the IEEE Computer Society Conference on
Computer Vision and Pattern Recognition. IEEE Computer Society,
pp2818-2826, 2016.
|
|
33
|
Deng J, Dong W, Socher R, Li LJ, Li K and
Li FF: ImageNet: A Large-Scale Hierarchical Image Database. In:
Proceedings of 2009 IEEE Conference on Computer Vision and Pattern
Recognition, Miami, FL, pp248-255, 2009.
|
|
34
|
Abràmoff MD, Lou Y, Erginay A, Clarida W,
Amelon R, Folk JC and Niemeijer M: Improved automated detection of
diabetic retinopathy on a publicly available dataset through
integration of deep learning. Invest Ophthalmol Vis Sci.
57:5200–5206. 2016.PubMed/NCBI View Article : Google Scholar
|
|
35
|
Selvaraju RR, Cogswell M, Das A, Vedantam
R, Parikh D and Batra D: Grad-CAM: Visual Explanations from Deep
Networks via Gradient-Based Localization. In: Proceedings of the
IEEE International Conference on Computer Vision. Institute of
Electrical and Electronics Engineers Inc., pp618-626, 2017.
|
|
36
|
Kingma DP and Ba J: Adam: A method for
stochastic optimization. arXiv: 1412.6980.
|
|
37
|
Chowdhury MEH, Rahman T, Khandakar A,
Mazhar R, Kadir MA, Mahbub Z Bin, Islam KR, Khan MS, Iqbal A,
Al-Emadi N and Reaz MBI: Can AI help in screening Viral and
COVID-19 pneumonia? arXiv: 2003.13145.
|