Introduction
Asarum is derived from the dried root and rhizome of
Asarum heterotropoides Fr. Schmidt var. mandshuricum
(Maxim) Kitag., Asarum sieboldii Miq. var. seoulense
Nakai. or Asarum sieboldii Miq. It is commonly applied in
Traditional Chinese Medicine (TCM) due to its anesthetic and
analgesic properties (1-4).
In addition, it is applied in combination with other TCMs for the
treatment of various ailments. Ginger and Asarum application by
acupoint sticking therapy have been suggested to improve the
clinical symptoms of bronchial asthma (5). However, the usage of asarum is
generally not recommended due to its toxicity. Previous studies
have detected a number of potentially toxic components in asarum,
including safrole, methyl eugenol, aristolochic acids, asarone,
3,5-dimethoxytoluene and benzene derivatives (6,7). These
components are associated with toxicity in multiple organs,
including the central nervous system (8), kidneys (9) and liver (10). In addition, Asarum is carcinogenic
(11). In particular, aristolochic
acids in asarum have been previously demonstrated to exhibit
significant nephrotoxicity, in addition to mutagenic and
carcinogenic effects (12). Safrole
has been revealed to be associated with the pathogenesis of
hepatocellular carcinoma and to lead to respiratory paralysis
(13,14).
A number of previous studies have investigated the
mechanism of toxicity mediated by single components contained
within naturally occurring medicinal compounds. Yang et al
(14) indicated that safrole may
inhibit cytochrome 450 enzymes and result in the production of
reactive metabolites, in turn leading to the inhibition of enzyme
activity and increasing the risk of hepatocellular carcinoma
progression. In addition, Patel et al (15) demonstrated that cytotoxicity exerted
by β-asarone was associated with lipid peroxidation and glutathione
depletion in hepatocytes. However, since TCMs exhibit
multi-component, multi-target and multi-pathway characteristics,
further research is required to unravel the mechanism of toxicity
exerted by a single component within TCM herbal formulations
(16). In a previous study, genomics
and transcriptomics analyses were performed to reveal the
mechanisms of asarum-induced lung toxicity, which were potentially
mediated through the adenosine monophosphate-activated protein
kinase/NF-κB and Bcl2 pathways, in addition to proteins associated
with inflammation, leading to an inflammatory reaction (11). However, the safety and efficacy of
asarum for clinical use remain poorly understood, since the effect
of asarum on the liver remains to be fully elucidated.
The liver is the largest organ that participates in
drug metabolism, where it serves an important role in energy, lipid
and amino acid metabolism (17).
Following liver injury, gene expression and metabolite profiles
become aberrantly altered. Transcriptomics analyses study the
transcription of all genes in cells at a global level (18,19),
whereas metabolomics analyses examine the levels of metabolites in
bodily fluids or tissues. Combination of these two analyses results
in a large amount of data being generated regarding the overall
changes in the metabolic spectrum, as a consequence of alterations
in the transcriptome (20,21). In the present study, to assess the
underlying mechanism of the hepatotoxicity of asarum,
transcriptomics and metabolomics datasets were generated and
subsequently integrated to investigate prospective changes in the
transcriptional and metabolic profiles of rats treated with asarum.
Taken together, the present study aimed to provide novel insight
into the mechanism of asarum-mediated toxicity, which may provide
approaches to improve the clinical diagnosis and development of
therapeutic interventions against asarum poisoning.
Materials and methods
Chemicals and reagent kits
Alanine transaminase (ALT; cat. no. BQ004A-CR),
aspartate transferase (AST; cat. no. BQ006A-CR) and total bilirubin
(TBil; cat. no. BQ012A-CR) assay reagent kits were obtained from
Rayto Life and Analytical Sciences Co., Ltd. TRIpure RNA extraction
reagentwas obtained from BioTeke Corp. The Agilent Fiehn GC/MS
Metabolomics Standards Kit was purchased from Agilent Technologies,
Inc. N-methyl-N-(trimethylsilyl) trifluoroacetamide (MSTFA),
chlorotrimethylsilane (TMCS) and methoxyamine hydrochloride were of
gas chromatography (GC) derivatization grade and were purchased
from Sigma-Aldrich; Merck KGaA. Other reagents used in the present
study were of analytical grade.
Quality control of asarum
Asarum (cat. no. 201809014) was obtained from Wuhan
Hankou National Pharmaceutical Co., Ltd. The volatile components of
asarum were analyzed using headspace-solid phase microextraction
(HS-SPME) combined with GC-mass spectrometry (GC-MS). In brief, 0.3
g asarum powder was placed in a 20-ml HS vial to extract volatile
components. The sample was heated for 15 min in a thermostatic bath
at 90˚C for equilibration. The fiber was exposed to the HS for 15
min during the extraction time. Following sampling, the SPME fiber
was immediately inserted into the GC injector and thermally
desorbed for 3 min at 260˚C in ‘split-less’ mode. The relative
percentage of each component was calculated using the area
normalization method where the area of a single peak is divided by
the total peak area.
Animals
Previous experiments have demonstrated that 1.35 g
asarum/kg/day induces lung toxicity in rats (11). Therefore, possible asarum-induced
hepatotoxicity was evaluated at the same dose. Asarum root was
first crushed using a pulverizer, following which double-distilled
H2O was added to prepare a 13.5% suspension for
intragastric administration.
In total, 40 male Sprague Dawley (SD) rats (weight,
200-230 g; age, 40-42 days) were purchased from the experimental
animal research center of Hubei Province (license number, ZCXK,
Hubei 2015-0018). Following one week of acclimatization at 18-25˚C
and a relative humidity of 60-70%, with natural circadian rhythm
and light. The rats had free access to food and water. The rats
were divided into the following two groups (n=20): i) Control; and
ii) asarum treatment. Subsequently, asarum (1.35 g/kg/day) was
administered by oral gavage over a 28-day period, whilst the
control group was administered equivalent volumes of saline.
General parameters of each group of rats, including skin, hair and
behavioral activities, were monitored daily throughout the duration
of the experiment. Rats were used for H&E staining (3), metabolite testing (14) and for gene expression analysis
(3). All experimental procedures
were performed in accordance with the guidelines established by the
animal ethics committee of Hubei University of TCM (Wuhan, China;
approval no. HUCMS201903001).
Measurement of organ coefficient and
liver function
Following 28 days of intragastric administration,
rats were first anesthetized with 10% chloral hydrate (300 mg/kg)
by intraperitoneal injection. None of the animals exhibited any
signs of peritonitis after the administration of 10% chloral
hydrate. Subsequently, 1 ml blood was obtained from the abdominal
aorta and the rats were sacrificed by cervical dislocation. After
the confirmation of cardiac and respiratory arrest, in addition to
the disappearance of nerve reflex, the liver was obtained from each
rat. The liver tissues were then rinsed with normal saline, blotted
with filter paper and weighed. The organ coefficient was calculated
as the weight of the liver relative to 100 g of the rat's body
weight. To obtain serum samples, whole blood was centrifuged at
1,006.2 x g for 15 min at 4˚C, following which the activities of
ALT, AST and TBil were determined using a biochemical analyzer
(Rayto Life and Analytical Sciences Co., Ltd.) according to the
manufacturer's protocol.
H&E staining
After the rats were sacrificed, liver samples
(~1.5x1.5x0.3 cm) were stored in 4% paraformaldehyde solution at
4˚C for 24 h, embedded in paraffin, sectioned at 4.5 µm, stained
with H&E as previously described (22) and observed for histopathological
changes using standard light microscopy. Histopathological scoring
analysis was performed by a pathologist according to protocols
previously described (22).
Assessment was performed by calculating the sum of the following
individual score grades: i) 0 (no findings); ii) 1 (mild); iii) 2
(moderate); and iv) 3 (severe) for each of the following six
parameters: i) Cytoplasmic color fading; ii) vacuolization; iii)
nuclear condensation; iv) nuclear fragmentation; v) nuclear fading;
and vi) erythrocyte stasis.
Gene expression analysis
In total, 3 liver tissues were selected randomly
from each group for high-throughput sequencing. In brief, 0.1 g
liver tissue samples were homogenized using 1 ml TRIzol®
according to the manufacturer's protocol to extract total RNA. The
RNA was then checked for purity and stability by gel
electrophoresis and the concentration was determined using the
Agilent 2100 Bioanalyzer (Agilent Technologies, Inc.). The mRNA
with polyA structures in total RNA was then enriched using Oligo
(dT) magnetic beads (Biomag Biotechnology Co., Ltd.; cat. no.
BMDT1000; 4˚C and 2 min) and fragmented into 200-300 bp pieces by
ion disruption using theVAHTS Universal Plus DNA Library Prep Kit
For Illumina (Biomag Biotechnology Co., Ltd., ND617) following the
manufacturer's protocol. Using RNA as a template, the first-strand
complementary (c)DNA was synthesized using random hexamer primers
and reverse transcription, and second-strand cDNA was synthesized
using the first-strand cDNA as a template with the High-Capacity
cDNA Reverse transcription kit (cat. no. 4368813; Thermo Fisher
Scientific, Inc.), following the manufacturer's protocol. The
synthesized cDNA was purified using Agencourt Ampurebeads (Beckman
Coulter, Inc.). The purified cDNA was then prepared using a TruSeq
DNA single indexes Set A kit (Illumina Inc.; cat. no. FC-121-2001)
and amplified using TruSeq PE Cluster Kit (Illumina, Inc.; cat. no.
PE-300-2001) to obtain a cDNA library. The total library
concentrations were tested using the Agilent 2100 Bioanalyzer prior
to being subjected to paired-end sequencing based on the Illumina
HiSeq sequencing platform using next-generation sequencing. The raw
sequencing data were first filtered by cutadapt (https://cutadapt.readthedocs.io/en/stable/), following
which the filtered high-quality sequence was aligned to the
reference genome of the rat. Based on the alignment results, the
expression level of each gene was calculated, and the samples were
analyzed further in terms of difference, enrichment and cluster
analyses. Differentially expressed genes (DEGs) were screened out
using the unpaired t-test with P<0.05 as the threshold. The Gene
Ontology (GO) platform (http://www.geneontology.org/) and panther version 14
were used to perform functional enrichment analysis of the DEGs
(23). The Database for Annotation,
Visualization, and Integrated Discovery (DAVID; version 6.8;
https://david.ncifcrf.gov/) coupled with
the Kyoto Encyclopedia of Genes and Genomes (KEGG; http://www.genome.jp/kegg/pathway.html)
was used to determine significant pathways associated with the DEGs
(24). Pathways with P-value
thresholds of <0.05 were considered potential target
pathways.
Metabolomics data collection and
analysis
After thawing the liver tissue samples at room
temperature, 1 ml physiological saline was added to 0.2 g tissue to
disrupt the cells, following which 250 µl acetonitrile was added to
100 µl liver homogenate for protein precipitation. This sample was
then homogenized by ultrasound (40 kHz) in an ice bath for 15 min
and centrifuged at 11,180 x g for 10 min at 4˚C to obtain a 200-µl
supernatant. The supernatant was transferred to a sample vial and
concentrated using a centrifugal concentrator (1,006.2 x g) at 35˚C
for 2 h to evaporate the solvent. Oximation was performed at 30˚C
for 90 min following the addition of 40 µl methoxyamine pyridine
solution (40 mg/ml). Trimethylsilylation was subsequently performed
at 37˚C for 60 min following the addition of 80 µl derivatization
reagent (MSTFA/TMCS ratio, 100:1 v/v). Subsequently, 10 µl
d27-myristic acid (0.75 mg/ml in n-hexane) was added as a reference
compound. The derivatized sample was finally transferred to a
250-µl vial for GC-MS analysis.
A 7890B GC system (Agilent Technologies, Inc.),
equipped with a 5977B series mass selective detector (Agilent
Technologies, Inc.) and a DB-5ms capillary column (30 m x 0.25 mm x
0.25 µm; Agilent Technologies, Inc.) was used to analyze the
derivatized liver samples. To achieve good separation, the oven
temperature was programmed from 60 to 250˚C at 10˚C/min and
subsequently held at 60 and 250˚C for 1 and 10 min, respectively.
The injector, source and quadrupole temperatures were set to 250,
230 and 150˚C, respectively, whilst the detector voltage was 70.0
eV and the MS spectra were obtained in the mass to charge ratio
(m/z) range of m/z=50.0-600.0. A positive ionization mode was used.
The flow rate of the carrier gas, helium, was 1.1 ml/min and the
solvent delay time was 5.9 min. The injection volume was 1 µl and
the split ratio was 10:1. The helium was injected at room
temperature and 80 psi.
GC-MS raw data acquisitions were performed using the
Agilent Masshunter software (Qualitative Navigator B.08.00; Agilent
Technologies, Inc.). Spectra deconvolution was performed using the
Automated Mass Spectral Deconvolution and Identification System
(AMDIS) tool (http://www.amdis.net/) from the
National Institute of Standards and Technology (NIST) library. All
spectra were normalized to total peak intensity. Metabolites with
P-values <0.05 and fold changes >2.0 were considered
biomarkers. All biomarkers were tentatively identified using the
retention index, the NIST database (http://webbook.nist.gov/chemistry/) and the Agilent
Fiehn GC/MS Metabolomics RTL Library (25,26).
Principal component analysis (PCA), partial least
squares-discriminant analysis (PLS-DA), relative intensity analysis
and pathway analysis were performed using the MetaboAnalyst 4.0
online tool (http://www.metaboanalyst.ca/) (27). R2 represents the fit of the model,
and Q2 represents the prediction rate of the model. The closer the
values of R2 and Q2 are to 1, the better the model constructed.
Integrated analysis
Cytoscape 3.6.1 (https://js.cytoscape.org/) is a software tool for the
visual exploration of biomedical networks composed of metabolic,
gene and other types of interactions (28). Specifically, Metscape 3 (http://MetScape.ncibi.org) is a Cytoscape plug-in that
allows users to build and analyze networks of genes and compounds,
identify enriched pathways from expression profiling data and
visualize changes in metabolite data (29). The data obtained for differentially
abundant metabolites and DEGs from rats in the control and
asarum-treated groups were imported into Metscape to obtain a
global understanding of gene and metabolic changes to assess the
underlying mechanisms of hepatotoxicity.
Statistical analysis
Measurement data, including the data of organ
coefficient, liver function, the histopathology score, DEG analysis
and metabolite analysis, were presented as the mean ± standard
deviation. The unpaired t-test was performed for comparison of
means between two groups using SPSS 21.0 software (IBM Corp.). In
addition, a hypergeometric test was performed for pathway and GO
analysis. P<0.05 was considered to indicate statistical
significance.
Results
Volatile components associated with
toxicity in asarum
In total, 27 volatile components were detected from
asarum (Table I). The major volatile
compounds identified in asarum samples were safrole (17.759%),
methyl eugenol (12.017%), 3,5-dimethoxytoluene (11.595%), myristyl
ether (6.463%) and benzene derivatives. These volatile components
may be associated with the toxicity of asarum.
 | Table IVolatile components identified in
asarum by headspace-solid phase microextraction-gas
chromatography-mass spectrometry. |
Table I
Volatile components identified in
asarum by headspace-solid phase microextraction-gas
chromatography-mass spectrometry.
| Peak number | Retention time
(min) | Compound name | Molecular
formula | Molecular
weight | Relative percentage
(%) |
|---|
| 1 | 8.398 | 2-Pinene |
C10H16 | 136.125 | 1.175 |
| 2 | 9.175 | Camphene |
C10H16 | 136.125 | 0.404 |
| 3 | 10.609 | β-Pinene |
C10H16 | 136.125 | 1.497 |
| 4 | 11.008 | Myrcene |
C10H16 | 136.125 | 0.331 |
| 5 | 12.119 | 3-decene |
C10H16 | 136.125 | 5.583 |
| 6 | 12.764 |
4-isopropyltoluene |
C10H14 | 134.110 | 1.544 |
| 7 | 12.942 | D-decadiene |
C10H16 | 136.125 | 0.628 |
| 8 | 13.097 | Eucalyptol |
C10H18O | 154.136 | 1.605 |
| 9 | 14.041 | Terpinene |
C10H16 | 136.125 | 0.870 |
| 10 | 14.764 | Isobutene |
C10H16 | 136.125 | 0.537 |
| 11 | 14.875 | Terpinolene |
C10H16 | 136.125 | 0.363 |
| 12 | 16.886 | Eugenone |
C10H14O | 150.105 | 6.896 |
| 13 | 17.419 | 2-nonanol |
C10H18O | 154.136 | 1.337 |
| 14 | 17.641 | 4-nonenol |
C10H18O | 154.136 | 0.723 |
| 15 | 17.797 | Methyl isopropyl
alcohol |
C10H14O | 150.105 | 0.239 |
| 16 | 18.152 | 4-allyl
anisole |
C10H12O | 148.089 | 0.737 |
| 17 | 18.374 | Cis-sterol |
C10H16O | 152.120 | 0.401 |
| 18 | 19.185 |
2-isopropyl-5-methyl anisole |
C11H16O | 164.120 | 0.306 |
| 19 | 20.696 |
3,5-dimethoxytoluene |
C9H12O2 | 152.084 | 11.595 |
| 20 | 21.596 | Safrole |
C10H10O2 | 162.068 | 17.759 |
| 21 | 24.307 | Methyl eugenol |
C11H14O2 | 178.099 | 12.017 |
| 22 | 24.501 |
3,4,5-trimethoxytoluene |
C10H14O3 | 182.094 | 4.142 |
| 23 | 26.907 | Myristyl ether |
C11H12O3 | 192.079 | 6.463 |
| 24 | 27.918 |
3,4-propiophenone |
C10H10O3 | 178.063 | 0.970 |
| 25 | 28.029 | Elemene |
C12H16O3 | 208.110 | 0.537 |
| 26 | 30.262 | Carcinol |
C10H10O4 | 194.058 | 1.392 |
| 27 | 31.128 | Patchouli
alcohol |
C15H26O | 222.198 | 0.290 |
Increased organ coefficient and liver
function in asarum-treated rats
In the third week following asarum administration,
rats in the asarum group became languid, where the periphery of the
eyes and auricles appeared cyanotic and the fur appeared messy and
glossy. Organ coefficients and parameters of liver function,
including ALT, AST and TBil, were significantly higher in the
asarum-treated rats compared with those in the control group
(Table II). In general, the organ
coefficient and liver function were observed to be relatively
consistent between animals under normal circumstances. However, in
the present study, the increase in organ coefficient suggested that
congestion, edema or hypertrophy of the liver occurred following
asarum treatment. In addition, increases in TBil, AST and ALT
suggested liver injury after asarum treatment.
| Table IIOrgan coefficients and parameters of
liver function. |
Table II
Organ coefficients and parameters of
liver function.
| A, Organ
coefficients (g/100 g; n=7) |
|---|
| Organ | Control | Asarum |
|---|
| Liver | 3.65±0.39 |
4.23±0.30a |
| B, Liver function
(n=5) |
| Parameter | Control | Asarum |
| TBil | 2.66±0.39 |
29.2±3.65a |
| ALT | 46.2±2.71 |
64.0±5.58a |
| AST | 40.0±9.87 |
77.2±16.8a |
Liver histology following asarum
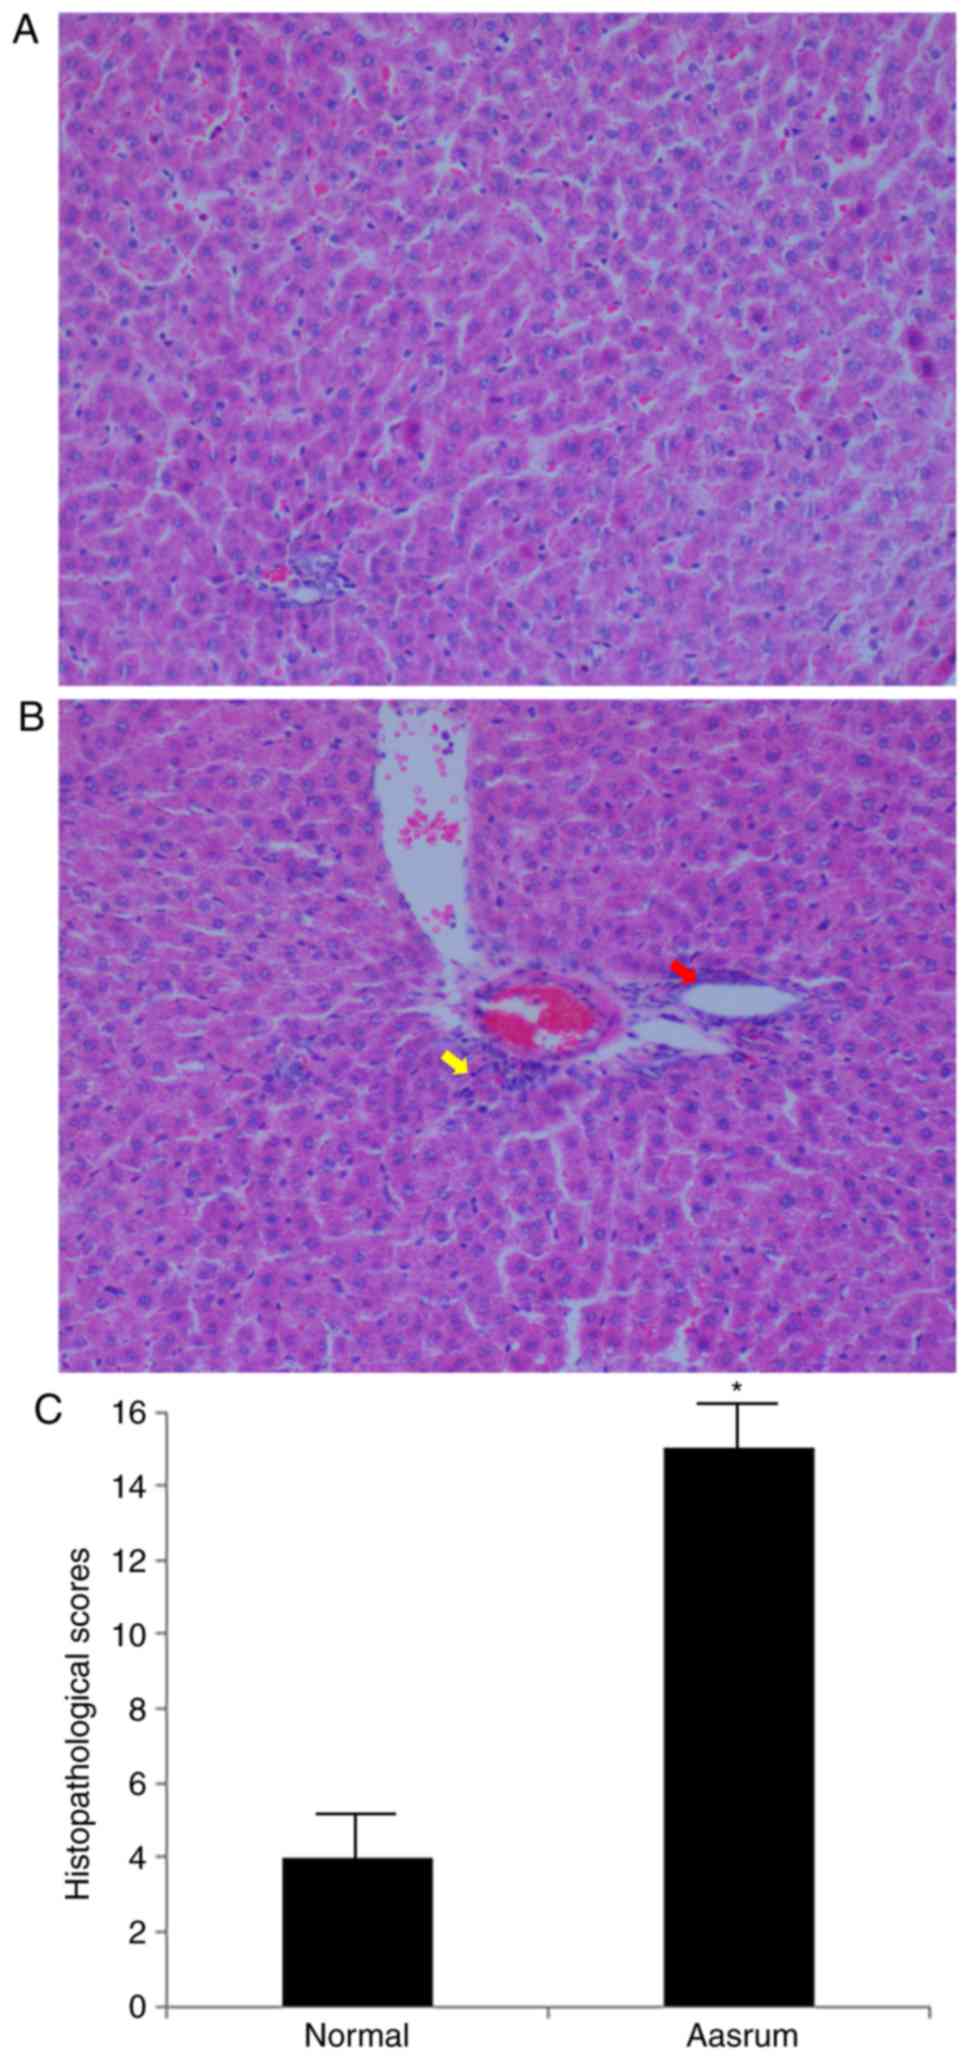
treatment
The liver tissues obtained from the control group
presented with normal cellularity and well-preserved hepatic
lobule, hepatic sinusoid and central vein structures (Fig. 1A). By contrast, the liver tissues
from the asarum group presented with morphological tissue
degeneration, including ballooning degeneration, loose cytoplasm
and signs of necrosis (Fig. 1B). As
observed in Fig. 1C, the
histopathology score in the asarum group was significantly higher
compared with that in the control group, strongly suggesting
hepatotoxicity following asarum treatment.
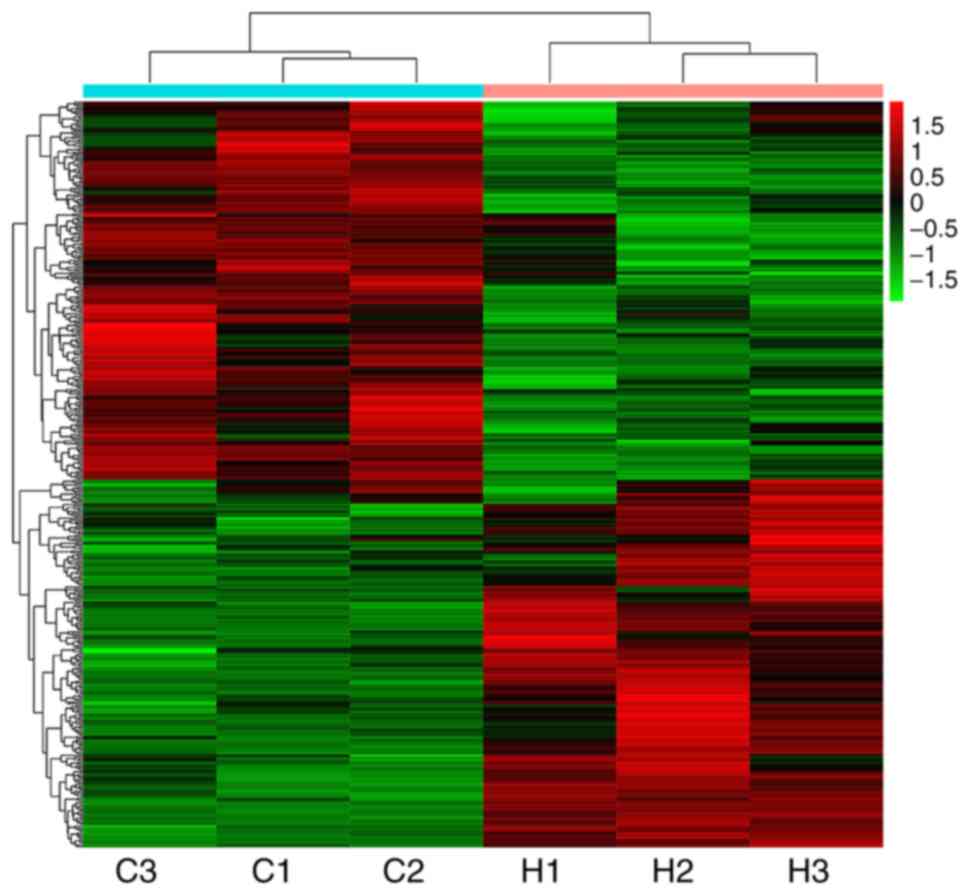
Transcriptomics analysis of DEGs
following asarum treatment
The heatmap indicated significant changes in 434
genes in liver tissues following asarum treatment, including 214
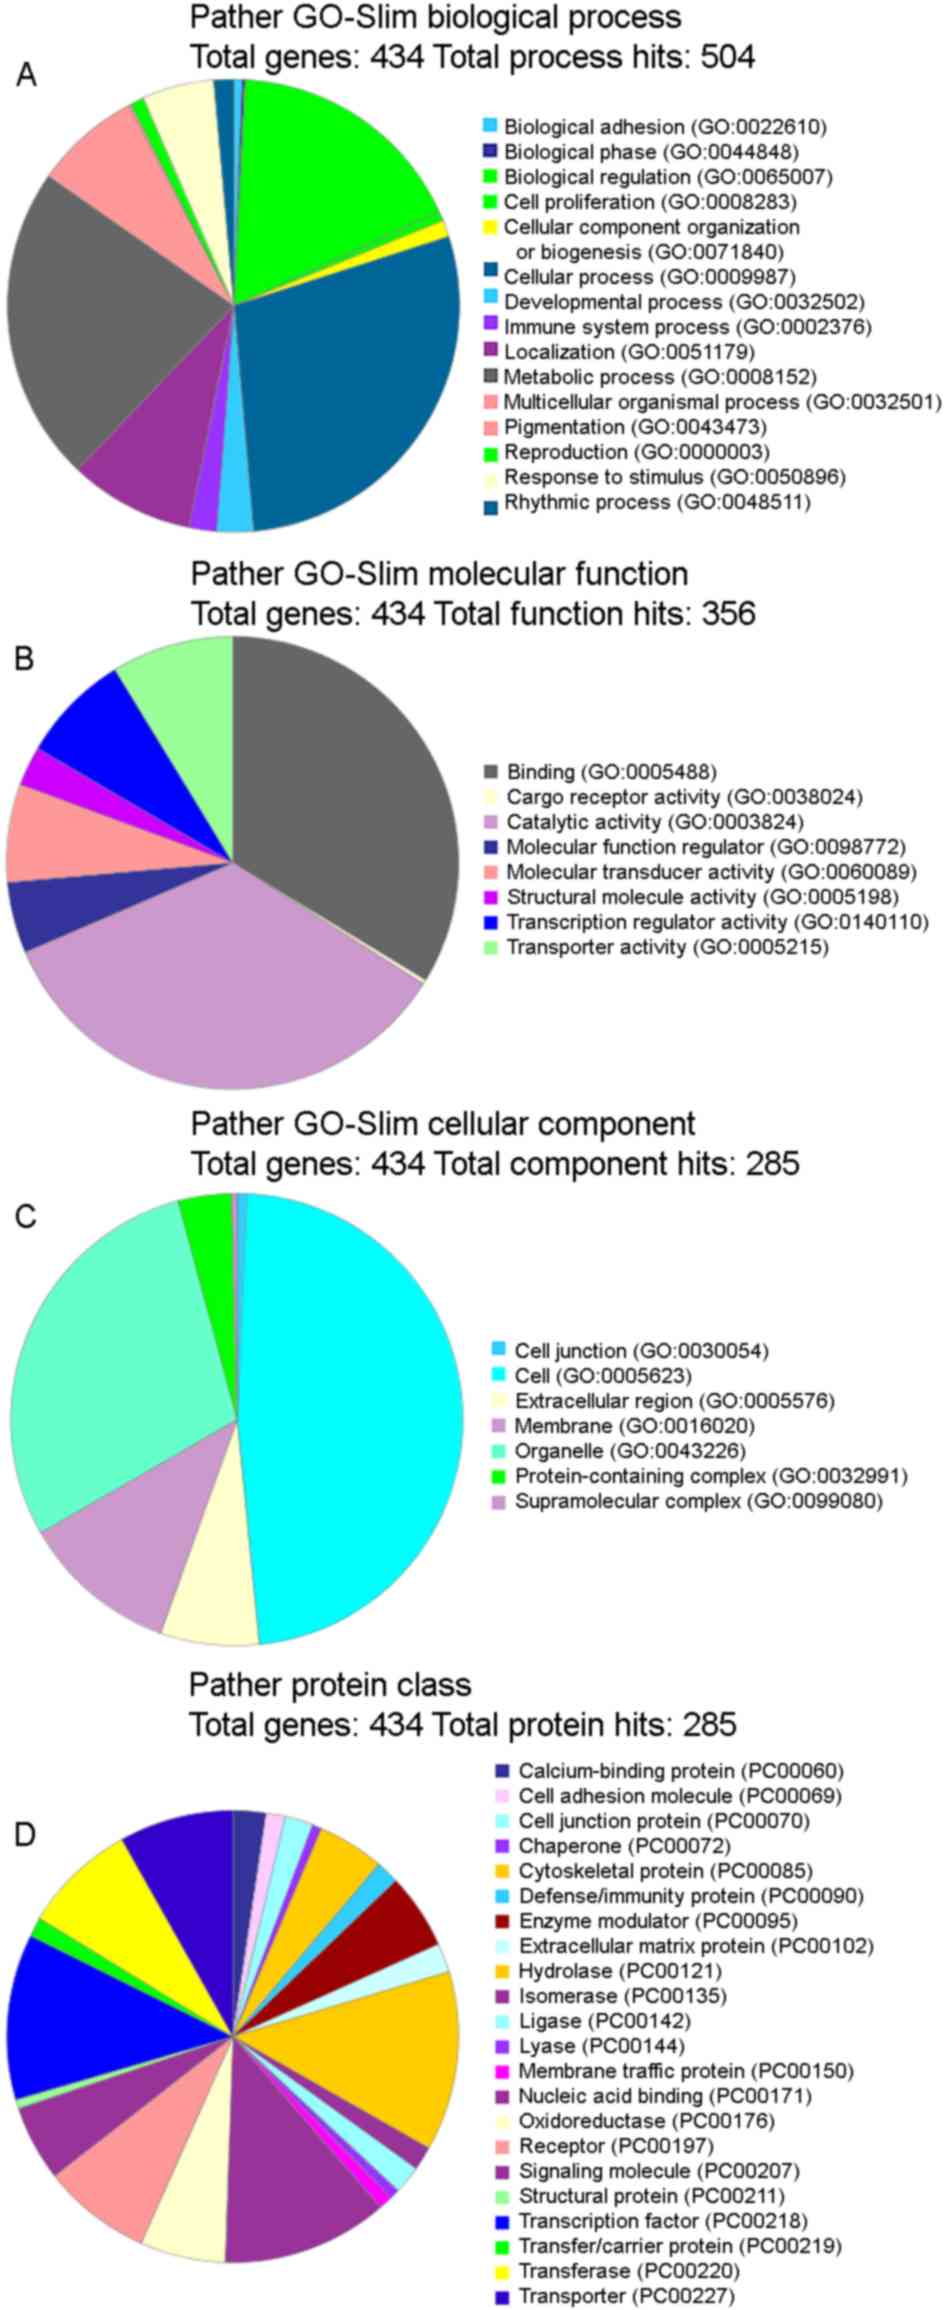
upregulated and 220 downregulated genes (Fig. 2). In addition, the KEGG biological
pathway database was used to analyze the biological pathways of the
DEGs. In total, 18 KEGG pathways were identified to be
significantly enriched in the DEG analysis, including circadian
rhythm, p53 signaling, metabolic pathways, steroid biosynthesis and
bile secretion pathways (Table
III). GO analysis was subsequently performed and it was
observed that the functional terms ‘cellular process’ and
‘metabolic processes’ accounted for the largest percentages in the
protein analysis through evolutionary relationships (PATHER)
GO-Slim Biological Process category (Fig. 3A), ‘binding’ and ‘catalytic activity’
were the highest in the PATHER GO-Slim Molecular Function category
(Fig. 3B), ‘cell’ and ‘organelle’
occupied the largest proportion in the PATHER GO-Slim Cellular
Component category (Fig. 3C) and
finally, ‘hydrolase’ and ‘transcription factor’ accounted for the
highest percentage in the PATHER Protein Class (Fig. 3D). The numbers provided by a GO slim
are an annotation count not a gene product count, and so gene
products may be present in more than one bin.
| Table IIISignificantly enriched pathways based
on KEGG pathway analysis. |
Table III
Significantly enriched pathways based
on KEGG pathway analysis.
| Pathway ID | Pathway | Upregulated_KO |
Downregulated_KO | P-value |
|---|
| ko04710 | Circadian
rhythm | ARNTl, NPAS2 | BHLHB2, NR1D1,
PER2 |
1.92x10⁻⁸ |
| ko04115 | p53 signaling
pathway | SESN1, CDKN1A,
ZMAT3, GTSE1 | SERPINE1, CCNE,
CCND1 |
2.16x10⁻⁴ |
| ko04713 | Circadian
entrainment | GRIA3, NOS1 | ADCY3, RYR1,
PER2 |
7.01x10⁻⁴ |
| ko01100 | Metabolic
pathways | ASNS, GALE, CTH,
GK | AK1, GCK |
2.32x10⁻³ |
| ko00100 | Steroid
biosynthesis | DHCR7 | SQLE, MESO1 |
5.65x10⁻³ |
| ko00750 | Vitamin B6
metabolism | N/A | SERC, PDXP |
1.06x10⁻² |
| ko04976 | Bile secretion | N/A | CYP7A1, SULT2A1,
HMGCR, ABCG5 |
1.13x10⁻² |
| ko02010 | ABC
transporters | ABCG9, ABCG3 | ABCA4, ABCG5 |
1.16x10⁻² |
| ko04978 | Mineral
absorption | HEPH | MT1_2, ATP1A |
1.27x10⁻² |
| ko03320 | PPAR signaling
pathway | SCD, PPARD, GK | FABP4 |
2.12x10⁻² |
| ko00660 | C5-Branched dibasic
acid metabolism | N/A | IRG1 |
2.34x10⁻² |
| ko04970 | Salivary
secretion | ATP2B, NOS1 | ATP1A, ADCY3 |
4.16x10⁻² |
| ko04972 | Pancreatic
secretion | ATP2A, ATP2B | ATP1A, ADCY3,
CLCA2 |
4.29x10⁻² |
| ko00260 | Glycine, serine and
threonine metabolism | CTH | SERC, SERA |
4.45x10⁻² |
| ko04724 | Glutamatergic
synapse | GRIA3, PLD1_2 | ADCY3, SLC1A7 |
4.48x10⁻² |
| ko04020 | Calcium signaling
pathway | ADORA2B, ATP2A | ADCY3, RYR1 |
4.61x10⁻² |
| ko00909 | Sesquiterpenoid and
triterpenoid biosynthesis | N/A | SQLE |
4.62x10⁻² |
| ko04212 |
Longevity-regulating pathway-worm | SCD | MT1_2, MAP2K6 |
4.64x10⁻² |
Identification and analysis of
metabolites following asarum treatment
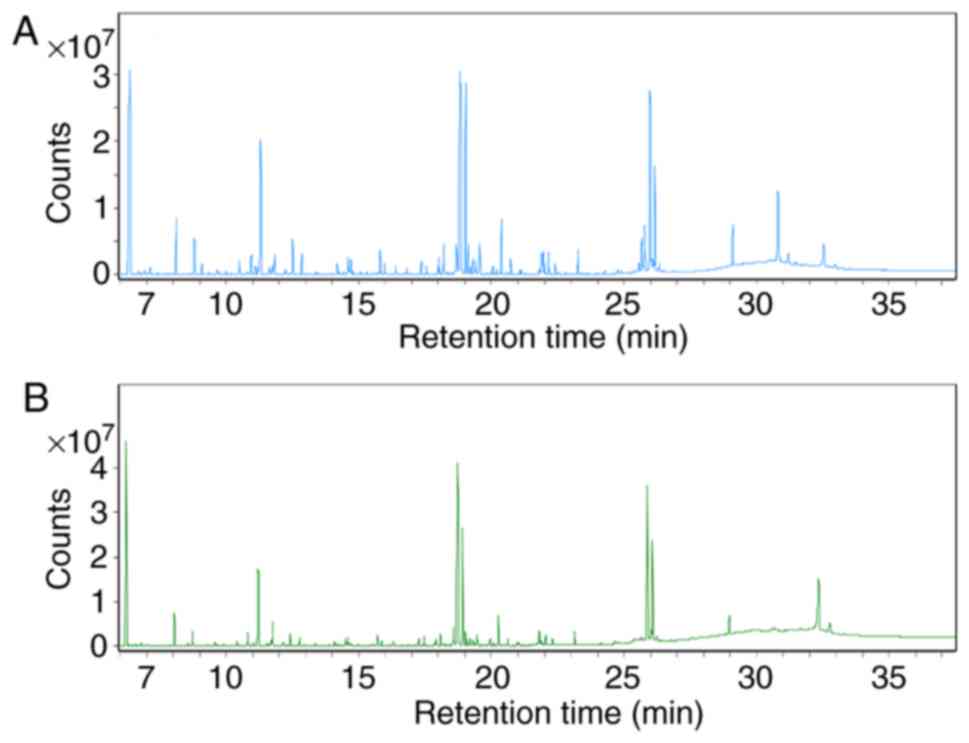
The total ion chromatograms (Fig. 4) demonstrated marked differences in
the metabolite profiles between the control and asarum groups,
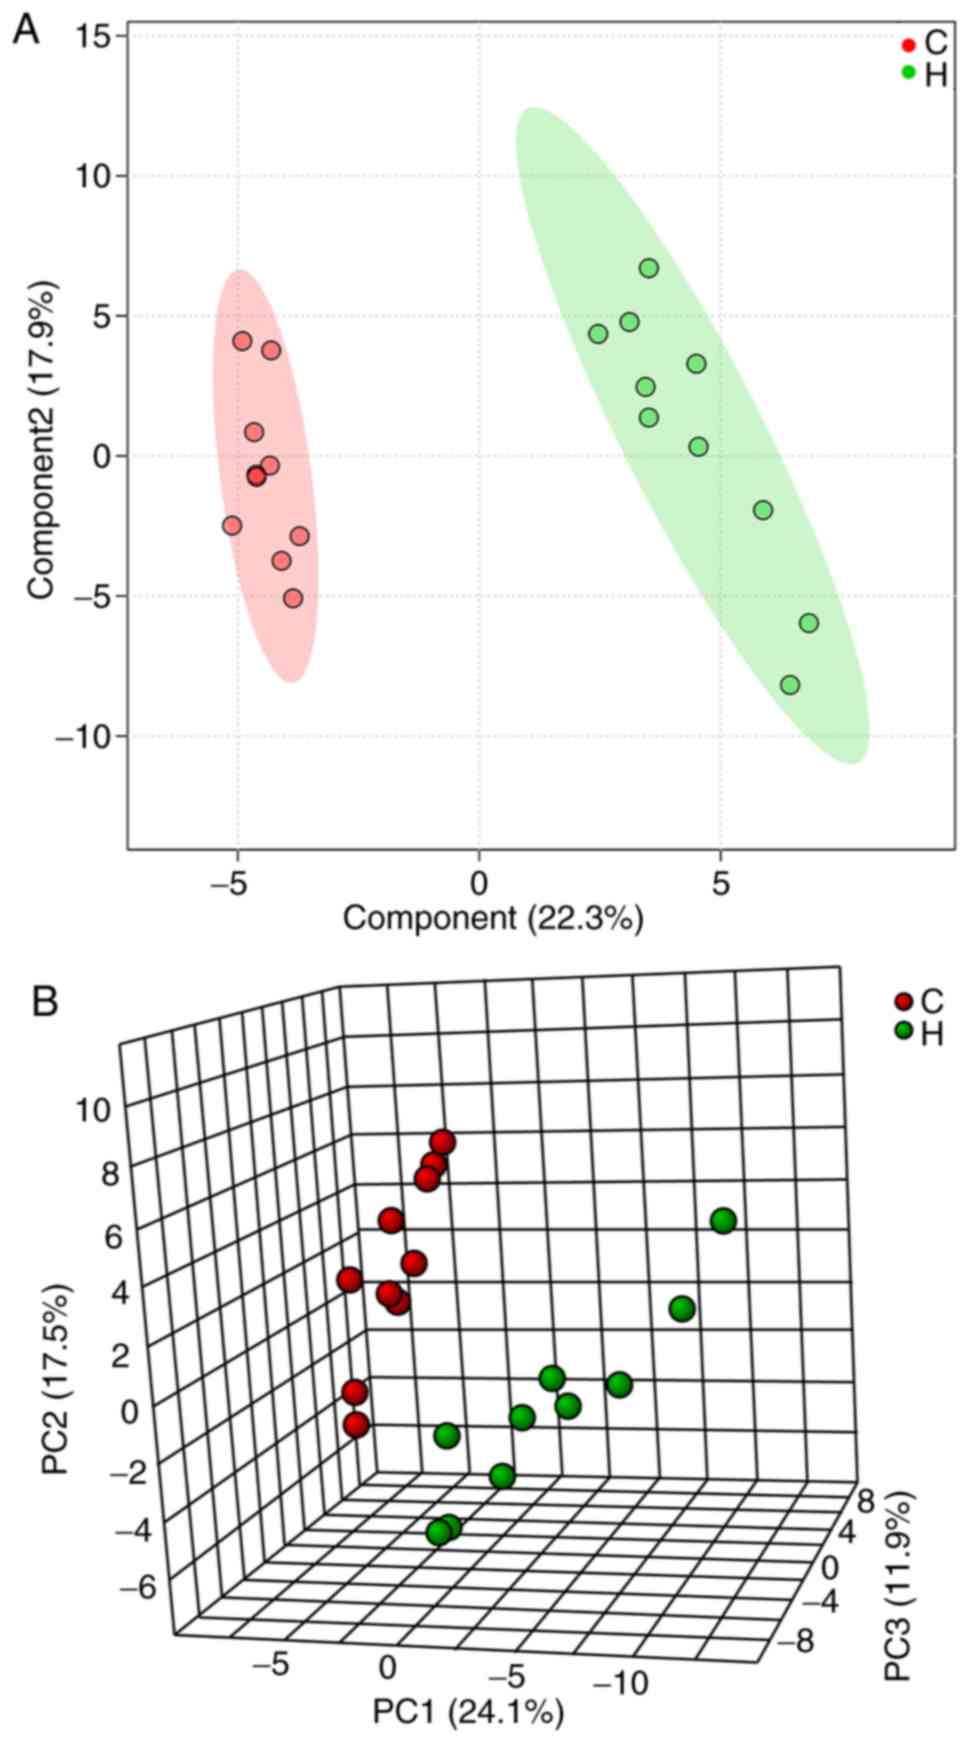
which were greater using multivariate analysis methods. PCA is able
to convert multiple indicators into a number of comprehensive
indicators to analyze differences between groups, whereas PLS-DA is
able to enhance the separation between groups. A distinct
separation was observed in the PLS-DA (Fig. 5A) and PCA score plots (Fig. 5B) of the two groups, where the R2 and
Q2 were indicated to be 0.91 and 0.81, respectively, suggesting
that liver metabolism was altered following asarum treatment.
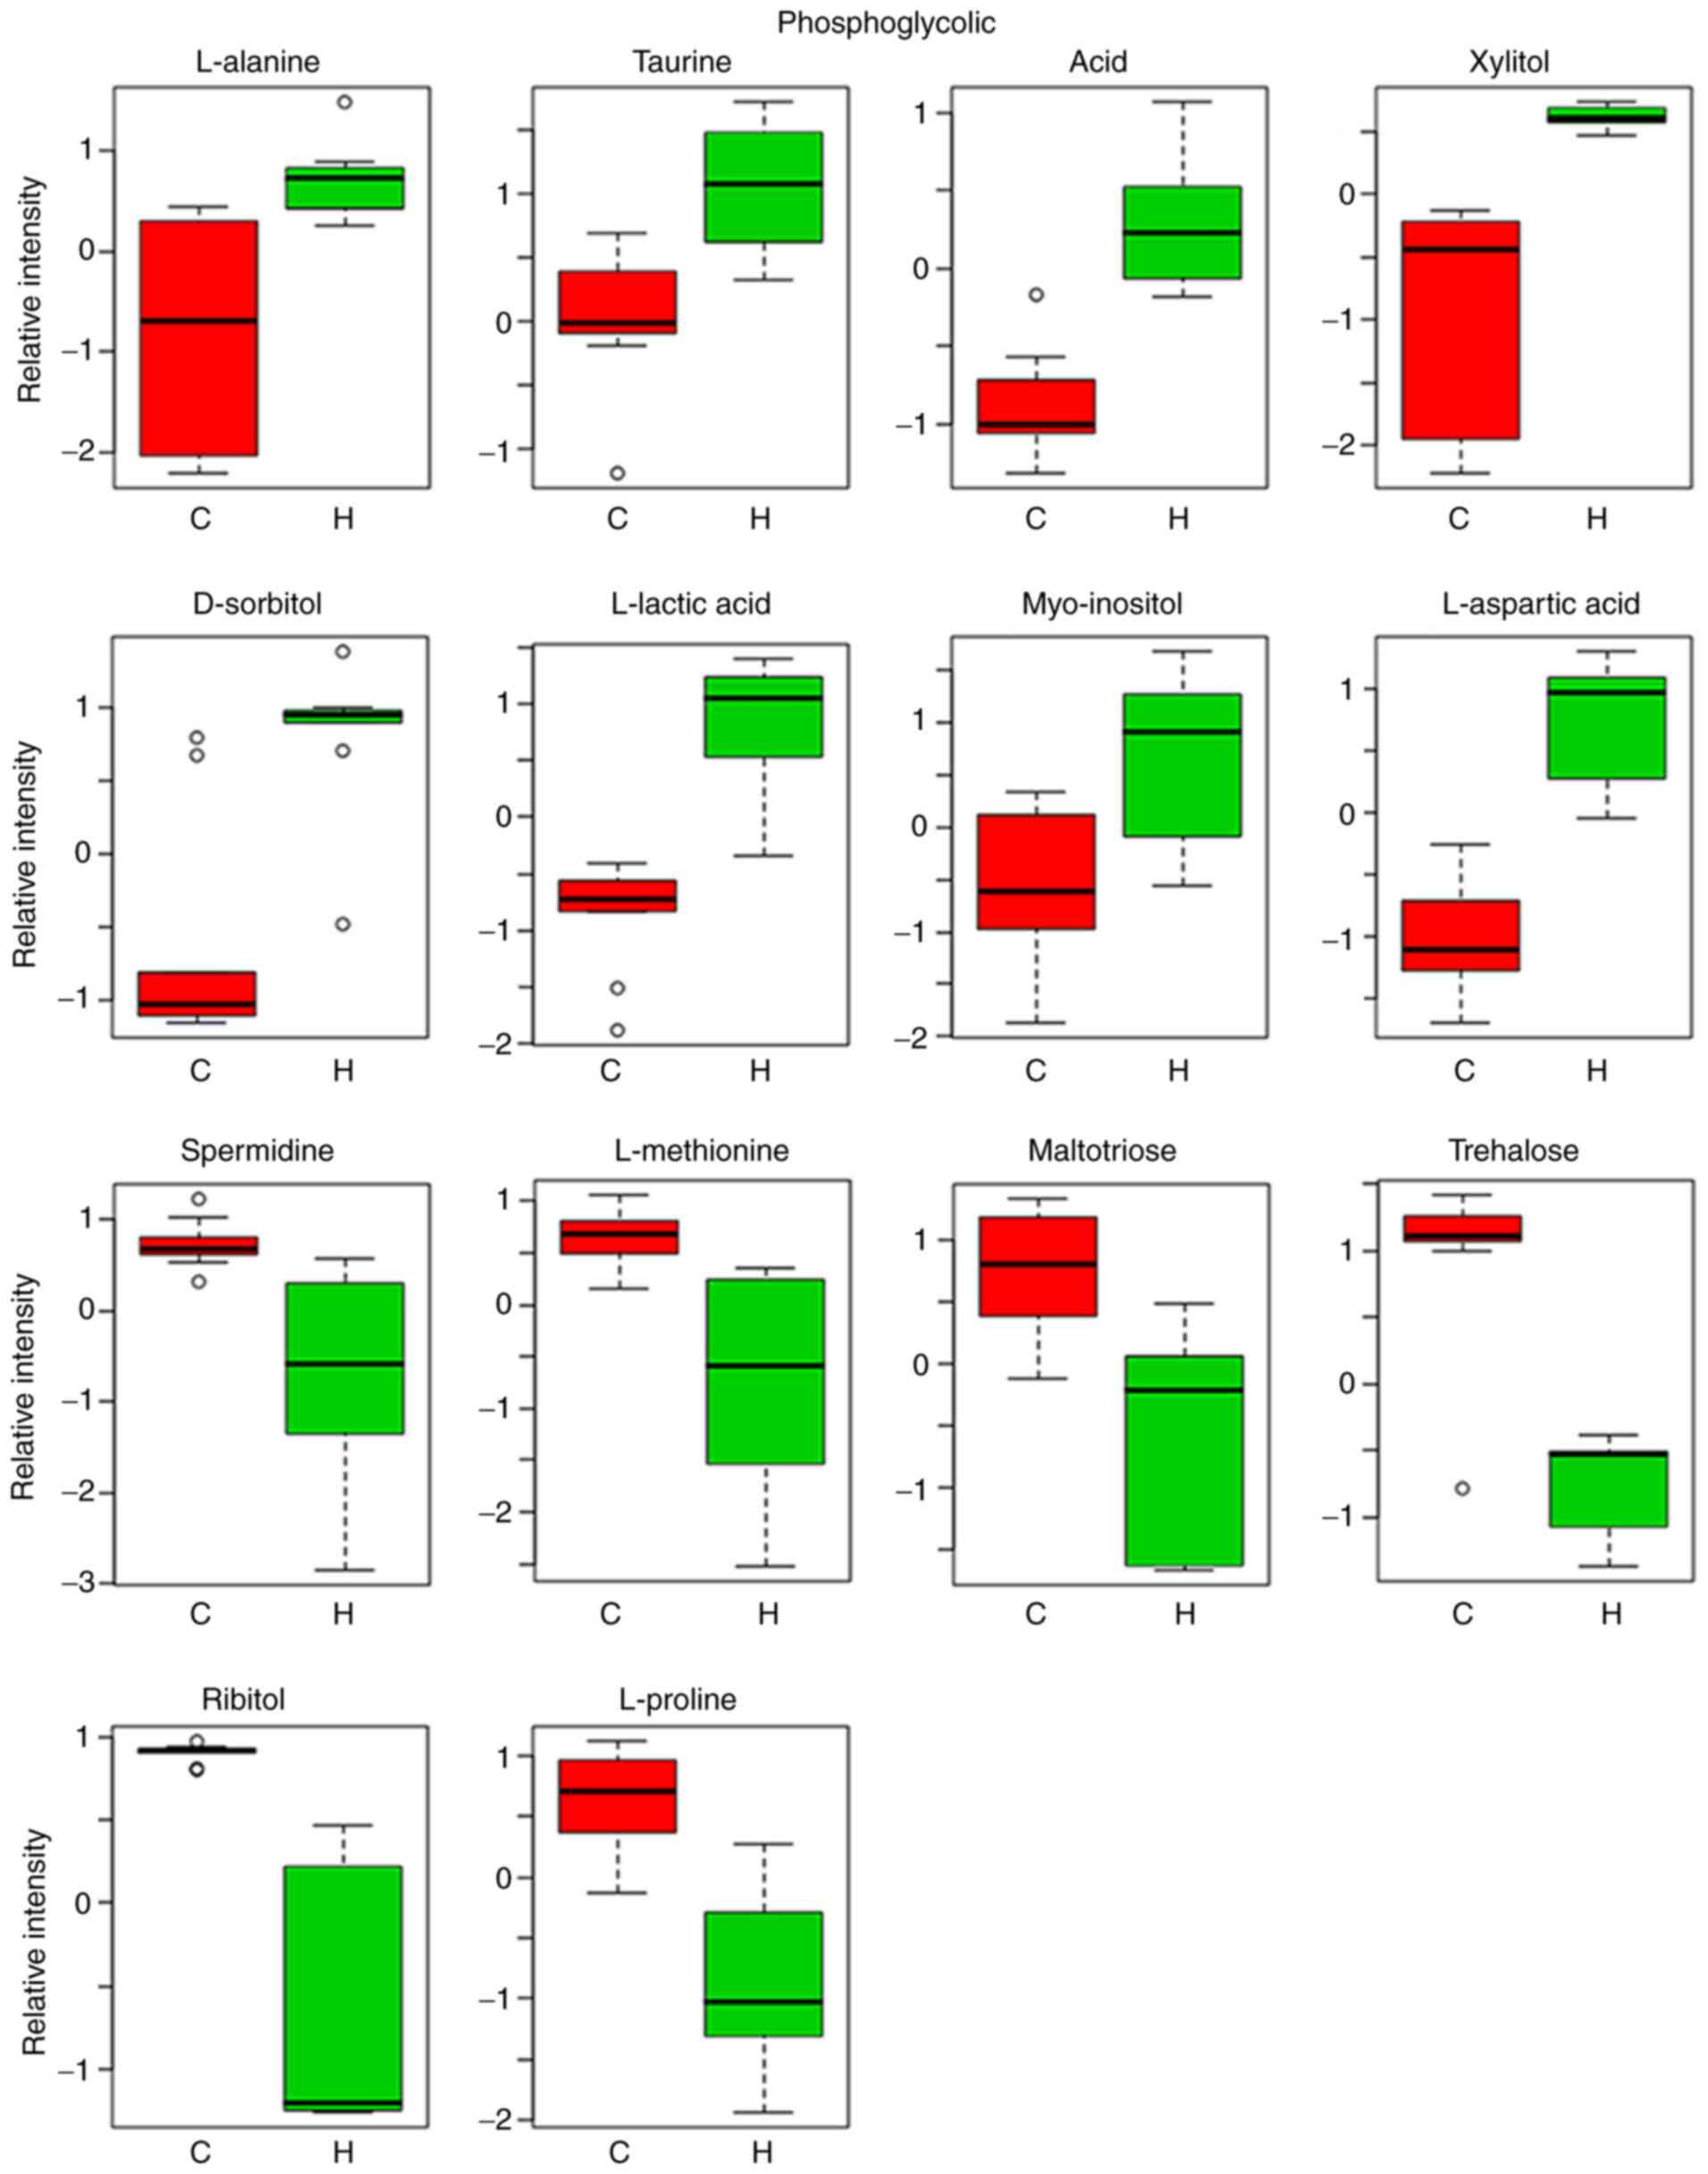
Relative intensity analysis is frequently used to
investigate changes in the levels of biomarkers (27). In total, 14 metabolites were
identified as biomarkers from liver homogenates (Table IV). These 14 metabolites identified
are represented by the peaks in Fig.
4. Compared with the control group, the levels of L-alanine,
taurine, phosphoglycolic acid, xylitol, D-sorbitol, L-lactic acid,
myo-inositol and L-aspartic acid were markedly increased, whilst
the levels of spermidine, L-methionine, maltotriose, trehalose,
ribitol and L-proline were indicated to be markedly lower in the
asarum group (Fig. 6).
| Table IVIdentification of potential
biomarkers. |
Table IV
Identification of potential
biomarkers.
| No. | Retention time
(min) | Metabolite | P-value | Fold change | Associated
pathway |
|---|
| 1 | 8.0415 | L-lactic acid |
2.40x10⁻⁵ | 6.128 | Glycolysis |
| 2 | 8.7148 | L-alanine |
3.75x10⁻⁴ | 2.832 | Alanine, aspartate
and glutamate metabolism |
| 3 | 9.8959 | L-proline |
3.60x10⁻³ | 3.598 | Arginine and
proline metabolism |
| 4 | 13.2286 | L-methionine |
4.24x10⁻³ | 2.756 | Cysteine and
methionine metabolism |
| 5 | 13.3784 | L-aspartic
acid |
4.04x10⁻³ | 5.324 | Alanine, aspartate
and glutamate metabolism |
| 6 | 15.4022 | Phosphoglycolic
acid |
2.42x10⁻³ | 2.514 | Glyoxylate and
dicarboxylate metabolism |
| 7 | 15.5519 | Taurine |
8.68x10⁻³ | 2.406 | Primary bile acid
biosynthesis |
| 8 | 16.8073 | Ribitol |
3.00x10⁻⁶ | 7.887 | Pentose and
glucuronate interconversions |
| 9 | 16.8572 | Xylitol |
2.83x10⁻⁴ | 3.124 | Pentose and
glucuronate interconversions |
| 10 | 18.2734 | D-sorbitol |
8.15x10⁻⁴ | 2.376 | Fructose and
mannose metabolism |
| 11 | 20.6283 | Myo-inositol |
7.22x10⁻³ | 3.198 | Galactose
metabolism |
| 12 | 22.1431 | Spermidine |
1.03x10⁻³ | 3.054 | Arginine and
proline metabolism |
| 13 | 26.0201 | Trehalose |
4.26x10⁻³ | 12.26 | Starch and sucrose
metabolism |
| 14 | 30.6569 | Maltotriose |
5.95x10⁻⁴ | 33.94 | Carbohydrate
digestion and absorption |
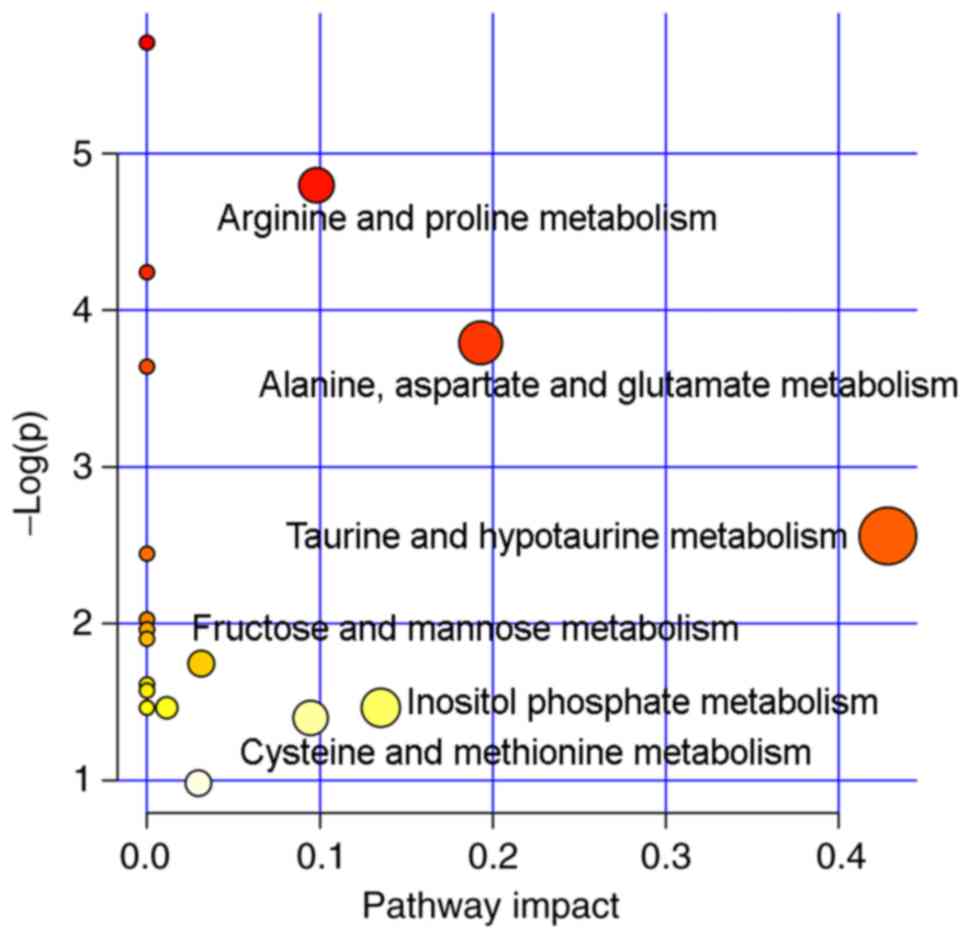
The profiles of the biomarkers were subsequently
imported into the MetaboAnalyst online tool to explore possible
metabolic pathways affected by asarum treatment. A total of six
metabolic pathways were identified as important metabolic pathways,
as listed in Fig. 7. Therefore,
these observations suggest that asarum treatment disrupted the
composition of endogenous metabolites in rats, inducing
disturbances in taurine, hypotaurine and amino acid metabolism.
Integrated analysis of metabolomics
and transcriptomics data
MetScape 3 may be used to visualize and interpret
metabolomics and gene expression profiling data in an integrated
metabolic network (28,30). To investigate the correlation of
metabolites and gene expression affected by asarum treatment,
metabolite and gene expression profiles were imported into the
Cytoscape for Metscape analysis. The metabolite-gene associated
network was revealed to be mainly associated with ‘bile acid
biosynthesis’ and ‘amino acid metabolism’ (Fig. 8). The differentially
expressed/abundant genes and metabolites associated with these
pathways are presented in Table V.
The results suggested that bile acid biosynthesis and amino acid
metabolism may be the key processes associated with the mechanism
of asarum-mediated hepatotoxicity. Because no metabolite changes
were found in the p53 signaling pathway, they were not shown in the
figure during the integrated analysis.
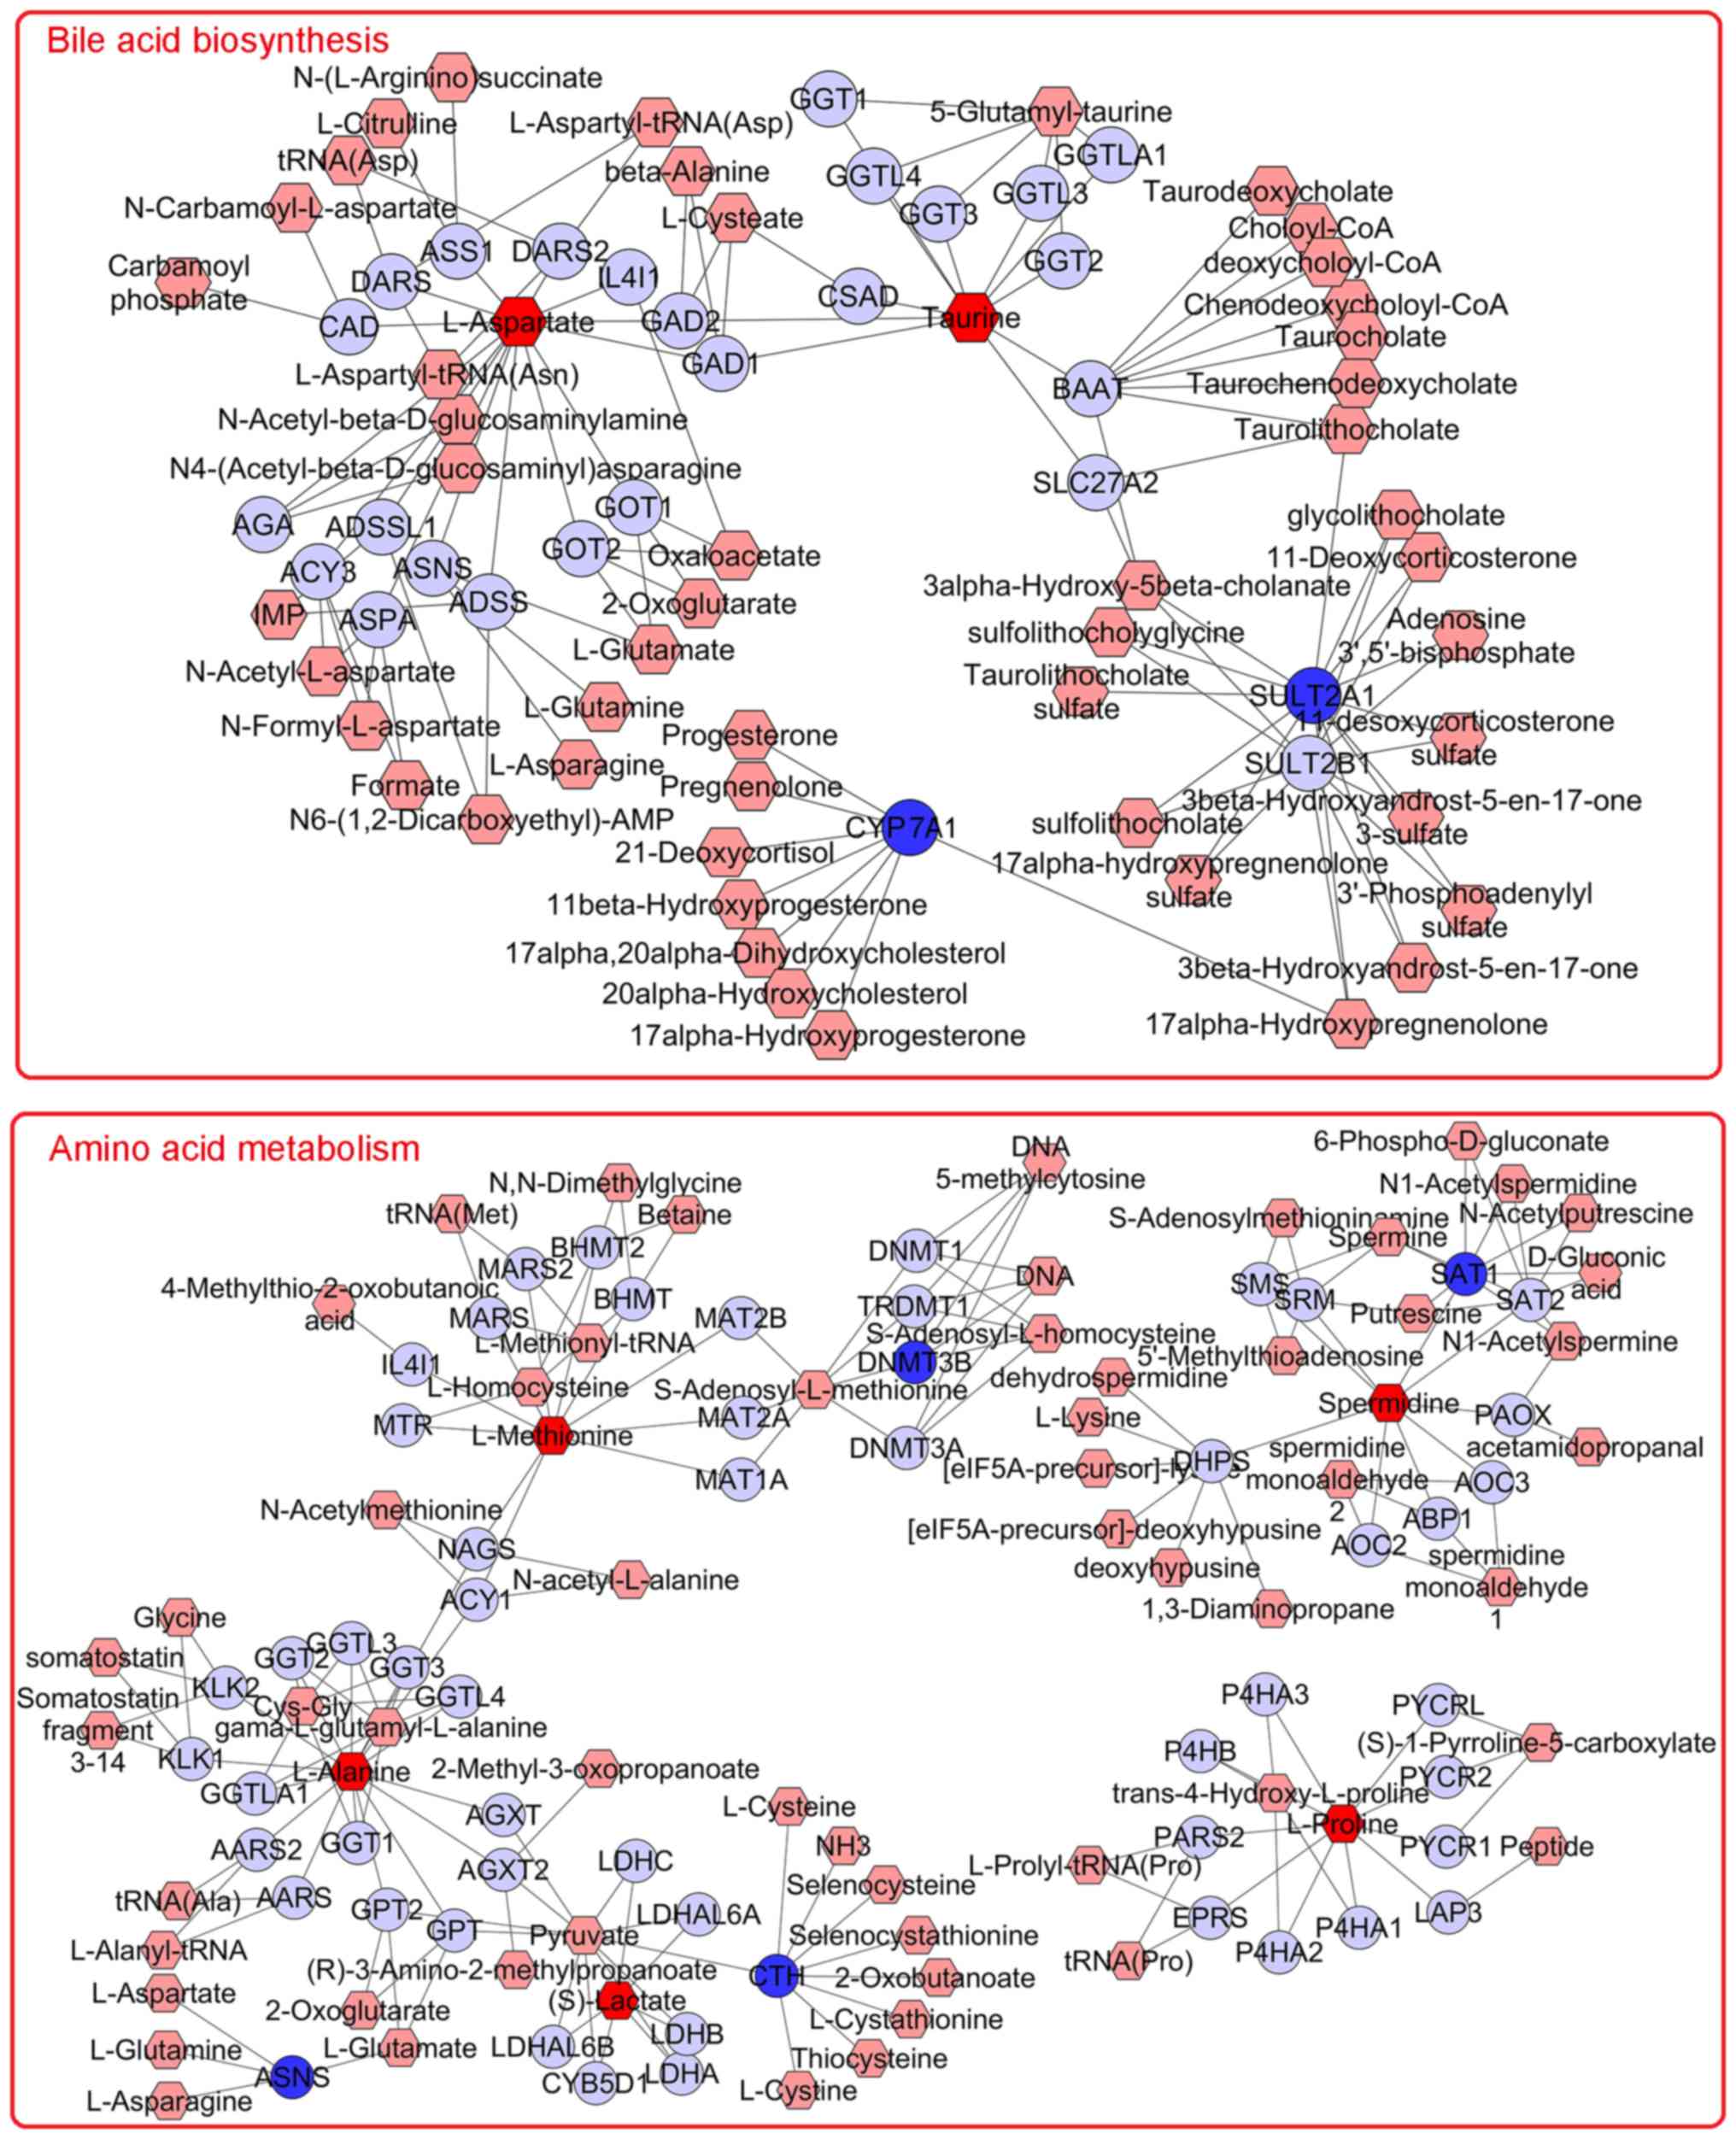 | Figure 8Networks of the metabolites and genes
were visualized using Metscape 3. The entries were obtained from an
integrated analysis of the asarum-mediated hepatotoxicity mechanism
by combining metabolomics and transcriptomics data. The
metabolite-gene associated network was mainly associated with bile
acid biosynthesis and amino acid metabolism. Hexagons indicate
metabolites, circles represent genes, edges indicate the
association between each node. Input genes are shown in dark blue,
input metabolites are shown in dark red. Light colors indicate
differentially expressed genes. CAD, carbamoyl-phosphate synthetase
2 aspartate transcarbamylase and dihydroorotase; DARS,
aspartyl-tRNA synthetase; ASS1, argininosuccinate synthase 1;
DARS2, aspartyl-tRNA synthetase 2; IL4I1, interleukin 4 induced 1;
GAD2, glutamate decarboxylase 2; GAD1, glutamate decarboxylase 1;
CSAD, cysteine sulfinic acid decarboxylase; GGT1,
γ-glutamyltransferase 1; GGTL4, γ-glutamyltransferase light chain
2; GGT3, γ-glutamyl transpeptidase 3; GGTL3, γ-glutamyltransferase
7; GGTLA1, γ-glutamyltransferase 5; GGT2, γ-glutamyltransferase 2;
BAAT, bile acid-CoA, amino acid N-acyltransferase; SLC27A2, solute
carrier family 27 member 2; AGA, aspartylglucosaminidase; ACY3,
aminoacylase 3; ADSSL1 adenylosuccinate synthase 1; ASNS,
asparagine synthetase; ADSS, adenylosuccinate synthase 2; GOT2,
glutamic-oxaloacetic transaminase 2; GOT1, glutamic-oxaloacetic
transaminase 1; SULT2B1, sulfotransferase family 2B member 1; MTR,
5-methyltetrahydrofolate-homocysteine methyltransferase; MARS,
methionyl-tRNA synthetase 1; MARS2, methionyl-tRNA synthetase 2;
BHMT2, betaine-homocysteine S-methyltransferase 2; BHMT,
betaine-homocysteine S-methyltransferase; MAT2B, methionine
adenosyltransferase 2B; MAT2A, methionine adenosyltransferase 2A;
MAT1A, methionine adenosyltransferase 1A; DNMT1, DNA
methyltransferase 1; TRDMT1, tRNA aspartic acid methyltransferase
1; DNMT3B, DNA methyltransferase 3 β; DNMT3A, DNA methyltransferase
3; SMS, spermine synthase; SRM, spermidine synthase; SAT1,
spermidine/spermine N1-acetyltransferase 1; SAT2,
spermidine/spermine N1-acetyltransferase family member 2; PAOX,
polyamine oxidase; DHPS, deoxyhypusine synthase; AOC2, amine
oxidase copper containing 2; ABP1, actin-binding protein 1; AOC3,
amine oxidase copper containing 3; KLK1, kallikrein 1; KLK2,
kallikrein 2; AARS2, alanyl-tRNA synthetase 2; AARS, alanyl-tRNA
synthetase; GPT2, glutamic-pyruvic transaminase 2; GPT,
glutamic-pyruvic transaminase; AGXT, alanine-glyoxylate and
serine-pyruvate aminotransferase; AGXT2, alanine-glyoxylate
aminotransferase 2; LDHC, lactate dehydrogenase C; LDHAL6A, lactate
dehydrogenase A like 6A; LDHAL6B, lactate dehydrogenase A like 6B;
CYB5D1, cytochrome b5 domain containing 1; LDHB, lactate
dehydrogenase B; LDHA, lactate dehydrogenase A; CTH, cystathionine
γ-lyase; P4HA3, prolyl 4-hydroxylase subunit α3; P4HB, prolyl
4-hydroxylase subunit β; PARS2, prolyl-tRNA synthetase 2; EPRS,
glutamyl-prolyl-tRNA synthetase 1; P4HA2, prolyl 4-hydroxylase
subunit α2; P4HA1, prolyl 4-hydroxylase subunit α1; PYCRL,
pyrroline-5-carboxylate reductase 3; PYCR2, pyrroline-5-carboxylate
reductase 2; PYCR1, pyrroline-5-carboxylate reductase 1; LAP3,
leucine aminopeptidase 3. |
| Table VMetabolic pathways identified in the
interactome network using the Cytoscape software 3.6.1,
incorporating gene transcription and metabolite profiles. |
Table V
Metabolic pathways identified in the
interactome network using the Cytoscape software 3.6.1,
incorporating gene transcription and metabolite profiles.
| Metabolic pathways
enriched within the interactome network | Differentially
expressed genes | Differentially
expressed metabolites |
|---|
| Bile acid
synthesis | CYP7A1, SULT2A1,
HMGCR | Taurine, L-aspartic
acid |
| Amino acid
metabolism | ASNS, CTH, DNMT3B,
SAT1 | L-alanine, S-lactic
acid, spermidine, |
| | | L-methionine,
L-proline |
| p53 signaling
pathway | SESN1, CDKN1A,
ZMAT3, GTSE1, SERPINE1, CCNE, CCND1 | None |
Discussion
Toxicity studies are a vital integral component of
TCM development (31). In the
present study, the asarum group exhibited significantly enhanced
organ coefficients and liver function compared with the control
group. In addition, pathological liver tissue staining indicated
significant liver damage following asarum treatment, further
supporting the notion of asarum-induced hepatotoxicity.
Transcriptomics and metabolomics techniques were subsequently
performed to investigate the potential mechanism of asarum-mediated
hepatotoxicity. The transcription profiles exhibited by liver
tissues were first studied, where P53 signaling, metabolic
pathways, steroid biosynthesis and bile secretion pathways were
indicated to be the most relevant signaling pathways associated
with asarum treatment. The metabolomic profiles of liver tissues
from the control and asarum groups were next analyzed, which
revealed that the associated metabolites are mainly members of the
taurine, hypotaurine and amino acid metabolic pathways. The
obtained transcriptomics and metabolomics datasets were next
integrated and the data indicated that asarum-induced
hepatotoxicity was mainly mediated through alterations of bile acid
biosynthesis and amino acid metabolism.
Bile acids, synthesized from cholesterol in the
liver, serve an important role in the regulation of energy, glucose
and lipid metabolism (32).
Cholesterol 7α-hydroxylase (CYP7A1) serves as the rate-limiting
enzyme in the classical biogenic pathway of bile acid synthesis
(33), the activity of which
restricts the synthesis of bile acids in the body. By regulating
CYP7A1 activity, the synthesis of bile acids may be steadily
maintained. During bile acid secretion, bile acids may conjugate
with either taurine or glycine, a process that lowers their pKa and
increases their solubility, resulting in their secretion into the
intestines with bile in a process that is catalyzed by bile salt
sulfotransferase (SULT2A1) (34). In
the present study, CYP7A1 and SULT2A1 were indicated to be markedly
downregulated following asarum administration, whilst the level of
taurine was markedly increased. In addition, the levels of TBil
were increased, suggesting that the synthesis and secretion of bile
acids were affected by asarum administration.
The liver is the principal organ of amino acid
metabolism. Under physiological conditions, basal levels of amino
acid metabolism are high due to the high abundance of associated
enzymes. Consequently, liver damage frequently results in aberrant
amino acid metabolism and eventually loss of liver function. Three
amino acids function as important intermediates in energy
metabolism (35): Alanine is
involved in the alanine-glucose cycle in the body; aspartic acid
serves as the bridge between amino acid and sugar metabolism, as it
reacts with pyridoxal phosphates to form oxaloacetate in a reaction
catalyzed by transaminases to produce sugar by gluconeogenesis,
whilst proline is synthesized by the glutamate pathway. In
addition, taurine may be synthesized from methionine. The covalent
interaction between taurine and bile acid enhances the solubility
of bile acid, facilitating the exclusion from extrahepatic cells
and consequently reduction of bile acid levels in the liver
(36). In the present study, it was
indicated that the levels L-alanine and L-aspartic acid were
markedly incrased following asarum administration, whilst those of
L-proline and L-methionine were markedly reduced. This observation,
together with the result that the activities of AST and ALT were
also increased, further suggests that asarum treatment induced
abnormalities in amino acid metabolism.
The transcriptomic pathway enrichment analysis of
the present study also indicated that the activity of the P53
signaling pathway was increased by asarum treatment. P53 signaling
may induce apoptosis through a number of different pathways in a
manner that is highly dependent on the cell type and upstream
signaling (37). This may be
associated with the presence of carcinogenic chemicals, e.g.
safrole in asarum. A recent study reported that P53 signaling
promoted bile acid disposition and alleviated cholestastic syndrome
(38). However, further study is
required to validate the role of the P53 signaling pathway, in
addition to the role of each individual component of asarum, on
hepatotoxicity.
In conclusion, the present study demonstrated that
asarum-induced hepatoxicity may be mediated through the disruption
of the bile acid and amino acid metabolism, in addition to the P53
signaling pathway. These data may provide novel insight into the
mechanism of the hepatotoxic effect of asarum, which may aid in the
development of novel clinical diagnostic strategies and therapeutic
interventions for asarum poisoning.
Acknowledgements
Not applicable.
Funding
This work was supported by the National Natural
Science Foundation of China (grant no. 81573625) and the Science
and Technology Innovation Team Project of Hubei Provincial
Department of Education for Young and Middle-aged scientists (grant
no. T201608).
Availability of data and materials
The datasets used and/or analyzed during the present
study are available from the corresponding author on reasonable
request.
Authors' contributions
SC and LTH collected and analyzed the data and
prepared the manuscript; YML, SQY and SHH collected the data. SSM,
WQD, and JJL analysed the data and critically revised the content
of this manuscript. ZXZ, QW and FH made substantial contributions
to the conception of the study and to the manuscript. All authors
read and approved the final manuscript.
Ethics approval and consent to
participate
The present study was approved by the animal ethics
committee of Hubei University of TCM (Wuhan, China; approval no.
HUCMS201903001).
Patient consent for publication
Not applicable.
Competing interests
The authors declare that they have no competing
interests.
References
|
1
|
Jing Y, Zhang YF, Shang MY, Liu GX, Li YL,
Wang X and Cai SQ: Chemical constituents from the roots and
rhizomes of Asarum heterotropoides var. mandshuricum
and the in vitro anti-inflammatory activity. Molecules. 22(pii:
E125)2017.PubMed/NCBI View Article : Google Scholar
|
|
2
|
Zhang W, Zhang J, Zhang M and Nie L:
Protective effect of Asarum extract in rats with adjuvant
arthritis. Exp Ther Med. 8:1638–1642. 2014.PubMed/NCBI View Article : Google Scholar
|
|
3
|
Han S, Huang J, Hou J and Wang S:
Screening epidermal growth factor receptor antagonists from Radix
et Rhizoma Asari by two-dimensional liquid chromatography. J Sep
Sci. 37:1525–1532. 2014.PubMed/NCBI View Article : Google Scholar
|
|
4
|
Huang J, Wang HQ, Zhang C, Li GY, Lin RC
and Wang JH: A new tetrahydrofuran-type lignan with
anti-inflammatory activity from Asarum heterotropoides Fr.
Schmidt var. mandshuricum. J Asian Nat Prod Res. 16:387–392.
2014.PubMed/NCBI View Article : Google Scholar
|
|
5
|
Tian HY, Hu J and Wang L: Controlled
observation of non-blister acupoint sticking and electroacupuncture
for bronchial asthma. Zhongguo Zhen Jiu. 33:485–489. 2013.(In
Chinese). PubMed/NCBI
|
|
6
|
Kim JR, Perumalsamy H, Lee JH, Ahn YJ, Lee
YS and Lee SG: Acaricidal activity of Asarum heterotropoides
root-derived compounds and hydrodistillate constitutes toward
Dermanyssus gallinae (Mesostigmata: Dermanyssidae). Exp Appl
Acarol. 68:485–495. 2016.PubMed/NCBI View Article : Google Scholar
|
|
7
|
Cartus AT, Stegmüller S, Simson N, Wahl A,
Neef S, Kelm H and Schrenk D: Hepatic metabolism of carcinogenic
β-asarone. Chem Res Toxicol. 28:1760–1773. 2015.PubMed/NCBI View Article : Google Scholar
|
|
8
|
Wang Y, Guo S, Cao J, Pang X, Zhang Z,
Chen Z, Zhou Y, Geng Z, Sang Y and Du S: Toxic and Repellent
Effects of Volatile Phenylpropenes from Asarum
heterotropoides on Lasioderma serricorne and Liposcelis
bostrychophila. Molecules. 23(pii: E2131)2018.PubMed/NCBI View Article : Google Scholar
|
|
9
|
Yang B, Xie Y, Guo M, Rosner MH, Yang H
and Ronco C: Nephrotoxicity and Chinese herbal medicine. Clin J Am
Soc Nephrol. 13:1605–1611. 2018.PubMed/NCBI View Article : Google Scholar
|
|
10
|
Coghlan ML, Haile J, Houston J, Murray DC,
White NE, Moolhuijzen P, Bellgard MI and Bunce M: Deep sequencing
of plant and animal DNA contained within traditional Chinese
medicines reveals legality issues and health safety concerns. PLoS
Genet. 8(e1002657)2012.PubMed/NCBI View Article : Google Scholar
|
|
11
|
Li Y, Han L, Huang C, Dai W, Tian G, Huang
F, Li J, Liu J, Wang Q and Zhou Z: New contributions to asarum
powder on immunology related toxicity effects in lung. Evid Based
Complement Alternat Med. 2018(1054032)2018.PubMed/NCBI View Article : Google Scholar
|
|
12
|
Li XW, Morinaga O, Tian M, Uto T, Yu J,
Shang MY, Wang X, Cai SQ and Shoyama Y: Development of an Eastern
blotting technique for the visual detection of aristolochic acids
in Aristolochia and Asarum species by using a monoclonal antibody
against aristolochic acids I and II. Phytochem Anal. 24:645–653.
2013.PubMed/NCBI View
Article : Google Scholar
|
|
13
|
Hu L, Shao H, He J, Zhong L, Song Y and Wu
F: Cytotoxicity of safrole in HepaRG cells: Studies on the role of
CYP1A2-mediated ortho-quinone metabolic activation. Xenobiotica.
49:1504–1515. 2019.PubMed/NCBI View Article : Google Scholar
|
|
14
|
Yang AH, Zhang L, Zhi DX, Liu WL, Gao X
and He X: Identification and analysis of the reactive metabolites
related to the hepatotoxicity of safrole. Xenobiotica.
48:1164–1172. 2018.PubMed/NCBI View Article : Google Scholar
|
|
15
|
Patel DN, Ho HK, Tan LL, Tan MM Zhang Q,
Low MY, Chan CL and Koh HL: Hepatotoxic potential of asarones: In
vitro evaluation of hepatotoxicity and quantitative determination
in herbal products. Front Pharmacol. 6(25)2015.PubMed/NCBI View Article : Google Scholar
|
|
16
|
Song J, Zhong RL, Xia Z, Wu H, Zhong QX,
Zhang ZH, Wei YJ, Shi ZQ, Feng L and Jia XB: Research and
application of hepatotoxicity evaluation technique of traditional
Chinese medicine. Zhongguo Zhong Yao Za Zhi. 42:41–48.
2017.PubMed/NCBI View Article : Google Scholar
|
|
17
|
Ye H, Nelson LJ, Gómez Del Moral M,
Martinez-Naves E and Cubero FJ: Dissecting the molecular
pathophysiology of drug-induced liver injury. World J
Gastroenterol. 24:1373–1385. 2018.PubMed/NCBI View Article : Google Scholar
|
|
18
|
Xin J, Zhang RC, Wang L and Zhang YQ:
Researches on transcriptome sequencing in the study of traditional
Chinese medicine. Evid Based Complement Alternat Med.
2017(7521363)2017.PubMed/NCBI View Article : Google Scholar
|
|
19
|
Jin J, Kang W, Zhong C, Qin Y, Zhou R, Liu
H, Xie J, Chen L, Qin Y and Zhang S: The pharmacological properties
of Ophiocordyceps xuefengensis revealed by transcriptome analysis.
J Ethnopharmacol. 219:195–201. 2018.PubMed/NCBI View Article : Google Scholar
|
|
20
|
Misra BB, Upadhayay RP, Cox LA and Olivier
M: Optimized GC-MS metabolomics for the analysis of kidney tissue
metabolites. Metabolomics. 14(75)2018.PubMed/NCBI View Article : Google Scholar
|
|
21
|
Zhang Y, Li H, Hu T, Li H, Jin G and Zhang
Y: Metabonomic profiling in study hepatoprotective effect of
polysaccharides from Flammulina velutipes on carbon
tetrachloride-induced acute liver injury rats using GC-MS. Int J
Biol Macromol. 110:285–293. 2018.PubMed/NCBI View Article : Google Scholar
|
|
22
|
Zhang F, Mao Y, Qiao H, Jiang H, Zhao H,
Chen X, Tong L and Sun X: Protective effects of taurine against
endotoxin-induced acute liver injury after hepatic ischemia
reperfusion. Amino Acids. 38:237–245. 2010.PubMed/NCBI View Article : Google Scholar
|
|
23
|
Mi H, Muruganujan A, Ebert D, Huang X and
Thomas PD: PANTHER version 14: More genomes, a new PANTHER GO-slim
and improvements in enrichment analysis tools. Nucleic Acids Res.
47 (D1):D419–D426. 2019.PubMed/NCBI View Article : Google Scholar
|
|
24
|
Huang da W, Sherman BT and Lempicki RA:
Systematic and integrative analysis of large gene lists using DAVID
bioinformatics resources. Nat Protoc. 4:44–57. 2009.PubMed/NCBI View Article : Google Scholar
|
|
25
|
Fiehn O: Metabolomics by gas
chromatography-mass spectrometry: Combined targeted and untargeted
profiling. Curr Protoc Mol Biol. 114:30.4.1–30.4.32.
2016.PubMed/NCBI View Article : Google Scholar
|
|
26
|
Tavares G, Venturini G, Padilha K, Zatz R,
Pereira AC, Thadhani RI, Rhee EP and Titan SMO: 1,5-Anhydroglucitol
predicts CKD progression in macroalbuminuric diabetic kidney
disease: Results from non-targeted metabolomics. Metabolomics.
14(39)2018.PubMed/NCBI View Article : Google Scholar
|
|
27
|
Chong J, Soufan O, Li C, Caraus I, Li S,
Bourque G, Wishart DS and Xia J: MetaboAnalyst 4.0: Towards more
transparent and integrative metabolomics analysis. Nucleic Acids
Res. 46 (W1):W486–W494. 2018.PubMed/NCBI View Article : Google Scholar
|
|
28
|
Su G, Morris JH, Demchak B and Bader GD:
Biological network exploration with Cytoscape 3. Curr Protoc
Bioinformatics. 47:8.13.1–24. 2014.PubMed/NCBI View Article : Google Scholar
|
|
29
|
Basu S, Duren W, Evans CR, Burant CF,
Michailidis G and Karnovsky A: Sparse network modeling and
metscape-based visualization methods for the analysis of
large-scale metabolomics data. Bioinformatics. 33:1545–1553.
2017.PubMed/NCBI View Article : Google Scholar
|
|
30
|
Shou Q, Jin L, Lang J, Shan Q, Ni Z, Cheng
C, Li Q, Fu H and Cao G: Integration of metabolomics and
transcriptomics reveals the therapeutic mechanism underlying
paeoniflorin for the treatment of allergic asthma. Front Pharmacol.
9(1531)2019.PubMed/NCBI View Article : Google Scholar
|
|
31
|
Frenzel C and Teschke R: Herbal
hepatotoxicity: Clinical characteristics and listing compilation.
Int J Mol Sci. 17(pii: E588)2016.PubMed/NCBI View Article : Google Scholar
|
|
32
|
Chiang JYL: Bile acid metabolism and
signaling in liver disease and therapy. Liver Res. 1:3–9.
2017.PubMed/NCBI View Article : Google Scholar
|
|
33
|
Hylemon PB, Takabe K, Dozmorov M,
Nagahashi M and Zhou H: Bile acids as global regulators of hepatic
nutrient metabolism. Liver Res. 1:10–16. 2017.PubMed/NCBI View Article : Google Scholar
|
|
34
|
de Aguiar Vallim TQ, Tarling EJ and
Edwards PA: Pleiotropic roles of bile acids in metabolism. Cell
Metab. 17:657–669. 2013.PubMed/NCBI View Article : Google Scholar
|
|
35
|
Shimomura Y and Kitaura Y: Physiological
and pathological roles of branched-chain amino acids in the
regulation of protein and energy metabolism and neurological
functions. Pharmacol Res. 133:215–217. 2018.PubMed/NCBI View Article : Google Scholar
|
|
36
|
Nelson C: Less methionine means more
health. Lab Animal. 47(269)2018.
|
|
37
|
Ding HF and Fisher DE: Mechanisms of
p53-mediated apoptosis. Crit Rev Oncog. 9:83–98. 1998.PubMed/NCBI View Article : Google Scholar
|
|
38
|
Chen P, Li D, Chen Y, Sun J, Fu K, Guan L,
Zhang H, Jiang Y, Li X, Zeng X, et al: p53-mediated regulation of
bile acid disposition attenuates cholic acid-induced cholestasis in
mice. Br J Pharmacol. 174:4345–4361. 2017.PubMed/NCBI View Article : Google Scholar
|