Introduction
Numerous epidemiological studies have reported that low birth weight resulting from intrauterine growth retardation (IUGR) is associated with increased risk of insulin resistance (IR), obesity, type 2 diabetes mellitus and metabolic syndrome (1-3) in adults. IUGR also acts as an independent risk factor of childhood obesity (4). To the best of our knowledge, however, the underlying mechanisms have not been fully elucidated. The thrifty phenotype hypothesis (5) and the catch-up growth theory (6) are regarded as explanations for the causes of metabolic disease among individuals with IUGR. Different diets provided at birth may be an important cause of glycolipid metabolic disorders in adults with IUGR. An epidemiological survey of hyperglycemia among middle-aged individuals born during the famine period of 1959-1961 in China showed that the incidence of hyperglycemia in the fetal and late childhood famine-exposed group were 5.7 and 5.9% in adulthood respectively, while that of the unexposed group was only 2.4% (7). Preterm infants fed with formula milk gained weight faster and exhibited more severe IR when compared with full-term infants fed with formula milk or breast milk (8). This indicates that a nutritious diet accelerates growth rate in the early stages of life and may have adverse effects on metabolism. In another study, re-feeding with a high-fat diet following weight loss due to fetal or neonatal growth retardation accelerated the inhibition of lipid consumption, increasing fat synthesis (6). However, Garg et al (9) and Zambrano et al (10) demonstrated that IUGR neonatal rats provided with restricted nutrition during the lactation period and given a normal diet following weaning exhibited decreased body weight and increased insulin sensitivity. Based on these results, the precise effect and mechanism of postnatal dietary nutritional status on glucose and lipid metabolism disorders in IUGR fetuses remains unknown.
It was hypothesized that different dietary interventions in rats that had experienced IUGR would result in effects on growth rate, blood glucose levels, insulin sensitivity, serum lipid levels, adipokine levels, abdominal adipocyte morphology and levels of inflammation. In the present study, different dietary interventions were administered to rats that experienced IUGR during typical growth windows to evaluate their effects on glucose and lipid metabolism. In addition, the levels of obesity-associated factors in different dietary groups were investigated to further delineate the mechanism of intrauterine retardation and associated metabolic abnormalities.
Materials and methods
IUGR animal models and dietary interventions
Specific pathogen free (SPF) Sprague-Dawley (SD) rats (age, 10-12 weeks; weight, 200-250 g), were provided by Guangdong Experimental Animal Center. There were 5 male and 15 female rats. SD rats were kept in an SPF animal house under artificial control at a temperature of 22˚C and a relative humidity of 40-60 percent on a 12-h light-dark cycle. Pregnant Sprague-Dawley (SD) rats were randomly divided into normal (21% protein; group A) and low-protein diet groups (8% protein; group B). As sex hormones affect glycolipid metabolism and estrogen is considered to be beneficial to glycolipid metabolism in females, only male offspring were selected for the study (11,12). Details of diet ingredient composition in different groups are presented in Table SI. The male offspring delivered by maternal group A were randomly assigned to two groups, in which one group was fed a normal diet (CON group; n=8; maternal rats were fed a normal diet during lactation) and the other was fed a high-fat diet (N + H + H group; n=6; maternal rats were fed a high-fat diet during lactation) after weaning. Male offspring of group B rats fed with low-protein diet with birth weights <2 times the standard deviation of the CON group (6.52±0.50 g) were selected as IUGR model rats. IUGR neonatal male rats were divided into three groups with different dietary interventions: i) Maternal rats continuously fed with low-protein diet during lactation, and offspring fed a high-fat diet after weaning (IUGR + L + H group; n=5); ii) Lactating mothers and weaning offspring fed a high-fat diet (IUGR + H + H group; n=6); and iii) Lactating mothers and weaning offspring fed a normal diet (IUGR + N + N; n=6). A total of five groups were weaned after 3 weeks, and dietary induction was completed at 12-weeks-old. Grouping details are presented in Table I. Each group of rats had free access to food and water. The offspring were weighed every 2 days during lactation and weekly after weaning. The experiment was approved by the Animal Ethics Committee of Shantou University Medical College (approval no. SUMC2012-159).
 |
Table I
Establishment of animal model.
|
Table I
Establishment of animal model.
| Group |
n |
Pregnancy |
Lactation, 0-3 weeks |
After weaning, 4-12 weeks |
| CON |
8 |
Normal |
Normal |
Normal |
| IUGR + L + H |
5 |
8% protein |
8% protein |
High-fat |
| N + H + H |
6 |
Normal |
High-fat |
High-fat |
| IUGR + H + H |
6 |
8% protein |
High-fat |
High-fat |
| IUGR + N + N |
6 |
8% protein |
Normal |
|
Assessment of glucose metabolism
At 12 weeks old, oral glucose tolerance, insulin release and insulin tolerance tests (OGTTs, IRTs and ITTs, respectively) were performed to evaluate glucose metabolism.
OGTT and IRT
The rats began to fast at 8:00 p.m. the night prior to the experiment. The fasting serum insulin and blood glucose levels were measured via tail vein blood sampling the next day at 8 am. According to 2 g/kg standard, 20% glucose solution was given via gavage, and the serum insulin and blood glucose levels were measured via tail vein blood sampling after 30, 60 and 120 min. The serum insulin levels were detected using an Insulin ELISA kit (cat. no. EZRMI-13K; EMD Millipore). GraphPad Prism software (version 5; GraphPad Software, Inc.) was used to calculate the area under the curve (AUC) of blood glucose and insulin. Blood glucose was measured using a Glucose Meter (Johnson & Johnson).
ITT
The rats were fasted for >6 h prior to the experiment, and fasting blood glucose was measured via tail vein blood sampling. Novolin R (Novo Nordisk, Inc.) was intraperitoneally injected at a dose of 0.5 U/kg, and blood glucose was measured via the caudal vein after 30, 60 and 90 min of insulin loading. Insulin resistance was measured by calculating the rate of decline of the log transformed blood glucose concentrations obtained from 0 to 30 min after insulin injection, estimated by linear regression. This was multiplied by 100 to derive the rate constant, KITT (13).
Blood collection and sampling
The rats began the 12 h fast at 8:00 p.m. the night prior to sampling. On the day of sampling, the rats were anesthetized with 2 mg/ml phenobarbital sodium (40 mg/kg body weight) and weighed with an electronic balance (accuracy, 0.01 g). The rats were laid flat on the test stand and the waist circumference was measured with a tape (accuracy, 0.1 cm) around the abdomen at the position of one finger above the base of the thigh. Then, the trunk of the rats was straightened, and the length from the tip of the nose to the base of the tail was measured as the length of the rat (accuracy, 0.1 cm). The Lee's index value was calculated, which reflects the degree of obesity in rats (14). Blood (2.5-5 ml) was collected from the heart via cardiac puncture in EDTA-treated and untreated glass tubes, followed by centrifugation to extract plasma or serum, and stored at -20˚C. Subsequently, rats were sacrificed via decapitation. The abdominal cavity was opened, and abdominal adipose tissue was removed and weighed (accuracy, 0.01 g). The blood samples collected from the tail vein or heart were coagulated at room temperature for 30 min, centrifuged for 20 min at 1,053.9 x g at room temperature and the plasma or serum was carefully collected. Blood samples obtained from tail vein were used to detect insulin, and from heart were used to detect plasma lipid and adipokine levels.
Plasma lipid detection
Levels of plasma lipids, including total cholesterol (TC), triglyceride (TG), high-density lipoprotein cholesterol (HDL-C) and low-density lipoprotein cholesterol (LDL-C), were assessed via an automatic biochemical analyzer (LX20; Beckman Coulter, Inc.).
Detection of adipokines
Levels of adiponectin, leptin, monocyte chemoattractant protein (MCP-1), tumor necrosis factor-α (TNF-α) in serum and interleukin-6 (IL-6) in the adipose tissues of rats were assessed via ELISA kits. The rat adiponectin ELISA kit (cat. no. EZRADP-62K) and rat leptin ELISA kit (cat. no. EZRL-83K) were obtained from EMD Millipore. The rat MCP-1 ELISA kit (cat. no. ERC113.96) and rat TNF-α ELISA kit (cat. no. ERC102a.96) were obtained from Neobioscience Technology Co, Ltd. The rat IL-6 ELISA kit (cat. no. ELR-IL6-2) was obtained from RayBiotech, Inc. All ELISA tests were performed according to the manufacturers' instructions. As the content of IL-6 in the serum remained low, the levels of IL-6 in adipose tissue were detected directly by extracting the adipose tissue protein. Adipose tissue was placed in a glass homogenizer, to which was added 10 µl of RIPA buffer (cat. no. R0010; Beijing Solarbio Science & Technology Co., Ltd.) per mg sample, and homogenized on ice until fully lysed. The homogenate was centrifuged at 4˚C and 14,000 x g for 10 min and the supernatant was removed. The total protein concentration was determined using a BCA protein assay kit (cat. no. 23210; Thermo Scientific, Inc.).
Histology of adipose tissue
Adipose tissue specimens were fixed in 4% formalin for 24 h at room temperature, embedded in paraffin and cut into 6 µm thick sections. All tissue sections were baked at 60˚C for 2 h and de-paraffinized in xylene at 50˚C for 30 min before rehydration in a graded ethanol series at room temperature (100% alcohol for 5 min, fresh 100% alcohol for 5 min, 95% alcohol for 2 min, 85% alcohol for 2 min, 75% alcohol for 2 min, 50% alcohol for 2 min and ddH2O for 2 min;). To test adipocyte sizes and the numbers of mast cells in adipose tissues, haematoxylin-eosin staining (staining with hematoxylin for 1 min and eosin for 5 min; both at room temperature) and toluidine blue staining (staining for 40 min at 50-60˚C) were performed. For measurement of adipocyte diameter, 5 random fields (magnification x200) of each section (3 sections per animal) were evaluated with Image-pro Plus 6.0 software (Media Cybernetics, Inc.). Mast cell numbers in each section were counted under a light microscope (Olympus Corporation) and data are presented as cell numbers per mm2.
Statistical analysis
Data are presented as the mean ± standard error of the mean and all experiments were performed in triplicate. Statistical analysis was performed using SPSS software (version 19.0; IBM Corp.). Linear regression was used to calculate the KITT value and evaluate the association between time and offspring weight in the different dietary groups and then slopes compared using ANCOVA. Mixed ANOVA with post hoc Bonferroni testing was used to analyze the blood glucose and serum insulin at each time point in glycometabolic related tests. Other measurement data were analyzed by one-way ANOVA followed by a post hoc Bonferroni test. P<0.05 was considered to indicate a statistically significant difference.
Results
Growth and development in different groups of rats
The changes in body weight of rats in each group are presented in Fig. 1. During the lactation period (1-3 weeks), the body weight regression slopes for rats in the N + H + H (y=2.18x + 2.97; R=0.91), IUGR + H + H (y=1.66x + 0.38; R=0.97) and IUGR + N + N groups (y=1.83x-0.20; R=0.99) were steeper than the CON group (y=1.52x + 4.45; R=0.96; all P<0.05), whereas the body weight regression slope of the IURG + L + H group (y=1.18x + 1.63; R=0.91) was less steep than the CON group (P<0.001; Fig. 1A). After weaning (Fig. 1B), body weight regression slopes of offspring in the N + H + H (y=28.65x-23.65; R=0.94), IUGR + H + H (y=25.83x-23.75; R=0.98), IUGR + L + H (y=24.57x-28.28; R=0.97) and IUGR + N + N groups (y=23.49x-19.08; R=0.98) were all steeper than the CON group (y=21.13x-4.72; R=0.97; all P<0.01). The rats in each IUGR group exhibited significant catch-up growth. By week 10, the weight of rats in each IUGR group exceeded that of those in the CON group, which lasted until the end of the 12-week intervention. The other characteristics of growth and development are summarized in Table II. The birth weight of rats in the IUGR group was significantly decreased compared with the CON group (P<0.05). Compared with the CON group at the end of week 12, the weight of the N + H + H group was significantly increased (P<0.05). The Lee's index values in the IUGR + L + H, IUGR + H + H, IUGR + N + N and N + H + H groups were higher than those in the CON group (P<0.05). The abdominal adipose and weight of peritoneal adipose tissues in the N + H + H and IUGR + L + H groups were significantly increase compared with in the CON group (P<0.05).
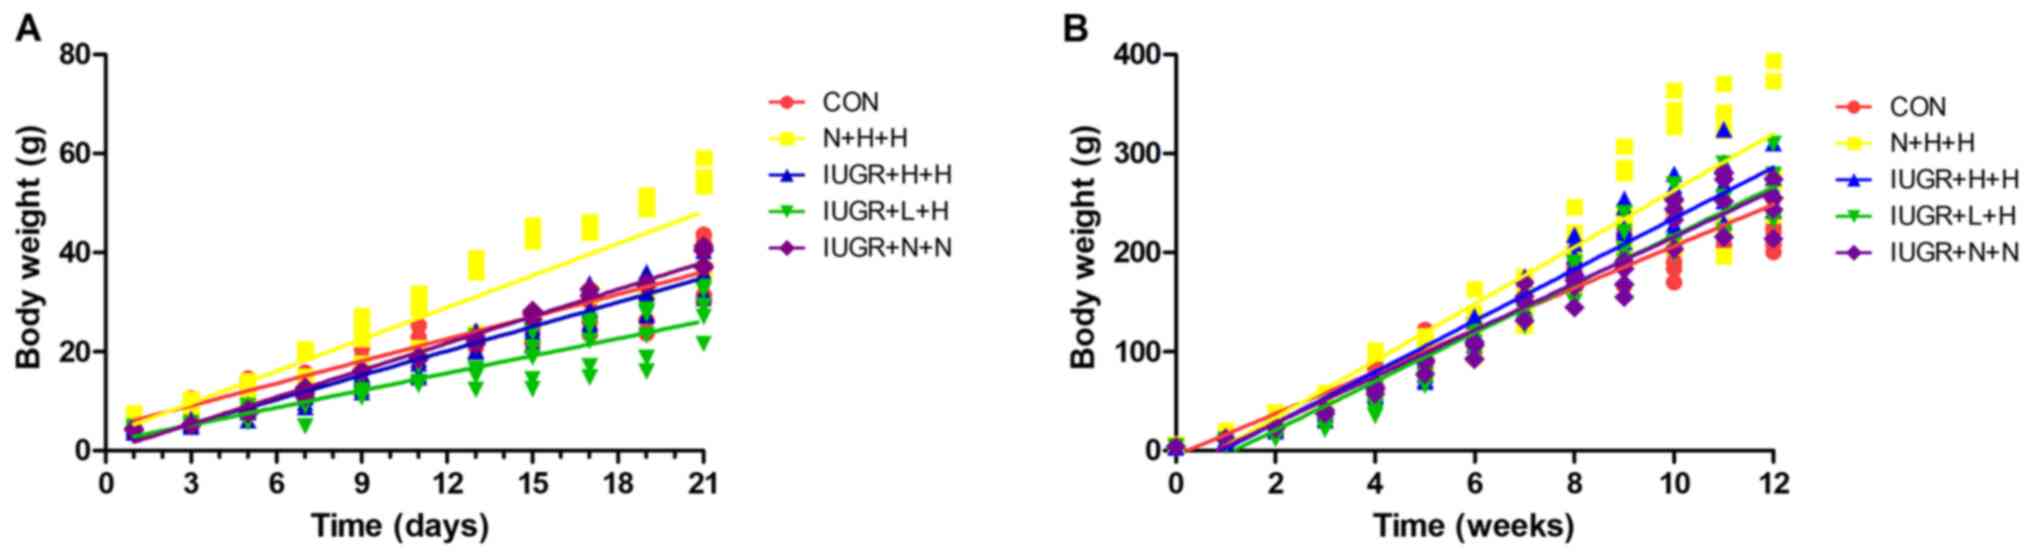 |
Figure 1
Changes in body weight of rats in different groups. (A) Body weight in different groups of rats during lactation (0-21 days). N + H + H, IUGR + H + H and IUGR + N + N groups showed steeper growth slopes compared with the CON group (2.18, 1.66 and 1.83, respectively vs. 1.52; P<0.05), whereas the IUGR + L + H group exhibited more gentle growth than the CON group (1.18 vs. 1.52; P<0.001). (B) Body weight in different groups of rats from birth to 12 weeks. N + H + H, IUGR + H + H, IUGR + L + H and IUGR + N + N group exhited steeper slopes than CON group (28.65, 25.83, 24.57 and 23.49, respectively vs. 21.13; all P<0.01). CON, non-IUGR rats receiving a normal diet during lactation and after weaning; N + H + H, non-IUGR rats receiving high-fat diet during lactation and after weaning; IUGR + H + H, IUGR rats receiving a high-fat diet during lactation and after weaning; IUGR + L + H, IUGR rats receiving a low-protein diet during lactation and a high-fat diet after weaning; IUGR + N + N, IUGR rats receiving a normal diet during lactation and after weaning; IUGR, intrauterine growth retardation.
|
|
Table II
Weight, length, waist, weight of peritoneal fat in different group of rats.
|
Table II
Weight, length, waist, weight of peritoneal fat in different group of rats.
| Group |
n |
Birth weight, g |
Weight at 12 weeks, g |
Length, cm |
Waist, cm |
Lee's index |
Wet weight of peritoneal adipose tissue, g |
Unit weight of adipose, x10-3% |
| CON |
8 |
6.52±0.50 |
252.88±22.90 |
22.3±2.7 |
14.8±0.6 |
285.87±27.78 |
2.70±0.56 |
10.65±1.84 |
| N + H + H |
6 |
6.72±0.60 |
351.83±84.41a |
21.4±1.5 |
18.0±2.1b |
327.17±4.42b |
10.56±6.63b |
27.97±11.94b |
| IUGR + H + H |
6 |
4.23±0.42b |
285.12±27.58 |
20.8±1.0 |
16.1±0.6a |
314.96±4.50a |
3.93±1.29 |
13.54±3.07 |
| IUGR + L + H |
5 |
4.24±0.40b |
274.80±30.14 |
20.6±0.9 |
17.7±1.2b |
315.93±4.42a |
6.16±2.05 |
22.00±5.11a |
| IUGR + N + N |
6 |
4.24±0.19b |
282.00±32.43 |
20.8±1.7 |
17.6±1.2a |
314.80±6.43a |
4.13±1.13 |
14.65±3.81 |
Assessment of glucose metabolism
The OGTT, IRT and ITT results are presented in Fig. 2. For OGTT (Fig. 2A and B), although IUGR + L + H and N + H + H group seemed to had the higher blood glucose after glucose load compared with the CON group, the blood glucose levels exhibited no significant differences at each time between groups. The AUCglucose was also not significant among all groups. For IRT (Fig. 2C and D), the fasting insulin levels in the N + H + H and IUGR + L + H groups were similar to those in the CON group. After glucose load, the two curves increased slowly, and the peak values postponed at 60 min. In addition, the AUCinsulin was significantly decreased in the IUGR + H + H group compared with the CON, N + H + H and IUGR + L + H groups (all P<0.05). For ITT (Fig. 2E and F), KITT in the IUGR + L + H group were lower than that in the CON group (0.97±0.38 vs. 2.38±0.47%/min, P<0.05).
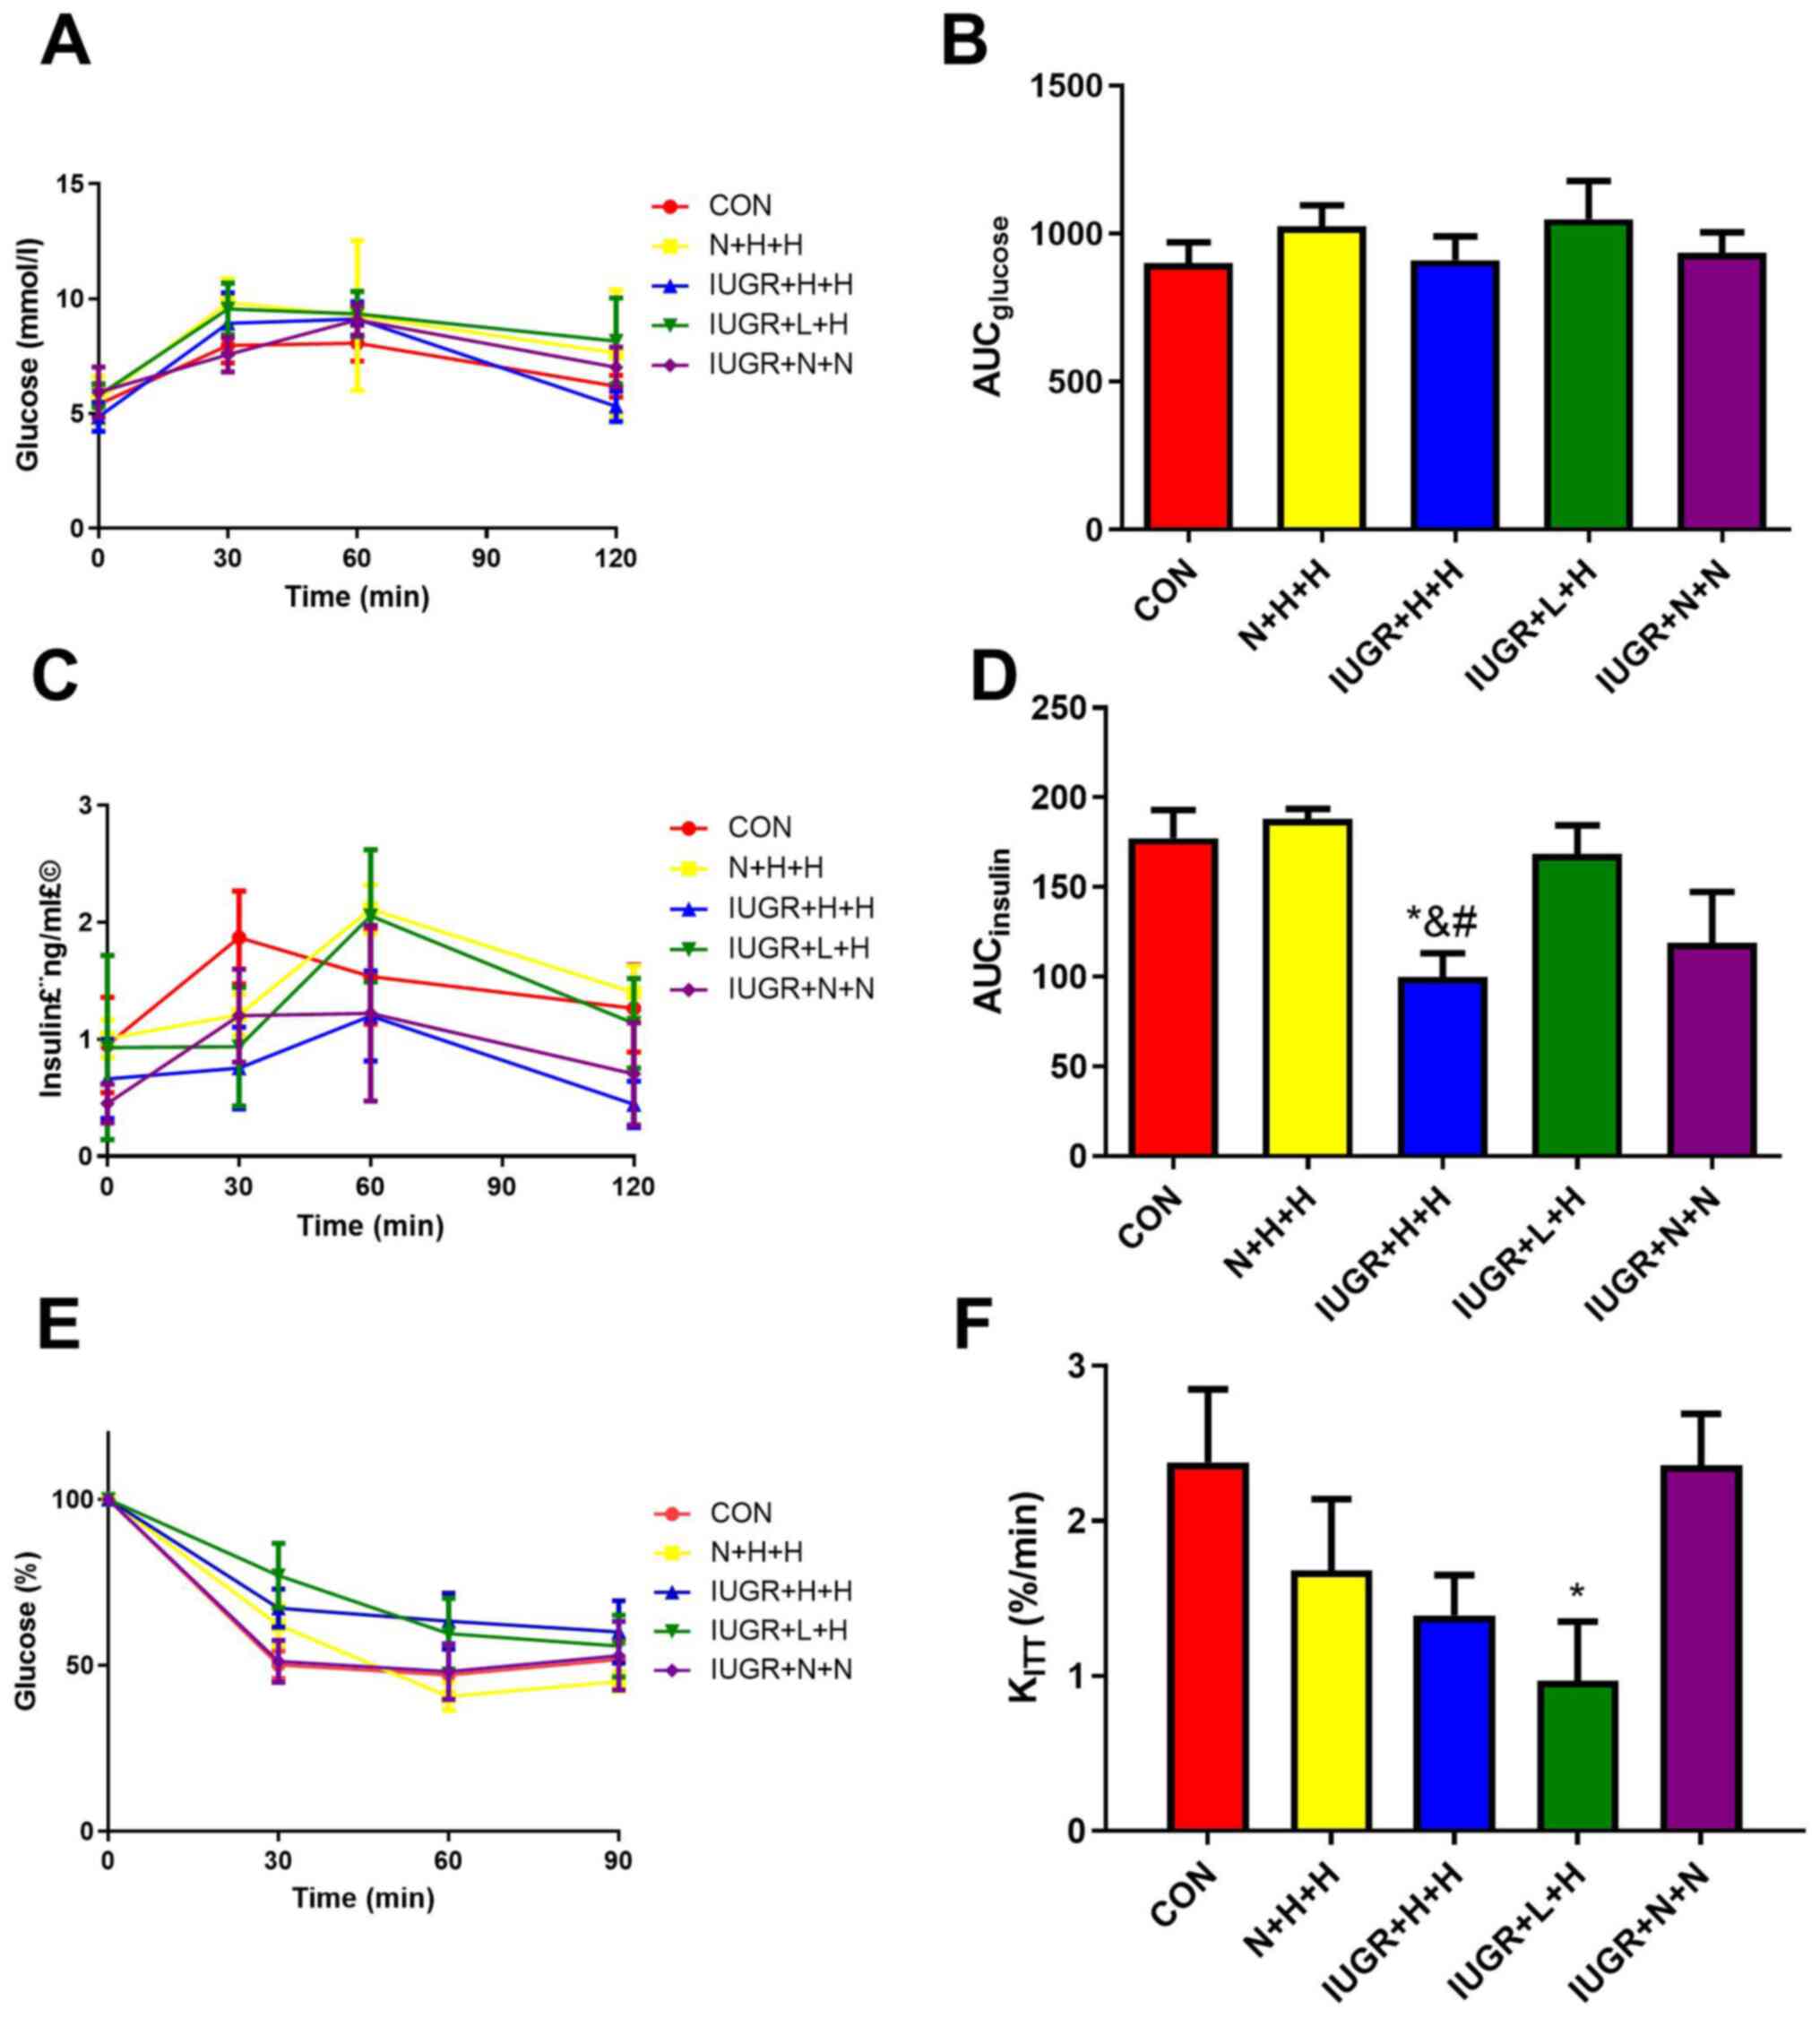 |
Figure 2
OGTT, IRT and ITT in different groups of rats. (A) Glucose levels over 120 min after the OGTT. (B) AUCglucose during the OGTT. (C) Insulin levels over 120 min after the IRT. (D) AUCinsulin during the IRT. (E) Rate of glucose reduction over 90 min after the ITT. (F) Rate of glucose reduction from 0-30 min after the ITT. KITT was calculated based on the linear regression of the blood glucose concentrations obtained from 0 to 30 min of the test. *P<0.05 vs. CON; &P<0.05 vs. N + H + H; #P<0.05 vs. IUGR + L + H. OGTT, oral glucose tolerance test; IRT, insulin release test; ITT, insulin tolerance test; AUC, area under curve; CON, non-IUGR rats receiving a normal diet during lactation and after weaning; N + H + H, non-IUGR rats receiving high-fat diet during lactation and after weaning; IUGR + H + H, IUGR rats receiving a high-fat diet during lactation and after weaning; IUGR + L + H, IUGR rats receiving a low-protein diet during lactation and a high-fat diet after weaning; IUGR + N + N, IUGR rats receiving a normal diet during lactation and after weaning; IUGR, intrauterine growth retardation.
|
Serum lipids
In the IUGR + L + H group, HDL levels were significantly decreased (P<0.05) compared with the CON and IUGR + N + N groups. TG/HDL was considered to be an indirect index for evaluating IR. Compared with the other four groups, the ratio of TG/HDL in the IUGR + L + H group was significantly increased (P<0.05; Fig. 3).
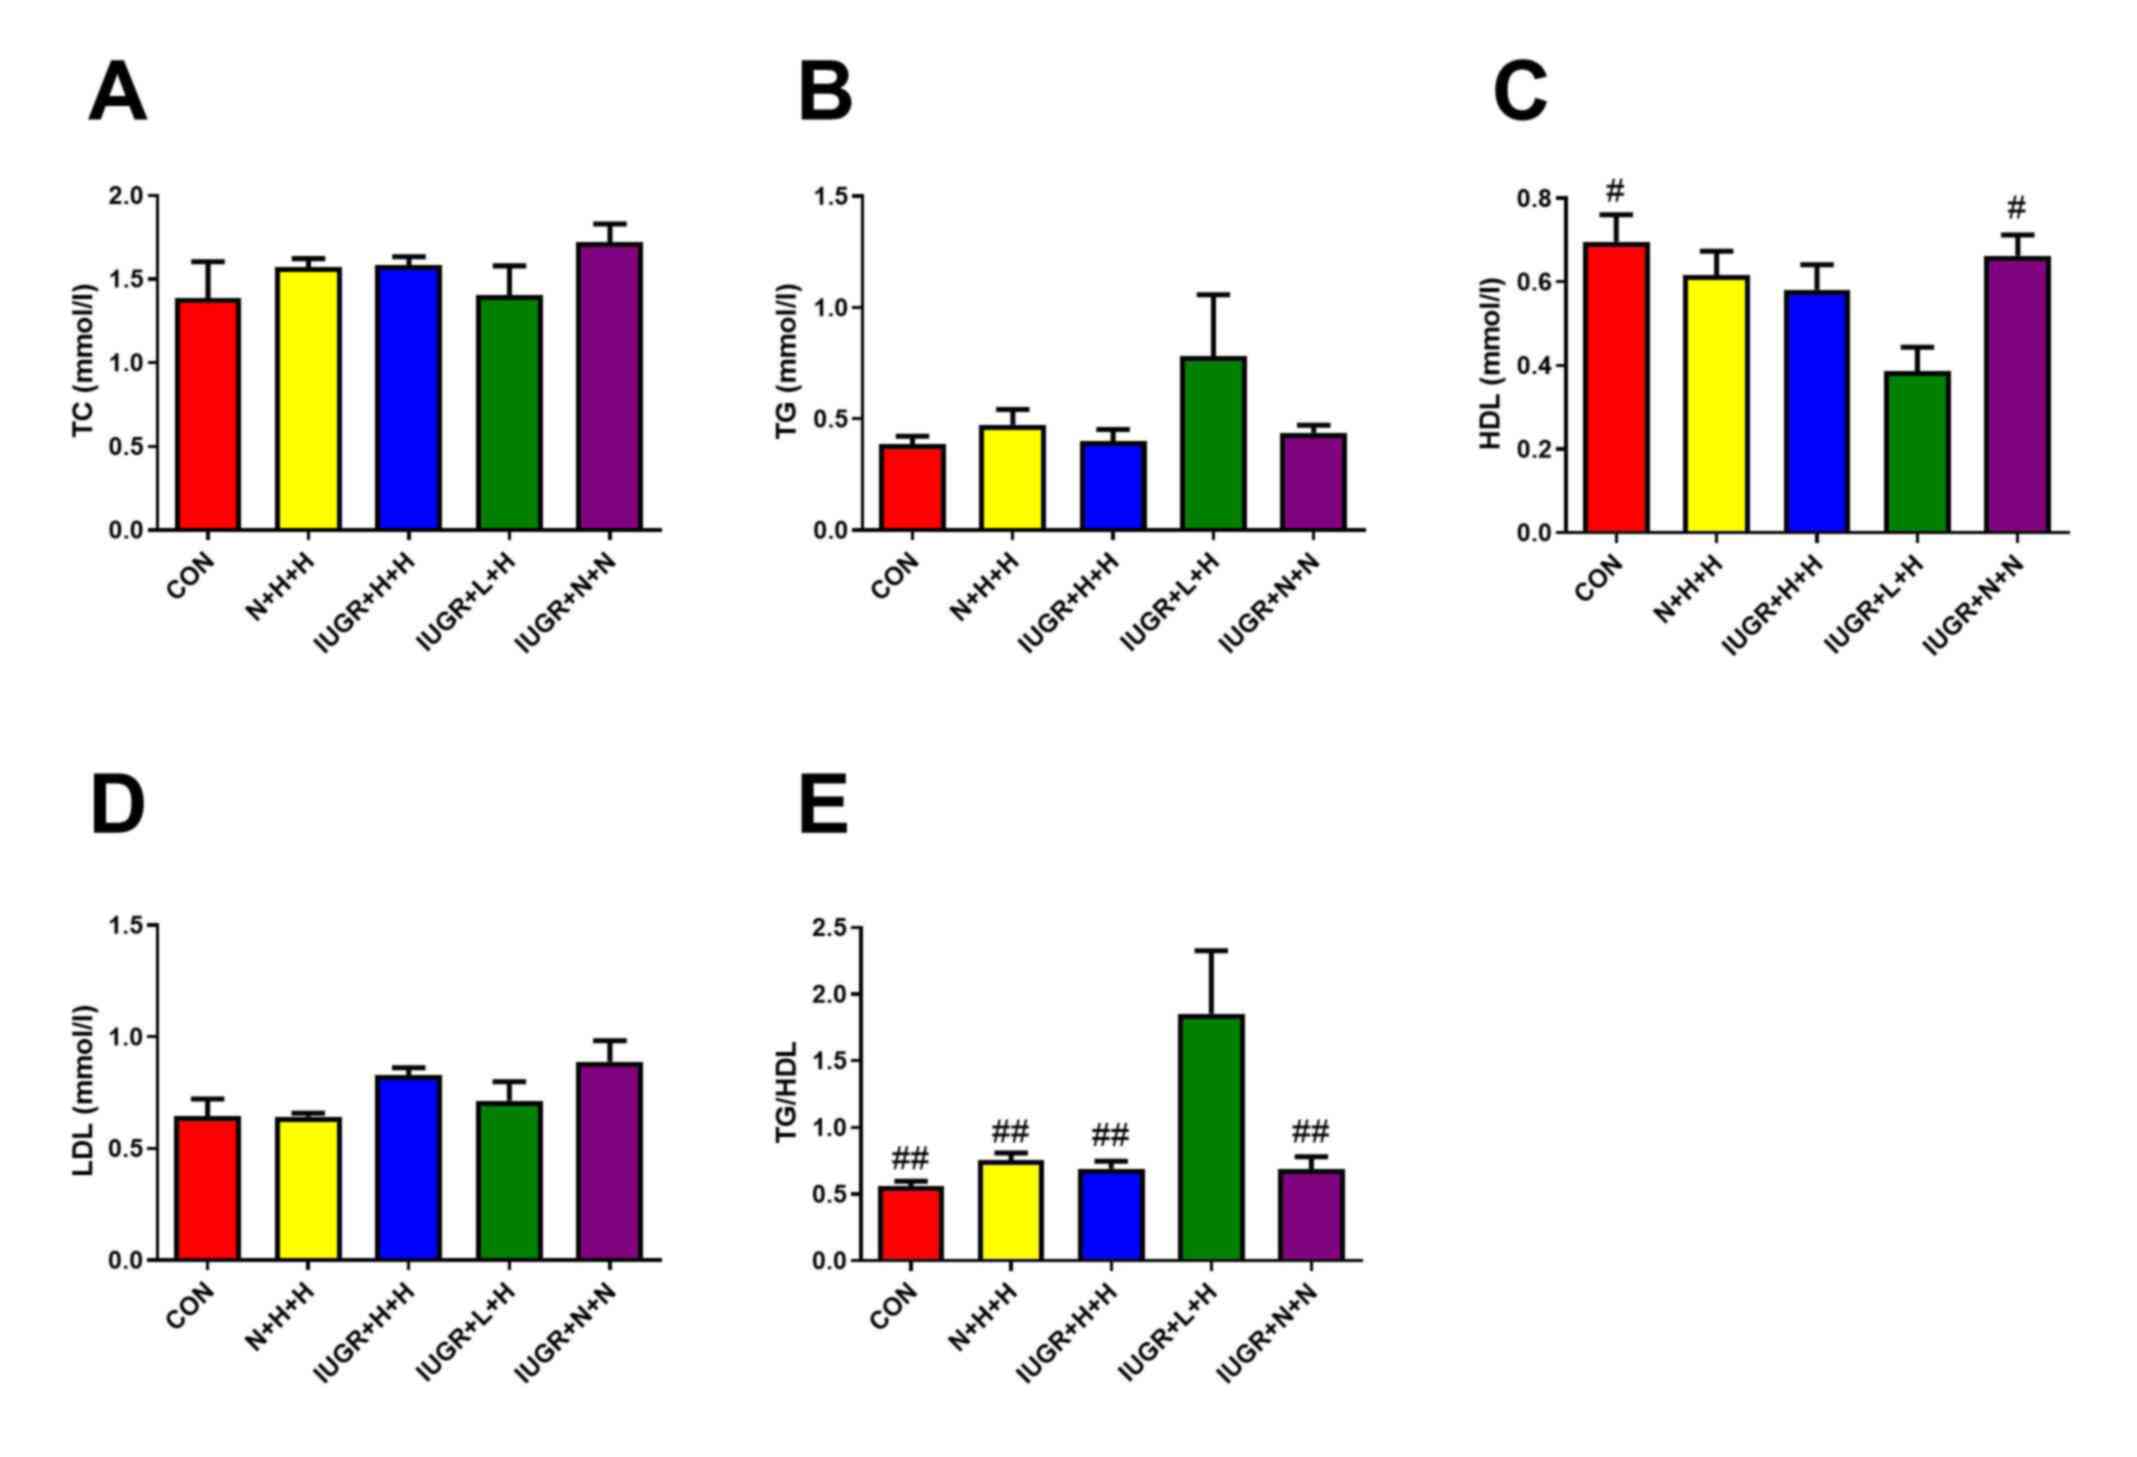 |
Figure 3
Serum lipid levels in different groups of rats. Serum (A) TC, (B) TG, (C) HDL and (D) LDL levels in different groups of rats. (E) Ratio of TG/HDL in different groups of rats. #P<0.05, ##P<0.01 vs. IUGR + L + H. TC, total cholesterol; TG, triglyceride; HDL, high-density lipoprotein; LDL, low-density lipoprotein; CON, non-IUGR rats receiving a normal diet during lactation and after weaning; N + H + H, non-IUGR rats receiving high-fat diet during lactation and after weaning; IUGR + H + H, IUGR rats receiving a high-fat diet during lactation and after weaning; IUGR + L + H, IUGR rats receiving a low-protein diet during lactation and a high-fat diet after weaning; IUGR + N + N, IUGR rats receiving a normal diet during lactation and after weaning; IUGR, intrauterine growth retardation.
|
Adipokines
Serum leptin and adipose tissue IL-6 levels in the N + H + H and IUGR + L + H groups were significantly higher than those in the other three groups (P<0.05). Compared with the CON group, the other four groups exhibited lower serum adiponectin levels (P<0.01), but markedly higher MCP-1 and TNF-α levels (Fig. 4).
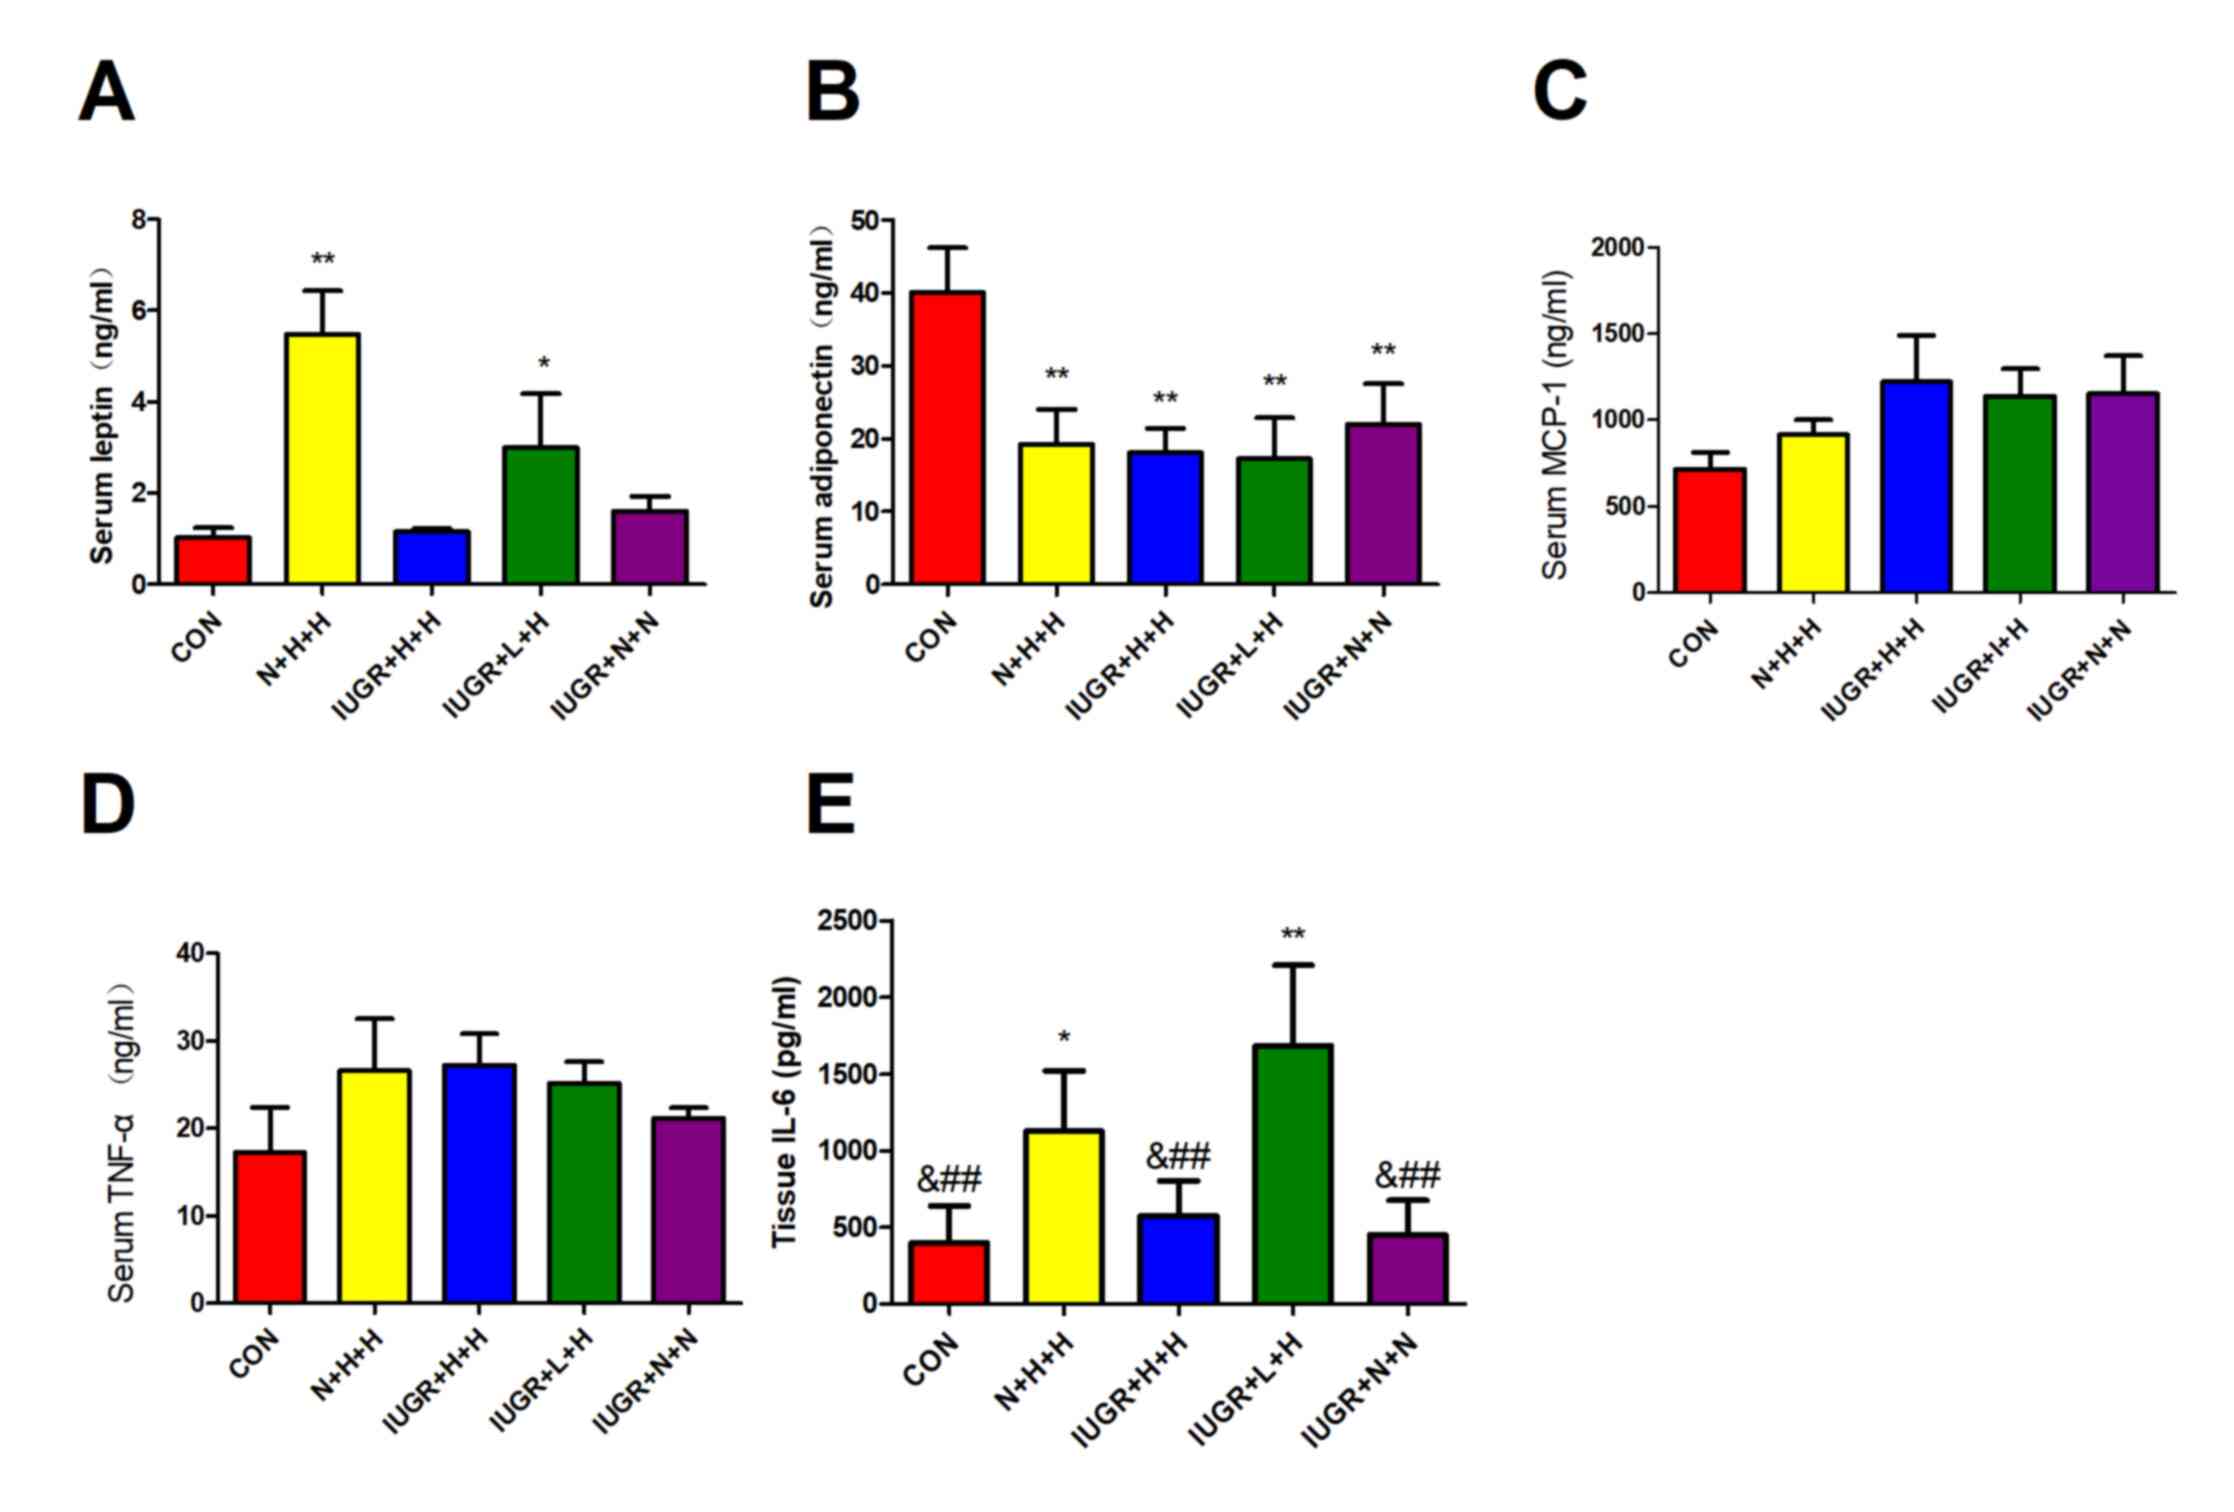 |
Figure 4
Leptin, adiponectin, MCP-1, and TNF-α levels in serum, and IL-6 levels in adipose tissue. Serum (A) leptin, (B) adiponectin, (C) MCP-1 and (D) TNF-α, and (E) adipose tissue IL-6 levels in different groups of rats. *P<0.05, **P<0.01 vs. CON; &P<0.05 vs. N + H + H; ##P<0.01 vs. IUGR + L + H. MCP-1, monocyte chemoattractant protein 1; TNF-α, tumor necrosis factor-α; IL-6, interleukin-6; CON, non-IUGR rats receiving a normal diet during lactation and after weaning; N + H + H, non-IUGR rats receiving high-fat diet during lactation and after weaning; IUGR + H + H, IUGR rats receiving a high-fat diet during lactation and after weaning; IUGR + L + H, IUGR rats receiving a low-protein diet during lactation and a high-fat diet after weaning; IUGR + N + N, IUGR rats receiving a normal diet during lactation and after weaning; IUGR, intrauterine growth retardation.
|
Adipocyte morphology and mast cell infiltration
Adipocyte morphology was observed via H&E staining (Fig. 5A) and the mast cell infiltration state of abdominal adipose tissue was observed via toluidine blue staining (Fig. 5C). The results revealed that the adipocyte diameter in the N + H + H (31.30±2.23 µm), IUGR + L + H (31.22±2.50 µm) and IUGR + N + N (27.66±6.08 µm) groups were significantly larger compared with the CON group (23.56±1.71 µm) (P<0.01), but not in the IUGR + H + H group (26.38±2.42 µm) (Fig. 5B). The density of mast cells in the adipose tissue was increased in the other four groups, compared with the CON group (Fig. 5D).
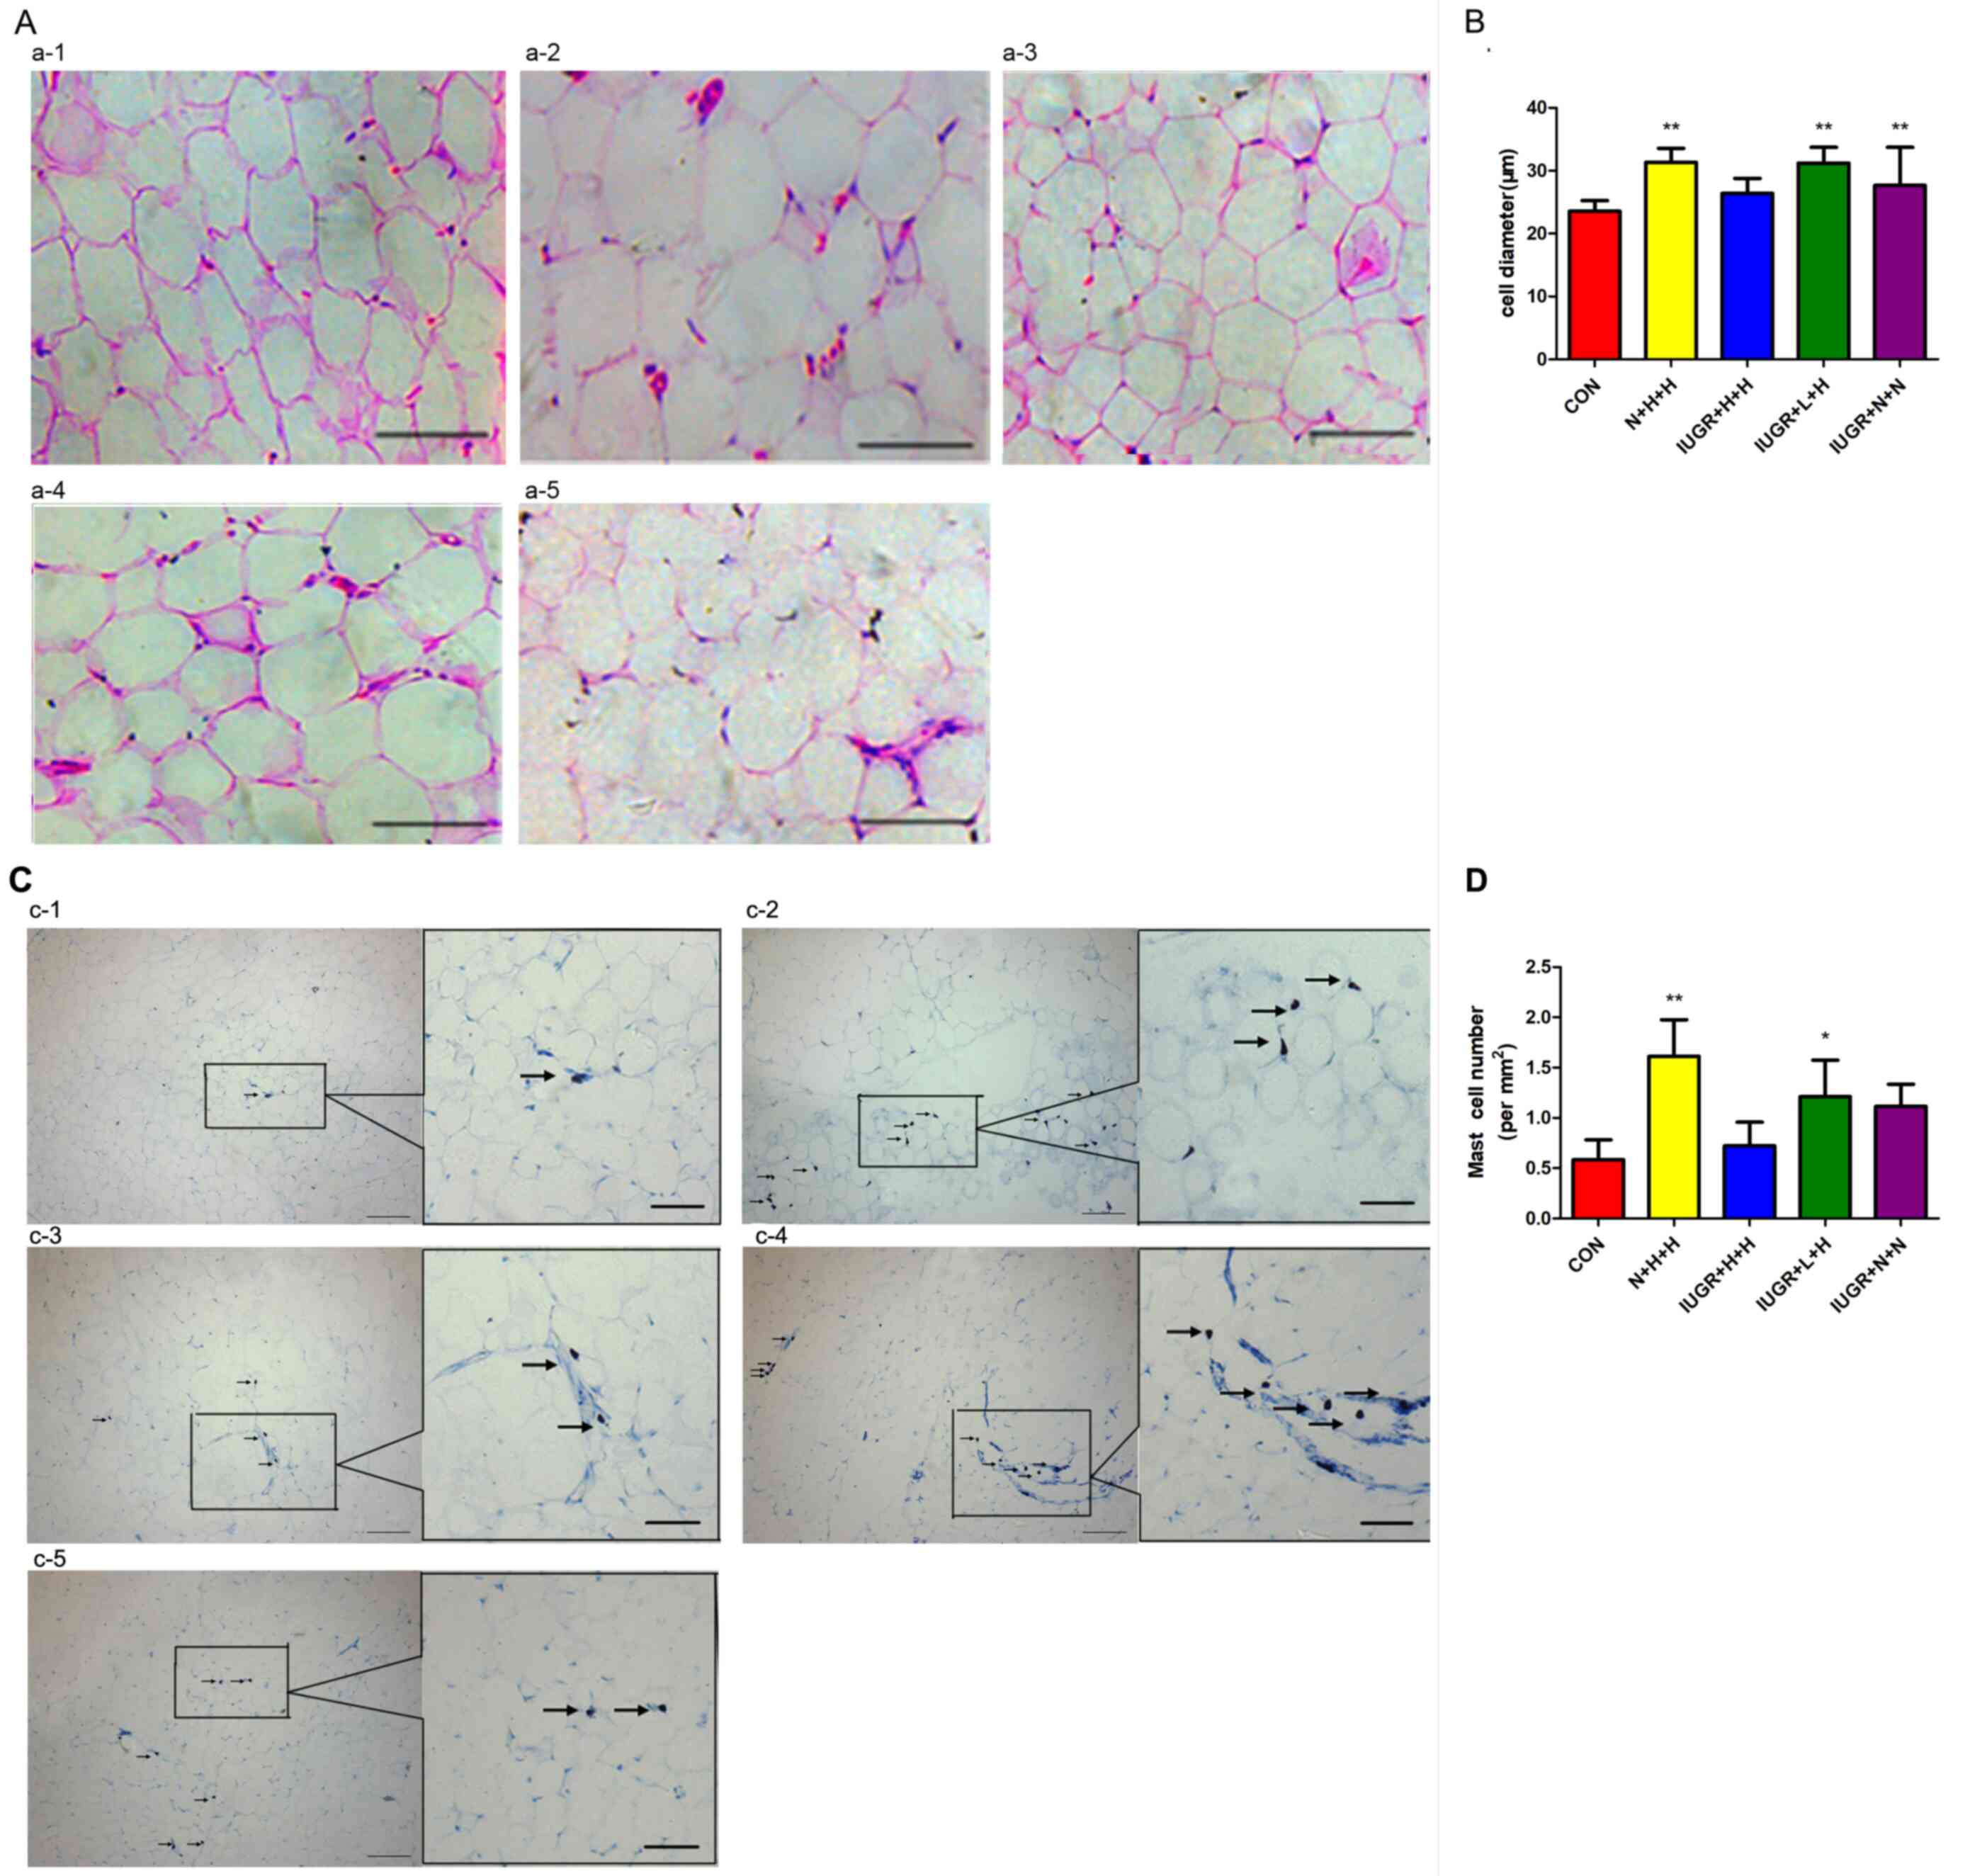 |
Figure 5
H&E staining of abdominal adipocytes and Toluidine blue staining of mast cells in different groups of rats. (A) H&E staining of abdominal adipocytes in the (A-a) CON, (A-b) N + H + H, (A-c) IUGR + H + H, (A-d) IUGR + L + H and (A-e) IUGR + N + N groups. Scale bars, 50 µm. (B) Diameter of abdominal adipocyte in rats. Diameter of peri-abdominal adipocytes in N + H + H, IUGR + L + H and IUGR + N + N groups larger than CON group. (C) Toluidine blue staining of mast cells in the (B-a) CON, (B-b) N + H + H, (B-c) IUGR + H + H, (B-d) IUGR + L + H and (B-e) IUGR + N + N groups. Arrows indicate mast cells. Scale bars, 100 µm (magnification x100) and 50 µm (magnification x200). (D) The quantification of the numbers of mast cells of rats. There were more mast cells in the N + H + H and IUGR + L + H groups than those in the CON group. *P<0.05, **P<0.01 vs. CON; H&E, hematoxylin and eosin; CON, non-IUGR rats receiving a normal diet during lactation and after weaning; N + H + H, non-IUGR rats receiving high-fat diet during lactation and after weaning; IUGR + H + H, IUGR rats receiving a high-fat diet during lactation and after weaning; IUGR + L + H, IUGR rats receiving a low-protein diet during lactation and a high-fat diet after weaning; IUGR + N + N, IUGR rats receiving a normal diet during lactation and after weaning; IUGR, intrauterine growth retardation.
|
Discussion
The present study investigated the effects and underlying mechanisms of different diet patterns during lactation and/or after weaning on glucose and lipid metabolism. Epidemiological studies have reported that individuals with IUGR exhibit postnatal catch-up growth in order to compensate for intrauterine growth deficiency (15,16). Animal experiments have also indicated that IUGR rats undergoing postnatal catch-up growth do not exhibit balanced growth of all tissues and organs, but a disproportionate increase in body fat (17). In the present study, the N + H + H group exhibited the highest body weight at the end of week 12. Based on the catch-up growth, the subgroups of IUGR individuals exhibited similar body weight compared with CON group. Moreover, the abdominal adipose and weight of the peritoneal adipose tissues were significantly increased in the IUGR + L + H group but not in the IUGR + N + N and IUGR + H + H groups, indicating that central obesity was observed in the IUGR + L + H group. Bieswal et al (18) suggested that maternal overfeeding during lactation may lead to central obesity in the later stages of IUGR rat development. The results of the present study, however, were inconsistent with this hypothesis: The IUGR + L + H group demonstrated that catch-up growth resulting from maternal malnutrition during pregnancy and lactation aggravated obesity and abnormal body adipose distribution. Osmond et al (19) speculated that individuals with IUGR have decreased muscle and visceral tissue and conserve adipose tissue to use as an energy supply during periods of limited nutritional resources. Despite this, adaptive changes may cause programmed adipocyte development and abnormal proliferation, increasing the risk of IR and obesity.
Children with IUGR exhibit decreased insulin sensitivity and varying degrees of IR (20,21). Cianfarani et al (22,23) proposed that catch-up growth leads to IR. A number of studies (24,25) have noted that an adverse intrauterine environment leads to epigenetic changes in fetuses with IUGR. This may cause an imbalance in the apoptotic rate, and neogenesis may decrease the number of pancreatic islet β cells, while islet vascularization and mitochondrial dysfunction result in the impairment of islet β cell function (26).
The present study observed abnormal insulin release in the N + H + H and IUGR + L + H groups. This reflected a slow rise in the insulin secretion curve following glucose stimulation, and the peak value occured behind the CON group. In addition, insulin sensitivity was decreased in IUGR + L + H group, as shown by the ITT results. In the IUGR + H + H group, insulin secretion was significantly decreased and delayed following glucose loading compared with CON group. The OGTT, IRT and ITT result in the IUGR + N + N group were similar to those in the CON group, and no significant differences were found. This suggested that different postnatal dietary and nutritional patterns have different effects on postpartum glycometabolism in IUGR. Maternal malnutrition during pregnancy and/or lactation or overfeeding offspring during weaning aggravates glycometabolic disorder.
Rueda-Clausen et al (26) demonstrated that fasting plasma TG and free fatty acid levels were increased in rats with hypoxia-induced IUGR male rats that were fed a high-fat diet. Zambrano et al (10) observed that male offspring with maternal malnutrition during pregnancy and normal diet during lactation exhibited significantly increased serum TG levels in adulthood. However, if offspring were fed a normal diet during weaning, the serum lipid levels were decreased in adulthood. In the present study, the levels of TG, TC, LDL and HDL in the plasma of the IUGR + N + N group exhibited abnormal trends, but these were not significant when compared with the CON group. The levels of HDL in the IUGR + L + H group decreased significantly, whereas the ratio of TG/HDL increased significantly compared with the CON group. Nutritional restriction in IUGR rats during lactation and subsequent dietary intervention following weaning may have distinct effects on lipid metabolism in adults. This may explain the abnormal insulin release and increased inflammatory factor levels in the IUGR + H + H group, but there was no notable difference in blood lipid levels, which may be due to the short research cycle and small sample size of the experimental groups.
It was also hypothesized that IUGR rats exhibited hyperleptinemia during catch-up growth following persistent malnutrition during pregnancy and lactation (i.e. leptin resistance occurred), and that leptin resistance was associated with abnormal distribution of body fat and obesity in the IUGR + L + H group. This group exhibited more notable glucose and lipid metabolism disorder, as evidenced by abdominal obesity and leptin resistance. It is hypothesized that reduced adiponectin levels may result in different degrees of abnormal glucose metabolism and IR in IUGR rats.
The increased adipocytic levels of IL-6 in the N + H + H and IUGR + L + H groups, indicated both systemic and local inflammatory states in IUGR + L + H rats, which was partly consistent with a previous study (27). This was consistent with histological changes, such as lipid accumulation and inflammatory cell infiltration in the abdominal adipose tissues of IUGR rats, observed in the present study. Abnormal changes in adipokine levels may also cause glycolipid metabolism disorders in IUGR rats with catch-up growth via biological effects such as blocking insulin signal transduction, causing lipolysis, increasing free fatty acids, and promoting systemic or local inflammatory infiltration (28), particularly in IUGR rats with persistent maternal malnutrition during pregnancy and lactation.
Adipocyte hypertrophy serves a key role in obesity-associated chronic low-grade inflammation, hyperlipidemia, insulin and glucose disorders, as well as cardiovascular diseases (29,30). Mast cells are inflammatory cells that are found in addition to macrophages in adipose tissue and are associated with obesity and diabetes (31). In the present study, the N + H + H and IUGR + L + H groups exhibited significantly different histological features, including increased diameter of peri-abdominal adipocytes with varied sizes and an increase in infiltration of inflammatory cells, such as mast cells. The changes in insulin sensitivity, blood lipid levels and adipokines in the aforementioned two groups were also shown to be significant. This suggested that peri-abdominal adipocyte hypertrophy, adipocyte lipid accumulation and adipose tissue inflammatory cell infiltration may be associated with glucose and lipid metabolism disorders in IUGR rats.
Catch-up growth can occur at any stage of individual growth, including infancy, childhood and adolescence, and the fetal and infancy stages are key in terms of adipose-free body weight growth (32). Different dietary patterns during these specific growth windows may aggravate or improve the disorder of glycolipid metabolism in IUGR offspring (33,34). The results of the present study may provide insight into the effects of different postnatal dietary patterns on individuals with IUGR. Further investigation is required to determine how individuals with IUGR can achieve catch-up growth via a dietary and nutritional model without increasing the risk of diseases such as glucose and lipid metabolism disorders.
In summary, a maternal low-protein diet during pregnancy induced IUGR in rat offspring. Male IUGR rats undergoing catch-up growth induced by different dietary patterns during lactation and/or after weaning exhibited different degrees of obesity, impaired glucose metabolism, dyslipidemia and lipodystrophy. In particular, maternal malnutrition during pregnancy and lactation may aggravate the aforementioned situation in adult rats.
Supplementary Material
Dietary composition of each group.
Acknowledgements
Not applicable.
Funding
The present study was supported by a grant from National Natural Science Foundation of China (grant no. 81170711).
Availability of data and materials
The datasets used and/or analyzed during the current study are available from the corresponding author on reasonable request.
Authors' contributions
YW contributed to study design and data collection. GY contributed to study design and data analysis. PW performed the experiments. ZH and SL contributed to data analysis and writing of the manuscript. All authors reviewed and revised the manuscript. All authors read and approved the final manuscript.
Ethics approval and consent to participate
The present study was approved by the Animal Ethics Committee of Shantou University Medical College (approval no. SUMC2012-159).
Patient consent for publication
Not applicable.
Competing interests
The authors declare that they have no competing interests.
References
|
1
|
Ramírez-Vélez R, Correa-Bautista JE, Villa-González E, Martínez-Torres J, Hackney AC and García-Hermoso A: Effects of preterm birth and fetal growth retardation on life-course cardiovascular risk factors among schoolchildren from Colombia: The FUPRECOL study. Early Hum Dev. 106-107:53–58. 2017.PubMed/NCBI View Article : Google Scholar
|
|
2
|
Li Y, Jaddoe VW, Qi L, He Y, Wang D, Lai J, Zhang J, Fu P, Yang X and Hu FB: Exposure to the chinese famine in early life and the risk of metabolic syndrome in adulthood. Diabetes Care. 34:1014–1018. 2011.PubMed/NCBI View Article : Google Scholar
|
|
3
|
Salam RA, Das JK and Bhutta ZA: Impact of intrauterine growth restriction on long-term health. Curr OpinClin Nutr Metab Care. 17:249–254. 2014.PubMed/NCBI View Article : Google Scholar
|
|
4
|
Baird J, Fisher D, Lucas P, Kleijen J, Roberts H and Law C: Being big or growing fast: Systematic review of size and growth in infancy and later obesity. BMJ. 331(929)2005.PubMed/NCBI View Article : Google Scholar
|
|
5
|
Hales CN, Barker DJ, Clark PM, Cox LJ, Fall C, Osmond C and Winter PD: Fetal and infant growth and impaired glucose tolerance at age 64. BMJ. 303:1019–1022. 1991.PubMed/NCBI View Article : Google Scholar
|
|
6
|
Dulloo A..Jacquet J..Seydoux J and Montani J-P: The thrifty ‘catch-up fat’ phenotype: Its impact on insulin sensitivity during growth trajectories to obesity and metabolic syndrome. Int J Obes (Lond). 30 (Suppl):S23–S35. 2006.PubMed/NCBI View Article : Google Scholar
|
|
7
|
Li Y, He Y, Qi L, Jaddoe VW, Feskens EJ, Yang X, Ma G and Hu FB: Exposure to the Chinese famine in early life and the risk of hyperglycemia and type 2 diabetes in adulthood. Diabetes. 59:2400–2406. 2010.PubMed/NCBI View Article : Google Scholar
|
|
8
|
Singhal A and Lucas A: Early origins of cardiovascular disease: Is there a unifying hypothesis? Lancet. 363:1642–1645. 2004.PubMed/NCBI View Article : Google Scholar
|
|
9
|
Garg M, Thamotharan M, Dai Y, Thamotharan S, Shin BC, Stout D and Devaskar SU: Early postnatal caloric restriction protects adult male intrauterine growth-restricted offspring from obesity. Diabetes. 61:1391–1398. 2012.PubMed/NCBI View Article : Google Scholar
|
|
10
|
Zambrano E, Bautista CJ, Deás M, Martínez-Samayoa PM, González-Zamorano M, Ledesma H, Morales J, Larrea F and Nathanielsz PW: A low maternal protein diet during pregnancy and lactation has sex- and window of exposure-specific effects on offspring growth and food intake, glucose metabolism and serum leptin in the rat. J Physiol. 571:221–230. 2006.PubMed/NCBI View Article : Google Scholar
|
|
11
|
Rochlani Y, Pothineni NV and Mehta JL: Metabolic syndrome: Does it differ between women and men? Cardiovasc Drugs Ther. 29:329–338. 2015.PubMed/NCBI View Article : Google Scholar
|
|
12
|
Amengual-Cladera E, Lladó I, Gianotti M and Proenza AM: Sex differences in the effect of high-fat diet feeding on rat white adipose tissue mitochondrial function and insulin sensitivity. Metabolism. 61:1108–1117. 2012.PubMed/NCBI View Article : Google Scholar
|
|
13
|
Phillips DI, Clark PM, Hales CN and Osmond C: Understanding oral glucose tolerance: Comparison of glucose or insulin measurements during the oral glucose tolerance test with specific measurements of insulin resistance and insulin secretion. Diabet Med. 11:286–292. 1994.PubMed/NCBI View Article : Google Scholar
|
|
14
|
Bunyan J, Murrell EA and Shah PP: The induction of obesity in rodents by means of monosidium glutamate. Br J Nutr. 35:25–39. 1976.PubMed/NCBI View Article : Google Scholar
|
|
15
|
Mai XM, Gäddlin PO, Nilsson L and Leijon I: Early rapid weight gain and current overweight in relation to asthma in adolescents born with very low birth weight. Pediatr Allergy Immunol. 16:380–385. 2005.PubMed/NCBI View Article : Google Scholar
|
|
16
|
Remacle C, Bieswal F, Bol V and Reusens B: Developmental programming of adult obesity and cardiovascular disease in rodents by maternal nutrition imbalance. Am J Clin Nutr. 94 (6 Suppl):1846S–1852S. 2011.PubMed/NCBI View Article : Google Scholar
|
|
17
|
De Blasio MJ, Gatford KL, Robinson JS and Owens JA: Placental restriction of fetal growth reduces size at birth and alters postnatal growth, feeding activity, and adiposity in the young lamb. Am J Physiol Regul Integr Comp Physiol. 292:R875–R886. 2007.PubMed/NCBI View Article : Google Scholar
|
|
18
|
Bieswal F, Ahn MT, Reusens B, Holvoet P, Raes M, Rees WD and Remacle C: The importance of catch-up growth after early malnutrition for the programming of obesity in male rat. Obesity (Silver Spring). 14:1330–1343. 2006.PubMed/NCBI View Article : Google Scholar
|
|
19
|
Osmond C and Barker DJ: Fetal, infant, and childhood growth are predictors of coronary heart disease, diabetes, and hypertension in adult men and women. Environ Health Perspect. 108:545–553. 2000.PubMed/NCBI View Article : Google Scholar
|
|
20
|
Veening MA, Van Weissenbruch MM and De Waal HA: Glucose tolerance, insulin sensitivity, and insulin secretion in children born small for gestational age. J Clin Endocrinol Metab. 87:4657–4661. 2002.PubMed/NCBI View Article : Google Scholar
|
|
21
|
Boehmer BH, Limesand SW and Rozance PJ: The impact of IUGR on pancreatic islet development and beta-cell function. J Endocrinol. 235:R63–R76. 2017.PubMed/NCBI View Article : Google Scholar
|
|
22
|
Cianfarani S, Germani D and Branca F: Low birthweight and adult insulin resistance: The ‘Catch-up Growth’ hypothesis. Arch Dis Child Fetal Neonatal Ed. 81:F71–F73. 1999.PubMed/NCBI View Article : Google Scholar
|
|
23
|
Cianfarani S, Geremia C, Germani D, Scirè G, Maiorana A and Boemi S: Insulin resistance and insulin-like growth factors in children with intrauterine growth retardation. Is catch-up growth a risk factor? Horm Res. 55:7–10. 2001.PubMed/NCBI View Article : Google Scholar
|
|
24
|
Gatford KL and Simmons RA: Prenatal programming of insulin secretion in intrauterine growth restriction. Clin Obstet Gynecol. 56:520–528. 2013.PubMed/NCBI View Article : Google Scholar
|
|
25
|
Mohan R, Baumann D and Alejandro EU: Fetal undernutrition, placental insufficiency, and pancreatic beta-cell development programming in utero. Am J Physiol Regul Integr Comp Physiol. 315:R867–R878. 2018.PubMed/NCBI View Article : Google Scholar
|
|
26
|
Rueda-Clausen CF, Dolinsky VW, Morton JS, Proctor SD, Dyck JR and Davidge ST: Hypoxia-Induced intrauterine growth restriction increases the susceptibility of rats to high-fat diet-induced metabolic syndrome. Diabetes. 60:507–516. 2011.PubMed/NCBI View Article : Google Scholar
|
|
27
|
Ortiz-Espejo M, Pérez-Navero JL, Olza-Meneses J, Muñoz-Villanueva MC, Aguilera-García CM and Gil-Campos M: Prepubertal children with a history of extra-uterine growth restriction exhibit low-grade inflammation. Br J Nutr. 112:338–346. 2014.PubMed/NCBI View Article : Google Scholar
|
|
28
|
Maiorana A, Del Bianco C and Cianfarani S: Adipose tissue: A metabolic regulator. Potential implications for the metabolic outcome of subjects born small for gestational age (SGA). Rev Diabet Stud. 4:134–146. 2007.PubMed/NCBI View Article : Google Scholar
|
|
29
|
Blüher M: Clinical relevance of adipokines. Diabetes Metab J. 36:317–327. 2012.PubMed/NCBI View Article : Google Scholar
|
|
30
|
Hoffstedt J, Arner E, Wahrenberg H, Andersson DP, Qvisth V, Löfgren P, Rydén M, Thörne A, Wirén M, Palmér M, et al: Regional impact of adipose tissue morphology on the metabolic profile in morbid obesity. Diabetologia. 53:2496–2503. 2010.PubMed/NCBI View Article : Google Scholar
|
|
31
|
Liu J, Divoux A, Sun J, Zhang J, Clément K, Glickman JN, Sukhova GK, Wolters PJ, Du J, Gorgun CZ, et al: Genetic deficiency and pharmacological stabilization of mast cells reduce diet-induced obesity and diabetes in mice. Nat Med. 15:940–945. 2009.PubMed/NCBI View Article : Google Scholar
|
|
32
|
Wells JC: The programming effects of early growth. Early Hum Dev. 83:743–748. 2007.PubMed/NCBI View Article : Google Scholar
|
|
33
|
Jain V and Singhal A: Catch up growth in low birth weight infants: Striking a healthy balance. Rev Endocr Metab Disord. 13:141–147. 2012.PubMed/NCBI View Article : Google Scholar
|
|
34
|
Ong KK, Kennedy K, Castañeda-Gutiérrez E, Forsyth S, Godfrey KM, Koletzko B, Latulippe ME, Ozanne SE, Rueda R, Schoemaker MH, et al: Postnatal growth in preterm infants and later health outcomes: A systematic review. Acta Paediatr. 104:974–986. 2015.PubMed/NCBI View Article : Google Scholar
|


