Introduction
Triptolide (TP) is one of the main monomer
constituents that can be derived from Tripterygium wilfordii
(1). Previous clinical studies have
shown that TP has significant anti-inflammatory and
immunosuppressive activities, and it has been widely used in the
treatment of rheumatoid arthritis (RA) in China (2-4).
However, TP is also toxic in humans, and its multiorgan toxicity
prevents further application in clinical practice (5). The development of external TP
preparations has become more efficient, and percutaneously
administered TP has been efficacious in the treatment of RA
(6-8).
However, our previous study revealed that transdermal
administration of TP can produce specific toxicities in the skin
(9).
Ferulic acid (FA) is a type of phenolic acid with
medicinal values and is found in plant tissues (10). FA is a primary component of the
traditional Chinese medicinal herbs Angelica sinensis and
Ligusticum chuanxiong FA, and has been suggested to possess
anti-inflammatory and antioxidative pharmacological activities,
which contribute to its therapeutic effect on RA (11,12).
Previous studies have shown that TP and FA (TP + FA) can be
combined due to their component compatibility (13-15).
Additionally, our previous study performed pharmacodynamic and
toxicological experiments in a type II collagen-induced arthritis
rat model and showed that the combination of TP + FA exerts
significant anti-inflammatory effects and reduces skin irritation
(data not published). However, to the best of our knowledge, the
underlying mechanisms of TP + FA treatment in decreasing skin
irritation have not been previously investigated. Oxidative stress
can cause many diseases, and it is closely related to cell
dysfunction, membrane structure, protein production, DNA changes
and other cellular functions (16-18).
Moreover, oxidative stress can result in loss of skin cells and
degradation of the extracellular matrix (16-18).
Cytochrome P450 (CYP) enzymes are important for controlling the
normal physiological function and homeostasis of the internal
environment of the skin. Moreover, CYP enzymes maintain the
integrity and barrier role of the epidermis via biotransformation
of exogenous and endogenous substances (19,20).
HaCaT cells are a cultured human keratinocyte cell
line. The culture method for maintaining HaCaT cells is simple, and
these cells can proliferate indefinitely (21). In addition, HaCaT cells exhibit
similarities to primary keratinocyte cells in the activity of
drug-metabolizing enzymes (22). In
the present study HaCaT cells were cultured in vitro as a
model of an active epidermis with the aim to investigate the
underlying mechanisms of FA in reducing skin toxicity in relation
to metabolism and oxidative damage to skin. The aim of the present
study was to provide a theoretical basis for the potential clinical
application and development of external TP preparations.
Materials and methods
Materials and reagents
HaCaT cells (cat. no. ZQ0044) were supplied by
Shanghai Zhongqiao Biotechnology Co., Ltd. TP (purity >98%) and
FA (purity >98%) were purchased from Chengdu Pufei De Biotech
Co., Ltd. Chlorzoxazol, testosterone and fenacetin were provided by
Chengdu Derrick Biotechnology Co., Ltd. Reactive oxygen species
(ROS, cat. no. 20180815), glutathione (GSH, cat. no. 20180721),
malondialdehyde (MDA, cat. no. 20180730), superoxide dismutase
(SOD, cat. no. 20180721) and catalase (CAT, cat. no. 20180811)
assay kits were obtained from Nanjing Jiancheng Bio-Engineering
Institute Co., Ltd. A nuclear factor erythroid 2-related factor 2
(Nrf2) antibody was purchased from Abcam (cat. no. Ab92946) and a
β-actin antibody (cat. no. AC026) from ABclonal Biotech Co., Ltd.
DMEM was obtained from Beijing Solarbio Science & Technology
Co., Ltd and FBS was obtained from Shanghai Jikai Ecox
Biotechnology Co., Ltd.
HaCaT cell culture
HaCaT cells were grown in DMEM (4.5 g/l glucose)
containing antibiotics (100 U/ml penicillin and 100 µg/ml
streptomycin) and supplemented with 10% FBS at 37˚C in a 5%
CO2 incubator. Medium was replaced every 2-3 days. The
7-20th generations of cells were used in subsequent experiments.
Cell density was adjusted to 1x10⁵ cells/ml. Cells were
seeded into 96-well plates to carry out MTT assays and 6-well
plates for all other experiments.
MTT assay
Cell cytotoxicity and the optimum ratio of TP to FA
was determined using an MTT assay. HaCaT cells were seeded into
96-well plates (2x10⁴ cells/well) in a complete growth
medium [High glycemic DMEM (4.5 g/l D-glucose, L-glutamine)
containing 10% fetal bovine serum, 1% double antibody (100 U/ml
penicillin, 100 g/ml streptomycin)] for 24 h, and then treated for
6 h with TP at 37˚C, FA, mixed solutions of the two drugs at
different concentrations (The concentrations of the TP groups were
19.54, 39.07, 78.13, 156.25, 312.5, 625 and 1,250 ng/ml, TP and FA
equal to 1:12.5, 1:25, 1:50, 1:100, 1:120 in the TP + FA groups,
respectively) or a control group with an equivalent volume of DMEM
to that of the experimental drugs. Cells were washed twice with
Hank's Balanced Salt Solution (HBSS) and incubated with 5 mg/ml MTT
solution for 4 h at 37˚C. The resulting formazan crystals were
dissolved in 150 µl DMSO, and optical density (OD) was measured at
490 nm using a microplate reader (MK3; Thermo Fisher Scientific,
Inc.). Cell survival rate (%) was calculated using the following
formula: [OD 490 (treatment)-OD 490 (blank)/OD 490 (control)-OD 490
(blank)] x100. OD 490 (treatment) was the mean OD value of cells
treated with the target drugs, OD 490 (control) was the mean OD
value of untreated cells and OD 490 (blank) was the mean OD value
of cells treated with HBSS. The combination ratio of TP to FA was
determined when the cell survival rate was at its highest.
Liquid chromatography-mass
spectrometry (LC-MS) method validation
The chromatographic conditions were as follows.
Solvent A was 0.1% formic acid (V/V) in water and solvent B a
gradient elution with acetonitrile. The elution conditions of
testosterone and fenacetin were as follows: 0-1 min, 70-45% A;
1-2.8 min, 45% A; 2.8-3 min, 45-70% A; 3-5 min, 70% A. The elution
conditions of chlorzoxazol and carbamazepine were as follows: 0-1.5
min, 80-25% A; 1.5-3 min, 25% A; 3-3.1 min, 25-80% A; 3.1-5.0 min,
80% A. The flow rate was 0.3 ml·min-1 and the column
temperature was 30˚C.
LC-MS conditions
A liquid chromatography-triple quadruple bar mass
spectrometer (AB SCIEX, MODEL no. QTRAAP 5500) was used.
Testosterone and fenacetin were detected in positive ion mode, and
chlorzoxazol, in negative ion mode. An electrospray ion source was
used and the ion source temperature (TEM) was 500˚C, ionized
voltage was 5,500 V, curtain gas was at 35 psi, impact gas was at 7
psi, spray gas was at 50 psi at the auxiliary heater at 50 psi. The
details of the multiple reaction monitoring transitions assessed
were as follows: The quantitative ion pairs of testosterone were
289.1/109, DP (V) 103, CE (eV) 79 (positive); the quantitative ion
pairs of fenacetin were 180.2/109.8, DP (V) 97, CE (eV) 26
(positive); the quantitative ion pairs of Internal standard
carbamazepine were 236.8/194, DP (V) 120, CE (eV) 27 (positive);
the quantitative ion pairs of chlorzoxazol were 167.9/131.9, DP (V)
-60, CE (eV) -26 (negative); and the quantitative ion pairs of
internal standard carbamazepine were 234.1/188.8, DP (V) -158, CE
(eV) -23 (negative).
Specificity
Specificity of the method for measuring
concentrations of the three probe drugs was achieved by selecting a
precursor ion and then detecting and quantifying product ions.
Specificity was evaluated by comparing the chromatogram of blank
HBSS from HaCaT cells with that of blank plasma spiked with
analytes (23), as previously
described, as well as that of HBSS samples obtained from cells
after administration of mixed probe drugs at a testosterone:
Fenacetin:Chlorzoxazol dose of 120:6:6 ng/ml after treatment for 6
h at 37˚C.
Linearity
Linearity of the developed analytical method was
investigated by analyzing the matrix-matched construction via an
internal standard approach (24),
using mixed probe drugs at a series of concentrations. Testosterone
was used at the following concentrations 480, 240, 120, 60, 30, 15,
7.5 and 3.75 ng/ml at 25˚C. Fenacetin and chlorzoxazol were used at
concentrations of 24, 12, 6, 3, 1.5, 0.75, 0.38 and 0.19 ng/ml at
room temperature. Carbamazepine (National Institutes for Food and
Drug Control; cat. no. 100142-201706) was used as an internal
standard and at concentration of 0.01 ng/ml. Taking the ratio of
the target component to the peak area of carbamazepine as the
longitudinal coordinate and the concentration as the transverse
coordinate, linear regression was performed via LC-MS analysis
(SCIEX TRIPLE QUAD 5500; SCIEX; Analyst 1.6.2 software control and
data processing system) and the standard curve was drawn with the
reciprocal of the concentration as the weighted coefficient
(25). The quantitative limit was
set to a signal-to-noise ratio of ≥10.
Accuracy and precision
In total, six replicate analyses of the quality
control (QC) samples (chlorzoxazol, testosterone and fenacetin)
were prepared at three different concentrations (the concentrations
of testosterone were 480, 120 and 30 ng/ml, and the concentrations
of fenacetin and chlorzoxazol were 24.0, 6.0 and 1.5 ng/ml,
respectively) on the same day to ensure inter-day accuracy and
precision. The ratio of the actual measured concentration to the
marked concentration was used to determine the recovery rate of the
analytical method. The present study estimated intra-day precision
by analyzing six replicate QC samples on three consecutive days.
The relative standard deviation (RSD) was used to assess precision,
and accuracy was defined as the percent ratios of the calculated
concentrations to the nominal concentrations (26).
Stability
QC samples (n=6) at three concentrations (low,
medium and high) were used to assess the freeze-thaw cycle
stabilities of the mixed probe drugs chlorzoxazol, testosterone and
fenacetin. All QC samples were stored at -80˚C and subjected to
three freeze-thaw (at room temperature) cycles, each cycle lasted
for 24 h, and the concentrations were determined using LC-MS.
Investigation of probe drug reaction
concentration and duration of treatment
The mixed probe drugs were administered to HaCaT
cells at testosterone: Fenacetin:Chlorzoxazol doses of 240:12:12,
120:6:6, 60:3:3, 30:1.5:1.5, 15:0.75:0.75 and 7.5:0.375:0.375
ng/ml. Cell survival rate (%) was calculated using the methodology
described previously.
Mixed probe drugs were added to HaCaT cells at a
density of 2x10⁵ in 6-well plates at 37˚C. Then, 150 µl
samples were collected from every group at 0, 0.5, 1, 2, 4 and 6 h,
and the substrate concentrations of each probe was determined using
the methodology described in the aforementioned description of LCMS
validation.
Determination of CYP1A2, CYP2E1 and
CYP3A4 enzymatic activities
In total, 150 µl mixed probe drug samples were
collected from each group (TP high dose, 156.25 ng/ml, TP medium
dose, 78.13 ng/ml and TP low dose, 39.07 ng/ml. TP + FA low dose,
TP 39.07 ng/ml + FA 3.907 µg/ml, TP + FA medium dose, TP 78.13
ng/ml + FA 7.813 µg/ml, and TP + FA high dose, TP 156.25 ng/ml + FA
15.625 µg/ml) of HaCaT cells after 2 h of treatment at 37˚C, and
were centrifuged at 26,400 g for 10 min at 4˚C. Then, the upper
layers of the samples were analyzed via LC-MS (AB SCIEX, TRIPLE
QUDA 5500). Testosterone and fenacetin were detected in positive
ion mode and chlorzoxazol in negative ion mode. The conditions were
electrospray ion source, ion source temperature was 500˚C.
Ionization voltage was 5,500 V, curtain gas was at 35 psi, bump gas
was at 7 psi, spray mist was at 50 psi and the auxiliary heater was
at 50 psi in scan mode for multi-reaction monitoring. The specific
methods were as described previously in this manuscript. The
activities of cytochrome P450 (CYP) enzymes CYP family 1 subfamily
A member 2 (CYP1A2), CYP2E1 and CYP3A4 were assessed using
different concentrations of fenacetin (6.0 ng/ml), chlorzoxazol
(6.0 ng/ml) and testosterone (120.0 ng/ml), respectively (27).
Measurement of intracellular ROS, GSH,
CAT, SOD and MDA
HaCaT cells were seeded into 6-well plates
(2x10⁵ cells/well) in a complete growth medium for 48 h.
Cells were treated for 6 h with TP, FA and TP + FA at different
concentrations (Table V) in DMEM at
37˚C. Generation of intracellular ROS was assessed using 10 mM
2',7'-dichlorofluorescein diacetate (DCFH-DA), a fluorescent probe,
which is converted to the highly fluorescent derivative
dichlorofluorescin via oxidation by ROS and peroxides (28). At the end of the drug action (after
6 h), the residual liquid was discarded. Cells were incubated in
the dark for 1 h at 37˚C with 1 ml DCFH-DA working solution
(DCFH-DA:HBSS, 1:500) and then resuspended in HBSS (4.5 g/l
glucose). Fluorescence was analyzed using a multifunctional enzyme
labeling instrument (Thermo Fisher Scientific, Inc.) with
excitation at 488 nm and emission at 530 nm. GSH, CAT, SOD and MDA
activities in HaCaT cells were measured using commercially
available kits following the manufacturer's instructions. Cells
were collected by centrifugation (1,530 x g at 4˚C for 10 min) and
suspended in HBSS (4.5 g/l glucose). Cells were then broken by
ultrasonication (300 W; 5 sec/time; five times). The absorbance
values were measured using an enzyme labeling instrument (MK3;
Thermo Fisher Scientific, Inc.) to indicate the level of production
of GSH, CAT, SOD and MDA.
 | Table VResults of stability determination of
the three probe drugs |
Table V
Results of stability determination of
the three probe drugs
| Analytes | QC, ng/ml | Estimated,
ng/ml | RSD,% |
|---|
| Testosterone | 480 | 482.80±14.67 | 3.04 |
| | 120 | 115.80±2.11 | 1.82 |
| | 30 | 27.74±0.49 | 1.78 |
| Fenacetin | 24 | 22.36±0.77 | 3.43 |
| | 6 | 6.27±0.10 | 1.63 |
| | 1.5 | 1.44±0.05 | 3.57 |
| Chlorzoxazol | 24 | 25.36±1.33 | 5.26 |
| | 6 | 6.52±0.07 | 1.01 |
| | 1.5 | 1.48±0.02 | 1.33 |
Western blotting
HaCaT cells were seeded into 6-well plates
(2x10⁵ cells/well) in a complete growth medium for 48 h
and were assigned into seven groups: 3 TP group (39.07, 78.13 and
156.25 ng/ml) and 3 TP (39.07, 78.13 and 156.25 ng/ml): FA (1:100)
group and a negative control group (Blank solvent is DMEM). Cells
were then harvested by scraping, collected in HBSS and centrifuged
at 1,530 x g for 5 min at 4˚C before they were mixed with lysis
buffer (RIPA; Beijing Solarbio Science & Technology Co. Ltd.)
and placed on ice for 20 min. Following lysis the suspension was
centrifuged at 12,000 x g at 4˚C for 15 min. Protein was collected
and the concentrations determined using a bicinchoninic acid
protein assay kit (cat. no. 23225; Thermo Fisher Scientific, Inc.)
according to the manufacturer's instructions. A total of 20 µg of
each protein was loaded for SDS-PAGE (12%) before transfer onto
PVDF membranes. Membranes were blocked with 10% goat serum for 2 h
at 4˚C before incubation with the primary antibodies (diluted in 5%
skimmed milk) at 4˚C for 12 h. Nrf2 (1:1,000) and β-actin
(1:100,000) were used as primary antibodies and anti-mouse
immunoglobulin G (1:50,000) as the secondary antibody at 37˚C for 1
h. The blots were developed with ECL reagent (EMD Millipore; cat.
no. WBKLS0010). The density of each protein band was analyzed and
calculated using ImageJ version 1.44 (National Institutes of
Health). Protein expression level was expressed as the ratio of
Nrf2 to β-actin, and semi-quantitative analysis was performed.
Statistical analysis
Data are presented as the mean ± SD from 3 parallel
experiments per group. Analyses were performed using SPSS software
version 21.0 (SPSS, Inc.). Differences between the treatment groups
and the control group were assessed by one-ANOVA followed by a
least-significant-difference test. P<0.05 was considered to
indicate a statistically significant difference.
Results
Determination of the compatibility
ratio of TP to FA
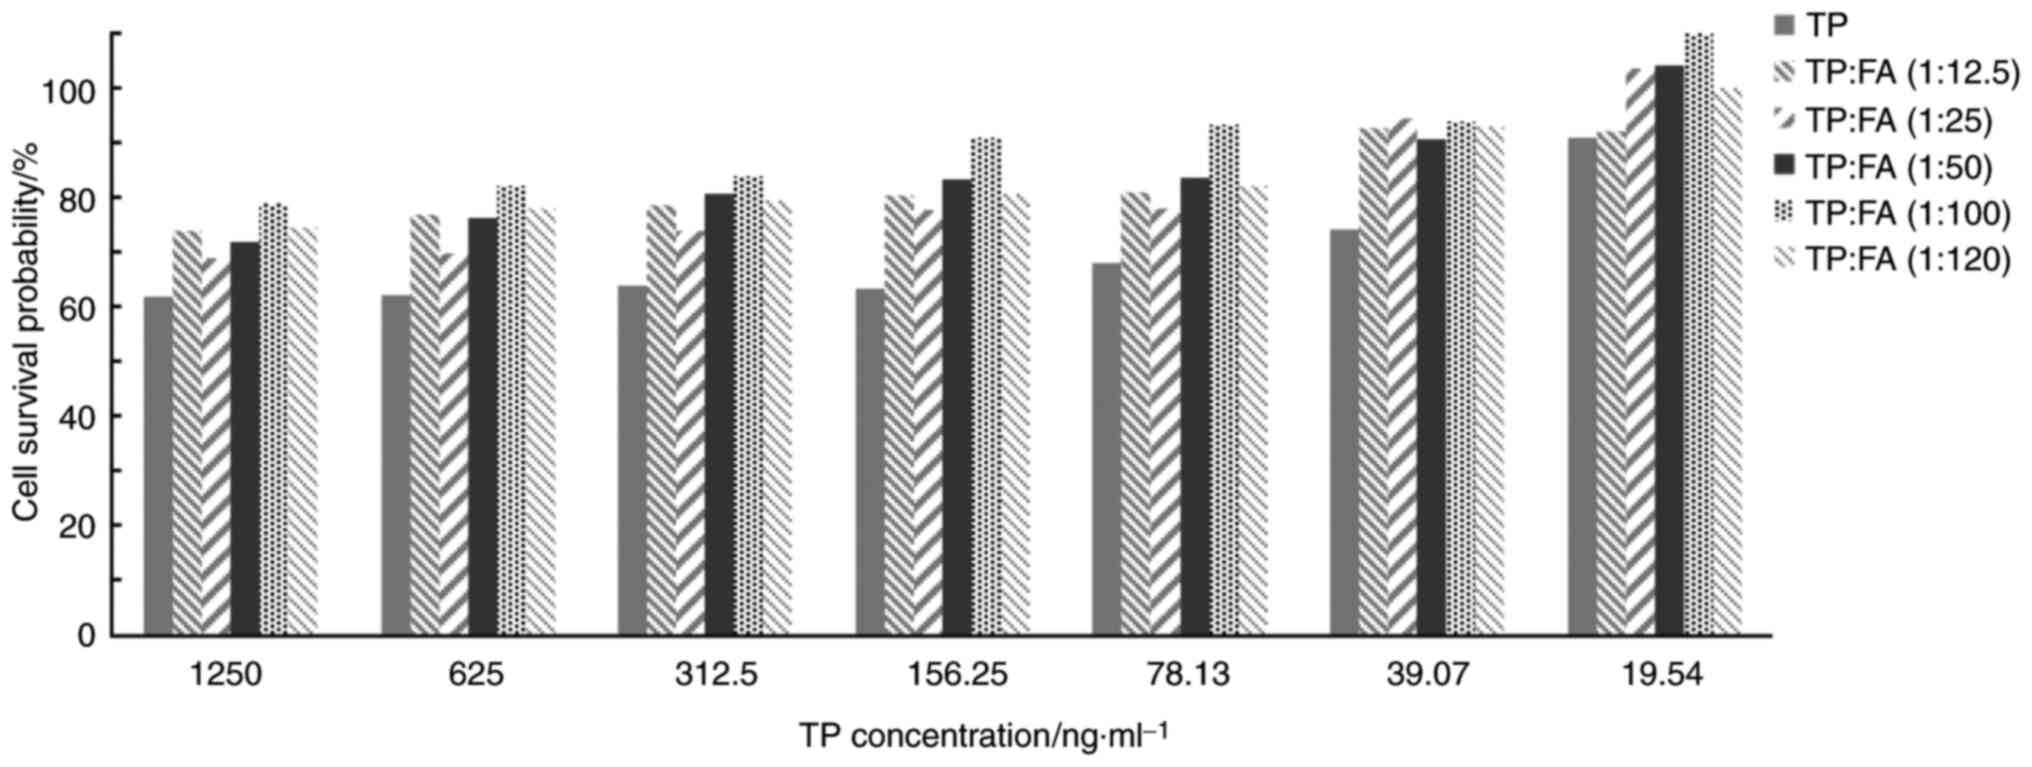
It was found that TP inhibited the viability of
HaCaT cells in a dose related manner, with higher doses reducing
cell viability (Table I; Fig. 1). The cell survival rate was <90%
when the concentration of TP >19.54 ng/ml. When the
concentration of FA was <150 µg/ml, FA had no effect on the
survival of HaCaT cells. However, the inhibitory effect on HaCaT
cell survival was significantly decreased when TP + FA was
administered. Moreover, the survival rate of HaCaT cells was
increased at TP + FA combination ratios of 1:12.5, 1:25, 1:50,
1:100 and 1:120, compared with the TP alone group. The effect on
cell survival of the TP + FA combination ratio 1:100 was >7
times higher compared with TP alone. Therefore, the present results
indicated that the compatibility ratio of TP + FA was 1:100.
| Table IAverage optical densities of HaCaT
cells among the experimental groups. |
Table I
Average optical densities of HaCaT
cells among the experimental groups.
| | Combination
ratio |
|---|
| TP concentration,
ng/ml | TP | 1:12.5 | 1:25 | 1:50 | 1:100 | 1:120 |
|---|
| Control | 0.417±0.059 | 0.460±0.069 | 0.467±0.056 | 0.398±0.033 | 0.382±0.024 | 0.432±0.041 |
| 1250 | 0.281±0.039 | 0.356±0.038 | 0.347±0.021 | 0.303±0.029 | 0.316±0.022 | 0.337±0.042 |
| 625 | 0.282±0.038 | 0.367±0.042 | 0.351±0.034 | 0.318±0.033 | 0.327±0.016 | 0.349±0.036 |
| 312.5 | 0.288±0.029 | 0.375±0.050 | 0.366±0.034 | 0.333±0.026 | 0.332±0.018 | 0.355±0.036 |
| 156.25 | 0.286±0.034 | 0.382±0.066 | 0.381±0.015 | 0.342±0.027 | 0.354±0.039 | 0.360±0.023 |
| 78.13 | 0.303±0.035 | 0.384±0.012 | 0.382±0.033 | 0.342±0.016 | 0.361±0.026 | 0.364±0.024 |
| 39.07 | 0.325±0.027 | 0.431±0.055 | 0.445±0.035 | 0.367±0.024 | 0.363±0.022 | 0.406±0.020 |
| 19.54 | 0.385±0.040 | 0.429±0.014 | 0.480±0.016 | 0.412±0.012 | 0.416±0.009 | 0.432±0.022 |
Influence of TP + FA on activities of
CYP450 enzymes and method validation
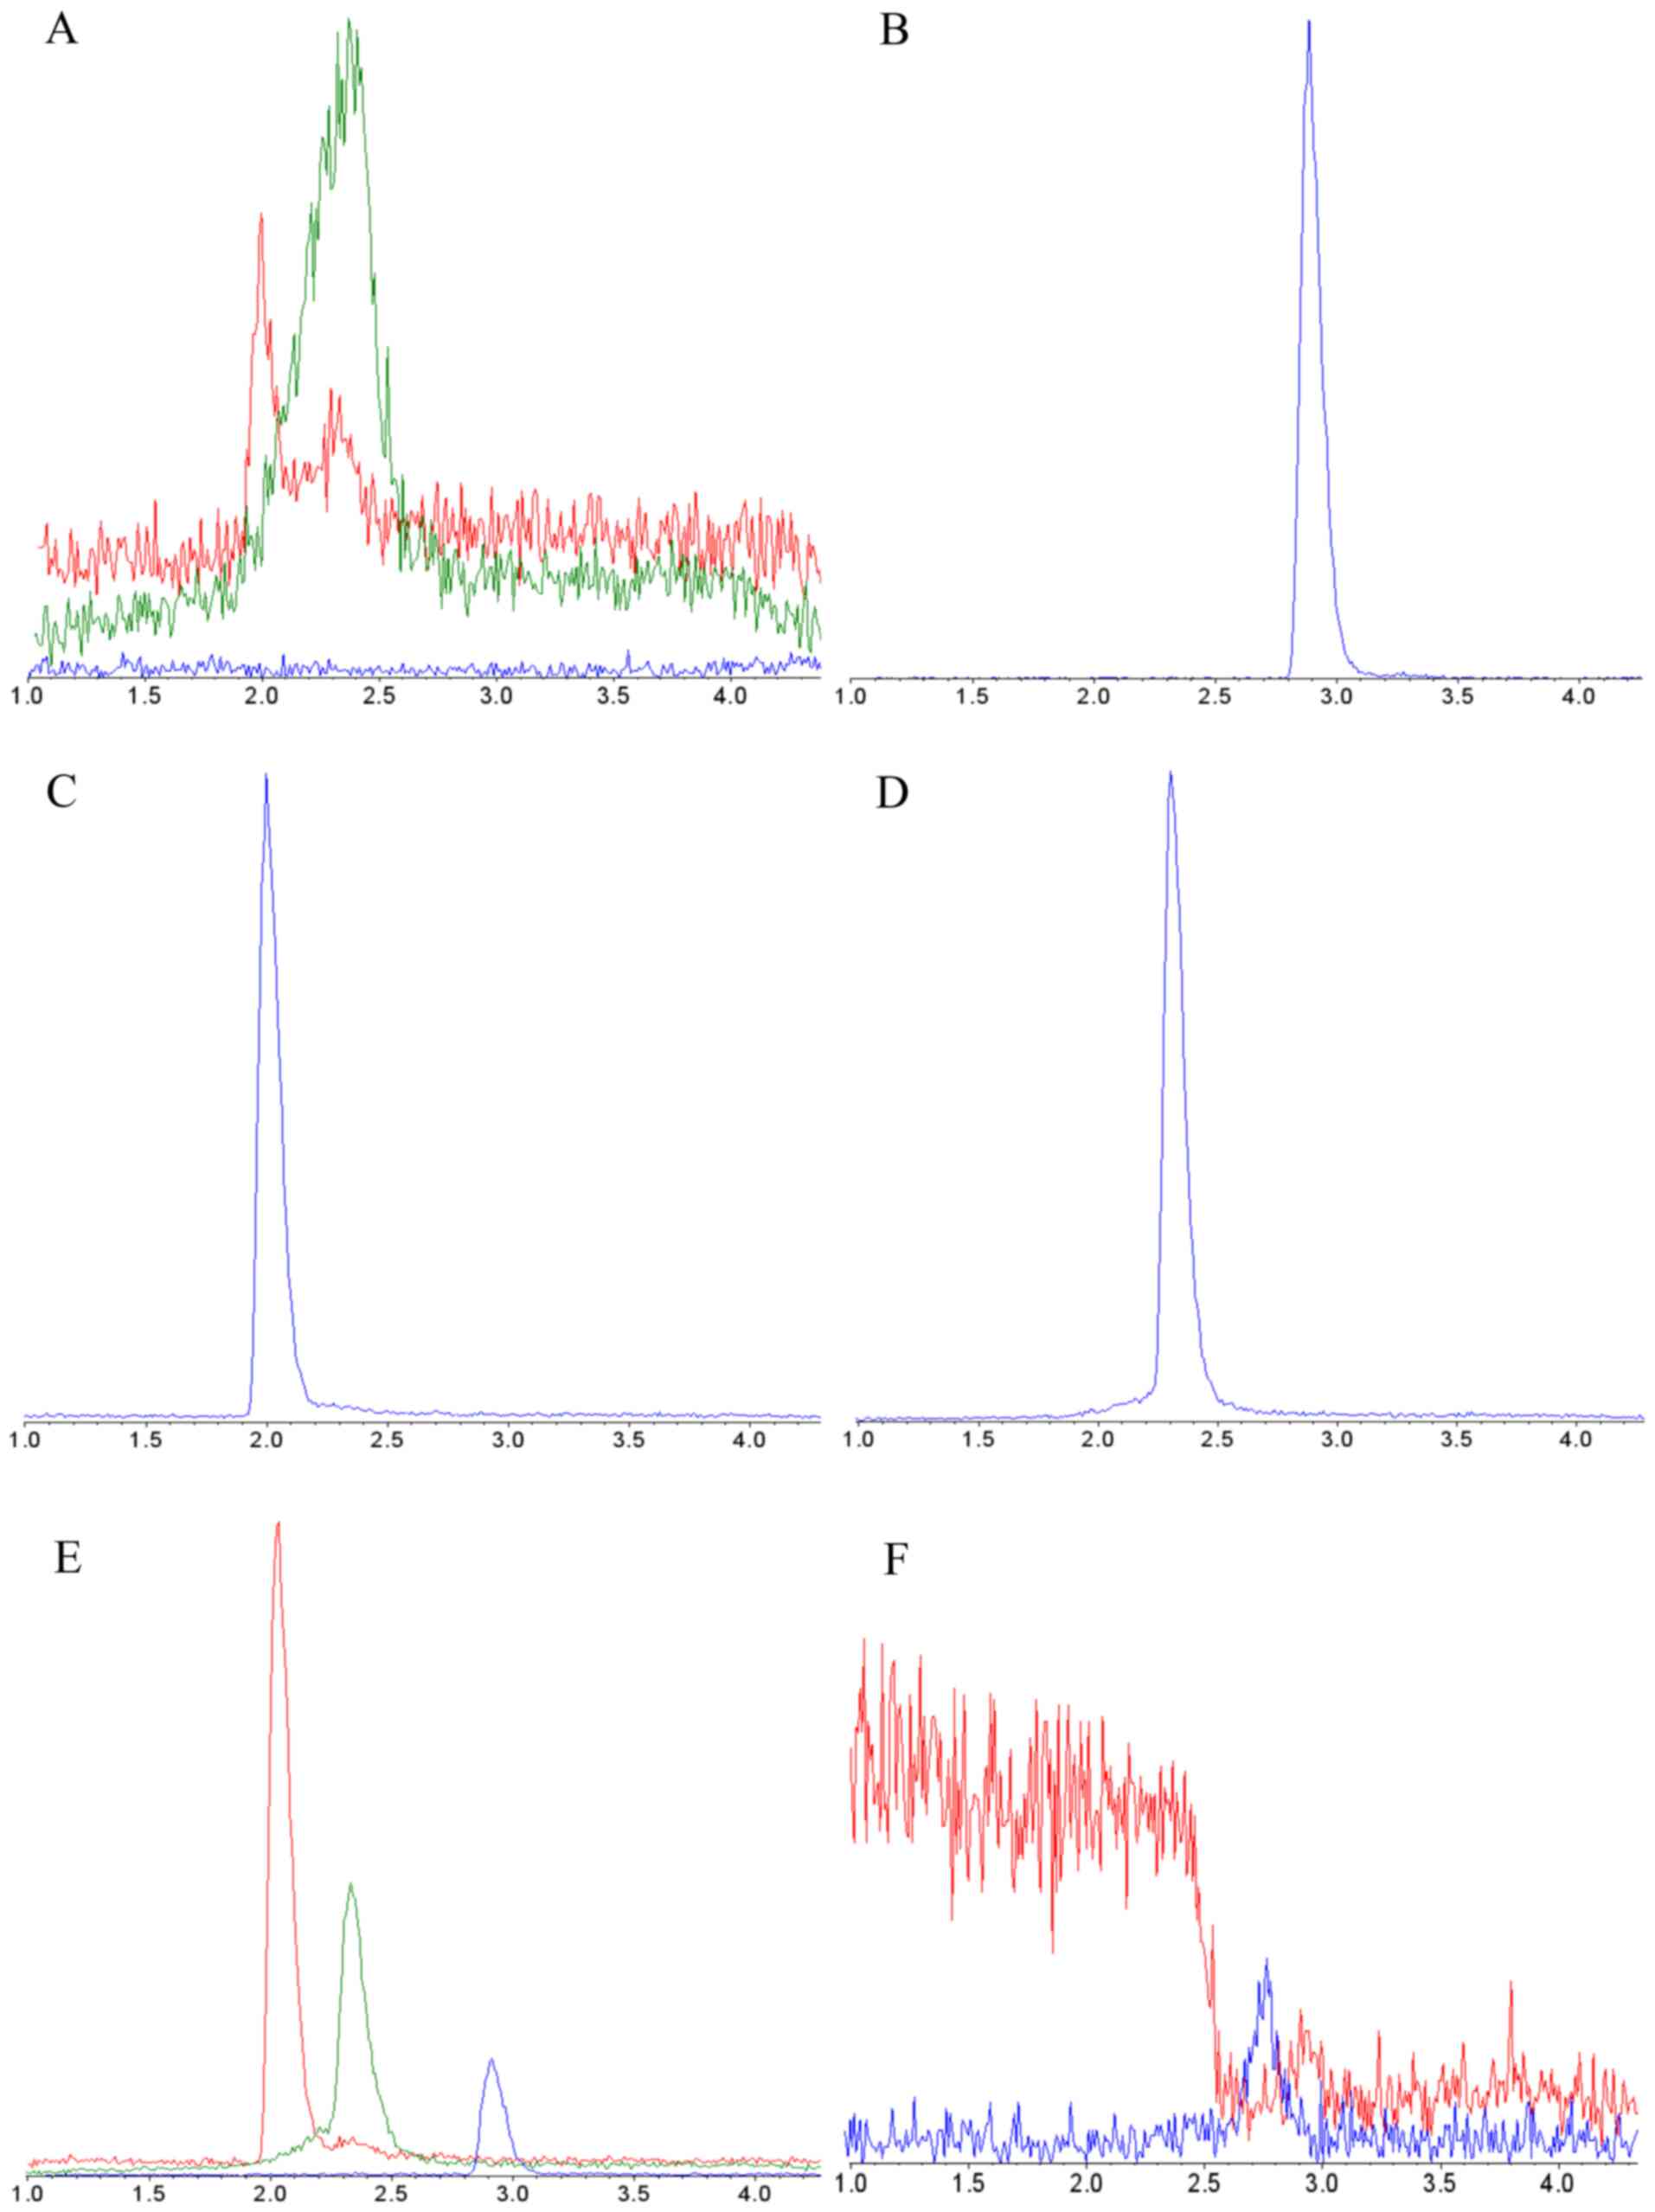
Specificity. It was found that none of the
reagents or disposables used for method setup interfered with
detection or quantification of probe drugs. Furthermore,
false-positive responses and co-eluting components were not
detected in analyzed biomatrices, and no carryover was observed
(Fig. 2).
Linearity
Calibration curves showed excellent linearity
(r>0.999) at the following concentration ranges: 3.75-480 ng/ml
for testosterone, 0.19-24 ng/ml for fenacetin and 0.38-24 ng/ml for
chlorzoxazol (Table II).
| Table IILinear regression equation, linear
range, LOD and LOQ for the three probe drugs. |
Table II
Linear regression equation, linear
range, LOD and LOQ for the three probe drugs.
| Probe drugs | Linear regression
equation | Correlation
coefficient | LOD, ng/ml | LOQ, ng/ml |
|---|
| Testosterone |
Y=0.00179X-0.00132 | 0.9999 | 3.75 | 15 |
| Fenacetin |
Y=0.207X+0.0268 | 0.9993 | 0.035 | 0.75 |
| Chlorzoxazol |
Y=0.1289X+0.0357 | 0.9994 | 0.018 | 0.75 |
Accuracy and precision
The present study validated the accuracy and
precision, including both intra-day and inter-day precision, of the
three probe drugs in HaCaT cells. It was demonstrated that the
results were all acceptable (RSD, <15%; Tables III and IV).
| Table IIIResults of precision determination of
the three probe drugs. |
Table III
Results of precision determination of
the three probe drugs.
| | | Intra-day
(n=6) | Inter-day
(n=6) |
|---|
| Analytes | QC, ng/ml | Estimated value,
ng/ml | RSD, % | Estimated value,
ng/ml | RSD, % |
|---|
| Testosterone | 480 | 479.5±8.38 | 1.52 | 468.5±31.74 | 6.77 |
| | 120 | 117.8±1.60 | 1.36 | 119.54±2.04 | 1.71 |
| | 30 | 29.9±0.80 | 1.75 | 30.06±1.47 | 4.88 |
| Fenacetin | 24 | 24.12±0.36 | 1.50 | 23.43±0.64 | 2.74 |
| | 6 | 6.08±0.16 | 2.56 | 5.96±0.14 | 2.27 |
| | 1.5 | 1.58±0.06 | 3.78 | 1.51±0.07 | 4.69 |
| Chlorzoxazol | 24 | 25.88±0.58 | 2.25 | 25.95±0.63 | 2.44 |
| | 6 | 6.81±0.17 | 2.46 | 6.06±0.40 | 6.54 |
| | 1.5 | 1.55±0.02 | 1.29 | 1.54±0.05 | 3.34 |
| Table IVResults of accuracy determination of
the probe drugs. |
Table IV
Results of accuracy determination of
the probe drugs.
| Analytes | QC, ng/ml | Percent recovery,
% | RSD, % |
|---|
| Testosterone | 480 | 102.79±3.75 | 3.65 |
| | 120 | 101.50±2.85 | 2.81 |
| | 30 | 105.33±1.35 | 1.29 |
| Fenacetin | 24 | 100.75±2.75 | 2.73 |
| | 6 | 99.87±1.75 | 1.75 |
| | 1.5 | 90.27±3.22 | 3.56 |
| Chlorzoxazol | 24 | 107.82±2.43 | 2.25 |
| | 6 | 113.54±2.79 | 2.46 |
| | 1.5 | 103.47±1.34 | 1.29 |
Stability
The present study also evaluated the stability of
the three probe drugs under various conditions by analyzing six
replicates of QC samples at low, middle and high concentrations.
The RSDs high, medium and low QC samples of testosterone were 3.04,
1.82 and 1.78%, respectively. The RSDs of high, medium and low
concentration QC samples of fenacetin were 3.43, 1.63 and 3.57%,
respectively. The RSDs of high, medium and low concentration
quality control samples of chlorzoxazol were 5.26, 1.01 and 1.33%,
respectively. It was demonstrated that the RSDs of all QC samples
were within 6%, which was <15%.
Influence of TP + FA on the activities
of CYP450 enzymes
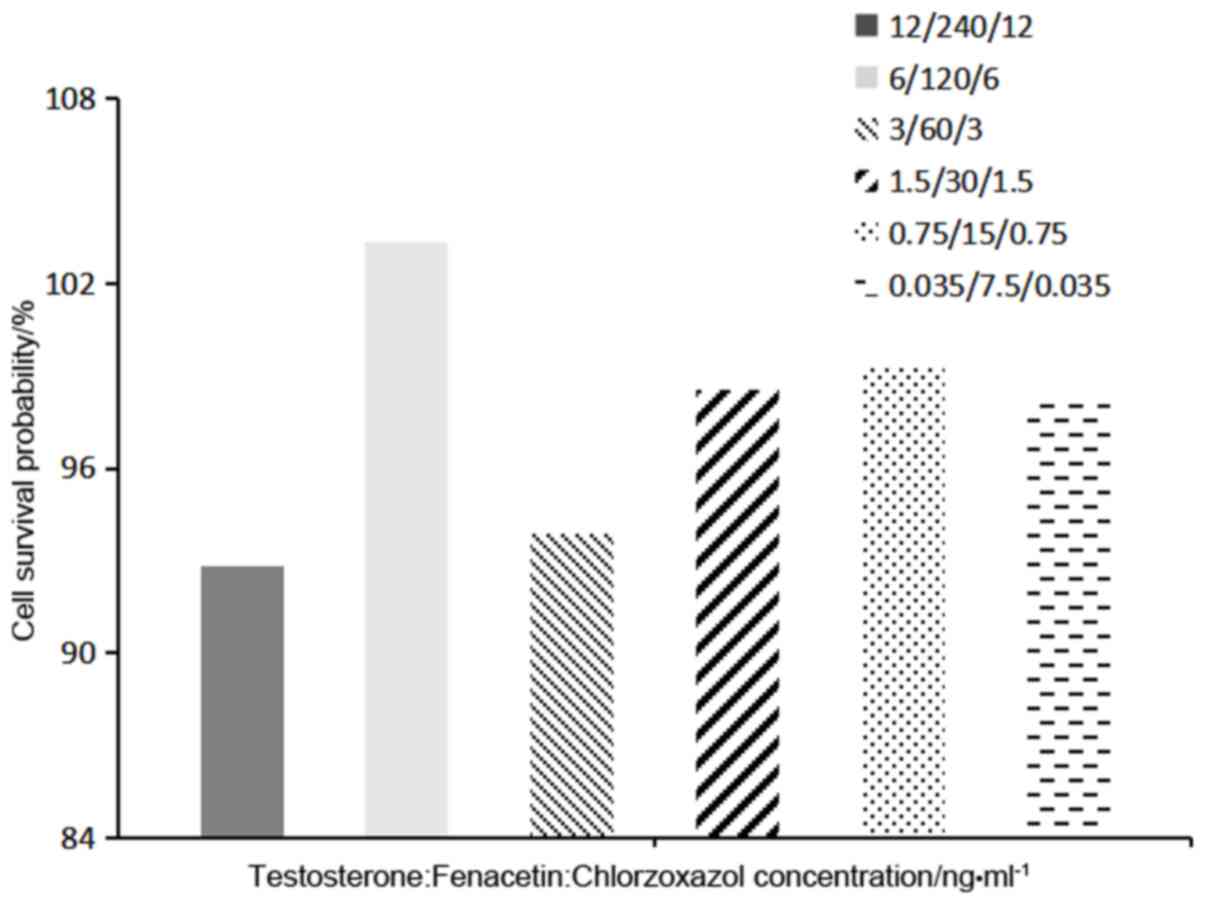
Investigation of probe drug incubation,
concentration and duration of treatment. MTT assay results
indicated that no mixed probe substrate group had any significant
effect on the growth of the HaCaT cells. Moreover, it was found
that the probability of cell survival was greatest when the ratio
of concentrations of testosterone: Fenacetin: Chlorzoxazol was
120:6:6 ng/ml (Fig. 3).
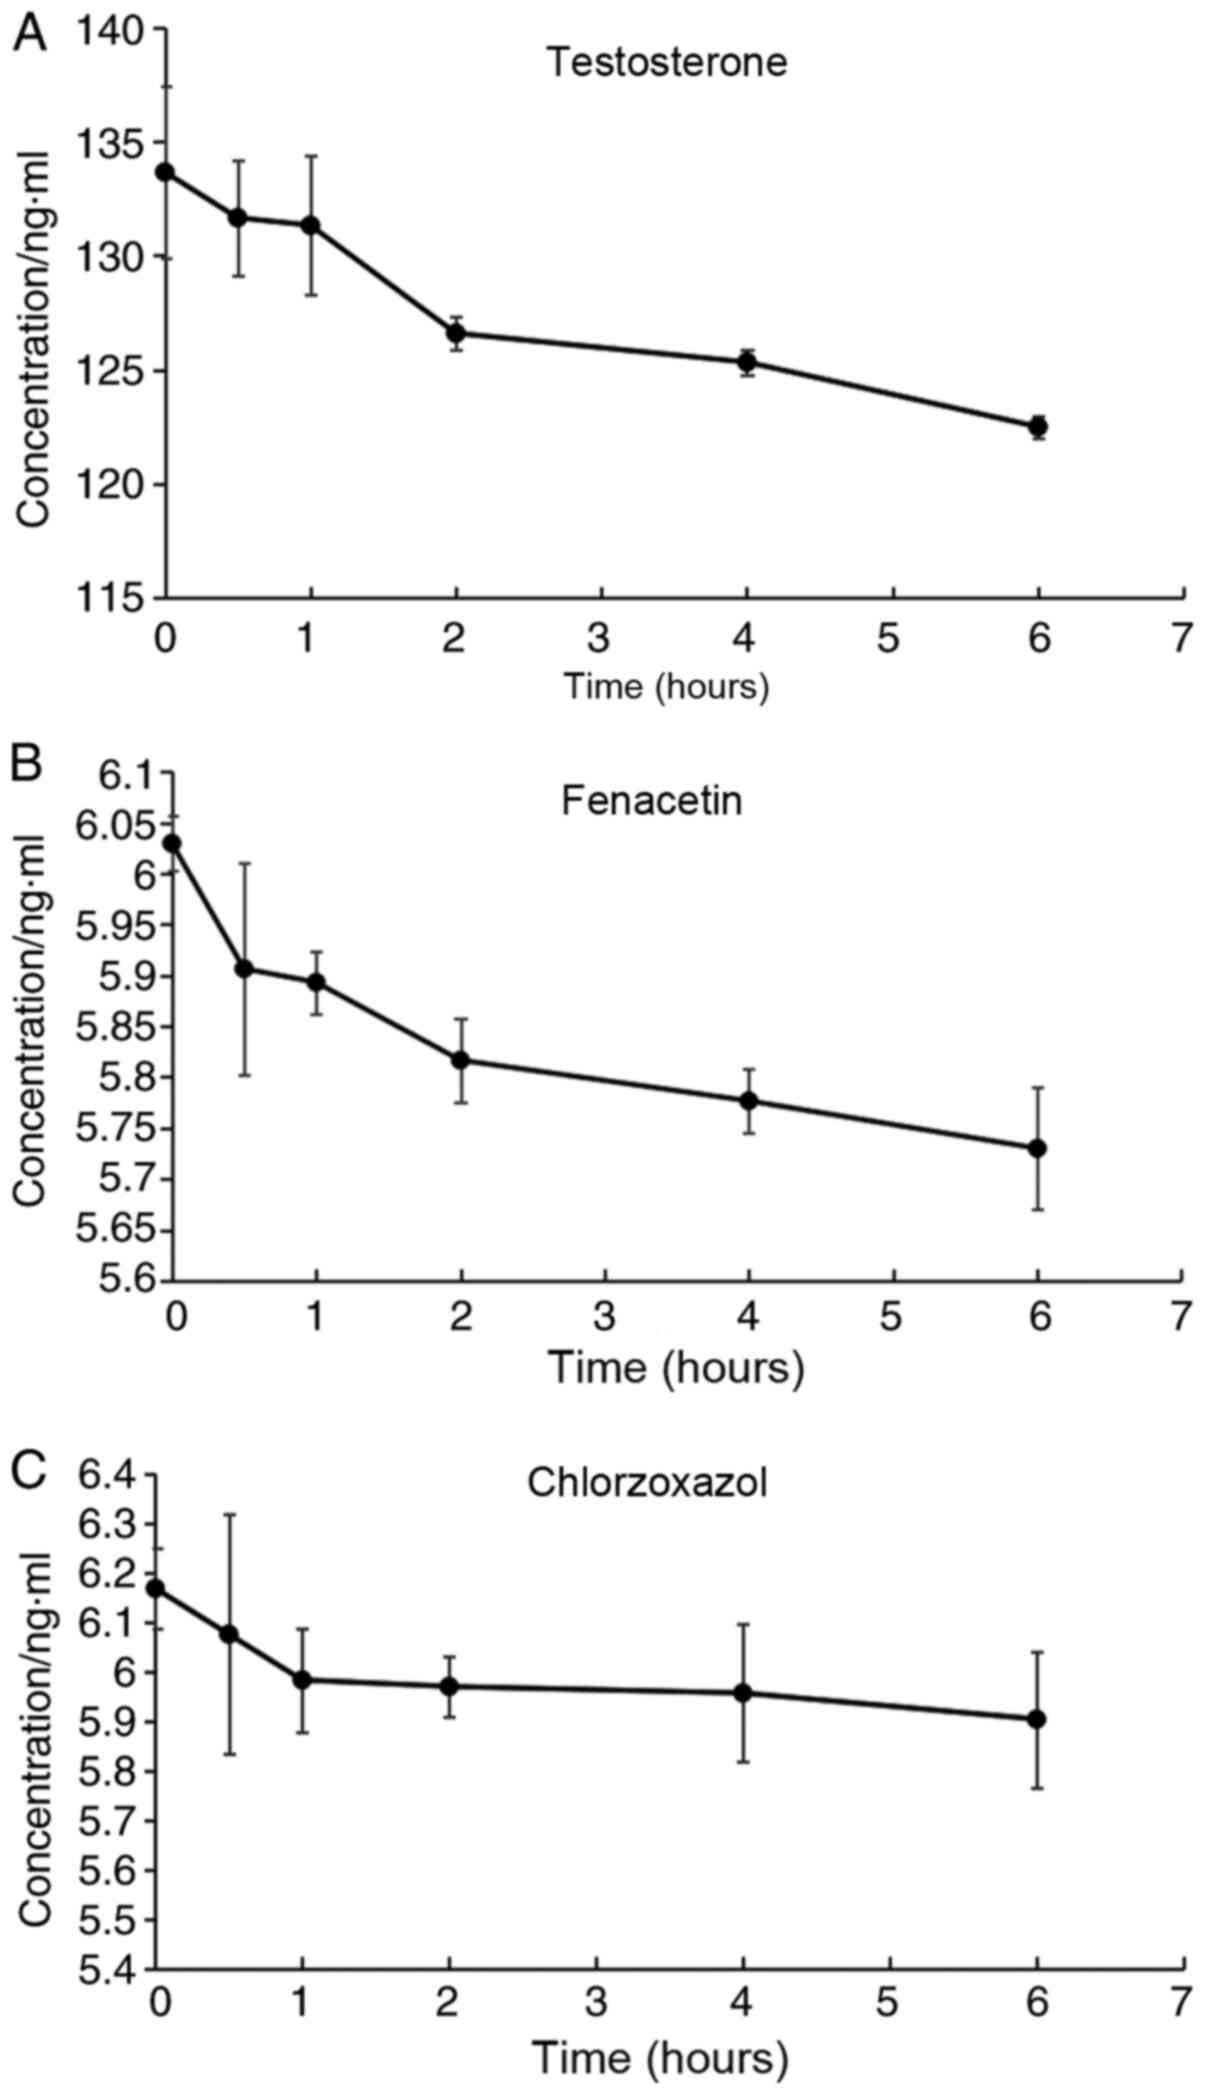
Mixed probe drug solutions containing testosterone,
fenacetin and Chlorzoxazol were administered at a dose of 120:6:6
ng/ml to HaCaT cells in each group, and the concentrations of the
samples were determined. It was identified that in the 1st h of
administration, the concentration of chlorzoxazol (Fig. 4C) in the incubation system
decreased, and after this time point the concentration remained
relatively unchanged. However, the concentration of testosterone
(Fig. 4A) and fenacetin (Fig. 4B) appeared decreased within 2 h of
administration, after which the reductions were slower, thus the
incubation time was determined to be 2 h.
Determination of CYP450 enzymatic
activities
The present results suggested that the metabolic
activity of fenacetin was reduced in the TP group compared with the
control group. Furthermore, in the high dose 1:100 TP + FA
combination group a decrease in fenacetin concentration was
observed, compared with the TP group (Fig. 5). However, this difference was not
significant, thus indicating that the compatibility of TP + FA had
no effect on CYP1A2 activity in HaCaT cells. Moreover, the present
results suggested that combined TP + FA treatment did not
significantly change the activity of CYP2E1 or CYP3A4 (Fig. 5).
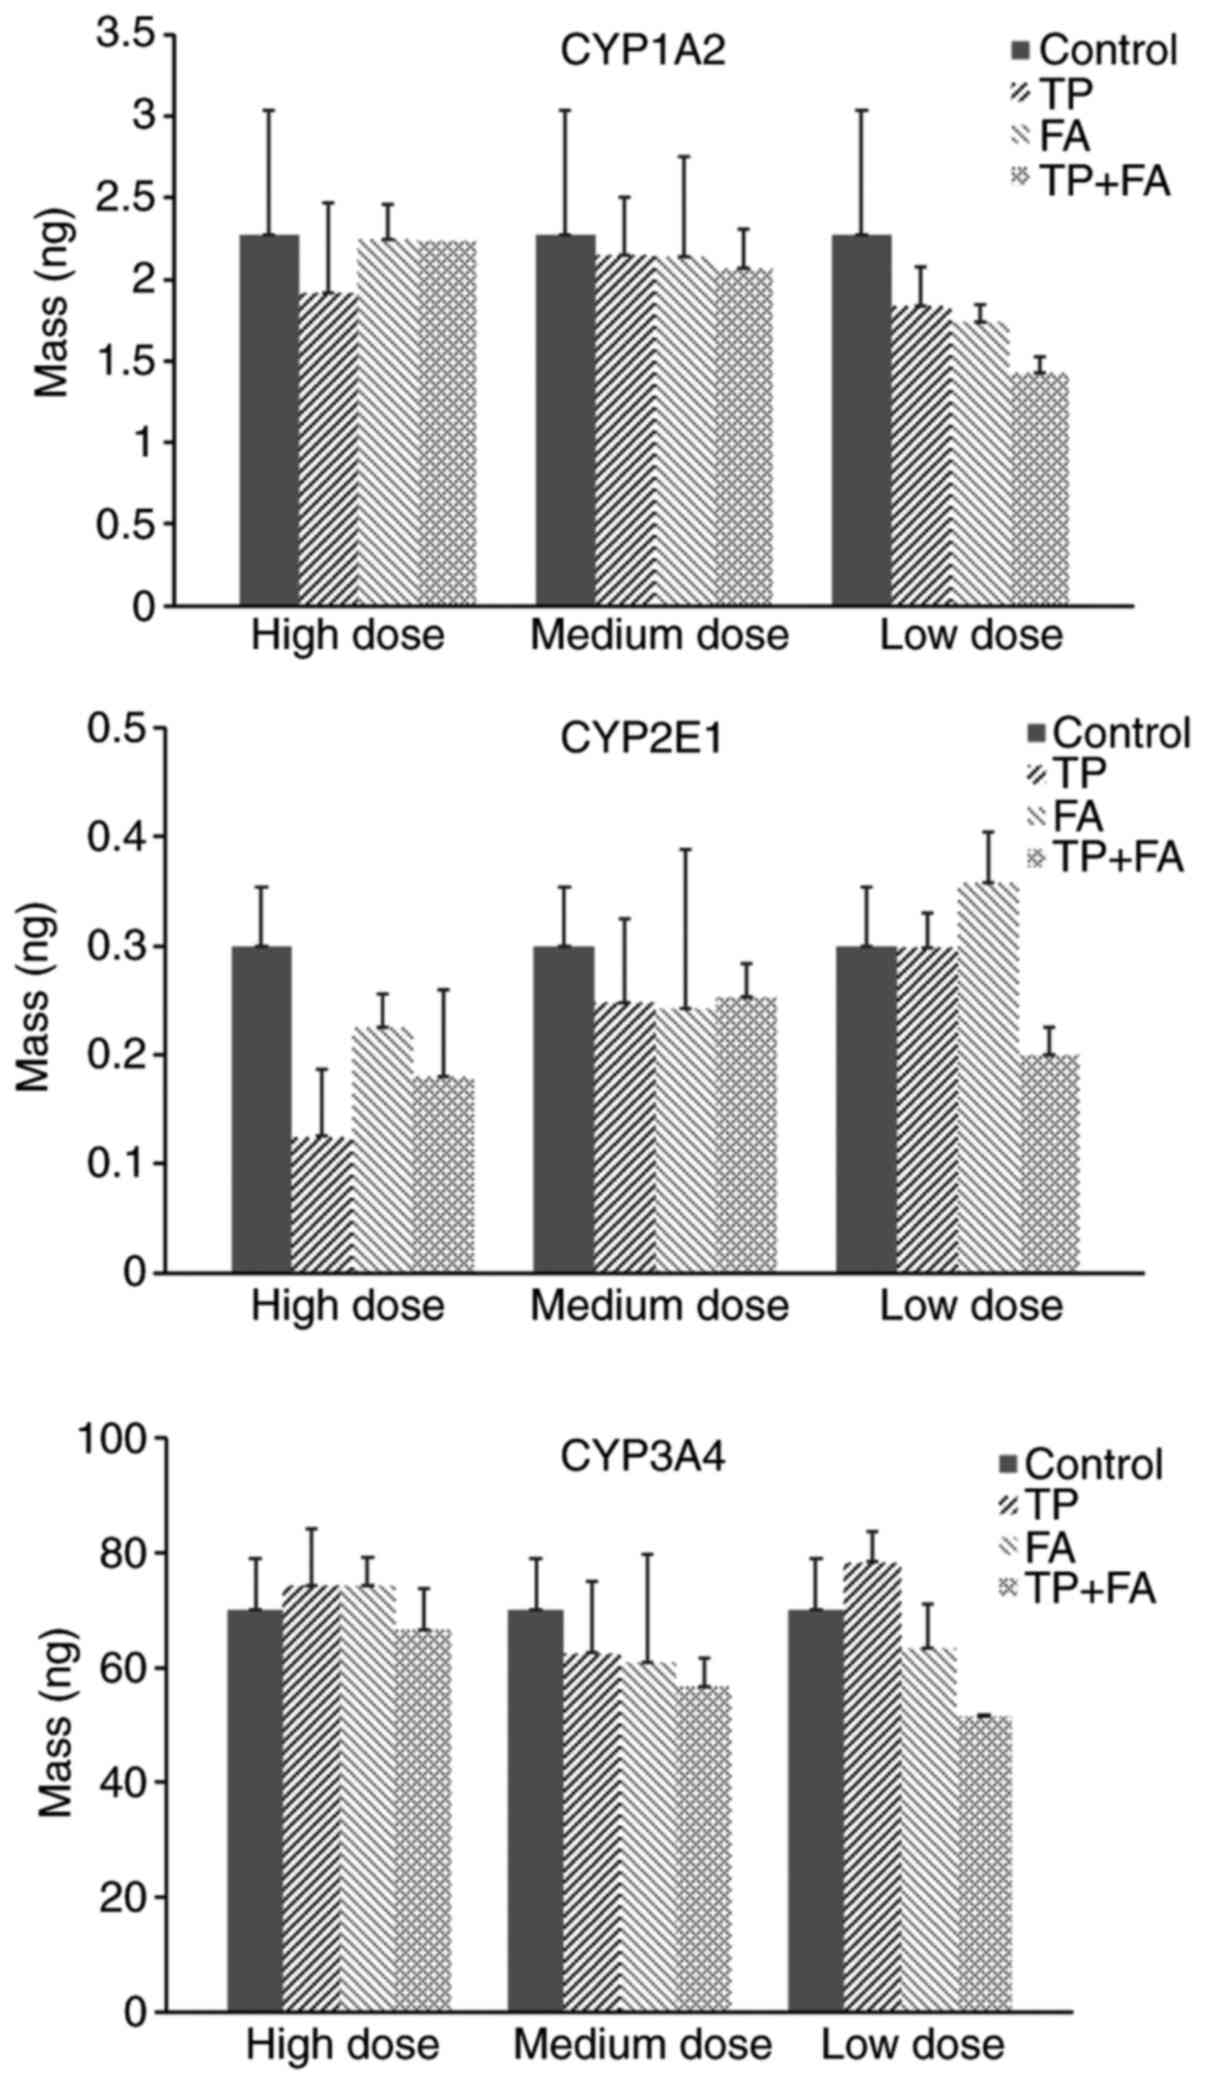 | Figure 5Effect of TP + FA on activities of
CYP1A2, CYP2E1 and CYP3A4. TP high dose, 156.25 ng/ml, TP medium
dose, 78.13 ng/ml and TP low dose, 39.07 ng/ml. TP + FA low dose,
TP 39.07 ng/ml + FA 3.907 µg/ml, TP + FA medium dose, TP 78.13
ng/ml + FA 7.813 µg/ml, and TP + FA high dose, TP 156.25 ng/ml + FA
15.625 µg/ml. TP, triptolide; FA, ferulic acid; CYP1A2, cytochrome
P450 family 1 subfamily A member 2; CYP2E1, cytochrome P450 family
2 subfamily E member 1; CYP3A4, cytochrome P450 family 3 subfamily
A member 4. |
Protective effect of TP + FA against
oxidative damage in HaCaT cells
Detection of antioxidant factors in HaCaT
cells. It was demonstrated that the production levels of ROS,
SOD and MDA were significantly higher, and those of GSH and CAT
significantly lower, in the TP group compared with the control
group (P<0.01; Table VI;
Fig. 6). Furthermore, it was found
that FA reversed the regulatory changes in oxidation factors
induced by TP. The production levels of ROS, SOD and MDA in HaCaT
cells were significantly decreased, and those of GSH and CAT
increased significantly, in the TP + FA group compared with
TP-alone group.
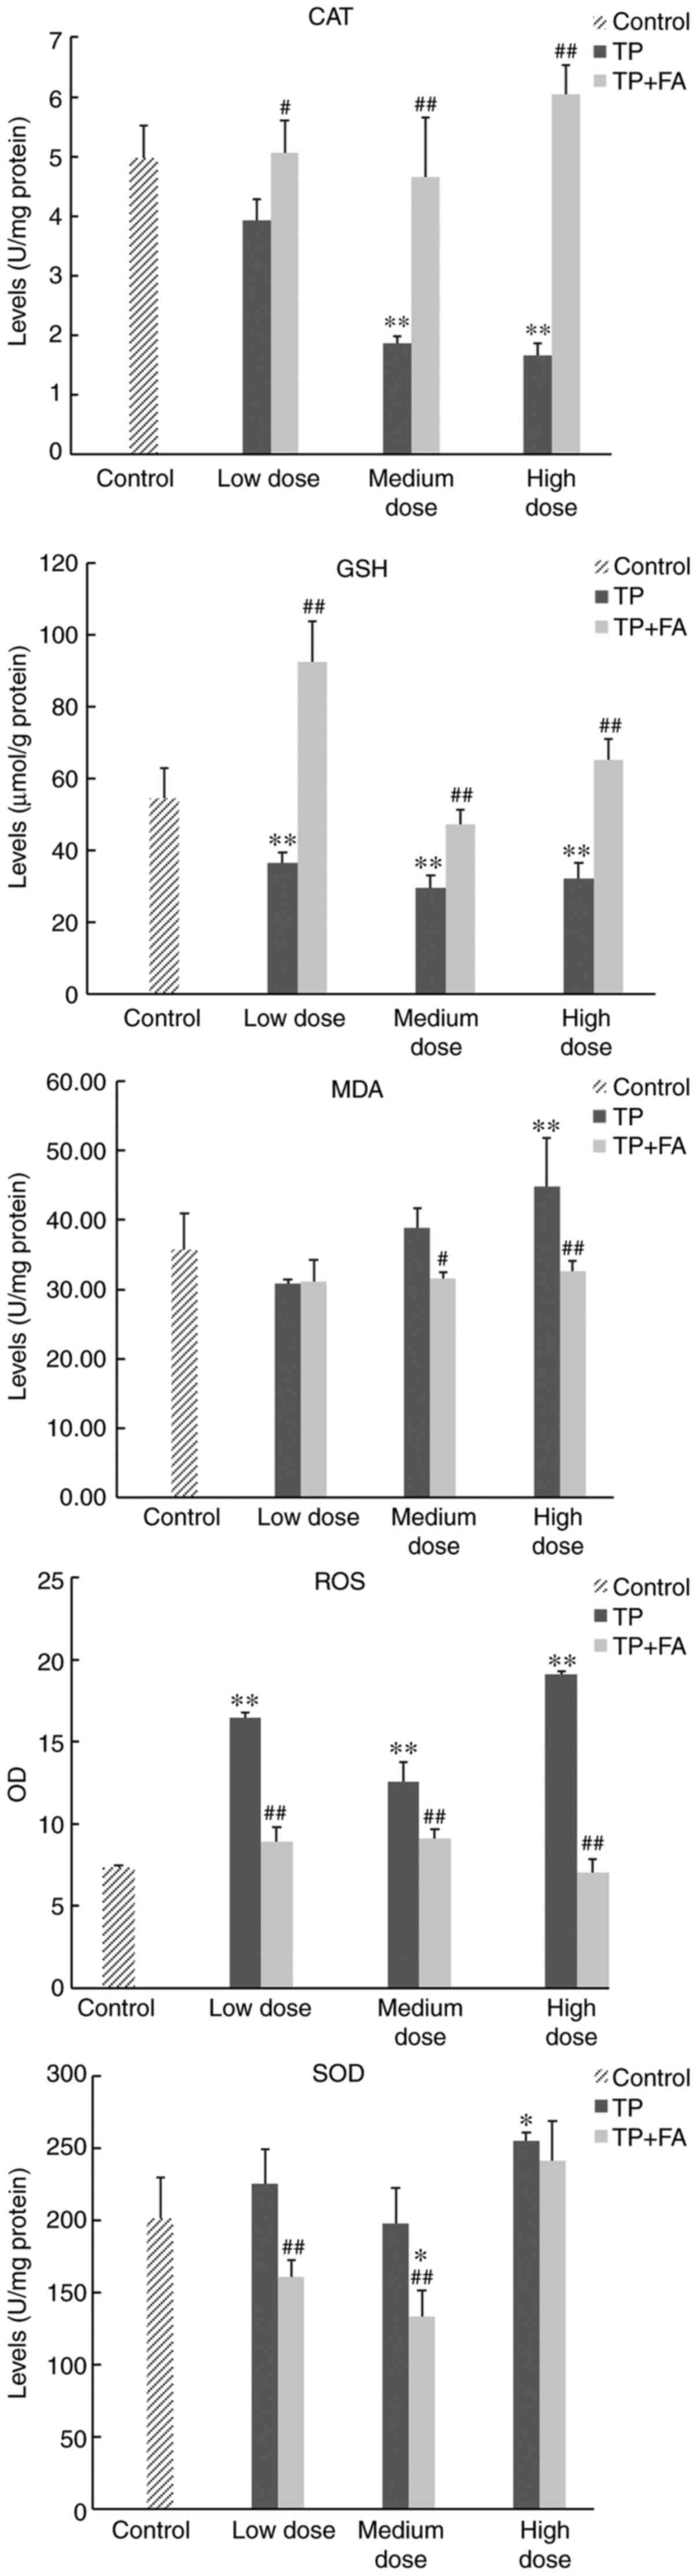 | Figure 6Production levels of ROS, GSH, CAT,
SOD and MDA in HaCaT cells. Doses for each group were as follows:
Control, without TP or FA; TP low dose, 39.07 ng/ml; TP medium
dose, 78.13 ng/ml; TP high dose, 156.25 ng/ml; FA low dose, 3.907
µg/ml; FA medium dose, 7.813 µg/ml; FA high dose, 15.625 µg/ml; TP
+ FA low dose, TP 39.07 ng/ml + FA 3.907 µg/ml; TP + FA medium
dose, TP 78.13 ng/ml + FA 7.813 µg/ml; and TP + FA high dose, TP
156.25 ng/ml + FA 15.625 µg/ml. *P<0.05,
**P<0.01 vs. control group; #P<0.05,
##P<0.01 vs. TP group. ROS, reactive oxygen species;
GSH, glutathione; CAT, catalase; SOD, superoxide dismutase; MDA,
malondialdehyde; TP, triptolide; FA, ferulic acid. |
| Table VIExpression of antioxidant factors in
HaCaT cells. |
Table VI
Expression of antioxidant factors in
HaCaT cells.
| Group | ROS, OD | GSH, µmol/g
protein | SOD, U/mg
protein | CAT, U/mg
protein | MDA, nmol/g
protein |
|---|
| Control | 7.36±0.11 | 56.46±8.52 | 201.33±23.83 | 4.98±0.54 | 35.72±5.23 |
| TP-low dose |
16.43±0.35b |
36.36±2.93b | 225.16±24.25 | 3.93±0.36 | 30.75±0.73 |
| TP-medium dose |
12.59±1.18b |
29.56±3.47b | 197.95±24.50 |
1.87±0.11b | 38.82±2.79 |
| TP-high dose |
19.09±0.21b |
31.98±4.58b |
255.06±5.46a |
1.66±0.20b |
44.75±6.98b |
| FA-low dose |
13.17±1.77b | 66.42±9.29 | 218.47±21.19 | 4.83±0.59 | 31.33±4.63 |
| FA-medium dose |
10.33±1.22b |
74.67±4.26b | 168.94±24.79 | 4.15±0.39 | 30.65±3.09 |
| FA-high dose | 8.70±0.38 | 65.15±4.81 |
149.37±19.28a | 5.06±0.60 | 32.55±4.40 |
| TP+FA-low dose |
8.92±0.88d |
92.33±11.42b,d |
160.85±11.80d |
5.07±0.53d | 31.10±3.16 |
| TP+FA-medium
dose |
9.09±0.60d |
47.11±4.08d |
133.28±18.00b,d |
4.66±1.00d |
31.54±0.92c |
| TP+FA-high
dose |
7.01±0.87d |
65.32±5.68d | 241.33±27.56 |
6.05±0.49d |
32.57±1.49d |
Expression of Nrf2
The present results indicated that, compared with
the control group, there was no significant difference in the
protein expression of Nrf2 in the high- or low-dose TP group.
However, it was found that cells treated with TP + FA showed
upregulated Nrf2 protein expression, which was significant in the
high-dose group (P<0.05; Fig.
7).
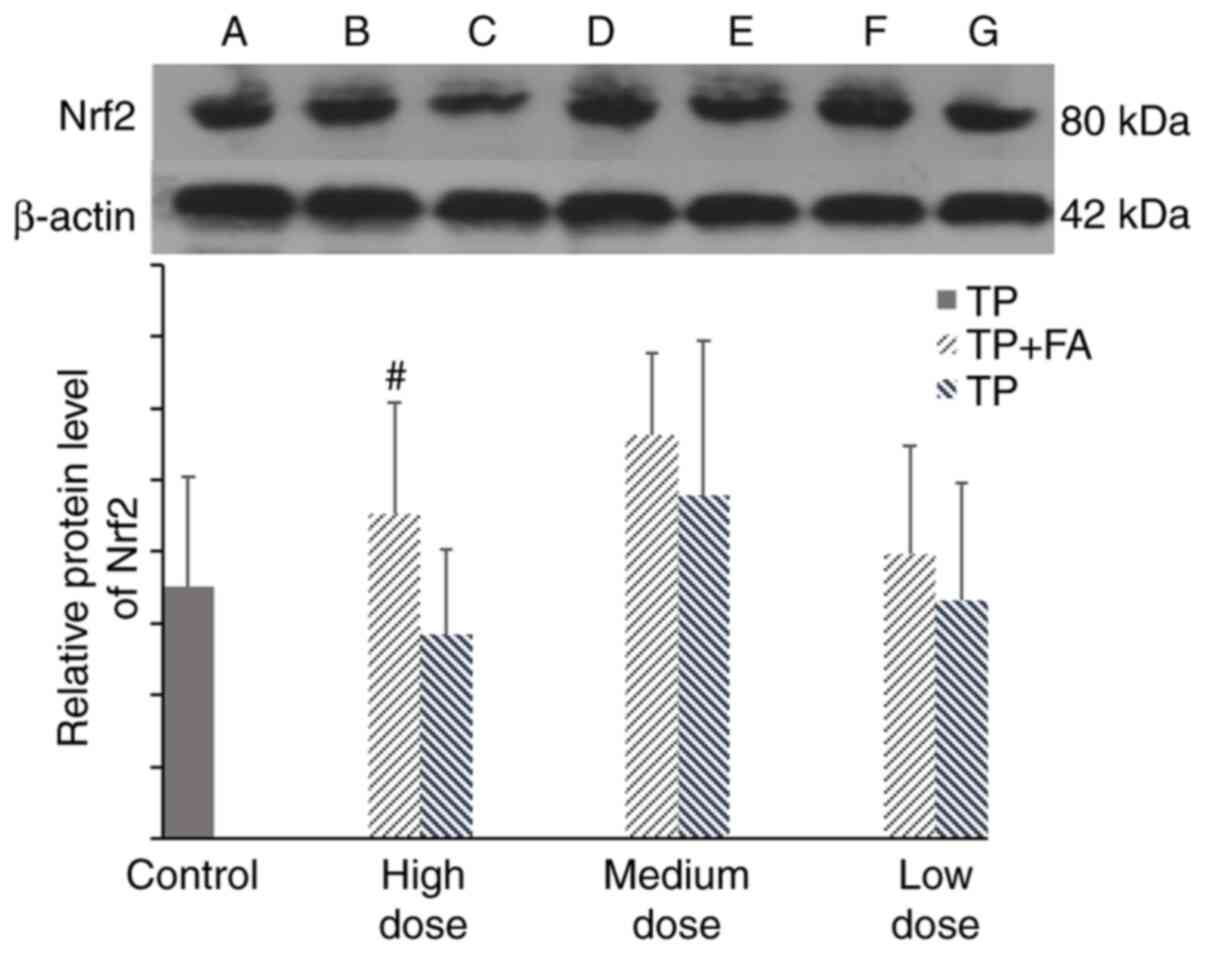 | Figure 7Protein expression of Nrf2 in HaCaT
cells. Doses for each group were as follows: Control, without TP or
FA; TP low dose, 39.07 ng/ml; TP medium dose, 78.13 ng/ml; TP high
dose, 156.25 ng/ml; TP + FA low dose, TP 39.07 ng/ml + FA 3.907
µg/ml; TP + FA medium dose, TP 78.13 ng/ml + FA 7.813 µg/ml; and TP
+ FA high dose, TP 156.25 ng/ml + FA 15.625 µg/ml. A band, control.
B, D and F bands are high-, middle- and low-dose TP + FA
combination groups, respectively. C, E and G bands are high-,
medium- and low-dose TP-alone groups, respectively.
#P<0.05 vs. TP group. TP, triptolide; FA, ferulic
acid; Nrf2, nuclear factor erythroid-2-related factor 2. |
Discussion
Skin is the first physiological barrier of the human
body and is also the largest organ (29). It not only protects the body from
adverse external factors, but also prevents loss of moisture and
nutrients, and plays essential roles in defense (30). Moreover, skin is one of the primary
locations for drug metabolism, in addition to the liver (29). The ‘cocktail’ probe substrates
approach method has the advantages of high throughput, rapidity and
simplicity, and it can reduce the influence of individual
differences on the experimental results (31). This method has become an effective
part of early high-throughput drug screening and research into
mechanisms underlying drug interactions, and is also the main
method of drug metabolism research (32). The present study used fenacetin,
chlorzoxazol and testosterone as special probe drugs to investigate
the activities of CYP1A2, CYP2E1 and CYP3A4, respectively (33). The present results indicated that TP
+ FA had no significant effect on the activities of CYP1A2, CYP2E1
or CYP3A4 in HaCaT cells. CYP3A4 is predominant in the metabolism
of triptolide, while glycyrrhizin can significantly accelerate the
metabolic elimination of TP from the body, mainly via induction of
hepatic CYP3A activity and attenuation of the toxicity of TP
(34,35); this is inconsistent with the present
results. However, this discrepancy could arise for the fact that
the content of CYP enzymes in epidermal cells is lower compared
with liver cells, thus the results of the interaction between TP
and CYP enzymes in epidermal cells were not significant. It is also
possible that HaCaT cells were derived from human abdominal skin in
the present study. However, most CYP450 enzymes have interspecies
differences in the process of drug biotransformation, and in the
affinity between active or toxic drug components (36-38).
Therefore, these differences may help to explain why TP + FA did
not exert significant effects on the three tested CYP450 enzymes in
the present study.
ROS are a metabolic signals produced under normal
physiological conditions, and play essential roles in maintaining
normal oxidative stress (39). The
normal state of redox equilibrium is compromised when ROS levels
exceed the capacity of the antioxidant defense system (40), which in turn interrupts cellular
activities and induces apoptosis, tissue damage and aging (41,42).
Moreover, GSH, MDA, SOD and CAT are important for maintaining redox
equilibrium, which is closely implicated in the occurrence and
treatment of many diseases (43,44).
The present results suggested that TP significantly reduced the
survival rate of cells, increased production levels of ROS, MDA and
SOD, and decreased GSH and CAT activities in HaCaT cells. These
results are in line with previous studies investigating the
activation of related genes and disruption of mitochondrial
membrane potential, which compromises redox homeostasis, causes
oxidative damage and promotes apoptosis in HaCaT cells (45). The present results indicated that FA
reversed the regulatory changes of TP-induced antioxidant factors
and protected HaCaT cells. Our previous study, performed on
Madin-Daby Canine Kidney (MDCK) cells, showed that the toxicity of
TP can also be reduced by combining it with FA, which increases the
survival probability of MDCK cells (46). Moreover, isoliquiritigenin and
glycyrrhetinic are antagonistic to TP-induced damage in HepG2
cells, which may be partly associated with their protective effects
in TP-induced oxidative stress (47).
As Nrf2 is a master regulator of detoxification and
antioxidative responses, under healthy conditions its expression is
tightly regulated and controlled at the protein level (48,49).
Furthermore, Nrf2 participates in the synthesis of the
antioxidative enzymes GSH, SOD and CAT, by interacting with
antioxidant-reaction elements and inducing the expression of
downstream targets (50-52).
The present study found that the expression of Nrf2 protein was not
significantly affected by TP compared with the control group.
However, the protein expression of Nrf2 was increased in the TP +
FA group, and there was a significant difference in the high-dose
group. Therefore, the present results indicated that FA may
increase the protein expression of Nrf2 in HaCaT cells. However, it
cannot be confirmed that the expression of this downstream
antioxidant factor is affected by Nrf2 nuclear transposition
(53).
In conclusion, the present results suggested that TP
induced injury in HaCaT cells, whereas TP + FA alleviated this
cytotoxicity. However, it was found that TP + FA had no significant
effect on the activities of CYP1A2, CYP2E1 and CYP3A4 enzymes in
HaCaT cells. Moreover, the underlying mechanisms may be related to
the decrease in production of ROS in HaCaT cells, which increased
the production levels of key antioxidant factors and the
antioxidative ability of cells, and was associated with a
protective effect against oxidative damage.
Acknowledgements
Not applicable.
Funding
This work was financially supported by the National
Natural Science Foundation (grant no. 81460607), Jiangxi Natural
Science Foundation (grant no. 20202BAB206081) and Jiangxi
University of Traditional Chinese Medicine 1050 Youth Talent
Project (grant. no. 1142001007).
Availability of data and materials
All data generated or analyzed during this study are
included in this published article.
Authors' contributions
JZ, YG and LC were responsible for the conception
and design of the study, acquisition, analysis and interpretation
of the data, the drafting and writing of the manuscript, and
revisions to its intellectual content. LH and LT were involved in
the conception of the study, acquisition, analysis and
interpretation of the data, and the drafting of the manuscript. WZ,
ZZ and CJ contributed to acquisition and analysis of the data, and
the drafting and revision of the manuscript. LC was responsible for
the conception and design of the experiments, analysis and
interpretation of the data, the drafting of the manuscript, and
revisions to its intellectual content. All authors have read and
approved the final manuscript.
Ethics approval and consent to
participate
Not applicable.
Patient consent for publication
Not applicable.
Competing interests
The authors declare that they have no competing
interests.
References
|
1
|
Tu L, Su P, Zhang Z, Gao L, Wang J, Hu T,
Zhou J, Zhang Y, Zhao Y, Liu Y, et al: Genome of tripterygium
wilfordii and identification of cytochrome P450 involved in
triptolide biosynthesis. Nat Commun. 11(971)2020.PubMed/NCBI View Article : Google Scholar
|
|
2
|
Cai A, Qi S, Su Z, Shen H, Ma W and Dai Y:
Tripterygium glycosides inhibit inflammatory mediators in the rat
synovial RSC-364 cell line stimulated with interleukin-1β. Biomed
Rep. 3:763–766. 2015.PubMed/NCBI View Article : Google Scholar
|
|
3
|
Cui J, Chen X and Su J: Advanced progress
of main pharmacology activities of triptolide. Zhongguo Zhong Yao
Za Zhi. 42:2655–2658. 2017.(In Chinese). PubMed/NCBI View Article : Google Scholar
|
|
4
|
Wang J, Chu Y and Zhou X: Inhibitory
effect of triperygium wilfordii polyglucoside on dipeptidyl
peptidase I in vivo and in vitro. Biomed Pharmacother. 96:466–470.
2017.PubMed/NCBI View Article : Google Scholar
|
|
5
|
Fan D, Guo Q, Shen J, Zheng K, Lu C, Zhang
G, Lu A and He X: The effect of triptolide in rheumatoid arthritis:
From basic research towards clinical translation. Int J Mol Sci.
19(376)2018.PubMed/NCBI View Article : Google Scholar
|
|
6
|
Gu Y, Yang M, Tang X, Wang T, Yang D, Zhai
G and Liu J: Lipid nanoparticles loading triptolide for transdermal
delivery: Mechanisms of penetration enhancement and transport
properties. J Nanobiotechnology. 16(68)2018.PubMed/NCBI View Article : Google Scholar
|
|
7
|
Shan Q, Jiang X, Wang F, Shu Z and Gui S:
Cubic and hexagonal liquid crystals as drug carriers for the
transdermal delivery of triptolide. Drug Deliv. 26:490–498.
2019.PubMed/NCBI View Article : Google Scholar
|
|
8
|
Zhang L, Chang J, Zhao Y, Xu H, Wang T, Li
Q, Xing L, Huang J, Wang Y and Liang Q: Fabrication of a
triptolide-loaded and poly-γ-glutamic acid-based amphiphilic
nanoparticle for the treatment of rheumatoid arthritis. Int J
Nanomedicine. 13:2051–2064. 2018.PubMed/NCBI View Article : Google Scholar
|
|
9
|
Zhao Y, Guan Y, Le X, Zhu W and Chen L:
Experimental research on acute toxicity and skin irritation of
triptolide microemulsion gel. Shanghai Chin Med J. 44:75–77.
2010.
|
|
10
|
Mathew S and Abraham TE: Bioconversions of
ferulic acid, an hydroxycinnamic acid. Crit Rev Microbiol.
32:115–125. 2006.PubMed/NCBI View Article : Google Scholar
|
|
11
|
Ganesan R and Rasool M: Ferulic acid
inhibits interleukin 17-dependent expression of nodal pathogenic
mediators in fibroblast-like synoviocytes of rheumatoid arthritis.
J Cell Biochem: Aug 30, 2018 (Epub ahead of print). doi:
10.1002/jcb.27502. 2018.
|
|
12
|
Sgarbossa A, Giacomazza D and Di Carlo M:
Ferulic acid: A hope for Alzheimer's disease therapy from plants.
Nutrients. 7:5764–5782. 2015.PubMed/NCBI View Article : Google Scholar
|
|
13
|
Tao L, Xiao F, Zhu W, Chen L, Guan Y, Jin
C and Wu L: Attenuation effect of tripterygii Radix et Rhizoma.
Chin J Exp Trad Med For. 23:230–234. 2017.(In Chinese).
|
|
14
|
Tao L, Guan Y, Chen L, Xiao F, Jin C and
Zang Z: Research progress on detoxicity by tripterygii Radix et
Rhizoma compatibility. Chin J Exp Trad Med For. 24:2292018.(In
Chinese).
|
|
15
|
Guan Y, Tao L, Xiao F, Chen L, Zhu Y, Jin
C and Zang Z: Prescription rules of preparations containing
tripterygium wilfordii Hook.f.against rheumatoid arthritis. Chin J
Hosp Pharm. 38:64–68. 2018.(In Chinese).
|
|
16
|
Park JH, Lee JE, Choi SS and Park TH:
Protective effects of silkworm hemolymph extract and its fractions
on UV-induced photoaging. Biotechnol Bioprocess Engineering.
22:37–44. 2017.
|
|
17
|
Farrar MD, Nicolaou A, Clarke KA, Mason S,
Massey KA, Dew TP, Watson RE, Williamson G and Rhodes LE: A
randomized controlled trial of green tea catechins in protection
against ultraviolet radiation-induced cutaneous inflammation. Am J
Clin Nutr. 102:608–615. 2015.PubMed/NCBI View Article : Google Scholar
|
|
18
|
Narasaiah UL: Antioxidants and Human
Diseases. In: Clinica Chimica Acta. PubMed, p16, 2014.
|
|
19
|
Swanson HI: Cytochrome P450 expression in
human keratinocytes: An aryl hydrocarbon receptor perspective. Chem
Biol Interact. 149:69–79. 2004.PubMed/NCBI View Article : Google Scholar
|
|
20
|
Smith G, Wolf CR, Deeni YY, Dawe RS, Evans
AT, Comrie MM, Ferguson J and Ibbotson SH: Cutaneous expression of
cytochrome P450 CYP2S1: Individuality in regulation by therapeutic
agents for psoriasis and other skin diseases. Lancet.
361:1336–1343. 2003.PubMed/NCBI View Article : Google Scholar
|
|
21
|
Chopra D, Ray L, Dwivedi A, Tiwari SK,
Singh J, Singh KP, Kushwaha HN, Jahan S, Pandey A, Gupta SK, et al:
Photoprotective efficiency of PLGA-curcumin nanoparticles versus
curcumin through the involvement of ERK/AKT pathway under ambient
UV-R exposure in HaCaT cell line. Biomaterials. 84:25–41.
2016.PubMed/NCBI View Article : Google Scholar
|
|
22
|
Fabian E, Vogel D, Blatz V, Ramirez T,
Kolle S, Eltze T, van Ravenzwaay B, Oesch F and Landsiedel R:
Xenobiotic metabolizing enzyme activities in cells used for testing
skin sensitization in vitro. Arch Toxicol. 87:1683–1696.
2013.PubMed/NCBI View Article : Google Scholar
|
|
23
|
Bi YF, Zheng Z, Pi ZF, Liu ZQ and Song FR:
The metabolic fingerprint of the compatibility of Radix Aconite and
Radix Paeoniae Alba and its effect on CYP450 enzymes. Yao Xue Xue
Bao. 49:1705–1710. 2014.(In Chinese). PubMed/NCBI
|
|
24
|
Liao HW, Chen GY, Wu MS, Liao WC, Tsai IL
and Kuo CH: Quantification of endogenous metabolites by the
postcolumn infused-internal standard method combined with matrix
normalization factor in liquid chromatography-electrospray
ionization tandem mass spectrometry. J Chromatogr A. 1375:62–68.
2015.PubMed/NCBI View Article : Google Scholar
|
|
25
|
Liu JQ, Li Q, Zhang R, Liu F, Zhang W, He
ZH, Hong Q, Kou XL and Wu JM: LC-MS/MS studies on effect of
Glycyrrhiza uralensis on metabolism, distribution and
excretion of triptolide in rat. Chin J Pharm Anal. 30:1664–1671.
2010.
|
|
26
|
Huang QX, Lei HH, Tang HR and Wang YL:
Quantitative analysis of ceramides by ultrahigh-performance liquid
chromatography tandem mass spectrometry. Journal of Shanghai Jiao
Tong University. 39:1353–1359. 2019.
|
|
27
|
Eagling VA, Tjia JF and Back DJ:
Differential selectivity of cytochrome P450 inhibitors against
probe substrates in human and rat liver microsomes. Br J Clin
Pharmacol. 45:107–114. 1998.PubMed/NCBI View Article : Google Scholar
|
|
28
|
Liu A, Qi X, Zhang YC, Xu TX, Yi J and
Yang J: Principle and applications of fluorescent probes for
intracellular redox detection. J Shanghai Jiao Tong University
(Medical Edition). 38:101–107. 2018.
|
|
29
|
Chen XF: Current and future technological
advances in transdermal gene delivery. Adv Drug Deliv Rev.
127:85–105. 2018.PubMed/NCBI View Article : Google Scholar
|
|
30
|
Cui L, Jia Y, Cheng Z, Gao Y, Zhang G, Li
J and He C: Advancements in the maintenance of skin barrier/skin
lipid composition and the involvement of metabolic enzymes. J
Cosmet Dermatol. 15:549–558. 2016.PubMed/NCBI View Article : Google Scholar
|
|
31
|
Hou CS, Yang ZH and Sun XB: Progress of
‘cocktail’ probe substrates approach and its application in studies
of traditional Chinese materia medica on cytochrome P450 system.
Chin J Pharmacol Toxicol. 27:445–450. 2013.
|
|
32
|
De Andrés F, Terán S, Bovera M, Fariñas H,
Terán E and LLerena A: Multiplex phenotyping for systems medicine:
A one-point optimized practical sampling strategy for simultaneous
estimation of CYP1A2, CYP2C9, CYP2C19, and CYP2D6 activities using
a cocktail approach. Omics. 20:88–96. 2016.PubMed/NCBI View Article : Google Scholar
|
|
33
|
Bi Y, Zheng Z, Pi Z, Liu Z and Song F: The
metabolic fingerprint of the compatibility of radix aconite and
radix paeoniae alba and its effect on CYP450 enzymes. Yao Xue Xue
Bao. 49:1705–1710. 2014.(In Chinese). PubMed/NCBI
|
|
34
|
Tai T, Huang X, Su Y, Ji J, Su Y, Jiang Z
and Zhang L: Glycyrrhizin accelerates the metabolism of triptolide
through induction of CYP3A in rats. J Ethnopharmacol. 152:358–363.
2014.PubMed/NCBI View Article : Google Scholar
|
|
35
|
Xu Y, Zhang YF, Chen XY and Zhong DF:
CYP3A4 inducer and inhibitor strongly affect the pharmacokinetics
of triptolide and its derivative in rats. Acta Pharmacol Sin.
39:1386–1392. 2018.PubMed/NCBI View Article : Google Scholar
|
|
36
|
Martignoni M, Groothuis GM and de Kanter
R: Species differences between mouse, rat, dog, monkey and human
CYP-mediated drug metabolism, inhibition and induction. Expert Opin
Drug Metab Toxicol. 2:875–894. 2006.PubMed/NCBI View Article : Google Scholar
|
|
37
|
Uno Y, Hosaka S, Matsuno K, Nakamura C,
Kito G, Kamataki T and Nagata R: Characterization of cynomolgus
monkey cytochrome P450 (CYP) cDNAs: Is CYP2C76 the only
monkey-specific CYP gene responsible for species differences in
drug metabolism? Arch Biochem Biophys. 466:98–105. 2007.PubMed/NCBI View Article : Google Scholar
|
|
38
|
Heikkinen AT, Friedlein A, Matondo M,
Hatley OJ, Petsalo A, Juvonen R, Galetin A, Rostami-Hodjegan A,
Aebersold R, Lamerz J, et al: Quantitative ADME Proteomics-CYP and
UGT enzymes in the beagle dog liver and intestine. Pharm Res.
32:74–90. 2015.PubMed/NCBI View Article : Google Scholar
|
|
39
|
Fujii H, Emoto M and Sato-Akaba H: Brain
redox imaging using in vivo electron paramagnetic resonance imaging
and nitroxide imaging probes. Magnetochemistry. 5(11)2019.
|
|
40
|
Volpe CM, Villar-Delfino PH, dos Anjos PM
and Nogueira-Machado JA: Cellular death, reactive oxygen species
(ROS) and diabetic complications. Cell Death Dis.
9(119)2018.PubMed/NCBI View Article : Google Scholar
|
|
41
|
Labuschagne CF and Brenkman AB: Current
methods in quantifying ROS and oxidative damage in caenorhabditis
elegans and other model organism of aging. Ageing Res Rev.
12:918–930. 2013.PubMed/NCBI View Article : Google Scholar
|
|
42
|
Poljsak B, Šuput D and Milisav I:
Achieving the balance between ROS and antioxidants: When to use the
synthetic antioxidants. Oxid Med Cell Longev.
2013(956792)2013.PubMed/NCBI View Article : Google Scholar
|
|
43
|
Slatter DA, Bolton CH and Bailey AJ: The
importance of lipid-derived malondialdehyde in diabetes mellitus.
Diabetologia. 43:550–557. 2000.PubMed/NCBI View Article : Google Scholar
|
|
44
|
Cacciatore I, Baldassarre L, Fornasari E,
Mollica A and Pinnen F: Recent advances in the treatment of
neurodegenerative diseases based on GSH delivery systems. Oxid Med
Cell Longev. 2012(240146)2012.PubMed/NCBI View Article : Google Scholar
|
|
45
|
Shen SC, Lee WR, Yang LY, Tsai HH, Yang LL
and Chen YC: Quercetin enhancement of arsenic-induced apoptosis via
stimulating ROS-dependent p53 protein ubiquitination in human HaCaT
keratinocytes. Exp Dermatol. 21:370–375. 2012.PubMed/NCBI View Article : Google Scholar
|
|
46
|
He L, Tao L, Guan Y, Chen L, Zhu W, Jin C
and Wu L: Preparation and evaluation of triptolide and ferulic acid
ethosomes. Chin Tradit Herbal Drugs. 49:2817–2825. 2018.PubMed/NCBI View Article : Google Scholar
|
|
47
|
Cao L, Li H, Yan M, Li Z, Gong H, Jiang P,
Deng Y, Fang P and Zhang B: The protective effects of
isoliquiritigenin and glycyrrhetinic acid against
triptolide-induced oxidative stress in HepG2 cells involve Nrf2
activation. Evid Based Complement Alternat Med.
2016(8912184)2016.PubMed/NCBI View Article : Google Scholar
|
|
48
|
Vomund S, Schäfer A, Parnham M, Brüne B
and von Knethen A: Nrf2, the master regulator of anti-oxidative
responses. Int J Mol Sci. 18(2772)2017.PubMed/NCBI View Article : Google Scholar
|
|
49
|
Ishii T and Warabi E: Mechanism of rapid
nuclear factor-E2-related factor 2 (Nrf2) activation via
membrane-associated estrogen receptors: Roles of NADPH oxidase 1,
neutral sphingomyelinase 2 and epidermal growth factor receptor
(EGFR). Antioxidants (Basel). 8(69)2019.PubMed/NCBI View Article : Google Scholar
|
|
50
|
Oyake T, Itoh K, Motohashi H, Hayashi N,
Hoshino H, Nishizawa M, Yamamoto M and Igarashi K: Bach proteins
belong to a novel family of BTB-basic leucine zipper transcription
factors that interact with MafK and regulate transcription through
the NF-E2 site. Mol Cell Biol. 16:6083–6095. 1996.PubMed/NCBI View Article : Google Scholar
|
|
51
|
Gan L and Johnson JA: Oxidative damage and
the Nrf2-ARE pathway in neurodegenerative diseases. Biochim Biophys
Acta. 1842:1208–1218. 2014.PubMed/NCBI View Article : Google Scholar
|
|
52
|
Tang W, Jiang YF, Ponnusamy M and Diallo
M: Role of Nrf2 in chronic liver disease. World J Gastroenterol.
20:13079–13087. 2014.PubMed/NCBI View Article : Google Scholar
|
|
53
|
Wang Y, Guo SH, Shang XJ, Yu LS, Zhu JW,
Zhao A, Zhou YF, An GH, Zhang Q and Ma B: Triptolide induces
Sertoli cell apoptosis in mice via ROS/JNK-dependent activation of
the mitochondrial pathway and inhibition of Nrf2-mediated
antioxidant response. Acta Pharmacol Sin. 39:311–327. 2018.
|