Introduction
Post-spinal anesthesia hypotension during cesarean
section may lead to severe maternal and fetal morbidity (1). Many techniques have been developed to
prevent post-spinal anesthesia hypotension such as pre-hydration
with crystalloids or colloids, preventive usage of ephedrine or
phenylephrine and lower leg compression (2). However, a method that would allow the
accurate prediction of patient risk of hypotension would be
beneficial for the development of a management strategy for each
individual patient.
Several methods for predicting the risk of
post-spinal anesthesia hypotension have been investigated,
including heart rate variability, perfusion index (PI), skin
conductance, pleth variability index (PVi), sensory block level and
bioimpedance-based hemodynamic monitoring. However, none of these
methods has been widely adopted in clinical practice due to
variability in the accuracy of results (3-8).
The recently developed bioreactance-based non-invasive cardiac
output monitoring (NICOM™) system (Cheetah Medical;
Baxter International Inc.) provides an accurate monitoring method
for parturients under spinal anesthesia (9). Unlike bioimpedance, bioreactance is
accompanied by fewer adverse effects associated with body movement
(9,10). However, frequent position
alterations during induction of spinal anesthesia have been
commonly observed. On the other hand, the bioreactance-based
NICOM™ system has been indicated to minimize the
inaccuracy due to alterations in the patient position during and
after spinal anesthesia, such as the difference between the supine
and left tilt (11). Volume status
may affect post-spinal anesthesia hypotension (12). The present study hypothesized that
baseline hemodynamic parameters, such as cardiac output index (CI),
total peripheral resistance index (TPRI) and stroke volume (SV),
obtained via the NICOM™ system, could be used to predict
the risk of post-spinal anesthesia hypotension regardless of the
patient's post-anesthetic position. Therefore, an open label, case
controlled, observational study was designed to evaluate the
association between the parameters measured with the
NICOM™ system and the risk of post-spinal anesthesia
hypotension.
Materials and methods
Ethics
The present prospective, observational study was
designed as part of the trial of left tilt in preventing
hypotension (Chinese Clinical Trial Registry no.
ChiCTR-IOR-15007087). The present study was approved by the
Institutional Review Board of the Changhua Christian Hospital
(Changhua, Taiwan; protocol no. 150605) and registered in the
Chinese Clinical Trial Register. Written informed consents were
obtained from each participant before inclusion.
Study population
A total of 80 full-term, parturients with singleton
pregnancies scheduled for elective cesarean delivery were included
in the study. The exclusion criteria were as follows: Parturients
with multiple pregnancies, current labor, a history of
hypertension, pre-eclampsia, obesity [body mass index (BMI) >35
kg/m2], heart disease, diabetes, placenta previa and
fetal distress.
Study protocol
All participants were allocated to either the supine
group (supine position after spinal anesthesia) or the left tilt
group (15˚ left lateral table tilt after spinal anesthesia). Group
allocation was determined using a computerized random number table
and the sealed envelope technique (13). All parturients received standard
treatment in all aspects except the position of the body following
anesthesia. Within 20 min of arrival at the operating room, all
parturients were treated with 750 ml of 0.9% saline via a 20-gauge
cannula. Patients were simultaneously subjected to pulse oximetry,
electrocardiography and non-invasive blood pressure measurements
using the NICOM™ system with a cuff on the left arm.
Following automatic calibration of the NICOM™ system,
three data points for blood pressure (mmHg), CI
(l/min/m2), TPRI (dynes/s/cm5/m2)
and SV (ml/beat) were averaged within 5 min of hydration with 2.5
min intervals as the baseline data.
A standard spinal anesthesia dose with 2.4 ml of
0.5% hyperbaric bupivacaine, 10 µg of fentanyl and 0.2 mg of
morphine was injected to all parturients via a 25-gauge spinal
needle at the L3-L4 interspace in the right lateral position.
Patients in the supine group were placed in the supine position and
those in the left tilt group in a 15 left lateral table tilt
immediately after spinal anesthesia. Subsequently, blood pressure
was recorded at 1, 3, 5, 7 and 10 min following spinal anesthesia.
Post-spinal anesthesia hypotension was defined as a decrease in
systolic blood pressure >20%, as previously described (14). For safety reasons, when hypotension
occurred or when clinical signs of hypotension, such as nausea or
vomiting were observed, parturients were treated with 10 mg
ephedrine and its total dose was recorded. Ephedrine dosage >20
mg was considered as high dose usage. Following recording for 10
min, the sensory block level was determined using an alcohol pad
and surgery was then performed.
Statistical analysis
Power analysis using data from our pilot study with
20 participants indicated that for a rate of 50% post-spinal
anesthesia hypotension, 42 subjects were required to detect a
difference between the low- and high-CI groups with a power of 0.8
and alpha of 0.05, which was comparable to that of previous study
(14). Student's t-test,
χ2 test or Fisher's exact test were performed when
appropriate, to evaluate patient's characteristics, namely neonatal
weight, Apgar score, level of anesthesia and pre-anesthetic CI,
TPRI and SV. Receiver operating characteristic (ROC) curve analysis
was performed to assess the diagnostic performance of the
pre-anesthetic CI, TPRI and SV for hypotension and high dose
ephedrine usage. The sensitivity, specificity, positive predictive
value (PPV), negative predictive value (NPV), cut-off value and
area under the ROC curve (AUC) were analyzed. Furthermore, Youden's
index was applied to determine the optimal cut-off value. The
cumulative incidence rate of hypotension was evaluated via a
Kaplan-Meier curve. Multivariate analyses were performed using Cox
proportional-hazards and logistic regression models to evaluate the
independent perioperative risk factors for hypotension and high
dose ephedrine usage.
For all data, P<0.05 was considered to indicate a
statistically significant difference. All statistical analyses were
carried out using the SPSS statistical software (version 22; SPSS,
Inc.).
Results
Characteristics of participants
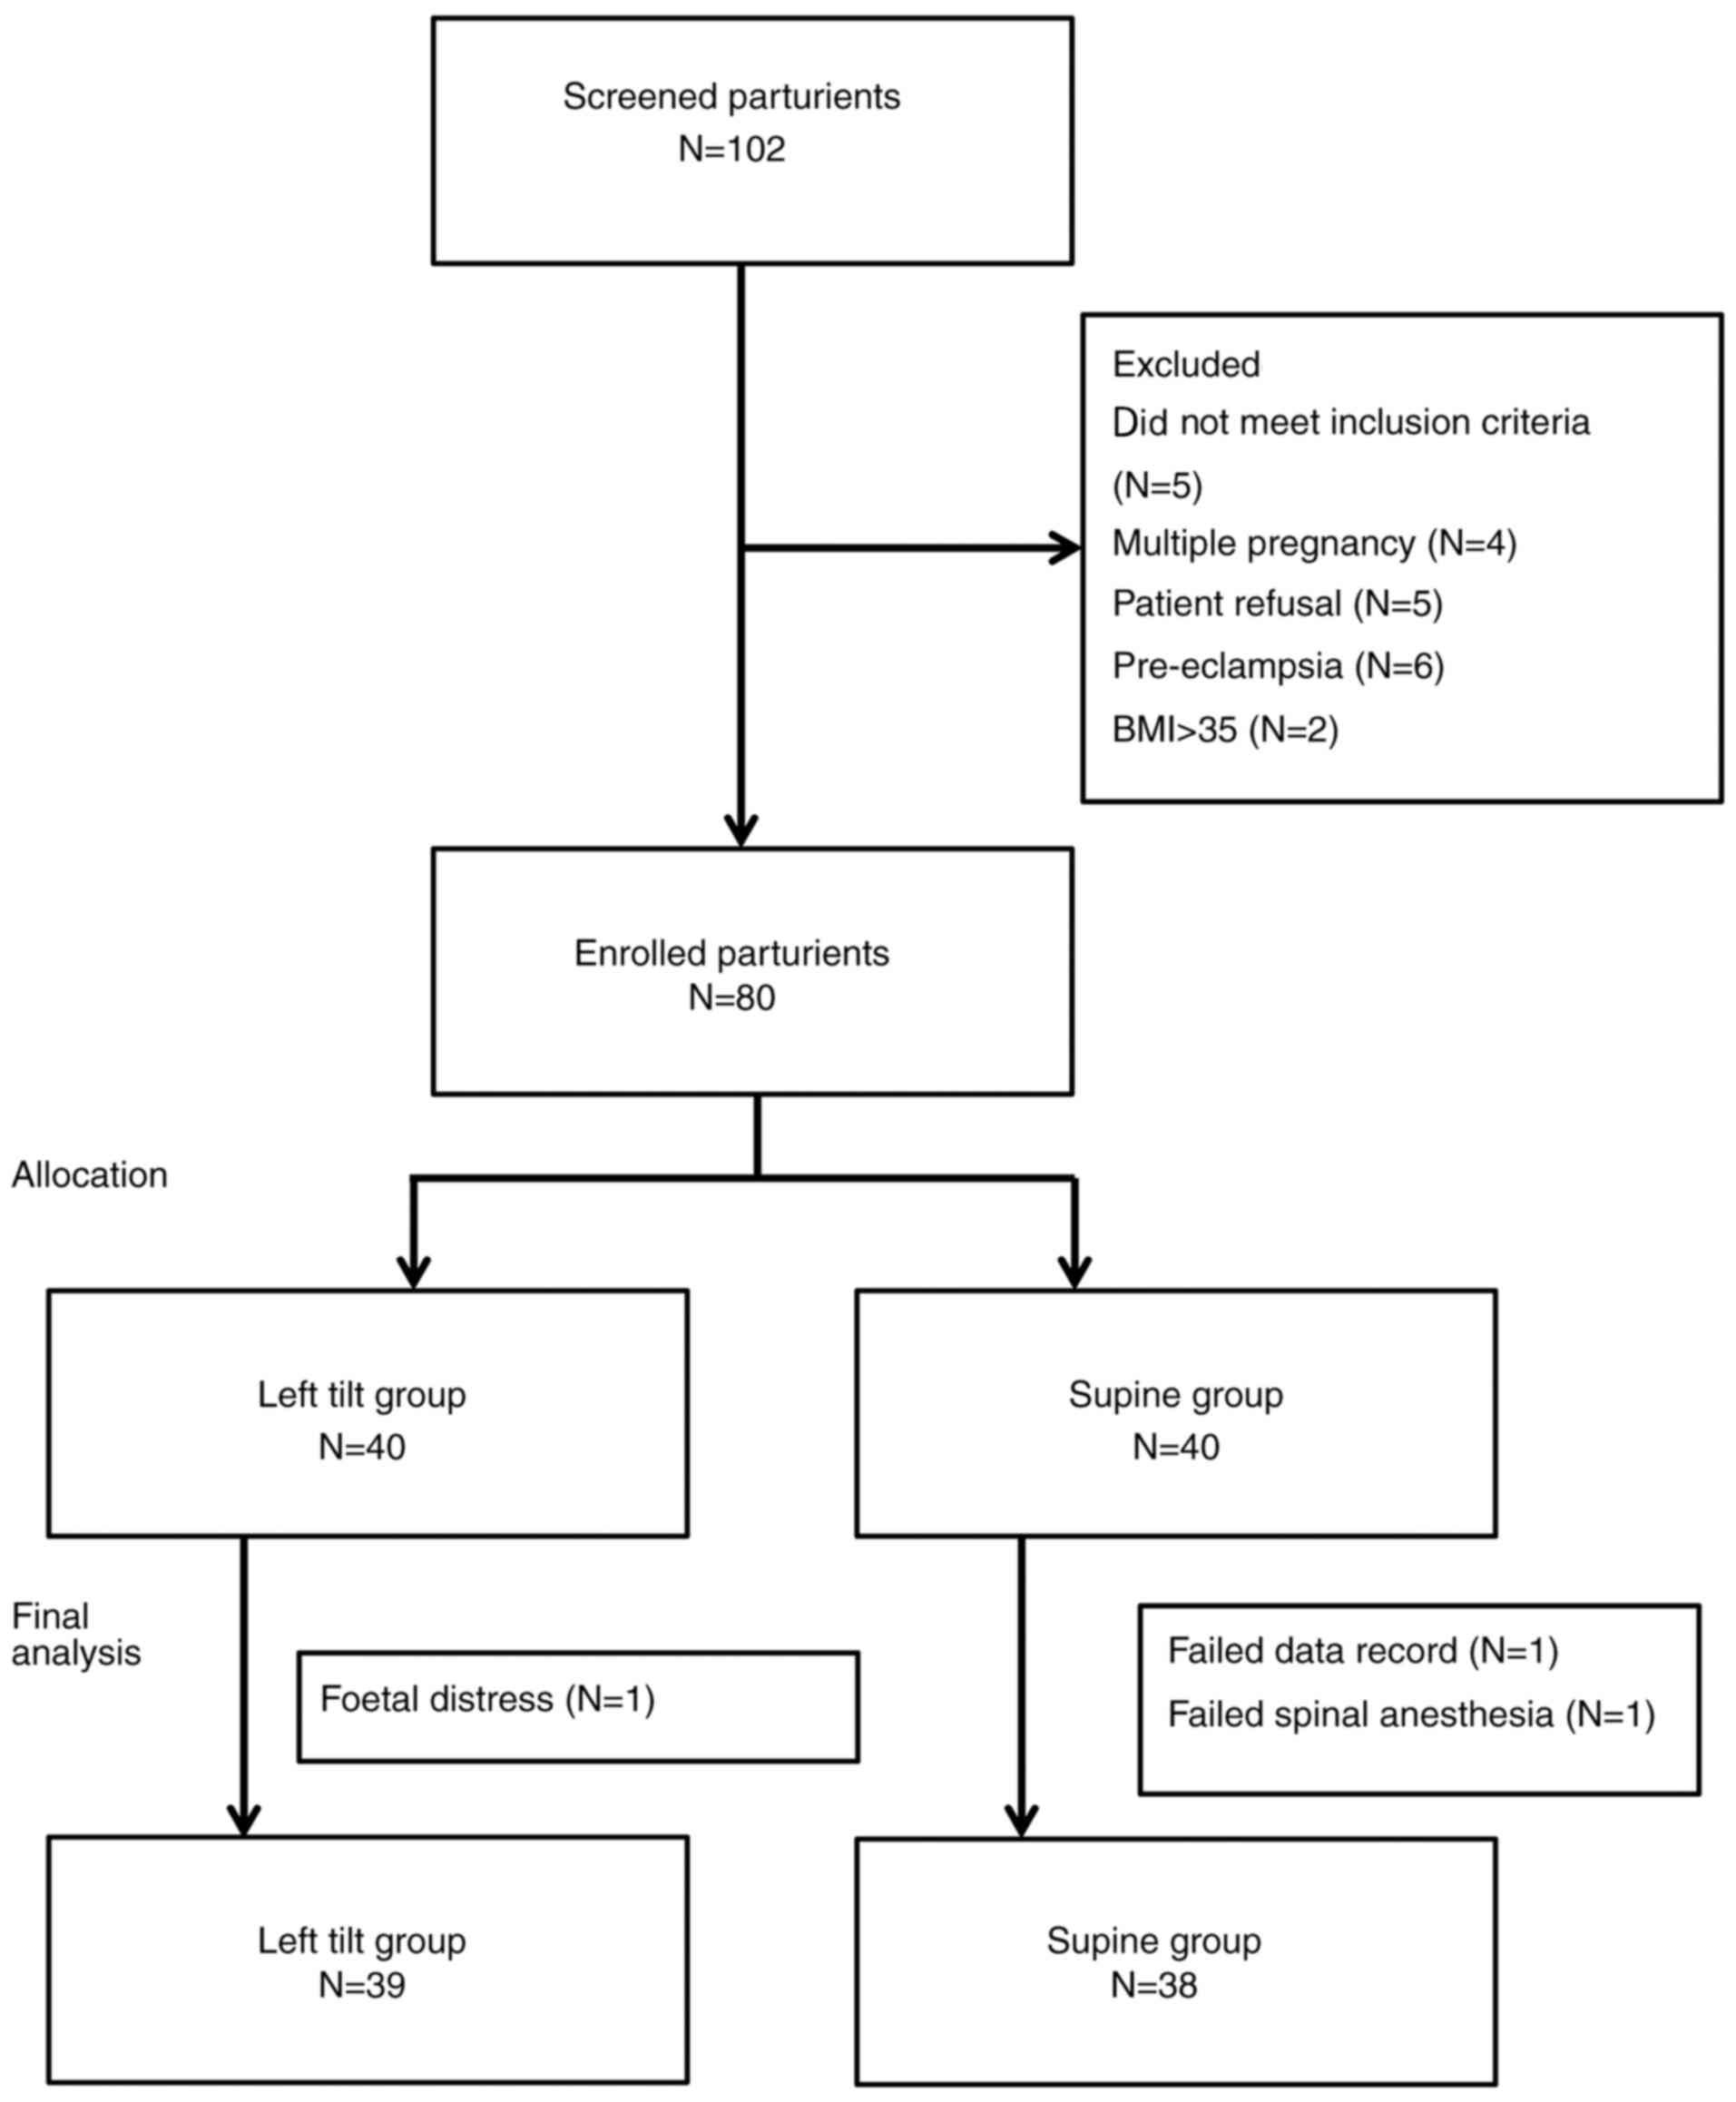
A total of 102 parturients were screened for
eligibility between September 2015 and March 2016 and 80 of them
met the inclusion criteria of the study (age range, 23-44 years;
mean, 33.16 years). Among the 80 parturients, one in the left tilt
group and two in the supine group were excluded from the analysis
due to the development of fetal distress prior the scheduled
operation (left tilt group), an inadequate sensory block level that
required general anesthesia and missing data in the records (supine
group; Fig. 1). The characteristics
of the remaining 77 participants are presented in Tables
I-III. Age, BMI, pre-anesthetic CI, TPRI, SV, sensory block
level, incidence of hypotension, ephedrine dose, neonatal weight
and Apgar score showed no statistically significant differences
between the supine and left tilt groups (Table I).
 | Table ICharacteristics of the participants
sorted by post-anesthesia position. |
Table I
Characteristics of the participants
sorted by post-anesthesia position.
| | Post-anesthesia
position | |
|---|
| Characteristics | Supine (N=38) | Left tilt (N=39) | P-value |
|---|
| Age (years) | 33.47±3.95 | 32.85±4.60 | 0.523 |
| Height (cm) | 159.48±6.45 | 159.67±5.37 | 0.895 |
| Weight (kg) | 67.26±9.01 | 69.18±10.47 | 0.393 |
| BMI | 26.43±3.10 | 27.13±3.96 | 0.390 |
| CI | 3.97±0.55 | 4.00±0.57 | 0.864 |
| TPRI | 1902.34±321.45 | 1917.23±357.10 | 0.848 |
| SV | 85.21±14.16 | 82.44±15.56 | 0.417 |
| SBP (baseline,
mmHg) | 122.37±15.38 | 122.00±14.90 | 0.915 |
| SBP (0 min,
mmHg) | 118.21±19.52 | 117.62±16.47 | 0.885 |
| SBP (2 min,
mmHg) | 106.92±26.12 | 98.41±19.33 | 0.108 |
| SBP (5 min,
mmHg) | 101.68±25.26 | 92.00±19.32 | 0.062 |
| SBP (7 min,
mmHg) | 102.32±19.06 | 97.54±15.96 | 0.236 |
| SBP (10 min,
mmHg) | 103.39±17.02 | 103.44±16.22 | 0.991 |
| Ephedrine dose
(mg) | 12.11±11.19 | 13.59±12.03 | 0.577 |
| Apgar 1 min | 7.97±0.28 | 7.95±0.51 | 0.792 |
| Apgar 5 min | 8.97±0.16 | 9.00±0.23 | 0.564 |
| Neonatal weight
(g) | 3040.26±425.60 | 3098.79±402.03 | 0.537 |
| Sensory block T3
(n, %) | 3, 7.9 | 3, 7.7 | 0.435 |
| Sensory block T4
(n, %) | 31, 81.6 | 35, 89.7 | |
| Sensory block T5
(n, %) | 4, 10.5 | 1, 2.6 | |
Among the 77 participants, 40 (51.9%) developed
hypotension after spinal anesthesia. Within the hypotension group,
BMI, pre-anesthetic CI and ephedrine dosage values were
significantly higher compared with those in the non-hypotension
group (P=0.011, P=0.012 and P=0.003, respectively; Table II). Furthermore, 32 parturients
(44.2%) met the criteria for high dose ephedrine usage. Therefore,
the high dose ephedrine group exhibited a lower mean TPRI and
higher mean sensory block level compared with the low dose
ephedrine group (P=0.002 and P=0.006, respectively; Table III).
| Table IICharacteristics of the participants
sorted by experience of hypotension. |
Table II
Characteristics of the participants
sorted by experience of hypotension.
| | Hypotension | |
|---|
|
Characteristics | No (N=37) | Yes (N=40) | P-value |
|---|
| Age (years) | 32.84±4.35 | 33.45±4.24 | 0.534 |
| Height (cm) | 159.80±6.35 | 159.38±5.51 | 0.756 |
| Weight (kg) | 65.78±8.45 | 70.50±10.43 | 0.033a |
| BMI | 25.73±2.74 | 27.76±3.96 | 0.011a |
| CI | 3.82±0.53 | 4.14±0.54 | 0.012a |
| TPRI | 1962.97±367.69 | 1860.78±304.06 | 0.187 |
| SV | 80.53±13.79 | 86.85±15.31 | 0.062 |
| SBP (baseline,
mmHg) | 119.92±12.81 | 124.28±16.73 | 0.206 |
| SBP (0 min,
mmHg) | 115.46±14.29 | 120.18±20.65 | 0.251 |
| SBP (2 min,
mmHg) | 108.38±14.55 | 97.28±28.12 | 0.032a |
| SBP (5 min,
mmHg) | 102.03±16.80 | 91.93±26.54 | 0.052 |
| SBP (7 min,
mmHg) | 102.92±15.07 | 97.10±19.44 | 0.149 |
| SBP (10 min,
mmHg) | 100.89±13.66 | 105.75±18.64 | 0.194 |
| Ephedrine dose
(mg) | 8.92±9.66 | 16.50±12.10 | 0.003a |
| Apgar 1 min | 7.97±0.16 | 7.95±0.55 | 0.809 |
| Apgar 5 min | 9.00±0.00 | 8.98±0.28 | 0.570 |
| Neonatal weight
(g) | 3068.92±344.13 | 3070.83±470.85 | 0.984 |
| Sensory block T3
(n, %) | 1, 2.7 | 5, 12.5 | 0.134 |
| Sensory block T4
(n, %) | 32, 86.5 | 34, 85.0 | |
| Sensory block T5
(n, %) | 4, 10.8 | 1, 2.5 | |
| Supine (n, %) | 18, 48.6 | 20, 50.0 | 0.906 |
| Left tilt (n,
%) | 19, 51.4 | 20, 50.0 | |
| Table IIICharacteristics of the participants
sorted by level of ephedrine received. |
Table III
Characteristics of the participants
sorted by level of ephedrine received.
| | High dose
ephedrine | |
|---|
| | No (N=43) | Yes (N=34) | P-value |
|---|
| TPRI | 2009.95±377.05 | 1783.32±228.77 | 0.002a |
| Sensory block T3
(n, %) | 0, 0.0 | 6, 17.6 | 0.006a |
| Sensory block T4
(n, %) | 39, 90.7 | 27, 79.4 | |
| Sensory block T5
(n, %) | 4, 9.3 | 1, 2.9 | |
ROC curve analysis
ROC curve analysis was performed to assess the
diagnostic performance of pre-anesthetic CI, TPRI and SV in the
detection of hypotension and high dose ephedrine usage. The results
are presented in Table IV and
Fig. 2. The AUCs of pre-anesthetic
CI, TPRI and SV for hypotension prediction were 0.666, 0.594 and
0.622, respectively, with pre-anesthetic CI reaching statistical
significance (P=0.012). In addition, the AUCs of pre-anesthetic CI,
TPRI and SV for high dose ephedrine prediction were 0.601, 0.682
and 0.479, respectively, with pre-anesthetic TPRI also reaching
statistical significance (P=0.006). The Youden's index was applied
to determine the optimal cut-off values. Therefore, cut-off values
of CI ≥3.68 (sensitivity=85%; specificity=48.6%; PPV=64.2%;
NPV=75.0%) and TPRI ≥1,989 (sensitivity=85.3%; specificity=51.2%;
PPV=58.0%; NPV=81.5%) were set for predicting hypotension and high
dose ephedrine usage, respectively.
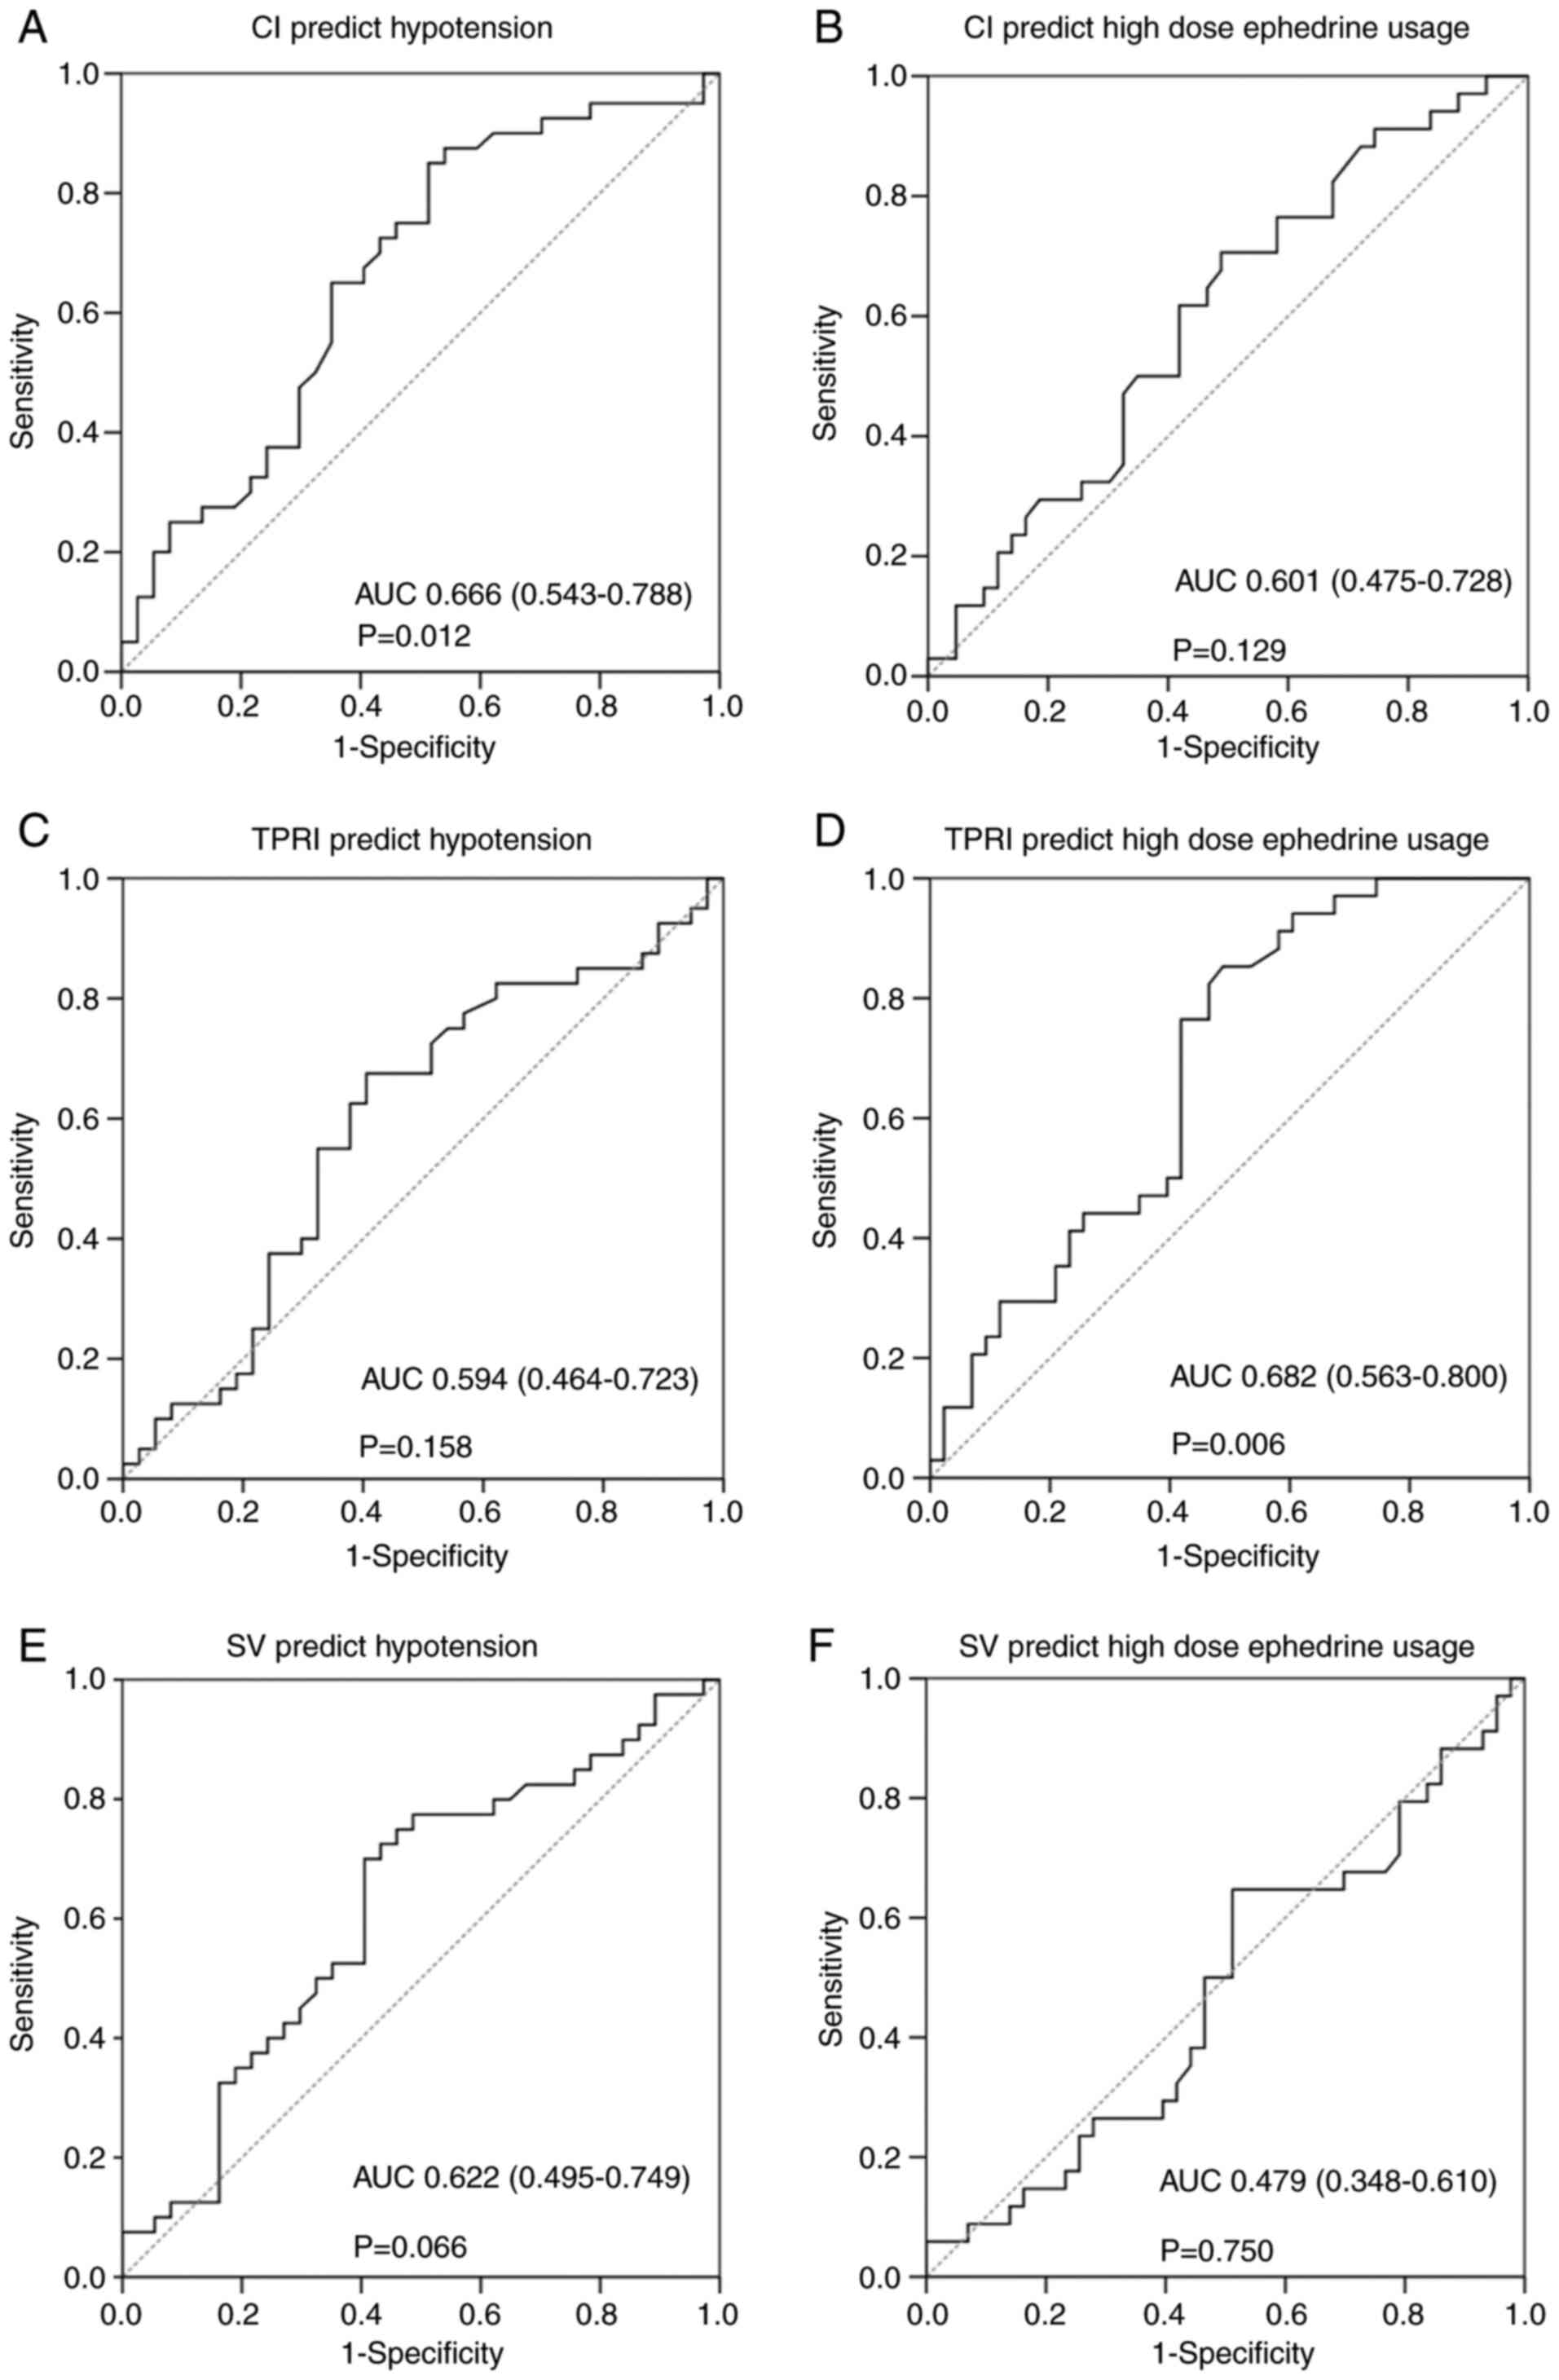 | Figure 2Receiver operating characteristic
curve for (A) baseline CI to predict post-spinal anesthesia
hypotension, with the optimal cutoff point 3.68 using Youden's
index. (B) Baseline CI to predict high dose ephedrine usage, with
the optimal cutoff point 3.88. (C) Baseline TPRI to predict
post-spinal anesthesia hypotension, with the optimal cutoff point
1926. (D) Baseline TPRI to predict high dose ephedrine usage, with
the optimal cutoff point 1989. (E) Baseline SV to predict
post-spinal anesthesia hypotension, with the optimal cutoff point
80.35. (F) Baseline SV to predict high dose ephedrine usage, with
the optimal cutoff point 79.4. AUC, area under the curve; 95%
confidence interval presented in parentheses; CI, cardiac output
index; TPRI, total peripheral resistance index; SV, stroke
volume. |
| Table IVReceiver operating characteristic
curve for CI, TPRI and SV as predictive indicators of post-spinal
anesthesia hypotension and high dose ephedrine usage. |
Table IV
Receiver operating characteristic
curve for CI, TPRI and SV as predictive indicators of post-spinal
anesthesia hypotension and high dose ephedrine usage.
| A, Hypotension |
|---|
| | AUC | 95% CI | Cut-off point | Sensitivity | Specificity | P-value |
|---|
| CI | 0.666 | 0.543-0.788 | ≥3.68 | 0.850 | 0.486 | 0.012a |
| TPRI | 0.594 | 0.464-0.723 | ≥1926 | 0.675 | 0.595 | 0.158 |
| SV | 0.622 | 0.495-0.749 | ≥80.35 | 0.700 | 0.595 | 0.066 |
| B, High dose
ephedrine |
| CI | 0.601 | 0.475-0.728 | ≥3.88 | 0.706 | 0.512 | 0.129 |
| TPRI | 0.682 | 0.563-0.800 | ≥1989 | 0.853 | 0.512 | 0.006a |
| SV | 0.479 | 0.348-0.610 | ≥79.4 | 0.647 | 0.488 | 0.750 |
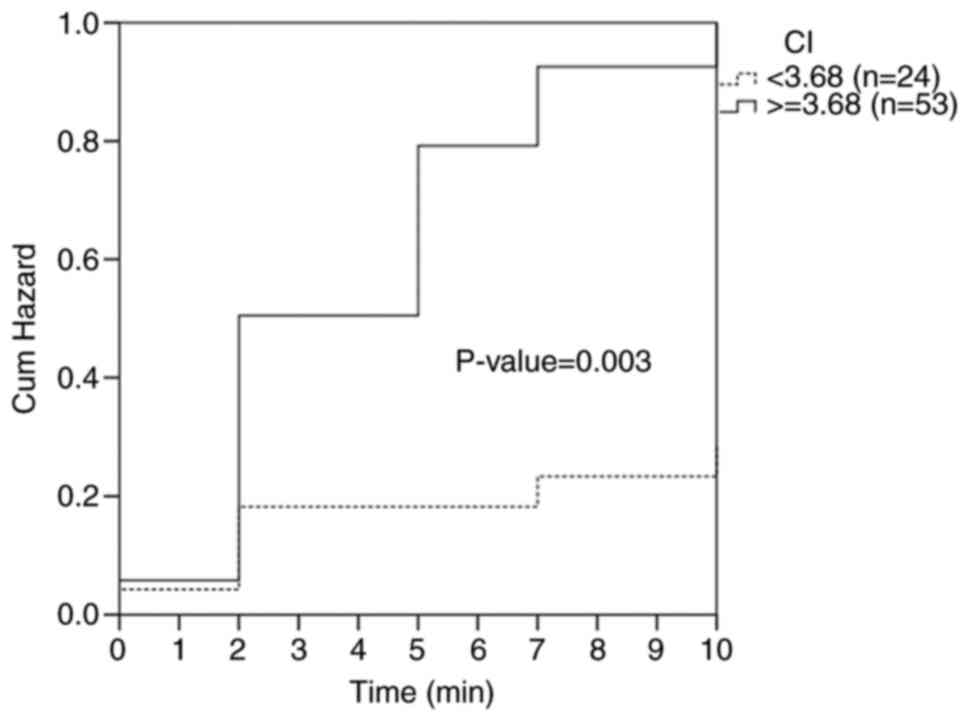
Α Kaplan-Meier plot at the optimal cut-off point is
shown in Fig. 3. The log-rank test
was performed to evaluate the differences in hypotension occurrence
time between the two groups. Mean hypotension occurrence time was
5.8 min with a 95% confidence interval (CI) of 4.8-6.8 min in
parturients with CI ≥3.68 and 8.5 min (95% CI, 7.1-9.9 min) in
parturients with CI <3.68. Pre-anesthetic CI was associated with
hypotension (P=0.003, log-rank test), with an estimated hazard
ratio of 1.862 (95% CI, 1.096-3.163; P=0.022) in the univariate
analysis.
Multivariate logistic regression
analysis
Using multivariate analysis, after adjusting for
other confounding factors, BMI and CI were assessed for their
association with risk of post-anesthetic hypotension. The hazard
ratios were 1.120 and 2.122 for BMI and CI, respectively (P=0.040
and P=0.014). Furthermore, TPRI was independently associated with
high dose ephedrine usage (odds ratio, 0.997; P=0.013). However,
neither hypotension nor high dose ephedrine usage were associated
with post-anesthetic position (Table
V).
| Table VMultivariate logistic regression for
post-spinal anesthesia hypotension and high dose ephedrine
usage. |
Table V
Multivariate logistic regression for
post-spinal anesthesia hypotension and high dose ephedrine
usage.
| A, Regression
analysis for hypotension |
|---|
| Factor | Hazard ratio | 95% CI | P-value |
|---|
| Supine
position | 1.000 | | |
| Left tilt
position | 0.891 | 0.467-1.700 | 0.725 |
| Age | 1.018 | 0.934-1.109 | 0.689 |
| BMI | 1.120 | 1.005-1.247 | 0.040a |
| Sensory block
T3 | 1.000 | | |
| Sensory block
T4 | 0.619 | 0.220-1.744 | 0.364 |
| Sensory block
T5 | 0.082 | 0.008-0.855 | 0.037a |
| CI | 2.122 | 1.161-3.876 | 0.014a |
| Baseline SBP | 1.008 | 0.987-1.030 | 0.468 |
| B, Regression
analysis for high dose ephedrine usage |
| | Odds ratio | 95% CI | P-value |
| Supine
position | 1.000 | | |
| Left tilt
position | 1.626 | 0.568-4.651 | 0.365 |
| Age | 0.987 | 0.862-1.130 | 0.849 |
| TPRI | 0.997 | 0.995-0.999 | 0.013a |
| Baseline SBP | 0.968 | 0.568-4.651 | 0.365 |
Discussion
Many attempts have been made to predict
post-neuraxial anesthesia hypotension using PI, PVI or other
hemodynamic parameters (5,15-17).
PI represents a measure of peripheral perfusion, which is affected
by the peripheral vascular tone. It has been reported that PI
>3.5 is considered a fair predictor of post-spinal anesthesia
hypotension (5,15). However, another study failed to
replicate this result (16). This
may be due to methodological differences between the two studies
and factors that affect PI, such as anxiety and patient movement
(16).
PVI is considered to be associated with
intravascular volume and it has been proposed as a predictor of
post-neuraxial anesthesia hypotension in some studies (3,17).
However, one study contradicted this conclusion (16). The reliability of PVI in
spontaneously breathing patients may be the greatest point of
concern for this parameter. It has been demonstrated that heart
rate variability is an effective indicator used to assess central
nervous system autonomic function (4,18-20);
however, due to the complexity of the analysis process the method
is not widely applied in daily clinical practice (4).
The use of hemodynamic parameters obtained using
thoracic electrical bioimpedance techniques to predict
post-neuraxial anesthesia has been also reported (8). However, the effects of variations in
body size and physical factors on electrical conduction have
limited the clinical use of bioimpedance (21). Nevertheless, the accuracy and
predictive value of the bioreactance-based NICOM™ device
has been demonstrated during elective cesarean delivery under
spinal anesthesia (9).
In the present study, the post-anesthetic
hypotension rate was 51.9% and was consistent with that in previous
reports (3,4,7). CI
and BMI were considered independent predictors that could affect
the risk of post-spinal anesthesia hypotension. Furthermore, a left
tilt of 15 did not contribute to the risk for hypotension. Although
former guidelines have suggested an immediate left tilt after
spinal anesthesia (22), recent
studies have reported no improvement in maternal and neonatal
outcomes following a 15 left tilt (23). The results of the present study also
supported this conclusion. Similar to previous studies, this study
showed that a higher BMI was associated with a higher rate of
post-spinal anesthesia hypotension under the same dosage (24,25).
This may result from aortocaval compression and decreased
cerebrospinal fluid volume (26,27).
The results of the present study also revealed that
pre-anesthetic CI could be used to predict the risk of post-spinal
anesthesia hypotension with an AUC of the ROC of 0.666 (95% CI,
0.543-0.788; P=0.012). Unlike a previous report (8), the results showed that TPRI had no
predictive value on post-anesthetic hypotension. This difference
may be associated with several factors, with the first being the
differences in the patient group. For example, unlike the previous
study that enrolled patients with both spinal and epidural
anesthesia (8), in the present
study only parturients who underwent spinal anesthesia were
enrolled. However, whether the results could be extended to
epidural anesthesia or combined spinal-epidural anesthesia remains
unknown. The second factor is that the precision for spontaneous
patient measurement between bioimpedance and bioreactance could
contribute to the study results. It has been suggested that
bioreactance is not affected by the precision of electrode
placement or body movement during respiration (10). Thirdly, the time of baseline data
acquisition and the types of fluid comprise could be another
important issue. For example, the previous study obtained baseline
data after hydration with 1,000 ml lactated Ringer's solution
(8); however, in the present study
only 750 ml 0.9% saline were used for pre-hydration. Pre-hydration
affects the hemodynamic status (28). Therefore, the time of baseline data
acquisition, before or after hydration, could affect the results.
For the same reason, pre-hydration fluid with colloids or
crystalloids and the volume of pre-hydration could also have an
impact on the findings of the present study.
Consistent with a previous meta-analysis, a dose of
20 mg of ephedrine was considered as a high dose (29). Notably, rather than CI, TPRI was
more closely associated with high dose ephedrine usage. It has been
reported that ephedrine exhibits direct and indirect effects on the
sympathetic system, and its responses are considered to be
associated with the sympathetic tone (30-32).
However, whether the baseline TPRI is an indicator of the
sympathetic tone or not is another concern. The precise cause for
the association between TPRI and high ephedrine requirement remains
unknown and requires further research.
The present study has several limitations. Firstly,
in this study, instead of a continuous blood pressure monitor, a
non-invasive blood pressure monitoring device was used. Arterial
cannulation is required for continuous blood pressure monitoring,
which is considered unnecessary in clinical practice. Therefore,
the participants were protected from additional risks. Secondly,
the analysis was conducted for only 10 min following spinal
anesthesia and not throughout the whole procedure. Massive blood
loss and fluid shifting may occur during cesarean section (33) and may complicate the interpretation
of the study results. Furthermore, there were no statistically
significant differences between the hypotension and non-hypotension
groups 5 min following spinal anesthesia due to timely treatment.
Thirdly, the definition of hypotension could affect the cut-off
point for the results. Hypotension was defined as a 20% decrease
from the baseline systolic blood pressure, as previously reported
(14). Fourthly, hemodynamic status
is dynamic. In the current study, the baseline data were obtained
within 15 min of hydration with 750 ml of 0.9% saline. Therefore,
the current findings may be only applied to individuals subjected
to the same protocol.
The present study demonstrated that baseline CI
obtained via the bioreactance-based NICOM™ system could
serve as a predictive indicator for post-spinal anesthesia
hypotension in parturients regardless of the position of the
patient. In addition, baseline TPRI could be used as a potential
predictive indicator of poor ephedrine response. Therefore, the
present anesthesia strategy was designed, including the
prophylactic use of ephedrine or adjustment of pre-hydration volume
according to the baseline hemodynamic data. This non-invasive
method may provide guidance for individualized treatment or
prophylaxis for parturients. However, further studies are required
before the clinical application of the aforementioned findings.
Acknowledgements
Not applicable.
Funding
No funding was received.
Availability of data and materials
The datasets used and/or analyzed during the current
study are available from the corresponding author on reasonable
request.
Authors' contributions
PHY and SET designed the study and collected the
data. YJC analyzed the data. PHY and YJC prepared the initial
manuscript, which was critically revised by SET. All authors read
and approved the final manuscript for publication.
Ethics approval and consent to
participate
The present study was approved by the Institutional
Review Board of Changhua Christian Hospital, protocol number
150605. Written informed consent were obtained from each parturient
before inclusion.
Patient consent for publication
Not applicable.
Competing interests
The authors declare that they have no competing
interests.
References
|
1
|
Corke BC, Datta S, Ostheimer GW, Weiss JB
and Alper MH: Spinal anaesthesia for caesarean section. The
influence of hypotension on neonatal outcome. Anaesthesia.
37:658–62. 1982.PubMed/NCBI View Article : Google Scholar
|
|
2
|
Chooi C, Cox JJ, Lumb RS, Middleton P,
Chemali M, Emmett RS, Simmons SW and Cyna AM: Techniques for
preventing hypotension during spinal anaesthesia for caesarean
section. Cochrane Database Syst Rev. 8(CD002251)2017.PubMed/NCBI View Article : Google Scholar
|
|
3
|
Kuwata S, Suehiro K, Juri T, Tsujimoto S,
Mukai A, Tanaka K, Yamada T, Mori T and Nishikawa K: Pleth
variability index can predict spinal anaesthesia-induced
hypotension in patients undergoing caesarean delivery. Acta
Anaesthesiol Scand. 62:75–84. 2018.PubMed/NCBI View Article : Google Scholar
|
|
4
|
Bishop DG, Cairns C, Grobbelaar M and
Rodseth RN: Heart rate variability as a predictor of hypotension
following spinal for elective caesarean section: A prospective
observational study. Anaesthesia. 72:603–608. 2017.PubMed/NCBI View Article : Google Scholar
|
|
5
|
Toyama S, Kakumoto M, Morioka M, Matsuoka
K, Omatsu H, Tagaito Y, Numai T and Shimoyama M: Perfusion index
derived from a pulse oximeter can predict the incidence of
hypotension during spinal anaesthesia for Caesarean delivery. Br J
Anaesth. 111:235–241. 2013.PubMed/NCBI View Article : Google Scholar
|
|
6
|
Ledowski T, Paech MJ, Browning R, Preuss J
and Schug SA: An observational study of skin conductance monitoring
as a means of predicting hypotension from spinal anaesthesia for
caesarean delivery. Int J Obstet Anesth. 19:282–286.
2010.PubMed/NCBI View Article : Google Scholar
|
|
7
|
Zhang N, He L and Ni JX: Level of sensory
block after spinal anesthesia as a predictor of hypotension in
parturient. Medicine (Baltimore). 96(e7184)2017.PubMed/NCBI View Article : Google Scholar
|
|
8
|
Ouzounian JG, Masaki DI, Abboud TK and
Greenspoon JS: Systemic vascular resistance index determined by
thoracic electrical bioimpedance predicts the risk for maternal
hypotension during regional anesthesia for cesarean delivery. Am J
Obstet Gynecol. 174:1019–1025. 1996.PubMed/NCBI View Article : Google Scholar
|
|
9
|
Doherty A, Ohashi Y, Downey K and Carvalho
JCA: Monitoramento não invasivo baseado na biorreatância revela
instabilidade hemodinâmica significativa durante cesárea eletiva
sob raquianestesia. Rev Bras Anestesiol. 61:326–332. 2011.(In
Portugese).
|
|
10
|
Keren H, Burkhoff D and Squara P:
Evaluation of a noninvasive continuous cardiac output monitoring
system based on thoracic bioreactance. Am J Physiol Heart Circ
Physiol. 293:H583–H589. 2007.PubMed/NCBI View Article : Google Scholar
|
|
11
|
Jakovljevic DG, Trenell MI and MacGowan
GA: Bioimpedance and bioreactance methods for monitoring cardiac
output. Best Pract Res Clin Anaesthesiol. 28:381–394.
2014.PubMed/NCBI View Article : Google Scholar
|
|
12
|
Bonica JJ, Kennedy WF, Akamatsu TJ and
Gerbershagen HU: Circulatory effects of peridural block: 3. Effects
of acute blood loss. Anesthesiology. 36:219–227. 1972.PubMed/NCBI View Article : Google Scholar
|
|
13
|
Kim J and Shin W: How to do random
allocation (randomization). Clin Orthop Surg. 6:103–109.
2014.PubMed/NCBI View Article : Google Scholar
|
|
14
|
Klöhr S, Roth R, Hofmann T, Rossaint R and
Heesen M: Definitions of hypotension after spinal anaesthesia for
caesarean section: Literature search and application to
parturients. Acta Anaesthesiol Scand. 54:909–921. 2010.PubMed/NCBI View Article : Google Scholar
|
|
15
|
Duggappa DR, Lokesh MPS, Dixit A, Paul R,
Raghavendra Rao RS and Prabha P: Perfusion index as a predictor of
hypotension following spinal anaesthesia in lower segment caesarean
section. Indian J Anaesth. 61:649–654. 2017.PubMed/NCBI View Article : Google Scholar
|
|
16
|
Yokose M, Mihara T, Sugawara Y and Goto T:
The predictive ability of non-invasive haemodynamic parameters for
hypotension during caesarean section: A prospective observational
study. Anaesthesia. 70:555–562. 2015.PubMed/NCBI View Article : Google Scholar
|
|
17
|
Sun S and Huang SQ: Role of pleth
variability index for predicting hypotension after spinal
anesthesia for cesarean section. Int J Obstet Anesth. 23:324–329.
2014.PubMed/NCBI View Article : Google Scholar
|
|
18
|
Chamchad D, Arkoosh VA, Horrow JC, Buxbaum
JL, Izrailtyan I, Nakhamchik L, Hoyer D and Kresh JY: Using heart
rate variability to stratify risk of obstetric patients undergoing
spinal anesthesia. Anesth Analg. 99:1818–1821. 2004.PubMed/NCBI View Article : Google Scholar
|
|
19
|
Hanss R, Bein B, Ledowski T, Lehmkuhl M,
Ohnesorge H, Scherkl W, Steinfath M, Scholz J and Tonner PH: Heart
rate variability predicts severe hypotension after spinal
anesthesia for elective cesarean delivery. Anesthesiology.
102:1086–1093. 2005.PubMed/NCBI View Article : Google Scholar
|
|
20
|
Prashanth A, Chakravarthy M, George A,
Mayur R, Hosur R and Pargaonkar S: Sympatho-vagal balance, as
quantified by ANSindex, predicts post spinal hypotension and
vasopressor requirement in parturients undergoing lower segmental
cesarean section: A single blinded prospective observational study.
J Clin Monit Comput. 31:805–811. 2017.PubMed/NCBI View Article : Google Scholar
|
|
21
|
Engoren M and Barbee D: Comparison of
cardiac output determined by bioimpedance, thermodilution, and the
fick method. Am J Crit Care. 14:40–45. 2005.PubMed/NCBI
|
|
22
|
NICE, NIfHaCE: Clinical guidelines and
updates: Caesarean section. Available at: https://www.nice.org.uk/guidance/cg132/chapter/1-guidance.
Accessed Feb 10, 2020.
|
|
23
|
Lee AJ, Landau R, Mattingly JL, Meenan MM,
Corradini B, Wang S, Goodman SR and Smiley RM: Left lateral table
tilt for elective cesarean delivery under spinal anesthesia has no
effect on neonatal acid-base status: A randomized controlled trial.
Anesthesiology. 127:241–249. 2017.PubMed/NCBI View Article : Google Scholar
|
|
24
|
Nani FS and Torres ML: Correlation between
the body mass index (BMI) of pregnant women and the development of
hypotension after spinal anesthesia for cesarean section. Rev Bras
Anestesiol. 61:21–30. 2011.PubMed/NCBI View Article : Google Scholar
|
|
25
|
Wang HZ, Chen HW, Fan YT, Jing YL, Song XR
and She YJ: Relationship between body mass index and spread of
spinal anesthsia in pregnant women: A randomized controlled trial.
Med Sci Monit. 24:6144–6150. 2018.PubMed/NCBI View Article : Google Scholar
|
|
26
|
Gaiser R: Anesthetic considerations in the
obese parturient. Clin Obstet Gynecol. 59:193–203. 2016.PubMed/NCBI View Article : Google Scholar
|
|
27
|
Roofthooft E and Van de Velde M: Low-dose
spinal anaesthesia for Caesarean section to prevent spinal-induced
hypotension. Curr Opin Anaesthesiol. 21:259–262. 2008.PubMed/NCBI View Article : Google Scholar
|
|
28
|
Guinot PG, Bernard E, Defrancq F, Petiot
S, Majoub Y, Dupont H and Lorne E: Mini-fluid challenge predicts
fluid responsiveness during spontaneous breathing under spinal
anaesthesia: An observational study. Eur J Anaesthesiol.
32:645–649. 2015.PubMed/NCBI View Article : Google Scholar
|
|
29
|
Lee A, Ngan Kee WD and Gin T: A
dose-response meta-analysis of prophylactic intravenous ephedrine
for the prevention of hypotension during spinal anesthesia for
elective cesarean delivery. Anesth Analg. 98:483–490.
2004.PubMed/NCBI View Article : Google Scholar
|
|
30
|
Zaimis E: Vasopressor drugs and
catecholamines. Anesthesiology. 29:732–762. 1968.PubMed/NCBI View Article : Google Scholar
|
|
31
|
Alsufyani HA and Docherty JR: Direct and
indirect effects of ephedrine on heart rate and blood pressure in
vehicle-treated and sympathectomised male rats. Eur J Pharmacol.
825:34–38. 2018.PubMed/NCBI View Article : Google Scholar
|
|
32
|
Xia J, Yuan J, Lu X and Yin N: Prone
position results in enhanced pressor response to ephedrine compared
with supine position during general anesthesia. J Clin Anesth.
31:94–100. 2016.PubMed/NCBI View Article : Google Scholar
|
|
33
|
Duthie SJ, Ghosh A, Ng A and Ho PC:
Intra-operative blood loss during elective lower segment caesarean
section. Br J Obstet Gynaecol. 99:364–367. 1992.PubMed/NCBI View Article : Google Scholar
|