Introduction
Physiology of erythropoiesis
The bone marrow located in the membranous bones
(vertebrae, ribs, skull, sternum, shoulder blades and pelvis) is
responsible for erythropoiesis in adult individuals.
The stages of differentiation of the red line starts
from multipotent stem cells (also called hemocytoblasts), goes
through common multipotent myeloid progenitors, unipotent stem
cells, proerythroblasts (also called pronormoblast), basophilic
normoblasts (also called erythroblast-secretes erythroferrone that
inhibits the hepcidin secretion), intermediate
normoblast-polychromatophilic, orthochrome normoblast (the nucleus
is expelled) and reticulocytes (normally accounts for 1% of blood
cells and lasts for 1-2 days until maturation to erythrocytes). In
addition to the nucleus, reticulocytes do not possess mitochondria,
nor Golgi apparatus or endoplasmic reticulum (1).
The duration of erythropoiesis was estimated at
seven days. The mature cells of the erythroid series are anucleated
in mammals, but nucleated in the vast majority of the other
vertebrates. The discoid-biconvex form is not universally
widespread in mammals, with species having small spherical cells,
oval cells, even fusiform, polygonal or angled cells (2).
The progenitor cells undergo a marked reduction in
cell volume starting at 900 fl for precursors and ending with 95 fl
for mature erythrocytes. The reticulocyte is still capable of
hemoglobin synthesis, although it is anucleated. Erythropoiesis is
conditioned by the supply of erythropoietin (of renal and hepatic
origin), folate (vitamin B9) and cyanocobalamin (vitamin B12). The
deficiency of any of these substances results in reticulocytopenia.
Macrophages from the hematogenous marrow under the action of
hepcidin release the sequestered iron to be provided to the
erythrocyte progenitors for hem synthesis (3,4).
The average lifespan of an erythrocyte is 120 days
and, every day, 200 billion red blood cells are released into
circulation and ‘withdrawn’ respectively (1). Subject to capillary deformation, red
blood cells can release ATP and nitric oxide with a vasodilator
role, and upon release of hemoglobin-bound oxygen, they release
S-nitroso-thiols, which also have a vasodilator role (5-7).
Erythrocyte parameters: mean corpuscular volume
(MCV): Normal values between 80 and 100 fl (according to other
sources 80-94 fl); lower values appear in iron deficiency and
thalassemia. Higher values occur in the folate or B12 deficiency,
as well as after chemotherapy. Normal values are present in
aplastic anaemia, chronic disease anaemia or post-chemotherapy
anaemia.
MCH mean corpuscular hemoglobin, the average
hemoglobin load, represents the average amount of hemoglobin per
erythrocyte. Normal values are between 27 and 31 pg. Lower values
occur in hypochromic anaemia and higher values in primary or
post-chemotherapy vitamin B9 or B12 deficiency (8-10).
RDW-CV red blood cell distribution width is a
measure of red cell volume variability (standard deviation of MCV
relative to MCV). Normal values are between 11.5 and 14.5%.
Increased values occur in megalocytic anemias (2/3 of cases), and
low values are constant in iron deficiency anaemia. The high values
of RDW-CV are synonymous with anisocytosis (11).
MCHC medium corpuscular hemoglobin concentration,
the average hemoglobin concentration in erythrocytes, correlates
the hemoglobin cell content with the volume of erythrocytes. It is
expressed in g/dl (as in blood hemoglobin) and has normal values of
34±2 g/dl (9).
Hematological toxicity of
chemotherapy
Hematopoietic bone marrow toxicity is most often the
limiting factor for chemotherapy doses. Increasing the intensity of
chemotherapy doses (higher doses or more frequent administration)
would allow improved antitumor effects, but the hematological side
effects do not allow such dose increases. The possibility of
transfusion for the erythroid concentrates results in a limited
effect of anaemia in the intensity of the prescribed chemotherapy
regimen. However, the need for multiple transfusions and the
associated symptomatology of mild and the medium anaemia decrease
the quality of life and remain valid problems in oncology.
Conversely, studies have shown that chemotherapy
regimens associated with more profound neutropenia and
thrombocytopenia are associated with better survival rates in
colorectal cancers, which is not valid for anaemia, that has a
worse prognosis. Myelosuppression during chemotherapy could be a
biological measure of drug efficacy. It could also be a predictive
factor for treatment success under conditions of interindividual
variability in the activation/metabolization of chemotherapeutic
agents (12). Other studies have
shown a favorable predictive effect on survival and response to
treatment associated with increased MCV (macrocytosis) during
capecitabine treatment in patients with advanced gastric cancer
(13).
The possibility of using granulocyte growth factors
(G-CSF-Filgrastim) for neutropenia prophylaxis during chemotherapy
allows the preservation of chemotherapy dose intensity. However,
studies have shown that deviation of the myeloid line toward
granulocyte precursors exposes patients to more severe anaemia when
their neoplasm was treated with epirubicin and cyclophosphamide
(14).
The classification of anaemia severity as an adverse
effect of the treatments (including chemotherapy) defines grade 1
anaemia at values between 10 g/dl and the lower limit of the normal
according to sex. Grade 2 is between 9.9 and 8.0 g/dl, grade 3 has
values of hemoglobin between 7.9 and 6.5 g/dl and grade 4 <6.5
g/dl.
Nevertheless, the correlation of the anaemia
symptomatology with hemoglobin values is quite weak. From all the
symptoms, fatigue seems to be the cardinal complaint. This symptom
is rarely evaluated and addressed therapeutically, but it is one of
the main causes for the refusal of chemotherapy. Anaemia also
correlates with the ability to perform various
household/professional tasks, as well as with the ability and
willingness to participate in recreational activities. In a study
that evaluated patients with non-small cell lung cancer, grade 2
anaemia was present in 30% of the patients treated after the first
cycle of chemotherapy and in 59% of the patients after 4 cycles of
chemotherapy. Elderly patients with neoplasms may exhibit
anaemia-related symptoms at higher hemoglobin levels compared with
younger patients. The proportion of neoplastic patients requiring
transfusions is maximal in the case of hematological disorder
(lymphomas), lung cancer, gynecological and genito-urinary cancers;
50-60% of these patients need a blood transfusion (15-18).
Treatment options for anaemia caused by chemotherapy
include iron, B9 and B12 - in case of documented deficiencies in
these substances, further stimulation of erythroid series using
erythropoietin, transfusion of cellular concentrate (erythrocyte
concentrate/erythrocyte mass) and rarely whole blood; in case of
emergencies (acute anemias due to bleeding from chronic anaemia),
in addition to erythrocyte mass transfusion, the contribution of
crystalloid solutions and plasma expanders can be considered.
Objectives
The multitude of patients treated with chemotherapy,
the increasing number of treatment lines that have become available
(many of which include chemotherapy) and the legitimate desire to
control the hematological adverse effects of chemotherapy reveal
the necessity for more detailed knowledge of the impact of
cytostatic treatments on hematopoiesis. This study evaluated the
impact of chemotherapies on the current parameters analyzed in the
hemogram, as well as to identify particular evolution profiles
during the treatment.
Materials and methods
The retrospective study was based on 855 clinical
and biological assessments before chemotherapy administration,
selected from December 2018 to February 2020 (chemotherapy regimens
including 5-fluorouracil, cisplatin, docetaxel, epirubicin and
pemetrexed). Only the patients in which the chemotherapy was
initiated during the study period were included. Patients with
chemotherapy in progress in December 2018 were excluded. In total,
523 administrations were performed in men and 332 in women. The
number of individual patients is 250 persons, of which 150 men and
100 women. The average age of the group is 59.46 years (58.49 for
men, 61.03 for women). Height, weight, body mass index (BMI),
complete blood count details, and creatinine were retrieved at each
assessment performed before the initiation of chemotherapy and then
before cycles 2, 3 and 4 of chemotherapy (in fact the data are
those pre-chemotherapy and after the cycle 1, after cycle two and
after administration of cycle three before administration of cycle
4). No data were processed for subsequent cycles because the number
of such cases is too small to allow conclusions. The
fluoropyrimidine and cisplatin-based chemotherapies were accurately
processed because the available cases were numerous.
Results
The number of administrations performed for each
cycle indicates a progressive decrease from one series of
treatments to another (fewer patients reached the next cycle due to
intolerance, disease progression or refusal of treatment). The
maximum number of cycles of chemotherapy per person during the
period studied was 27 (Table
I).
 | Table IDistribution of administrations by
treatment cycles. |
Table I
Distribution of administrations by
treatment cycles.
| Cycle number | 1 | 2 | 3 | 4 | 5 | 6 | 7 | 8 | 9 | 10 |
|---|
| Chemo
administrations | 254 | 172 | 128 | 90 | 49 | 40 | 24 | 20 | 16 | 11 |
Out of the 855 administrations, 231 were for lung,
146 for esophageal and gastric, 145 for colorectal, 52 for ENT, 47
for pancreatic, 36 for breast, 30 for bladder and 28 for testicular
neoplasms.
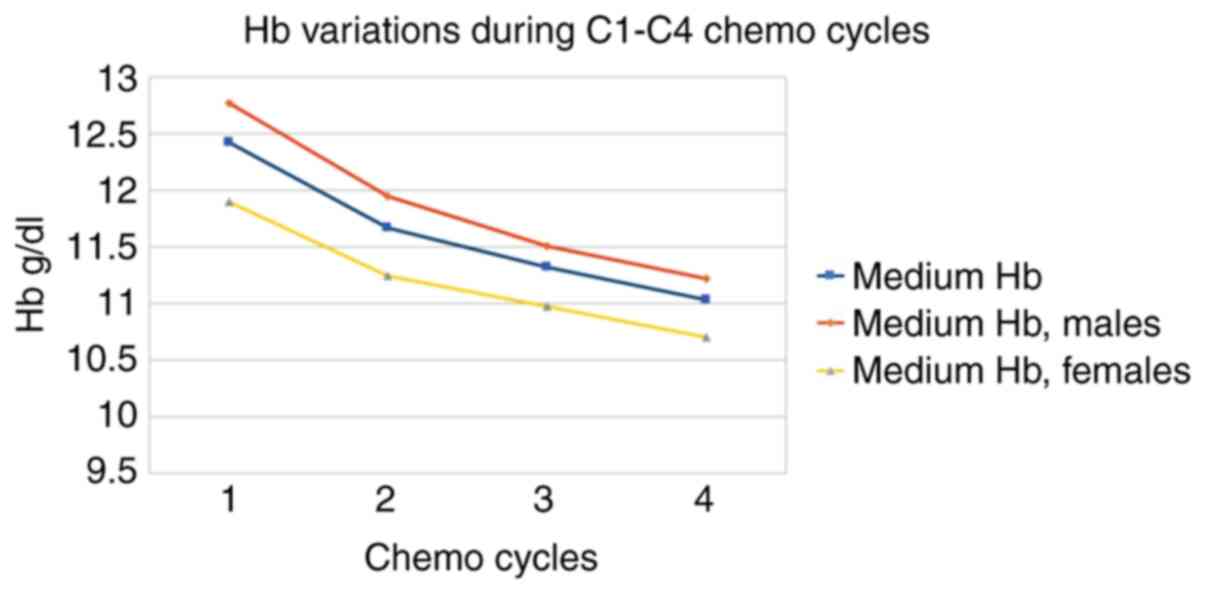
The most interesting parameter is the evolution of
average hemoglobin values for each administration cycle that
reveals different starting levels. We observed higher average
starting values for men (with average onset in the area of mild
anaemia), but with a slightly higher relative decrease in males.
Relative hemoglobin loss is -11% after three cycles of
chemotherapy. The most abrupt decrease was recorded after the first
administration of chemotherapy. The decrease in Hb from C1 to C4
was statistically significant (t-test, P<0.0001). Because of the
progressive decrease of patients after each treatment cycle,
statistical significance (P=0.013) for the difference of Hb in
genders was demonstrated up to C2 (Table II and Fig. 1).
| Table IIEvolution of the mean value of
hemoglobinemia (g/dl) under chemotherapy. |
Table II
Evolution of the mean value of
hemoglobinemia (g/dl) under chemotherapy.
| Cycle number | 1 | 2 | 3 | 4 | ΔC4 vs. C1 % |
|---|
| Medium Hb | 12.42 | 11.67 | 11.32 | 11.03 | -11 |
| Medium Hb, males | 12.77 | 11.95 | 11.51 | 11.22 | -12 |
| Medium Hb,
females | 11.9 | 11.24 | 10.97 | 10.7 | -10 |
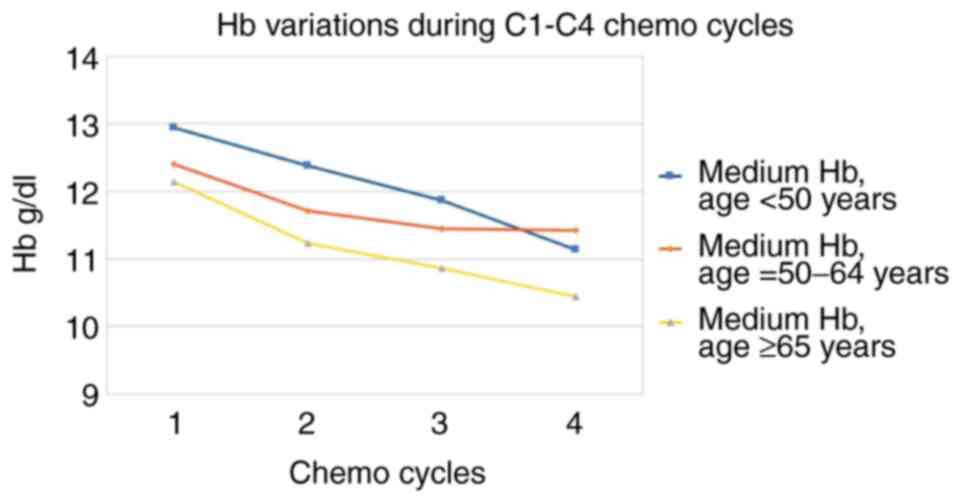
Starting values are higher for patients <50 years
of age and decrease progressively with age. The most significant
decreases during treatment are in the area of patients of extreme
age (<50 or >65). The differences between the group <50
and 50-65 years are statistically significant at C4 (P=0.0025) and
between the group <50 and >65 years only at C3 (P=0.0161) for
the same reasons for a lower number of cases at C4 (Table III and Fig. 2).
| Table IIIEvolution of the average hemoglobin
value (g/dl) by age groups. |
Table III
Evolution of the average hemoglobin
value (g/dl) by age groups.
| Cycle number | 1 | 2 | 3 | 4 | ΔC4 vs. C1 % |
|---|
| Medium Hb, age <50
years | 12.95 | 12.38 | 11.87 | 11.14 | -14 |
| Medium Hb, age =
50-65 years | 12.41 | 11.71 | 11.45 | 11.42 | -8 |
| Medium Hb, age MI ≥65
years | 12.15 | 11.24 | 10.86 | 10.45 | -14 |
A regular or low BMI is associated with lower
starting hemoglobin, overweight patients are initiated with the
best hemoglobin capital, but suffer the most considerable relative
decrease. The differences are statistically significant at C3
between persons with BMI <25 kg/m2 and those with BMI
between 25 and 29 kg/m2 (P=0.0277) (Table IV).
| Table IVEvolution of mean hemoglobin value
(g/dl) by body mass index (BMI, kg/m2) groups. |
Table IV
Evolution of mean hemoglobin value
(g/dl) by body mass index (BMI, kg/m2) groups.
| Cycle number | 1 | 2 | 3 | 4 | ΔC4 vs. C1 % |
|---|
| Medium Hb, BMI <25
kg/m2 | 11.98 | 11.23 | 11.03 | 10.88 | -9 |
| Medium Hb, BMI =
25-29 kg/m2 | 12.98 | 12.14 | 11.81 | 11.31 | -13 |
| Medium Hb, BMI ≥30
kg/m2 | 12.53 | 12.01 | 11.42 | 11.14 | -11 |
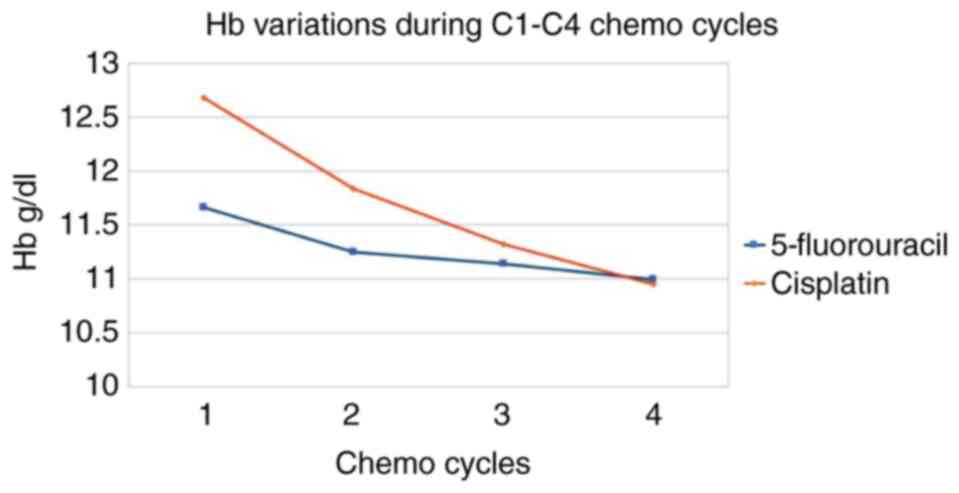
Fluoropyrimidine (5-fluorouracil)-based chemotherapy
induces less severe anaemia compared with that caused by cisplatin.
The decrease in hemoglobin from C1 to C4 is statistically
significant (P<0.0001) (Table V
and Fig. 3).
| Table VEvolution of the average hemoglobin
value (g/dl) according to different chemotherapies. |
Table V
Evolution of the average hemoglobin
value (g/dl) according to different chemotherapies.
| Cycle number | 1 | 2 | 3 | 4 | ΔC4 vs. C1 % |
|---|
| 5-fluorouracil | 11.66 | 11.25 | 11.14 | 10.99 | -6 |
| Cisplatin | 12.68 | 11.84 | 11.32 | 10.95 | -14 |
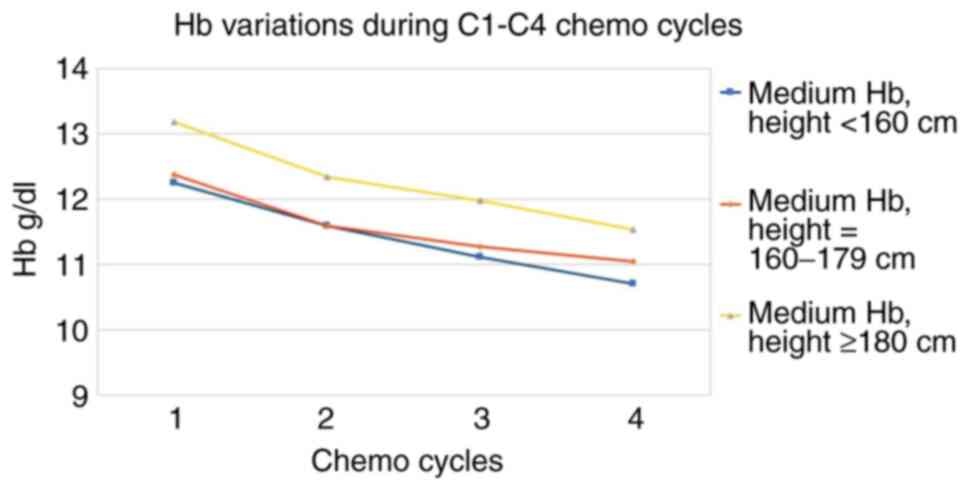
Starting hemoglobin is proportional to the height of
the patients, while the decreases of hemoglobinemia are slightly
lower for the average height people (Table VI and Fig. 4).
| Table VIEvolution of mean hemoglobin value
(g/dl) according to patient height. |
Table VI
Evolution of mean hemoglobin value
(g/dl) according to patient height.
| Cycle number | 1 | 2 | 3 | 4 | ΔC4 vs. C1 % |
|---|
| Medium Hb, h
<160 cm | 12.25 | 11.59 | 11.11 | 10.71 | -13 |
| Medium Hb, h =
160-179 cm | 12.37 | 11.59 | 11.27 | 11.05 | -11 |
| Medium Hb, h ≥180
cm | 13.18 | 12.34 | 11.98 | 11.53 | -13 |
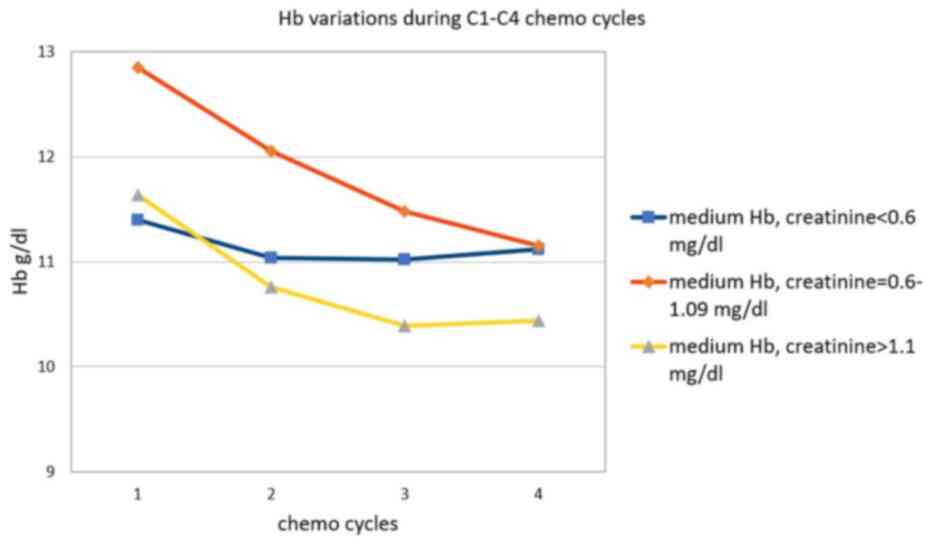
Patients with normal low or under the lower limit
serum creatinine start with the lowest hemoglobin capital, but
suffer the least deterioration. The difference between the initial
Hb values for the creatinine group <0.6 and the creatinine group
between 0.6 and 1.1, respectively, are statistically significant
(P<0.0001) (Table VII and
Fig. 5).
| Table VIIEvolution of mean hemoglobin value
(g/dl) according to creatinine level. |
Table VII
Evolution of mean hemoglobin value
(g/dl) according to creatinine level.
| Cycle number | 1 | 2 | 3 | 4 | ΔC4 vs. C1 % |
|---|
| Medium Hb,
creatinine <0.6 mg/dl | 11.4 | 11.04 | 11.02 | 11.12 | -2 |
| Medium Hb,
creatinine = 0.6-1.09 mg/dl | 12.85 | 12.06 | 11.48 | 11.15 | -13 |
| Medium Hb,
creatinine ≥1.1 mg/dl | 11.64 | 10.76 | 10.39 | 10.44 | -10 |
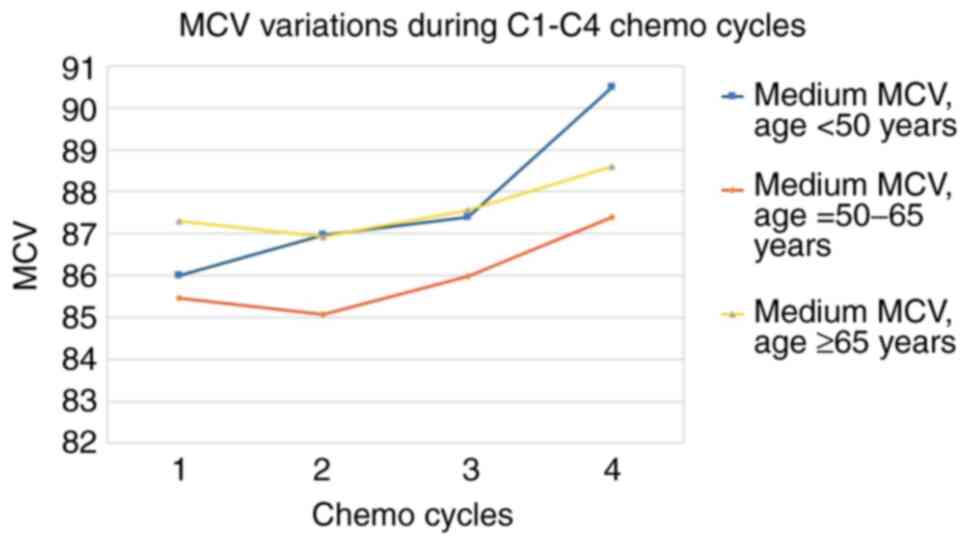
Regarding the evolution of the MCV, the trend is
upward, passing through a period of latency or a slight transient
decrease (Table VIII). By age
group, the highest increase of MCV occurs in young patients,
without latency (Table IX and
Fig. 6).
| Table VIIIEvolution of the value of mean
corpuscular volume (MCV, fL) by sex. |
Table VIII
Evolution of the value of mean
corpuscular volume (MCV, fL) by sex.
| Cycle number | 1 | 2 | 3 | 4 | ΔC4 vs. C1 % |
|---|
| Male MCV | 86.36 | 86.18 | 86.7 | 88.13 | 2 |
| Female MCV | 85.89 | 85.84 | 86.96 | 88.63 | 3 |
| Table IXEvolution of the average value of
mean corpuscular volume (MCV, fL) by age group. |
Table IX
Evolution of the average value of
mean corpuscular volume (MCV, fL) by age group.
| Cycle number | 1 | 2 | 3 | 4 | ΔC4 vs. C1 % |
|---|
| Medium MCV, age
<50 years | 86.01 | 86.97 | 87.39 | 90.49 | 5 |
| Medium MCV, age =
50-65 years | 85.47 | 85.07 | 85.99 | 87.4 | 2 |
| Medium MCV, age ≥65
years | 87.31 | 86.94 | 87.57 | 88.6 | 1 |
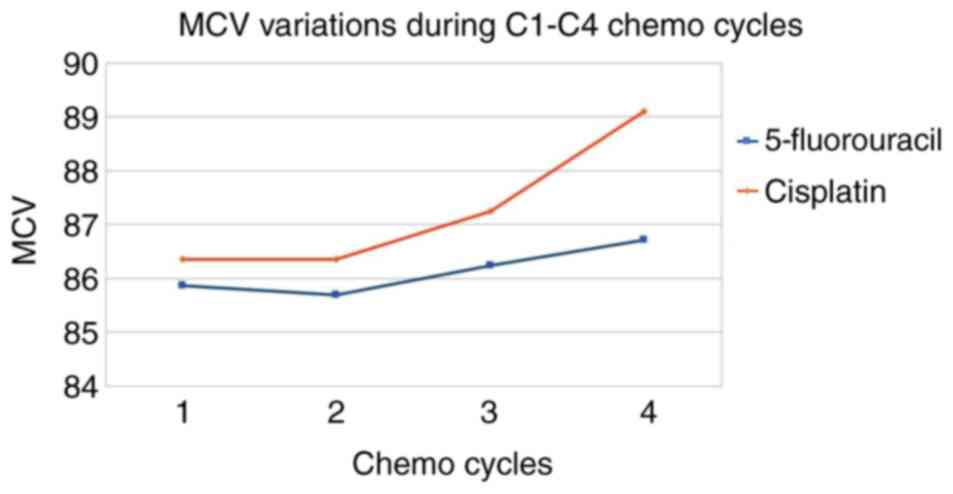
Regarding the different chemotherapeutics used,
cisplatin causes a higher increase in MCV compared with 5-FU
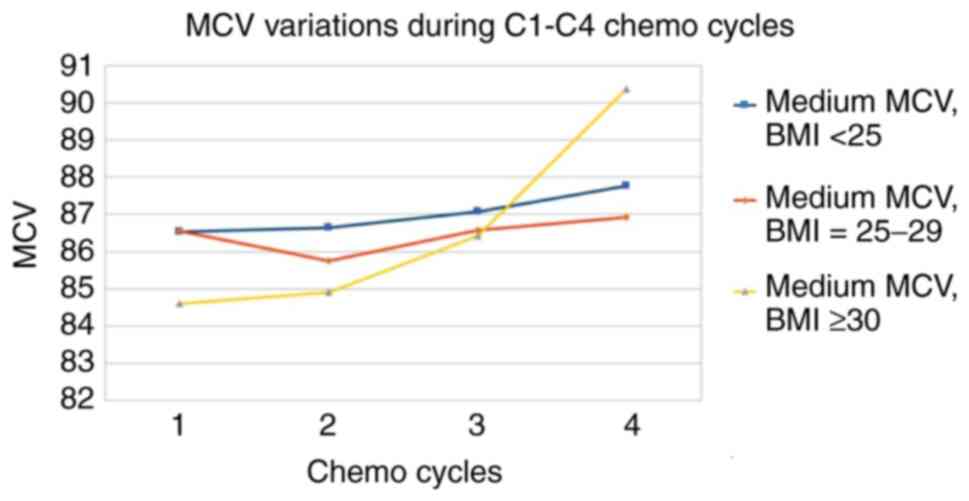
(Table X and Fig. 7). The variation of MCV, according to
BMI, revealed a minimum impact in the area of normal or overweight
people and a maximum in the area of obese people (Table XI and Fig. 8).
| Table XEvolution of the mean value of mean
corpuscular volume (MCV, fL) by cytostatic type. |
Table X
Evolution of the mean value of mean
corpuscular volume (MCV, fL) by cytostatic type.
| Cycle number | 1 | 2 | 3 | 4 | ΔC4 vs. C1 % |
|---|
| 5-fluorouracil | 85.87 | 85.7 | 86.24 | 86.72 | 1 |
| Cisplatin | 86.36 | 86.36 | 87.25 | 89.1 | 3 |
| Table XIEvolution of the average value of the
mean corpuscular volume (MCV, fL) by body mass index (BMI,
kg/m2). |
Table XI
Evolution of the average value of the
mean corpuscular volume (MCV, fL) by body mass index (BMI,
kg/m2).
| Cycle number | 1 | 2 | 3 | 4 | ΔC4 vs. C1 % |
|---|
| Medium MCV, BMI
<25 kg/m2 | 86.53 | 86.63 | 87.07 | 87.77 | 1 |
| Medium MCV, BMI =
25-29 kg/m2 | 86.56 | 85.76 | 86.57 | 86.92 | 0 |
| Medium MCV, BMI ≥30
kg/m2 | 84.6 | 84.92 | 86.43 | 90.37 | 7 |
The evolution of the erythrocyte volume dispersion
index (RDW-CV) is somewhat surprising regarding its reduction under
chemotherapy, especially under cisplatin, despite the increase of
average MCV (Table XII).
| Table XIIEvolution of the mean value of RDW-CV
according to the type of chemotherapy. |
Table XII
Evolution of the mean value of RDW-CV
according to the type of chemotherapy.
| Cycle number | 1 | 2 | 3 | 4 | ΔC4 vs. C1 % |
|---|
| 5-fluorouracil | 12 | 10.9 | 11.3 | 11.7 | -3 |
| Cisplatin | 11.8 | 10.9 | 10.7 | 10.4 | -12 |
Discussion
The mean relative hemoglobin loss is 11% after three
cycles of chemotherapy (-1.39 g/dl), without the mean hemoglobin
levels leaving the area of mild anaemia. The most abrupt decrease
in hemoglobin is recorded after the first chemotherapy
administration. No data were obtained for possible transfusions.
Previous studies on cancer patients receiving chemotherapy revealed
43-54% of patients having less than 9 g/dl haemoglobin after 6
weeks of treatment. Also the percent of patients requiring
transfusion reached up to 43% during chemotherapy (19).
By age groups: The most significant hemoglobin
decreases during treatment are in the area of patients of extreme
age (<50 or >65). Chemotherapy dosages may be more
‘courageous’ in younger patients (fewer dose reductions). The
highest increase in MCV occurs in young patients without latency.
Studies on elderly lung cancer patients treated with chemotherapy
demonstrated higher Hb values significantly associated with more
favourable values of indexes measuring mental and functional
capacity and depression (20).
Overweight patients start with the best hemoglobin
value, but they also suffer the most considerable relative
decrease. MCV growth appears most pronounced in obese people.
Fluoropyrimidine (5-fluorouracil)-based chemotherapy
induces less severe anaemia compared with cisplatin. In addition,
the impact of cisplatin on MCV is more significant.
People with low creatinine levels demonstrate the
lowest level of initial hemoglobin but suffer the least
deterioration. Other authors demonstrated that decreased creatinine
clearance is associated with increased odds of chemotherapy-related
toxicity (21).
Regarding the evolution of the MCV index, the
tendency is upward, but with a period of latency or slight
transient decrease. The latency period before MCV growth (or even a
transient decrease) may extend over one or two treatment cycles (up
to 6 weeks). Surprisingly, the decrease in Hb has no latency, and
it is also maximal immediately after the first cycle. Furthermore,
the cases with the highest increases of MCV in cycles 4 do not show
latency in cycles 2 or 3.
The evolution of the erythrocyte volume dispersion
index (RDW-CV) is somewhat surprising regarding its reduction under
chemotherapy, especially under cisplatin (correlated with the
highest average MCV increase).
The average relative hemoglobin losses are between
-2 and -14% for the first 3 treatment cycles (-1.39 g/dl or a
relative decrease of -11% for all patient groups, statistically
significant), with statistically significant differences also in
hemoglobin levels between the sexes.
Risk factors associated with higher average losses
are age <50 years or >65 years (statistically proven), BMI
>25, cisplatin treatment (insufficient number of cases to reach
statistical significance). Protective factors associated with lower
losses are: Age between 50 and 65 years, BMI <25
kg/m2, limit values of creatinine (<0.6 mg/dl),
chemotherapy treatments containing fluoropyrimidines (insufficient
number of cases to reach statistical significance). The most
substantial increases in MCV occur in persons <50 years of age,
cisplatin treatment and in obese persons (insufficient cases for
statistical significance).
Acknowledgements
Professional editing, linguistic and technical
assistance was performed by Irina Radu, Individual Service
Provider, certified translator in Medicine and Pharmacy
(certificate credentials: Series E no. 0048).
Funding
No funding was received.
Availability of data and materials
All data and materials supporting the results of the
present study are available in the published article.
Authors' contributions
SS, DP, CO, AC, ȘN conceived and designed the study.
AN, MZ, IY, MP and ȘN contributed to the interpretation of the
results. SS was mainly responsible for the writing of the
manuscript. All authors provided critical feedback and assisted
with the design of the research, analysis and preparation of the
manuscript. SS, DP, CO and ȘN designed the model and the
computational framework, and analyzed the data. SS, CO and AC
carried out the implementation. AN performed the calculations. SS
and DP wrote the manuscript with input from all authors. AC and ȘN
conceived the study and were in charge of overall direction and
planning. All authors read and approved the final manuscript.
Ethics approval and consent to
participate
Not applicable.
Patient consent for publication
Not applicable.
Competing interests
The authors declare that they have no competing
interests.
References
|
1
|
Eaves CJ and Eaves AC: Anatomy and
physiology of hematopoiesis. In: Childhood Leukemias. 2nd edition.
Pui CH (ed). Cambridge University Press, Cambridge, pp69-105,
2006.
|
|
2
|
Goodman SR, Kurdia A, Ammann L,
Kakhniashvili D and Daescu O: The human red blood cell proteome and
interactome. Exp Biol Med (Maywood). 232:1391–1408. 2007.PubMed/NCBI View Article : Google Scholar
|
|
3
|
Koury MJ: Erythroferrone: A missing link
in iron regulation. The Hematologist. American Society of
Hematology 12, 2015.
|
|
4
|
Kautz L, Jung G, Valore EV, Rivella S,
Nemeth E and Ganz T: Identification of erythroferrone as an
erythroid regulator of iron metabolism. Nat Genet. 46:678–684.
2014.PubMed/NCBI View
Article : Google Scholar
|
|
5
|
Wan J, Ristenpart WD and Stone HA:
Dynamics of shear-induced ATP release from red blood cells. Proc
Natl Acad Sci USA. 105:16432–16437. 2008.PubMed/NCBI View Article : Google Scholar
|
|
6
|
Diesen DL, Hess DT and Stamler JS: Hypoxic
vasodilation by red blood cells: Evidence for an
s-nitrosothiol-based signal. Circ Res. 103:545–553. 2008.PubMed/NCBI View Article : Google Scholar
|
|
7
|
Kleinbongard P, Schutz R, Rassaf T, Lauer
T, Dejam A, Jax T, Kumara I, Gharini P, Kabanova S, Ozüyaman B, et
al: Red blood cells express a functional endothelial nitric oxide
synthase. Blood. 107:2943–2951. 2006.PubMed/NCBI View Article : Google Scholar
|
|
8
|
Bunn HF: Approach to the anaemias. In:
Goldman-Cecil Medicine. Goldman L, Schafer AI (eds.) 25th edition.
Philadelphia, PA: Elsevier Saunders, Chapter 158, 2016.
|
|
9
|
Chernecky CC and Berger BJ: Blood
indices-blood. In: Laboratory Tests and Diagnostic Procedures.
Chernecky CC and Berger BJ (eds). 6th edition. Elsevier,
Philadelphia, PA, pp217-219, 2013.
|
|
10
|
Walker HK, Hall WD and Hurst JW (eds.):
Clinical Methods: The History, Physical, and Laboratory
Examinations. 3rd edition. Butterworths, Boston, 1990.
|
|
11
|
Evans TC and Jehle D: The red blood cell
distribution width. J Emerg Med. 9 (Suppl 1):S71–S74.
1991.PubMed/NCBI View Article : Google Scholar
|
|
12
|
Rambach L, Bertaut A, Vincent J, Lorgis V,
Ladoire S and Ghiringhelli F: Prognostic value of
chemotherapy-induced haematological toxicity in metastatic
colorectal cancer patients. World J Gastroenterol. 20:1565–1573.
2014.PubMed/NCBI View Article : Google Scholar
|
|
13
|
Jung HA, Kim HJ, Maeng CH, Park SH, Lee J,
Park JO, Park YS, Lim HY and Kang WK: Changes in the mean
corpuscular volume after capecitabine treatment are associated with
clinical response and survival in patients with advanced gastric
cancer. Cancer Res Treat. 47:72–77. 2015.PubMed/NCBI View Article : Google Scholar
|
|
14
|
Papaldo P, Ferretti G, Di Cosimo S,
Giannarelli D, Marolla P, Lopez M, Cortesi E, Antimi M, Terzoli E,
Carlini P, et al: Does granulocyte colony-stimulating factor worsen
anaemia in early breast cancer patients treated with epirubicin and
cyclophosphamide? J Clin Oncol. 24:3048–3055. 2006.PubMed/NCBI View Article : Google Scholar
|
|
15
|
Groopman JE and Itri LM:
Chemotherapy-induced anaemia in adults: Incidence and treatment. J
Natl Cancer Inst. 91:1616–1634. 1999.PubMed/NCBI View Article : Google Scholar
|
|
16
|
Ludwig H and Fritz E: Anaemia in cancer
patients. Semin Oncol. 25 (3 Suppl 7):S2–S6. 1998.
|
|
17
|
Stanca HT, Suvac E, Munteanu M, Jianu DC,
Motoc AGM, Roşca GC and Boruga O: Giant cell arteritis with
arteritic anterior ischemic optic neuropathy. Rom J Morphol
Embryol. 58:281–285. 2017.PubMed/NCBI
|
|
18
|
Balica NC, Poenaru M, Doroş CI, Baderca F,
Preda MA, Iovan VC, Stanca HT, Busuioc CJ, Oprişcan IC and Boruga
O: The management of the oropharyngeal anterior wall cancer. Rom J
Morphol Embryol. 59:113–119. 2018.PubMed/NCBI
|
|
19
|
Pirker R, Pirolli M, Quigley J, Hulnick S,
Legg J, Collins H and Vansteenkiste J: Hemoglobin decline in cancer
patients receiving chemotherapy without an
erythropoiesis-stimulating agent. Support Care Cancer. 21:987–992.
2013.PubMed/NCBI View Article : Google Scholar
|
|
20
|
Mancuso A, Migliorino M, De Santis S,
Saponiero A and De Marinis F: Correlation between anemia and
functional/cognitive capacity in elderly lung cancer patients
treated with chemotherapy. Ann Oncol. 17:146–150. 2006.PubMed/NCBI View Article : Google Scholar
|
|
21
|
Peterson LL, Hurria A, Feng T, Mohile SG,
Owusu C, Klepin HD, Gross CP, Lichtman SM, Gajra A, Glezerman I, et
al: Association between renal function and chemotherapy-related
toxicity in older adults with cancer. J Geriatr Oncol. 8:96–101.
2017.PubMed/NCBI View Article : Google Scholar
|