Introduction
Age-associated cataracts are the most common disease
that causes blindness worldwide (1). The gradual decline in visual acuity
(VA) affects the quality of life of the elderly.
Phacoemulsification combined with intraocular lens implantation is
an effective treatment method to improve VA (2). However, certain patients with
cataracts experience a decrease in VA at different time-points
after surgery (3,4). For instance, Emeriewen et al
(3) studied the decreased VA after
cataract surgery caused by ischemic optic neuropathy and reported
that hypertension, diabetes, cerebrovascular disease and high
levels of lipids were systemic risk factors. It was reported that
the best-corrected visual acuity (BCVA) was positively correlated
with macular flow density in pathological myopia, and that the
macular vascular system was essential for visual function (5). With the extension of the ocular axis,
certain structural changes occur in high myopia, including retinal
and choroidal thickness thinning, optic disc atrophy and reduction
of the retinal nerve fiber layer (RNFL) thickness (6). Fan et al (7) also indicated that macular vascular
density (MVD) and ganglion cell complex thickness, which consists
of the inner plexiform layer (IPL), ganglion cell layer (GCL) and
nerve fiber layer, decreased with increasing myopia. In addition,
Benavente-Pérez et al (8)
indicated that both retinal blood flow and blood vessel diameter
decreased in high myopia based on Doppler ultrasound. However,
whether uneventful cataract surgery is able to affect the perfusion
of the macular area in high myopia has remained elusive.
Retinal blood flow may be observed by a variety of
methods, including Doppler ultrasound and fundus fluorescein
angiography (FFA). However, there are certain limitations to these
clinical applications, since Doppler ultrasound may only visualize
large vessels with low resolution (9), while FFA is invasive and difficult to
quantify (5). Optical coherence
tomography angiography (OCTA) with split-spectrum
amplitude-decorrelation angiography (SSADA) is able to generate
blood flow images of the retinal and choroidal vessels without
contrast agents. This technique is non-invasive, has no
complications or adverse reactions and provides a high-definition,
three-dimensional image (10). More
importantly, this technique is able to provide morphological
information about retinal vessels and quantify vascular density
(11).
In the present study, OCTA was used to measure the
MVD of cataracts and to assess the effects of uneventful cataract
surgery on retinal perfusion in high myopia.
Materials and methods
Patients
The present study was a prospective observational
study. Patients who were scheduled for cataract surgery at the
Department of Ophthalmology of the 10th People's Hospital
affiliated to Tongji University (Shanghai) were enrolled between
May 2016 and March 2017. Outpatients with complaints of painless
and gradual blurry vision in addition to lens opacity were
diagnosed with cataracts after slit-lamp examination. Lens
opacification was scored after pupil dilation with the compound
tropicamide using the Lens Opacification Classification System III
(12). The nuclear opalescence
(NO), nuclear color (NC), cortical cataract (C) and posterior
subcapsular cataract (P) were used as references to classify lens
opacities under the slit lamp. Patients with cataracts who were
aged >50 years and scored ≥NO3-NC3 or ≥C3 or ≥P3 were included.
The exclusion criteria comprised glaucoma, cornea diseases, retinal
vascular diseases, previous intraocular surgery, trauma and other
pre-existing ocular diseases affecting vision. Furthermore,
patients with systematic diseases, including hypertension,
diabetes, systemic cardiovascular diseases and hematological
diseases were also excluded. All participants were divided into a
high-myopia group [group A; spherical equivalent (SE)≤-6.0 D and
axis length (AL)≥25 mm] or a low-myopia group (group B; SE>-6.0
D and AL<25 mm). Informed consent was obtained from all the
participants and the study protocol was approved by the Clinical
Research Ethical Committee of Shanghai 10th People's Hospital
affiliated to Tongji University (Shanghai, China).
Examinations
All patients underwent routine examinations prior to
cataract surgery, including best-corrected visual acuity (BCVA),
intraocular pressure (IOP), refraction, corneal endothelial cell
counting, corneal topography, examination with Intraocular Lenses
Master (Carl Zeiss AG), fundus photography, OCTA and
ophthalmoscopic examination with slit lamp. After the pre-operative
dilation of the pupil with tropicamide, surgery was performed by
the same skilled physician using Infinity (Alcon Laboratories). All
patients were examined for MVD and retinal thickness (RT) with OCTA
on the first day, and at 1 week, 1 and 3 months after surgery. All
patients with high myopia were classified according to the
classification of Curtin (13),
including type I (posterior staphyloma), type II (macular
staphyloma), type III (peripapillary staphyloma), type VI (combined
staphyloma, types I and II) and type VII (combined staphyloma,
types I and III).
All operations were performed by the same surgeon
(FL) and the irrigation pressure (IP) was maintained at 80-85 cm
H2O during surgery. All participants underwent
measurement of superficial vascular density (SVD) and deep vascular
density (DVD) by a skilled technician prior to and after cataract
surgery (1 day, 1 week, 1 and 3 months post-operatively). Fundus
vascular scanning was performed with an RTVue-XR Avanti system
(Optovue Inc.) with a wavelength of 840 nm (bandwidth of 50 nm) and
an en-face OCTA scan of 3x3 mm over the macula. The subjects were
requested to stare at the blue sighting mark with blinking for at
least 3 sec and the retinal stratified blood flow images were
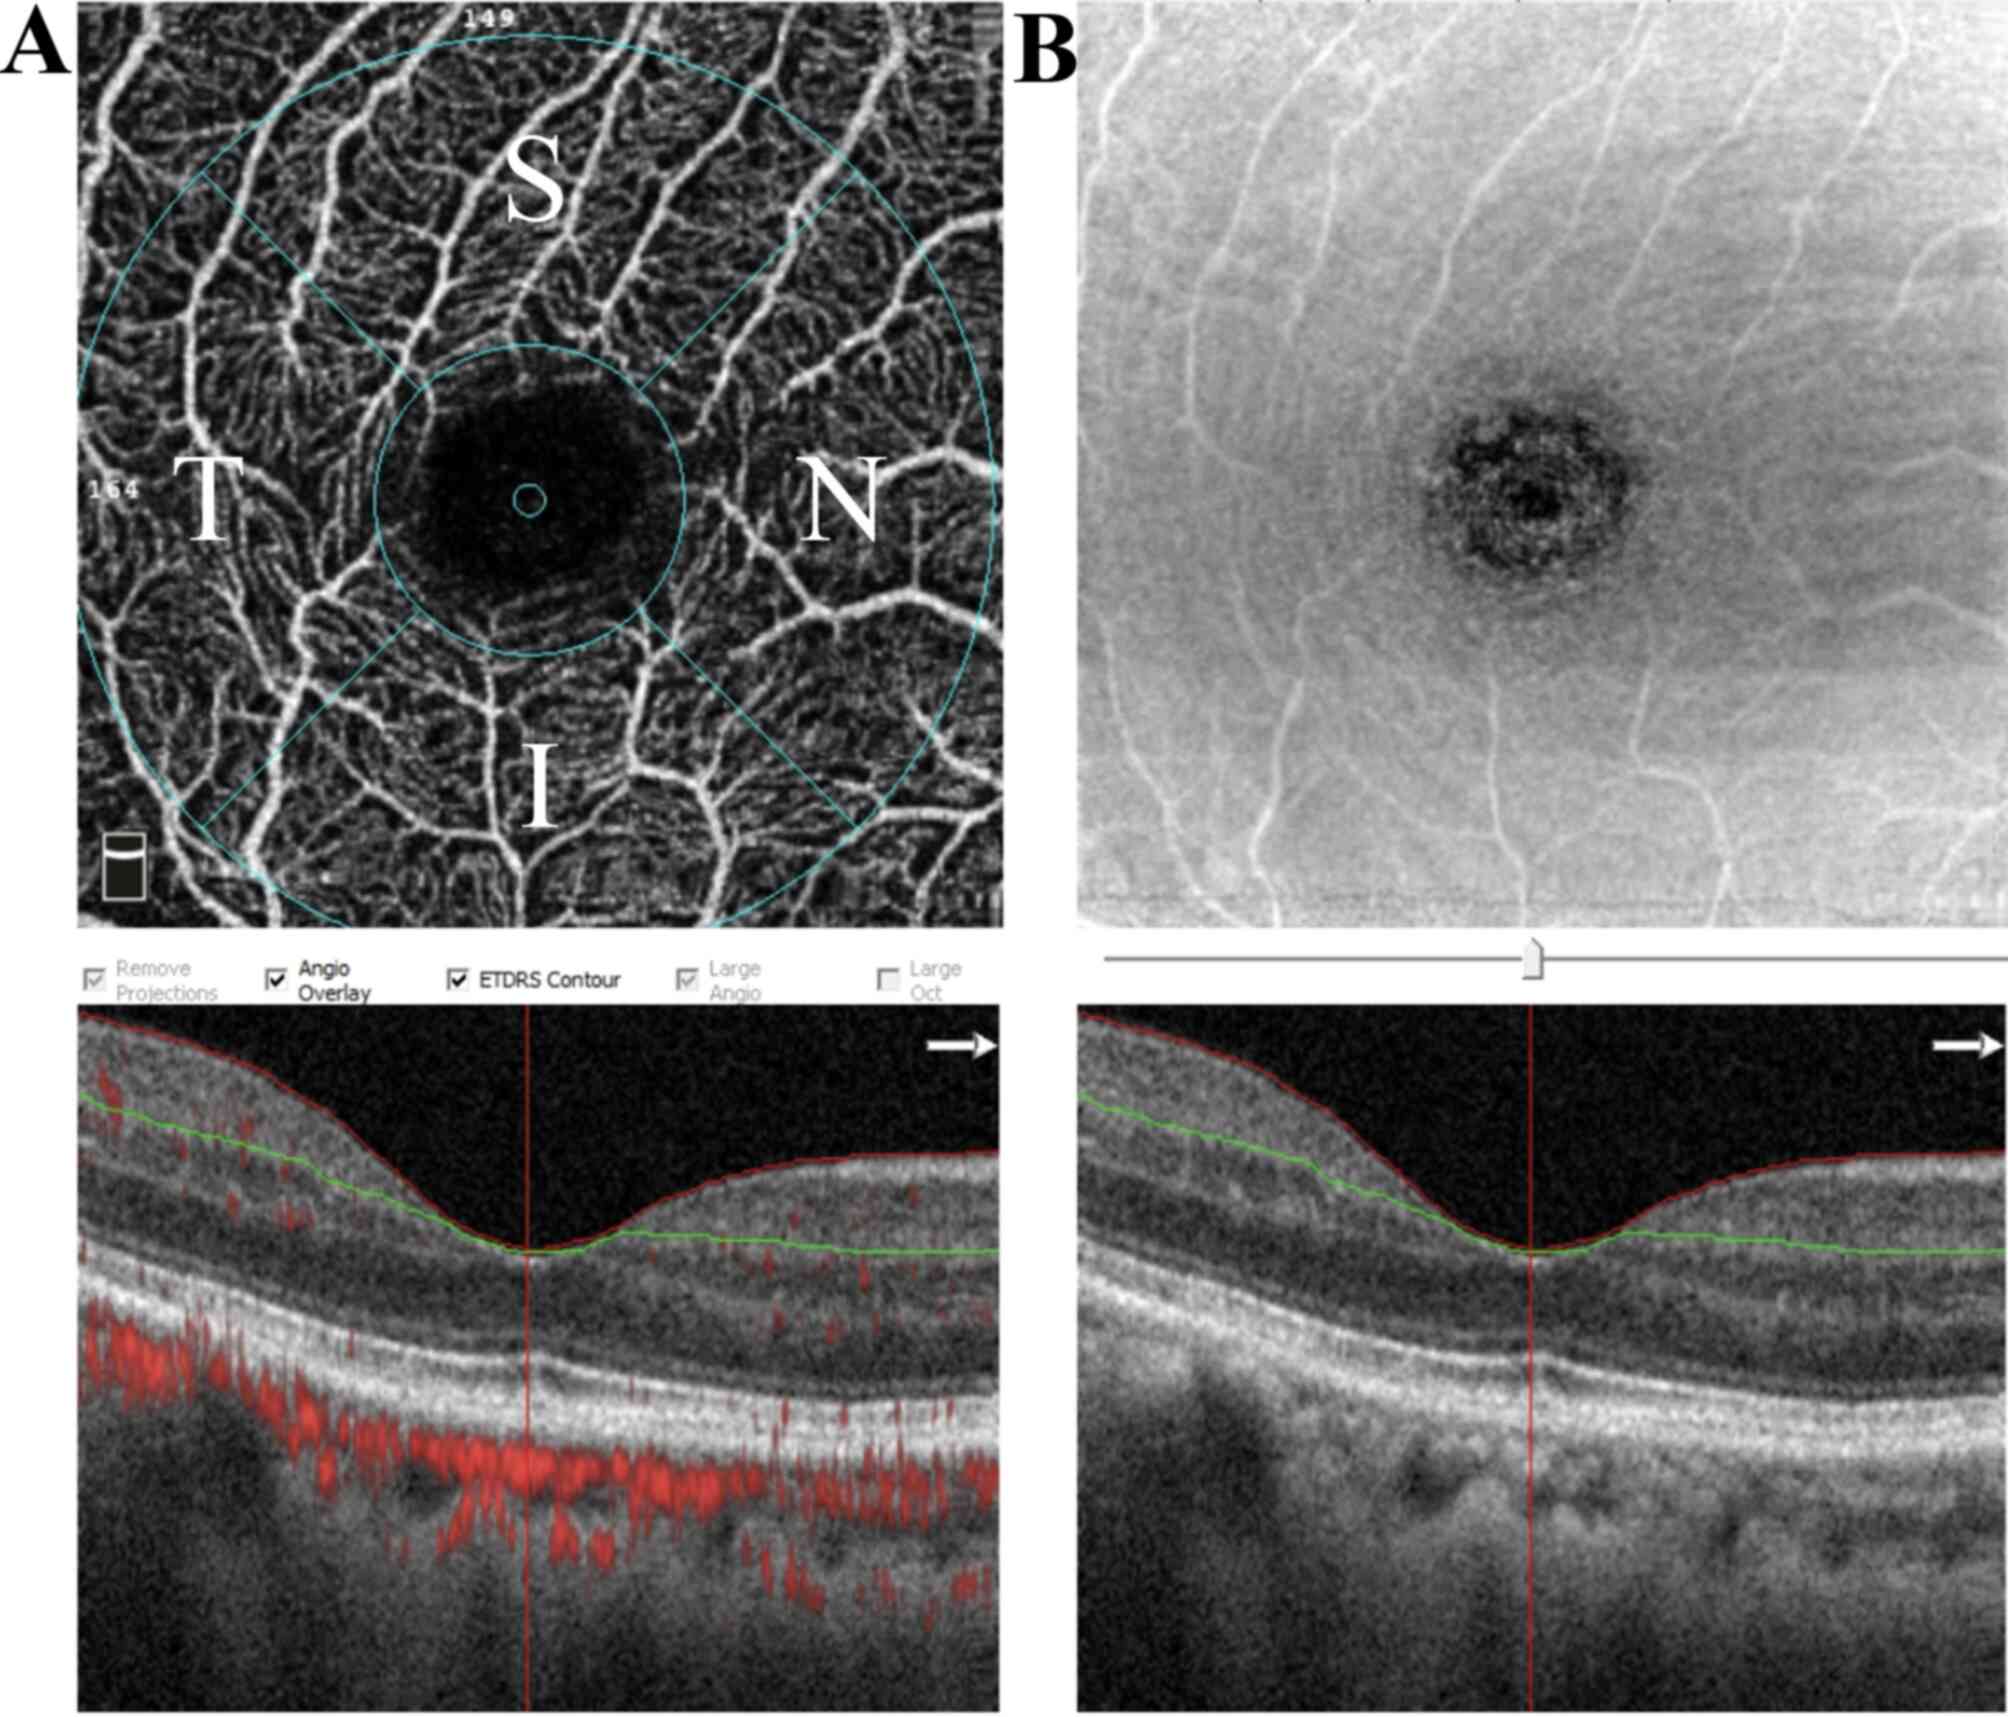
obtained by horizontal and vertical scans. Both the SVD [3 µm
beneath the inner limiting membrane (ILM) to 16 µm beneath the IPL]
and DVD (16 µm beneath the IPL to 71 µm beneath the IPL) were
quantified (Fig. 1A and B). The segments included the fovea (1 mm
circular area centered on the fovea) and parafovea (annulus with an
outer diameter of 3 mm and an inner diameter of 1 mm centered on
the fovea). The parafovea was divided into the superior-hemi (SH),
inferior-hemi (IH), temporal (T), superior (S), nasal (N) and
inferior (I) quadrants. The full RT (from the ILM to the retinal
pigment epithelium) and the superficial RT (from the ILM to the
IPL) were also evaluated. MVD and RT were automatically calculated
using the built-in software (AngioAnalytics) of the RTVue XR-Avanti
system. Poor-quality images with a signal strength index of <40
and severe motion artifacts were excluded from the analysis.
Statistical analysis
Statistical analysis was performed with SPSS version
19.0 (IBM Corp.). Data were analyzed with the Kolmogorov-Smirnov
test to evaluate their normal distribution. Pearson's χ2
test was performed to analyze gender differences. The data from
pre-operative and post-operative measurements were analyzed by
generalized estimating equations (14) with Bonferroni corrections. Unpaired
t-test was used to analyze age, SE, AL, BCVA and IOP between the
two groups. Pearson's correlation was used to further analyze the
correlation between age, AL, RT, BCVA and MVD. P<0.05 was
considered to indicate a statistically significant difference.
Results
Demographic and ocular characteristics
of patients
A total of 57 eyes from 46 patients were included in
the present study. The surgeries of all subjects were successfully
completed with no complications during the operation. In total, 2
patients (2 eyes) were excluded due to macular edema at 1 month
following the operation. Eventually, 55 eyes from 44 patients were
included in the study (16 males and 28 females, including 12
patients with the two eyes examined), who had a mean age of
66.37±5.47 years. There were 7 patients between 50 and 60 years of
age, 27 patients between 60 to 70 years of age and 10 patients
older than 70 years. A total of 24 eyes from 21 patients were
included in group A, with a mean refraction of -10.80±5.04 D and an
AL of 27.70±1.62 mm. In total, 31 eyes of 23 patients were in group
B, with a mean refraction of -0.76±2.21 D and an AL of 23.22±0.95
mm. There was no significant difference in sex (P=0.745) or age
(P=0.08) between the two groups (Table
I). In group A, 20 eyes were classified as type III, 2 eyes as
type I and 1 eye each as types VI and VII (Table II). The mean pre-operative value
for BCVA (logMAR) was 0.51±0.41 for group A and 0.23±0.22 for group
B. The BCVA of groups A and B were determined to be 0.03±0.05 and
0.04±0.06 at 3 months after surgery, respectively. The IOP of group
A was 16.56±3.79, 14.85±2.42, 13.17±0.42 and 13.38±1.86 mmHg at 1
day, 1 week, 1 month and 3 months post-operatively, respectively.
The IOP of group B was 16.36±3.16, 12.71±2.15, 11.54±0.24 and
12.39±1.60 mmHg, respectively. Moreover, the IOP of high-myopia
patients was significantly higher than that of low-myopia patients
at 1 week (P=0.001), 1 month (P=0.001) and 3 months (P=0.034) after
surgery (Table SI).
 | Table IDemographic and ocular characteristics
of patients in the two groups. |
Table I
Demographic and ocular characteristics
of patients in the two groups.
| Characteristic | High myopia
(n=24) | Low myopia
(n=31) | P-value |
|---|
| Age (years) | 65.32±6.01 | 67.66±4.59 | 0.080a |
| Gender
(male/female) | 9/15 | 11/20 | 0.740b |
| SE (diopters) | -10.80±5.04 | -0.76±2.21 | 0.001a |
| Axial length
(mm) | 27.70±1.62 | 23.22±0.95 | 0.001a |
| BCVA (logMAR) | 0.51±0.41 | 0.23±0.22 | 0.002a |
| IOP (mmHg) | 15.19±2.61 | 14.63±2.67 | 0.438a |
| Table IIThe number and axis length in
patients with different types of high myopia. |
Table II
The number and axis length in
patients with different types of high myopia.
| Type | Description | n (%) | Axis length
(mm) |
|---|
| I | Posterior
staphyloma | 2(8) | 29.56±0.07 |
| II | Macular
staphyloma | 0 | / |
| III | Peripapillary
staphyloma | 20(83) | 27.31±1.44 |
| IV | Nasal
staphyloma | 0 | / |
| V | Inferior
staphyloma | 0 | / |
| VI | Combined
staphyloma, Types I and II | 1(4) | 30.51 |
| VII | Combined
staphyloma, types I and III | 1(4) | 29.87 |
MVD and RT and their variations after
cataract surgery
The generalized estimating equations suggested that
the SVD and DVD of the parafovea changed in group A (Wald
χ2=13.65, P=0.008 and Wald χ2=37.12,
P<0.001, respectively) and group B (Wald χ2=58.82,
P<0.001 and Wald χ2=19.71, P=0.001, respectively),
with an increasing trend within a month and gradually decreasing at
3 months after cataract surgery (Table III). Of note, in group A, there
was a significant decrease at 3 months in both SVD and DVD
[48.59±0.82 vs. 45.79±0.65 (P=0.005) and 57.69±0.65 vs. 51.46±1.25
(P<0.001), respectively] compared with the measurements at 1
month after surgery, which was even slightly lower than that at the
baseline (45.79±0.65 vs. 46.22±0.98; P>0.05). In group B,
although the SVD and DVD decreased at 3 months after surgery, they
were still significantly higher than the baseline values (P=0.001
and P=0.008, respectively; Fig.
2A). In the parafovea, the vascular density in different
quadrants was consistent with the mean SVD in group A after
surgery, including SH (Wald χ2=22.52, P<0.001), IH
(Wald χ2=33.85, P<0.001), T (Wald
χ2=34.19, P<0.001), S (Wald χ2=15.62,
P=0.004), N (Wald χ2=53.02, P<0.001) and I (Wald
χ2=16.75, P=0.002). In group B, there was also a
significant change in the different quadrants after surgery (all
P<0.05; Table SII).
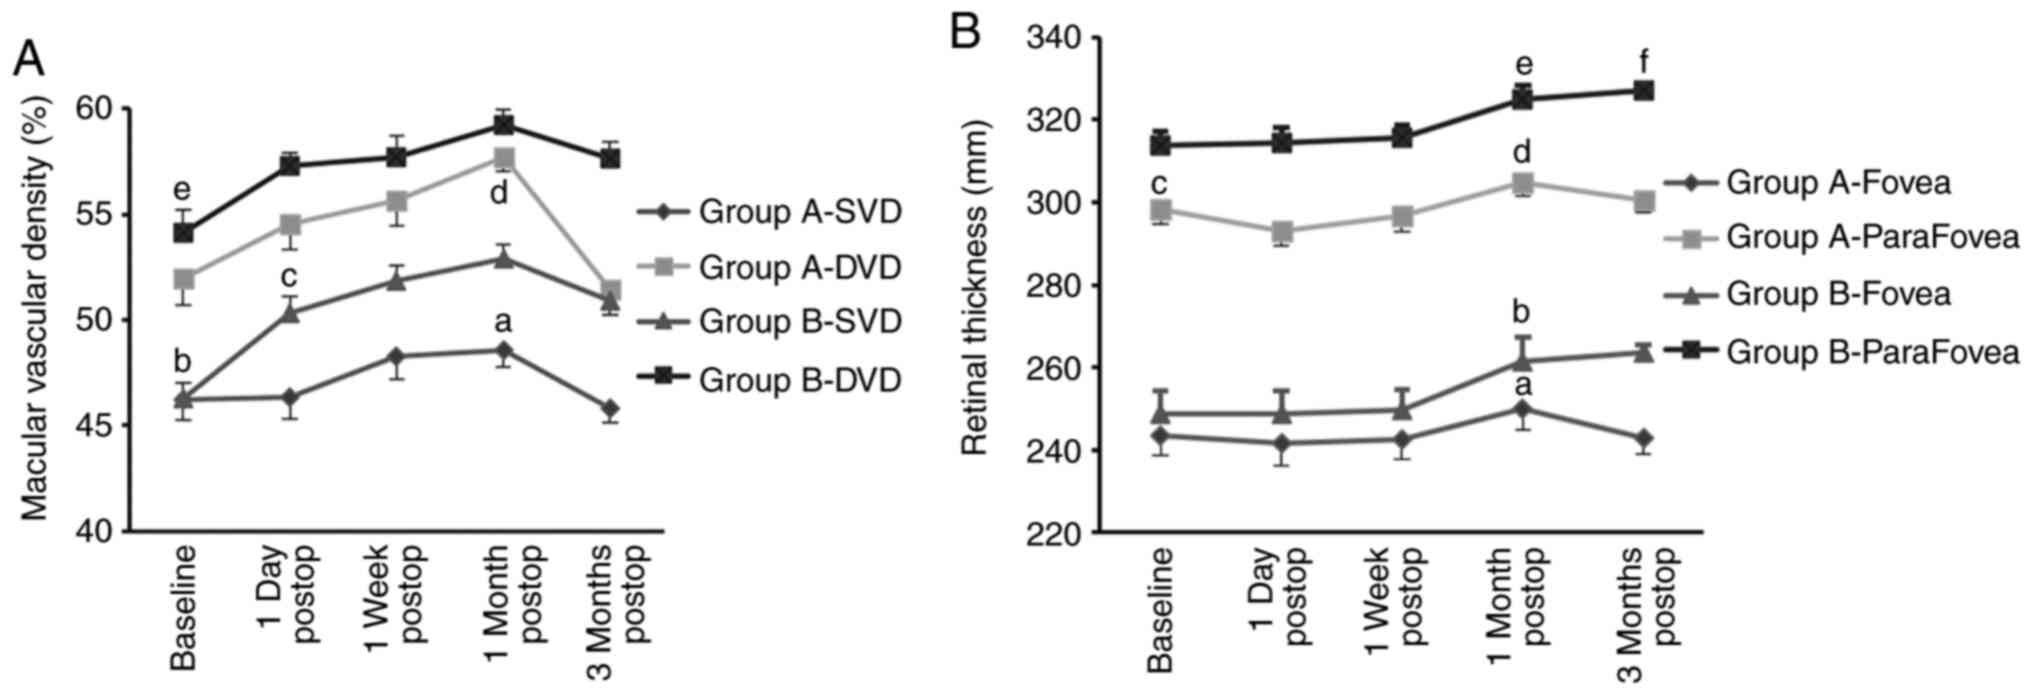 | Figure 2Variation in macular vascular density
(expressed as a percentage) and RT (mm) of groups A and B prior to
and after surgery. (A) Macular vascular density. P<0.05 was
determined for the following comparisons: A, 1 month post-op vs. 3
months post-op; b and e, baseline vs. 1 day post-op, 1 week
post-op, 1 month post-op and 3 months post-op; c, 1 day post-op vs.
1 month post-op; d, baseline vs. 1 month post-op. (B) RT in fovea
and parafovea. P<0.05 was determined for the following
comparisons: a, 1 month post-op vs. baseline and 1 week post-op; b,
1 month post-op vs. 1 week post-op and 3 months post-op; c,
baseline vs. 1 day post-op; d, 1 month post-op vs. 1 day post-op, 1
week post-op respectively; e, 1 month post-op vs. baseline, 1 day
post-op and 1 week post-op; f, 3 months vs. baseline, 1 day post-op
and 1 week post-op. The data were analyzed by generalized
estimating equations with Bonferroni corrections. Groups: A, high
myopia; B, low myopia. RT, retinal thickness; SVD, superficial
vascular density; DVD, deep vascular density. |
| Table IIIMacular vascular density and retinal
thickness of two groups at baseline and 4 post-operative
time-points. |
Table III
Macular vascular density and retinal
thickness of two groups at baseline and 4 post-operative
time-points.
| A, High myopia
(n=24) |
|---|
| Parameters | Baseline | 1 day post-op | 1 week post-op | 1 month
post-op | 3 months
post-op | Wald
χ2 | P-value |
|---|
| RT in fovea
(mm) | 243.43±4.86 | 241.58±5.34 | 242.66±5.03 | 250.08±5.08 | 242.78±3.83 | 15.31 | 0.004 |
| RT in parafovea
(mm) | 298.17±3.35 | 293.00±3.59 | 296.57±3.74 | 304.79±3.31 | 300.29±2.85 | 50.22 | <0.001 |
| SVD (%) | 46.22±0.98 | 46.34±1.01 | 48.29±1.13 | 48.59±0.82 | 45.79±0.65 | 13.65 | 0.008 |
| DVD (%) | 51.93±1.21 | 54.56±1.24 | 55.62±1.15 | 57.69±0.65 | 51.46±1.25 | 37.12 | <0.001 |
| B, Low myopia
(n=31) |
| Parameters | Baseline | 1 day post-op | 1 week post-op | 1 month
post-op | 3 months
post-op | Wald
χ2 | P-value |
| RT in fovea
(mm) | 248.75±5.61 | 248.81±5.41 | 249.52±5.04 | 261.31±6.06 | 263.55±2.02 | 13.08 | 0.011 |
| RT in parafovea
(mm) | 313.60±3.54 | 314.47±3.61 | 315.47±3.33 | 324.92±3.29 | 326.93±1.75 | 31.54 | <0.001 |
| SVD (%) | 46.30±0.73 | 50.33±0.78 | 51.84±0.72 | 52.92±0.62 | 50.91±0.68 | 58.82 | <0.001 |
| DVD (%) | 54.14±1.07 | 57.31±0.60 | 57.67±1.04 | 59.22±0.71 | 57.61±0.84 | 19.71 | 0.001 |
The whole RT of the fovea and parafovea also
exhibited a different variation tendency over the four time-points
after surgery between group A (Wald χ2=15.31, P=0.004
and Wald χ2=50.22, P<0.001) and group B (Wald
χ2=13.08, P=0.011 and Wald χ2=31.54,
P<0.001; Table III). In group
A, the RT decreased on the first post-operative day and then
gradually increased within a month and decreased again at 3 months
after surgery. However, the RT in group B increased constantly over
the 3 months after surgery and had a smaller volatility than that
of group A (Fig. 2B). In group A,
the RT in the parafovea was significantly changed after surgery in
SH (Wald χ2=12.75, P=0.013), S (Wald
χ2=11.21, P=0.024) and N (Wald χ2=13.79,
P=0.008), but not for IH (Wald χ2=7.55, P=0.11) T (Wald
χ2=7.84, P=0.098) or I (Wald χ2=6.43,
P=0.169). However, in group B, there was a significant difference
in these quadrants (all P<0.05).
Changes in MVD within four
post-operative time-points in the two groups
As presented in Table
III, both the SVD and DVD of the two groups increased after
surgery compared with those at the baseline. However, the SVD of
group A exhibited a slight increase at 1 day, 1 week and 1 month
post-operatively (0.23, 4.43 and 5.06%, respectively) and a slight
decrease at 3 months (-1.21%; all P>0.05), whereas a significant
increase was obtained in group B at the four post-operative
time-points (8.87, 12.15, 13.93 and 9.87%, respectively; all
P<0.05). In addition, the mean changes in SVD were significantly
different between the two groups at 1 day, 1 week, 1 and 3 months
post-operatively (P=0.009, P=0.02, P=0.012 and P=0.001,
respectively; Fig. 3A and Table IV). Furthermore, the difference was
mainly observed in the parafovea (SH, IH, T, S, N and I quadrants)
but not in the fovea (P>0.05). However, the mean changes in DVD
were not significantly different between the two groups at the four
time-points after cataract surgery (P=0.808, 0.962, 0.695 and
0.079, respectively; Fig. 3B and
Table IV).
| Table IVMean changes of macular vascular
density (%) in parafovea in high myopia and low myopia groups. |
Table IV
Mean changes of macular vascular
density (%) in parafovea in high myopia and low myopia groups.
| | Superficial
vascular density | Deep vascular
density |
|---|
| Time-point | High myopia | Low myopia | Wald
χ2 | P-value | High myopia | Low myopia | Wald
χ2 | P-value |
|---|
| 1 Day post-op | 0.11±1.36 | 4.11±0.69 | 6.861 | 0.009 | 3.63±1.45 | 3.21±0.90 | 0.059 | 0.808 |
| 1 Week post-op | 2.05±1.23 | 5.63±0.91 | 5.428 | 0.020 | 3.68±1.64 | 3.58±1.34 | 0.002 | 0.962 |
| 1 Month
post-op | 2.34±1.35 | 6.45±0.91 | 6.349 | 0.012 | 5.76±1.39 | 5.03±1.22 | 0.153 | 0.695 |
| 3 Months
post-op | -0.52±1.11 | 4.57±1.02 | 11.353 | 0.001 | 0.53±1.35 | 3.51±1.01 | 3.077 | 0.079 |
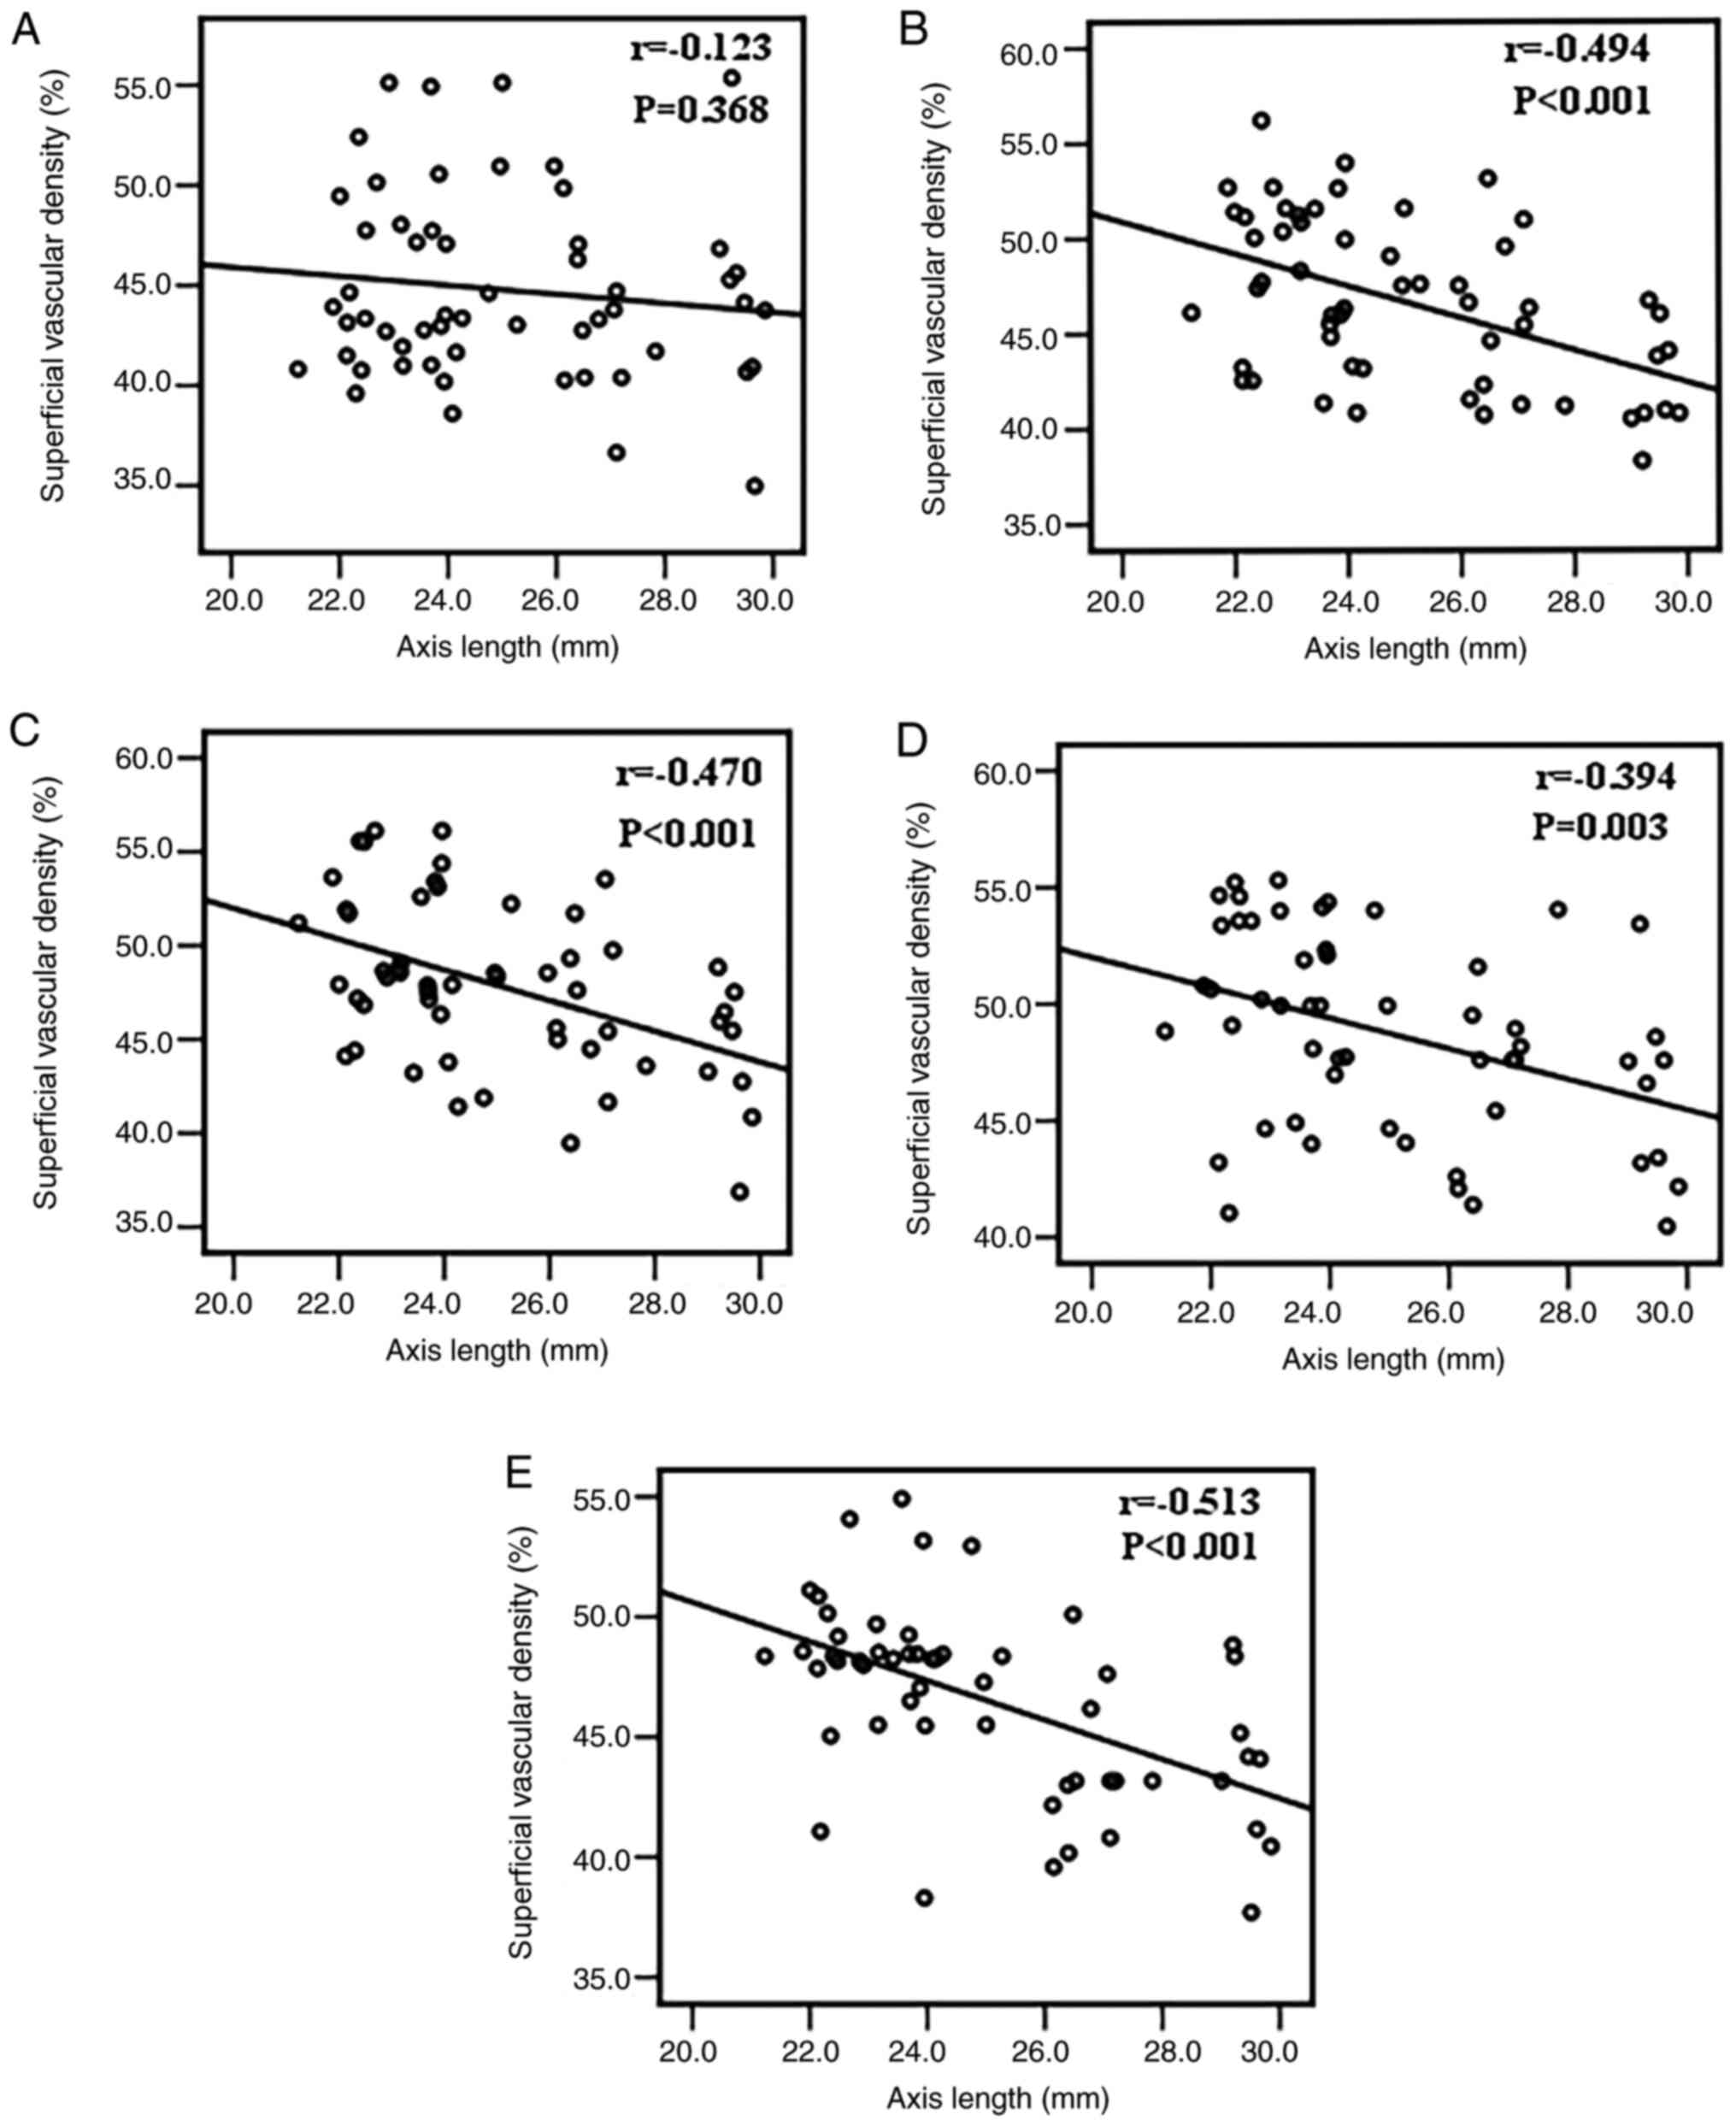
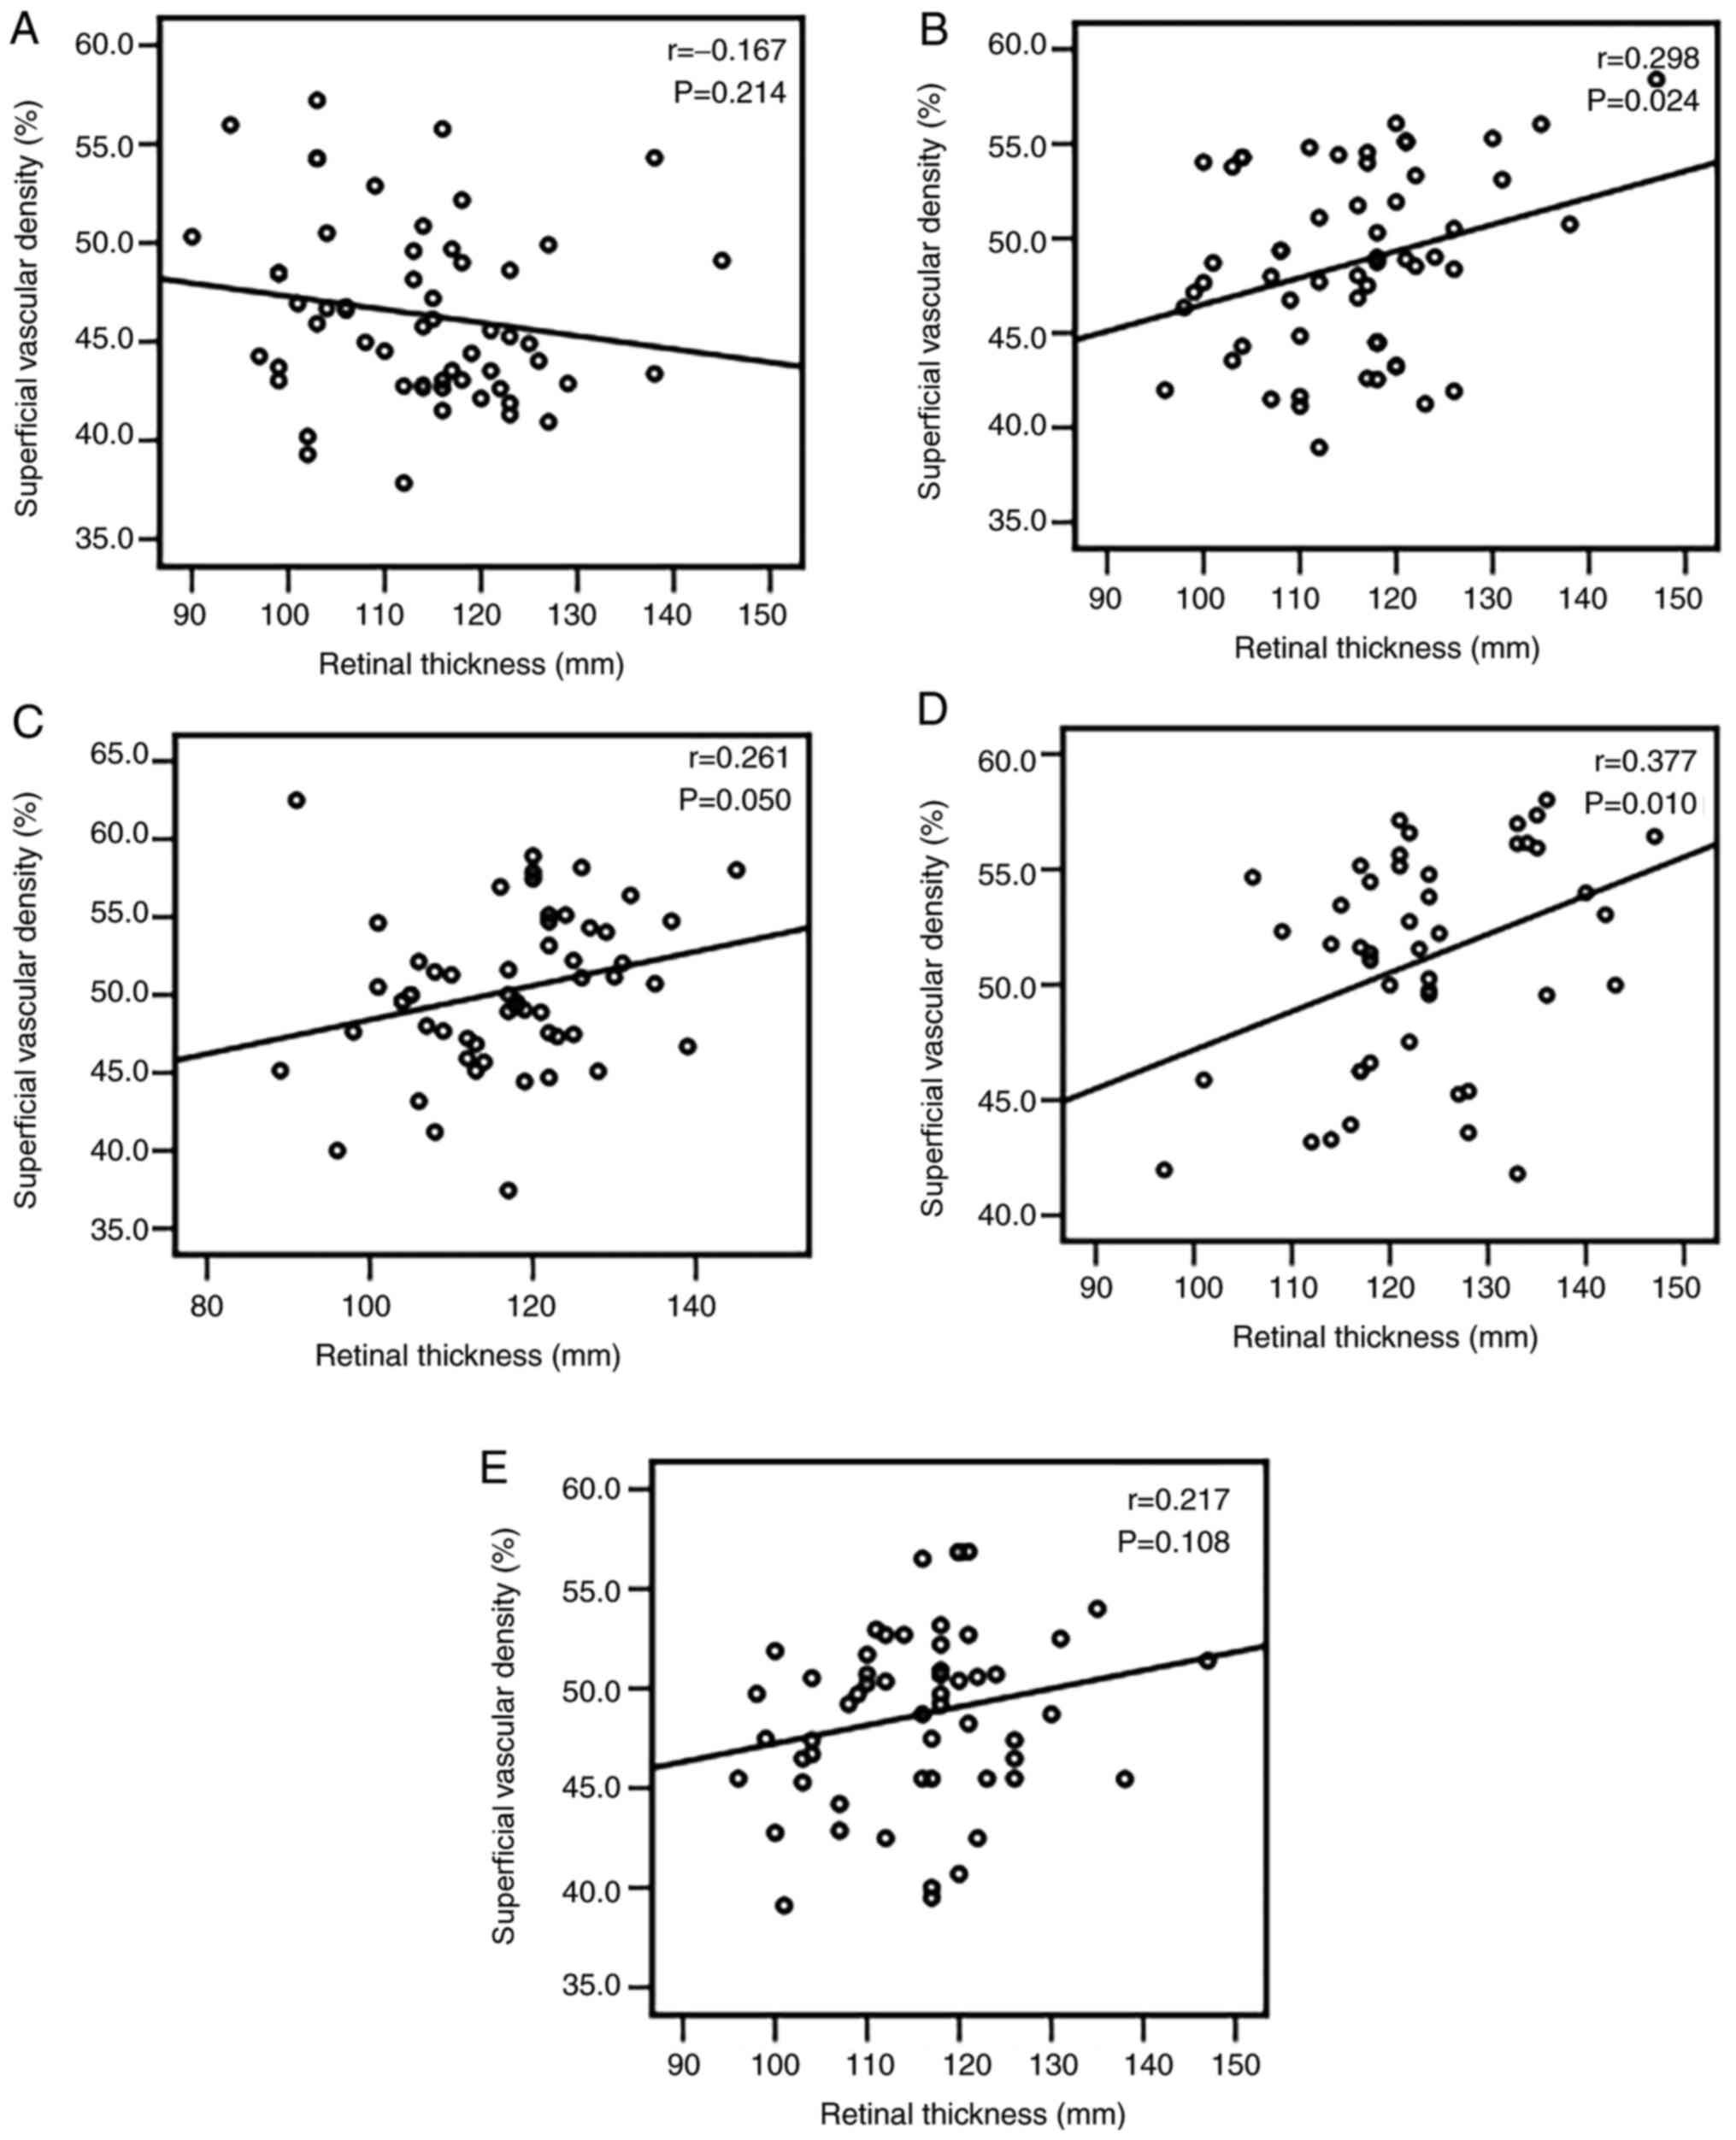
Correlation between age, BCVA, AL, RT,
IOP and SVD
Pearson's correlation test revealed that the
negative correlations between AL and SVD were more significant at 1
day, 1 week, and 1 and 3 months after surgery (r=-0.494,
P<0.001; r=-0.470, P<0.001; r=-0.394, P=0.003; and r=-0.513,
P<0.001, respectively) than those prior to surgery (r=-0.123,
P=0.368; Fig. 4). The superficial
RT in the parafovea was positively correlated with the SVD after 1
day, 1 week and 1 month after surgery (r=0.298, P=0.024; r=0.261,
P=0.050; and r=0.377, P=0.010, respectively; Fig. 5). Furthermore, the IOP was
negatively correlated with the SVD at 1 month after surgery
(r=-0.355, P=0.01) while no association was determined at any other
time-point (P>0.05) (data not shown). However, age and BCVA were
not correlated with SVD (P>0.05) (data not shown).
Discussion
Clinically, there have been certain reports of
ischemic optic neuropathy occurring after cataract surgery and
leading to a sudden decline in VA (3,4).
Another study suggested that the macular vascular system was
essential to visual function (5).
In patients with high myopia, there are certain structural changes,
including retinal and choroidal thickness thinning, optic disc
atrophy and thinning of RNFL thickness. In addition, the retinal
blood flow and blood vessel diameter were indicated to be decreased
in high-myopia patients with Doppler ultrasound (8). A number of these studies used Doppler
and FFA to detect retinal perfusion. However, Doppler is not able
to sensitively measure the macular and peripapillary
microcirculation (5). Azizi et
al (15) indicated that retinal
vessel densitometry with Doppler may result in an erroneous
elevation in the detection of cataracts due to cataract-induced
light scatter. FFA is not able to differentiate the deep capillary
from the radial peripapillary networks (16). In the present study, non-invasive
OCTA was used with the SSADA algorithm for imaging to quantify the
MVD with high resolution and three-dimensional images. Good
repeatability and reproducibility were reported for this method
(5). OCTA is able to reveal more
details about larger blood vessels and capillary networks in the
superficial and deep retinal layers (17). These powerful features of OCTA have
enormous implications for understanding tissue perfusion in retinal
vascular diseases, including retinal venous occlusion,
age-associated macular degeneration, idiopathic macular
telangiectasia (18), diabetic
retinopathy (19) and primary
open-angle glaucoma (20). However,
the use of OCTA for dynamic observation of retinal perfusion prior
to and after cataract surgery in high myopia has been scarcely
reported previously.
Cataract surgery has been widely used in the clinic
and certain post-operative complications usually occur in the
retina. For instance, one study indicated a subclinical increase in
RT based on optical coherence tomography after phacoemulsification
(21). In addition, pseudophakic
cystoid macular edema leading to a decrease in VA were commonly
observed after cataract surgery (22). A positive correlation between
retinal perfusion and RT was reported in healthy subjects (23). Previous studies suggested different
results for pulsatile ocular blood flow (POBF) changes detected
using an OBF analyzer after cataract surgery. Hilton et al
(24) suggested that the POBF was
improved at 1 month following cataract surgery compared with that
prior to surgery. However, Turk et al (25) determined that in normotensive eyes,
cataract surgery did not affect ocular hemodynamics at 1 or 3 weeks
post-surgery.
The present study suggested that MVD and RT in the
high- and low-myopia groups changed after cataract surgery. A
previous study reported changes in macular thickness and vessel
density after uneventful cataract surgery. A 6-month follow-up
study suggested that the average macular thickness exhibited the
greatest increase at 1 month after cataract surgery and
significantly decreased at 3 and 6 months after surgery (26). Zhao et al (27) determined that the MVD and thickness
increased in patients with cataracts in the 3-month follow-up
period after cataract surgery using OCTA, which was consistent with
the results of the present study. Although the exact pathomechanism
remains to be fully elucidated, the role of surgical trauma and the
release of prostaglandins and blood retinal barrier disruption are
likely causes (21). According to
Zhao et al (27), the reason
may be the decrease in IOP, post-operative inflammation or light
exposure after cataract surgery. The present study also suggested
that the IOP decreased at 3 months after surgery (1.81-2.24 mmHg)
compared with that of the baseline. Furthermore, the IOP exhibited
a significantly positive correlation with SVD at the first
post-operative month, which may further demonstrate the influence
of the IOP on the vessels. However, it was indicated that the
vessel density and RT fluctuated more obviously in patients with
high myopia than in normal patients after surgery. This result
indicated that the macular function in patients with high myopia
was more susceptible to the influence of surgery. It was
hypothesized that thinner retinal and choroidal thickness,
decreased vessel density and thinner RNFL thickness in patients
with high myopia (6), as well as
decreased vessel diameter (7), may
be attributed to this variation. Of note, both SVD and DVD
exhibited a sudden significant decrease at 3 months after surgery
in the high myopia group, which may indicate that the function of
the retinal vessels of patients with high myopia was even worse
than that of low myopia patients.
Although superficial vascular density increased
after cataract surgery in both groups, the mean increase was lower
in patients with high myopia than that in patients with low myopia.
A possible reason may be the high IP used for maintaining IOP
during surgery. One study suggested that a transient high IOP
reduced the vessel diameters of the retina and optic disc in
healthy rabbits and that the microcirculation gradually recovered
to normal levels within 30 min after the high IOP was removed
(28). The microcirculation
perfusion was damaged when the IOP exceeded the autoregulatory
capacity of the retinal vessels (29). In cataract surgery, the IP is
maintained at a high level for a certain duration. IOP fluctuations
during surgery caused by a high IP may affect retinal hemodynamics.
Saygili et al (30) also
demonstrated that increased IOP during cataract surgery decreased
the flow velocity of the central retinal artery, which supplied the
inner retinal layer with colorful Doppler and thereby affected the
retinal perfusion. The present study indicated that the retinal
vascular density was lower in the high myopia group than that in
the low myopia group after surgery based on OCTA, which suggested
that the retinal vascular perfusion was also lower in patients with
high myopia than in patients with low myopia. A number of adverse
factors in high myopia, including longer AL, reduced retinal and
choroidal thickness, reduced RNFL thickness (6) and decreased vessel diameter (7), may affect the macular vascular system.
The retinal vessels in patients with high myopia may be less able
to tolerate the high IOP fluctuations during surgery that occur for
a relatively long time. This eventually leads to insufficient
self-regulation and inadequate perfusion of superficial retinal
vessels after cataract surgery. In addition, the post-operative IOP
of patients with high myopia was significantly higher than that of
the low-myopia group, and low myopia may also be the reason for
lower vascular density after the operation. Furthermore, the SVD of
eyes with high myopia was even lower at 3 months compared with that
at baseline. This result also indicated that patients with high
myopia may exhibit lower retinal perfusion over a period of time.
This suggests that it may be necessary to monitor retinal perfusion
in patients with high myopia after surgery in the long term, which
has not been previously reported and further research is required
to support this notion.
Furthermore, the present study indicated a negative
correlation between AL and SVD, which was consistent with previous
studies. Fan et al (7)
recruited participants under 40 years of age with different
refractive statuses, including a control group (AL=23.28 mm), a
moderate group (AL=24.98 mm) and a high-myopia group (AL=29.01 mm),
and determined by using OCTA that the vascular density decreased in
the macular region with a longer AL but not in the disc region. Lam
et al (31) demonstrated
that the outer macular thickness decreased with a longer AL, while
the central macular thickness increased with OCT in patients with
myopia and pathologic myopia between 40 and 50 years of age. In
addition, the present study indicated that the correlation
exhibited a dynamic and changing tendency after cataract surgery,
which had not been mentioned in previous studies. A reason for the
changes in relevance may be that the post-operative inflammation
induced by surgical trauma at different time-points affected
retinal perfusion.
In addition, the present study determined that
vessel density and RT remained positively correlated after surgery.
The SVD had a significant positive correlation with the superficial
RT but not with the full RT of the parafovea at an early stage
after surgery, which was also demonstrated by other studies. For
instance, using OCTA, Yu et al (23) demonstrated that the inner RT (from
the ILM to the inner nuclear layer) was positively correlated with
vascular density in both the macular and peripapillary areas in
healthy subjects. Fan et al (7) indicated a positive correlation between
MVD and GCL thickness, which was mainly supplied by superficial
retinal vessels. Of note, the present study suggested that the
correlation continued to change from mild to moderate after
cataract surgery, which demonstrated that vascular density and RT
may vary between different time-points. It was assumed that the
thinning of the RT resulted in decreased oxygen demand and the
blood microcirculation may consequently be reduced (9). However, it is possible that the vessel
density changed prior to RT, which requires further study.
Mo et al (5)
also indicated that the BCVA was positively correlated with the
macular flow density among patients with pathological myopia.
However, in the present study, no significant correlation was
obtained between BCVA and MVD, neither prior to nor after surgery.
Patients with high myopia without pathological myopia were enrolled
in the present study and 83% of the patients with high myopia were
classified as having peripapillary staphyloma. The majority of
patients with high myopia had no macular atrophy, which may explain
the absence of a correlation between BCVA and MVD in the present
study. Patients with severe cataracts and macular atrophy were
excluded from the present study because it was observed that these
patients did not cooperate well during the examination and the data
measured using OCTA were unreliable.
There are certain limitations to the present study.
First, the number of patients included was relatively small and a
future study with a larger sample size may provide further
information about MVD variation after phacoemulsification.
Furthermore, the density of the cataract may influence the accuracy
of the measurements of vascular density and RT. Finally, additional
types of high myopia should be included in further studies to
examine the variation of retinal perfusion after cataract surgery
in those patients.
In conclusion, superficial retinal perfusion was
lower after phacoemulsification in patients with high myopia
compared with that of patients with normal cataract, which exposed
patients to the risk of experiencing complications that are caused
by poor perfusion. Therefore, OCTA should be performed on
post-operative patients with high myopia who are at high risk of
ischemia.
Supplementary Material
Table SI. Superficial macular vascular
density in the parafovea (%) at baseline and 4 post.operative
time.points.
Table SII. Retinal thickness in the
parafovea (mm) at baseline and 4 post.operative time.points.
Acknowledgements
The authors thank Mr. Chen Lei, ophthalmic
technician at the Department of Ophthalmology of Shanghai 10th
People's Hospital affiliated to Tongji University who helped make
measurements for patients with OCTA.
Funding
This study was funded by the Shanghai Shenkang
Clinical Research Cultivation Project (grant no. SHDC12019X30).
Availability of data and materials
The datasets used and/or analyzed during the current
study are available from the corresponding author on reasonable
request.
Authors' contributions
All authors contributed to the conception and design
of the study. TL collected the patient information, analyzed the
data and wrote the manuscript draft. AG was involved in drafting
the manuscript and analysis and interpretation of the data. LF and
JF participated in data collection and data analysis. ZJ performed
data and statistical analysis. FL designed the experiments,
analyzed and discussed the data, had an important role in
interpreting the results and approved the final version of the
manuscript. All authors read and approved the final manuscript.
Ethics approval and consent to
participate
The subjects provided written informed consent and
the study protocol was approved by the Clinical Research Ethical
Committee of Shanghai 10th People's Hospital affiliated to Tongji
University (Shanghai, China).
Patient consent for publication
Not applicable.
Competing interests
The authors declare that they have no competing
interests.
References
|
1
|
Eom SY, Yim DH, Kim JH, Chae JB, Kim YD
and Kim H: A pilot exome-wide association study of age-related
cataract in Koreans. J Biomed Res. 30:186–190. 2016.PubMed/NCBI View Article : Google Scholar
|
|
2
|
Mohammadi A, Khorasani N, Moloudi F and
Ghasemi-Rad M: Evaluation of retrobulbar blood flow in patients
with age-related cataract; color Doppler ultrasonographic findings.
Clin Ophthalmol. 5:1521–1524. 2011.PubMed/NCBI View Article : Google Scholar
|
|
3
|
Emeriewen K, Kadare S, Tsatsos M,
Athanasiadis Y, MacGregor C and Rassam S: Non-arteritic anterior
ischaemic optic neuropathy after uneventful cataract extraction.
Neuroophthalmology. 40:225–228. 2016.PubMed/NCBI View Article : Google Scholar
|
|
4
|
Al-Madani MV, Al-Raqqad NK, Al-Fgarra NA,
Al-Thawaby AM and Jaafar AA: The risk of ischemic optic neuropathy
post phacoemulsification cataract surgery. Pan Afr Med J.
28(53)2017.PubMed/NCBI View Article : Google Scholar
|
|
5
|
Mo J, Duan A, Chan S, Wang X and Wei W:
Vascular flow density in pathological myopia: An optical coherence
tomography angiography study. BMJ Open. 7(e013571)2017.PubMed/NCBI View Article : Google Scholar
|
|
6
|
Ng DS, Cheung CY, Luk FO, Mohamed S,
Brelen ME, Yam JC, Tsang CW and Lai TY: Advances of optical
coherence tomography in myopia and pathologic myopia. Eye (Lond).
30:901–916. 2016.PubMed/NCBI View Article : Google Scholar
|
|
7
|
Fan H, Chen HY, Ma HJ, Chang Z, Yin HQ, Ng
DS, Cheung CY, Hu S, Xiang X, Tang SB and Li SN: Reduced macular
vascular density in myopic eyes. Chin Med J (Engl). 130:445–451.
2017.PubMed/NCBI View Article : Google Scholar
|
|
8
|
Benavente-Pérez A, Hosking SL, Logan NS
and Broadway DC: Ocular blood flow measurements in healthy human
myopic eyes. Graefes Arch Clin Exp Ophthalmol. 248:1587–1594.
2010.PubMed/NCBI View Article : Google Scholar
|
|
9
|
Wang X, Kong X, Jiang C, Li M, Yu J and
Sun X: Is the peripapillary retinal perfusion related to myopia in
healthy eyes? A prospective comparative study. BMJ Open.
6(e010791)2016.PubMed/NCBI View Article : Google Scholar
|
|
10
|
Nagiel A, Sadda SR and Sarraf D: A
promising future for optical coherence tomography angiography. JAMA
Ophthalmol. 133:629–630. 2015.PubMed/NCBI View Article : Google Scholar
|
|
11
|
Jia Y, Bailey ST, Hwang TS, McClintic SM,
Gao SS, Pennesi ME, Flaxel CJ, Lauer AK, Wilson DJ, Hornegger J, et
al: Quantitative optical coherence tomography angiography of
vascular abnormalities in the living human eye. Proc Natl Acad Sci
USA. 112:E2395–E2402. 2015.PubMed/NCBI View Article : Google Scholar
|
|
12
|
Chylack LT Jr, Wolfe JK, Singer DM, Leske
MC, Bullimore MA, Bailey IL, Friend J, McCarthy D and Wu SY: The
lens opacities classification system III. The longitudinal study of
cataract study group. Arch Ophthalmol. 111:831–836. 1993.PubMed/NCBI View Article : Google Scholar
|
|
13
|
Curtin BJ: The posterior staphyloma of
pathologic myopia. Trans Am Ophthalmol Soc. 75:67–86.
1977.PubMed/NCBI
|
|
14
|
Friedel JE, DeHart WB, Foreman AM and
Andrew ME: A Monte Carlo method for comparing generalized
estimating equations to conventional statistical techniques for
discounting data. J Exp Anal Behav. 111:207–224. 2019.PubMed/NCBI View
Article : Google Scholar
|
|
15
|
Azizi B, Wong T, Wan J, Singer S and
Hudson C: The impact of cataract on the quantitative, non-invasive
assessment of retinal blood flow. Acta Ophthalmol. 90:e9–e12.
2012.PubMed/NCBI View Article : Google Scholar
|
|
16
|
Spaide RF, Klancnik JM Jr and Cooney MJ:
Retinal vascular layers imaged by fluorescein angiography and
optical coherence tomography angiography. JAMA Ophthalmol.
133:45–50. 2015.PubMed/NCBI View Article : Google Scholar
|
|
17
|
Mastropasqua R, Di Antonio L, Di Staso S,
Agnifili L, Di Gregorio A, Ciancaglini M and Mastropasqua L:
Optical Coherence tomography angiography in retinal vascular
diseases and choroidal neovascularization. J Ophthalmol.
2015(343515)2015.PubMed/NCBI View Article : Google Scholar
|
|
18
|
Chalam KV and Sambhav K: Optical coherence
tomography angiography in retinal diseases. J Ophthalmic Vis Res.
11:84–92. 2016.PubMed/NCBI View Article : Google Scholar
|
|
19
|
Agemy SA, Scripsema NK, Shah CM, Chui T,
Garcia PM, Lee JG, Gentile RC, Hsiao YS, Zhou Q, Ko T and Rosen RB:
Retinal vascular perfusion density mapping using optical coherence
tomography angiography in normals and diabetic retinopathy
patients. Retina. 35:2353–2363. 2015.PubMed/NCBI View Article : Google Scholar
|
|
20
|
Yarmohammadi A, Zangwill LM, Manalastas
PIC, Fuller NJ, Diniz-Filho A, Saunders LJ, Suh MH, Hasenstab K and
Weinreb RN: Peripapillary and macular vessel density in patients
with primary open-angle glaucoma and unilateral visual field loss.
Ophthalmology. 125:578–587. 2018.PubMed/NCBI View Article : Google Scholar
|
|
21
|
Gharbiya M, Cruciani F, Cuozzo G, Parisi
F, Russo P and Abdolrahimzadeh S: Macular thickness changes
evaluated with spectral domain optical coherence tomography after
uncomplicated phacoemulsification. Eye (Lond). 27:605–611.
2013.PubMed/NCBI View Article : Google Scholar
|
|
22
|
Grzybowski A, Sikorski BL, Ascaso FJ and
Huerva V: Pseudophakic cystoid macular edema: Update 2016. Clin
Interv Aging. 11:1221–1229. 2016.PubMed/NCBI View Article : Google Scholar
|
|
23
|
Yu J, Gu R, Zong Y, Xu H, Wang X, Sun X,
Jiang C, Xie B, Jia Y and Huang D: Relationship between retinal
perfusion and retinal thickness in healthy subjects: An optical
coherence tomography angiography study. Invest Ophthalmol Vis Sci.
57:OCT204–OCT210. 2016.
|
|
24
|
Hilton EJ, Hosking SL, Gherghel D,
Embleton S and Cunliffe IA: Beneficial effects of small-incision
cataract surgery in patients demonstrating reduced ocular blood
flow characteristics. Eye (Lond). 19:670–675. 2005.
|
|
25
|
Turk A, Mollamehmetoglu S, Imamoglu HI,
Kola M, Erdol H and Akyol N: Effects of phacoemulsification surgery
on ocular hemodynamics. Int J Ophthalmol. 6:537–541. 2013.
|
|
26
|
Šiško K, Knez NK and Pahor D: Influence of
cataract surgery on macular thickness: A 6-month follow-up. Wien
Klin Wochenschr. 127 (Suppl 5):S169–S174. 2015.
|
|
27
|
Zhao Z, Wen W, Jiang C and Lu Y: Changes
in macular vasculature after uncomplicated phacoemulsification
surgery: Optical coherence tomography angiography study. J Cataract
Refract Surg. 44:453–458. 2018.
|
|
28
|
Zhao YY, Chang PJ, Yu F and Zhao YE:
Retinal vessel diameter changes induced by transient high perfusion
pressure. Int J Ophthalmol. 7:602–607. 2014.
|
|
29
|
Fortune B, Choe TE, Reynaud J, Hardin C,
Cull GA, Burgoyne CF and Wang L: Deformation of the rodent optic
nerve head and peripapillary structures during acute intraocular
pressure elevation. Invest Ophthalmol Vis Sci. 52:6651–6661.
2011.
|
|
30
|
Saygili O, Mete A, Mete A, Gungor K, Bekir
N and Bayram M: Does phacoemulsification under topical anesthesia
affect retrobulbar blood flow? J Clin Ultrasound. 40:572–575.
2012.
|
|
31
|
Lam DS, Leung KS, Mohamed S, Chan WM,
Palanivelu MS, Cheung CY, Li EY, Lai RY and Leung CK: Regional
variations in the relationship between macular thickness
measurements and myopia. Invest Ophthalmol Vis Sci. 48:376–382.
2007.
|