Introduction
Ultra-wide-field fluorescein angiography (UWFA) is a
novel technology that has developed rapidly in recent years
(1,2). As numerous pathological changes of
fundus diseases occur at the edge of the retina, the limitation of
imaging leads to insufficient diagnosis or underestimation of the
severity of the disease (3,4). Therefore, clear imaging of the edge of
the retina is important for the diagnosis, monitoring and
prognostication of patients with ocular fundus diseases. The
traditional fundus fluorescein angiography system may only provide
a vision field ranging from 30 to 55 degrees (5). Even with the conventional 7 standard
field imaging proposed by the Early Treatment Diabetic Retinopathy
Study, it may only cover the 75-degree fields, which accounts for
~25% of the total area of the retina. Thus, it cannot fully display
the retinopathy (6,7). By contrast, the current
ultra-wide-angle technology has been able to provide a vision
ranging from 100 to 200 degrees (8-10).
In addition, by using the traditional fundus fluorescein
angiography system, observation and precise measure of structures
and lesions around the edge of the fundus may only be performed
through later image reconstruction (11). However, the blood circulation is a
dynamic process and there is a time delay in the images captured;
therefore, there are certain limitations in the observation of the
structure of the retina and choroid, as well as the blood
circulation.
The current UWFA technology features
ultra-wide-angle color photography, autofluorescence imaging and
fluorescein angiography, and all of these have been widely used in
the observation and research of marginal retinal diseases (1,12).
However, clinical data produced using this imaging technology are
still limited. By collecting clinical research data, the advantages
and disadvantages of UWFA technology may be elucidated, which is
key in the interpretation of images and the application of UWFA may
be constantly enhanced. This will facilitate the accuracy of the
assessment of fundus diseases, even under complex conditions.
At present, the most widely used UWFA devices on the
market are the 200Tx Optos ultra-widefield imaging system (Optus)
and the Spectralis HRA+ optical coherence tomography (OCT) system
(Heidelberg Spectralis) (13,14).
These two types of ultra-wide-angle fundus imaging device may
obtain retinal images in a variety of modes of the posterior pole
and the marginal region through non-contact single photographing
without any later image reconstruction (1,15).
However, there are certain different characteristics in imaging
between the two systems. On a single non-steered image, the Optos
covers a larger total retinal area and greater image variability
than the Spectralis, while the Spectralis captures the superior and
inferior retinal vasculature more peripherally (14). To date, no comprehensive comparative
analysis of the two imaging systems has been performed. In the
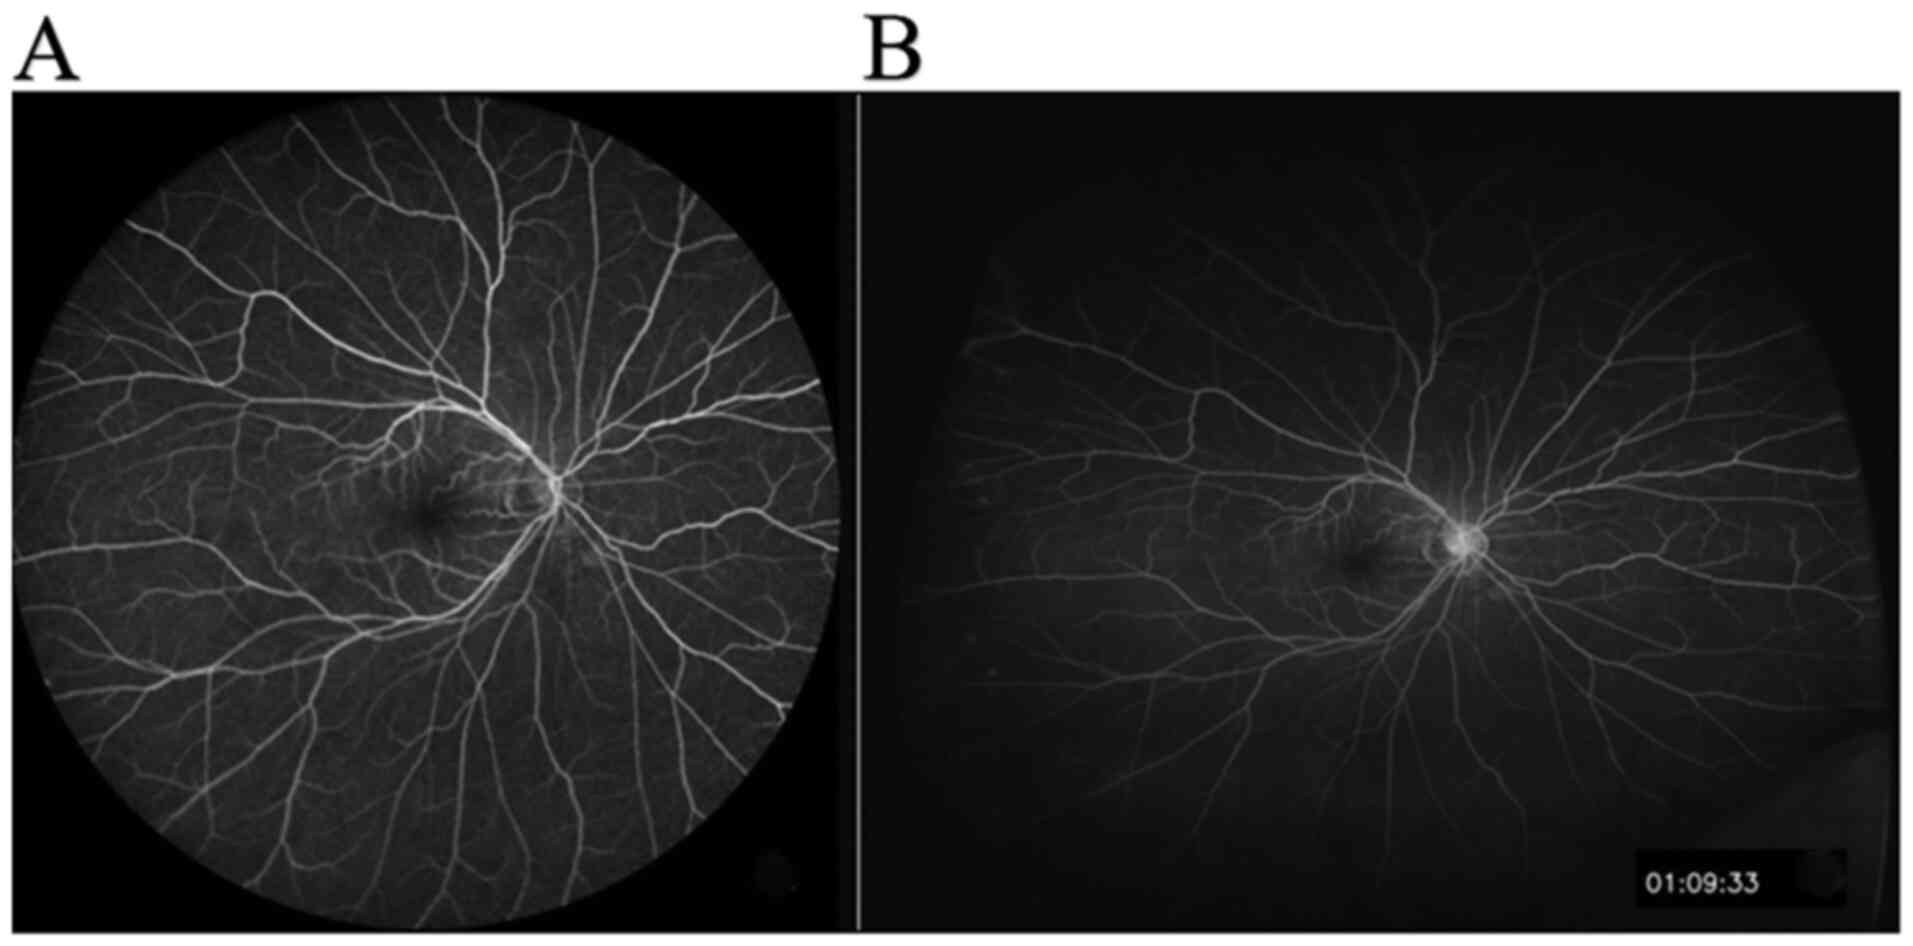
present study, macula centered images obtained from a single shot
by using the two devices, Optos and Spectralis, were analyzed
(Fig. 1). The total area of the two
UWFA images, as well as the retina imaging area of the four
quadrants, which are nasal, superior, inferior and temporal, were
compared. The present study provides practical information for the
clinical application of these two systems.
Patients and methods
Study design and participants
A single-center, open-labeled prospective cohort
study was performed at the Department of Ophthalmology, Beijing
Friendship Hospital, Capital Medical University (Beijing, China)
from January to June 2017. A total of 18 adult patients (36 eyes)
were screened for inclusion. The inclusion criteria were as
follows: Age, ≥18 years; diopter interstitial clear; best-corrected
visual acuity >20/200. The following exclusion criteria were
applied: The eye condition changed significantly during the first 3
months after the first fundus examination; retinal detachment and
choroidal detachment; difficult image acquisition due to poor
vision; intolerance or poor cooperation with fluorescein fundus
angiography (FFA) examination; allergy to fluorescein sodium (for
injection).
Fluorescein angiography and image
selection
For outcome evaluation, the total area and area
within each of four visualized quadrants (superior, inferior, nasal
and temporal) were calculated and compared. The 200Tx Optos
ultra-wide field imaging system (Optus) and the Spectralis HRA+OCT
system (Heidelberg Spectralis) were used to collect fundus
angiography images.
First, allergy to the contrast media was tested by a
subcutaneous test; a specialized technician dilated the pupil for
half an hour by using tropicamide phenylephrine eye drops.
Subsequently, 1% fluorescein sodium diluent was injected and
observed to confirm that the patients were not allergic to the
contrast media. Subsequently, 5 ml 20% fluorescein sodium injection
was injected in 5 sec via the elbow vein. For the Spectralis, after
capturing a 30-sec video by using a 102 degrees super wide-angle
front lens, the patients were instructed to rotate their eyeballs
in 9 directions in turn: The posterior pole, superior, superior
temporal, temporal, infratemporal, inferior, superior nasal, nasal
and infra nasal direction, and 1 image was collected per second.
For the Optos 200Tx, after capturing 60-sec images of the posterior
pole, the patients were instructed to rotate their eyeballs in 4
directions in turn: Superior, inferior, nasal and temporal, and 1
image was collected per second (Fig.
1). The retinogram images of 30 sec to 3 min, clear,
representative and venous phase, were selected for comparative
analysis. All of the angiographic images were captured by an
experienced technician. UWFFA images from the Optos 200Tx were
transformed to stereographic projection images using proprietary
software available from the manufacturer (Doheny Eye Institute)
before quantitative analysis (16).
Quantitative analysis method and
quality control of FFA images
First, two different modal images of the Spectralis
and Optos 200Tx were calibrated and standardized by using ImageJ
1.49b software (National Institutes of Health). The retina profiles
of the FFA images captured by the two devices were then
respectively depicted by using Adobe® Photoshop CS6
(Adobe Inc.). Grading results were saved as binary masks and
subsequently calculated in square millimeters by summing the size
of all pixels that make up the mask using the manufacturer's
(16) quantification software
(Doheny Eye Institute). If the UWFA image was poor, the image
quality was improved by adjusting the contrast and brightness, and
subsequently, the contour of the image was accurately delineated
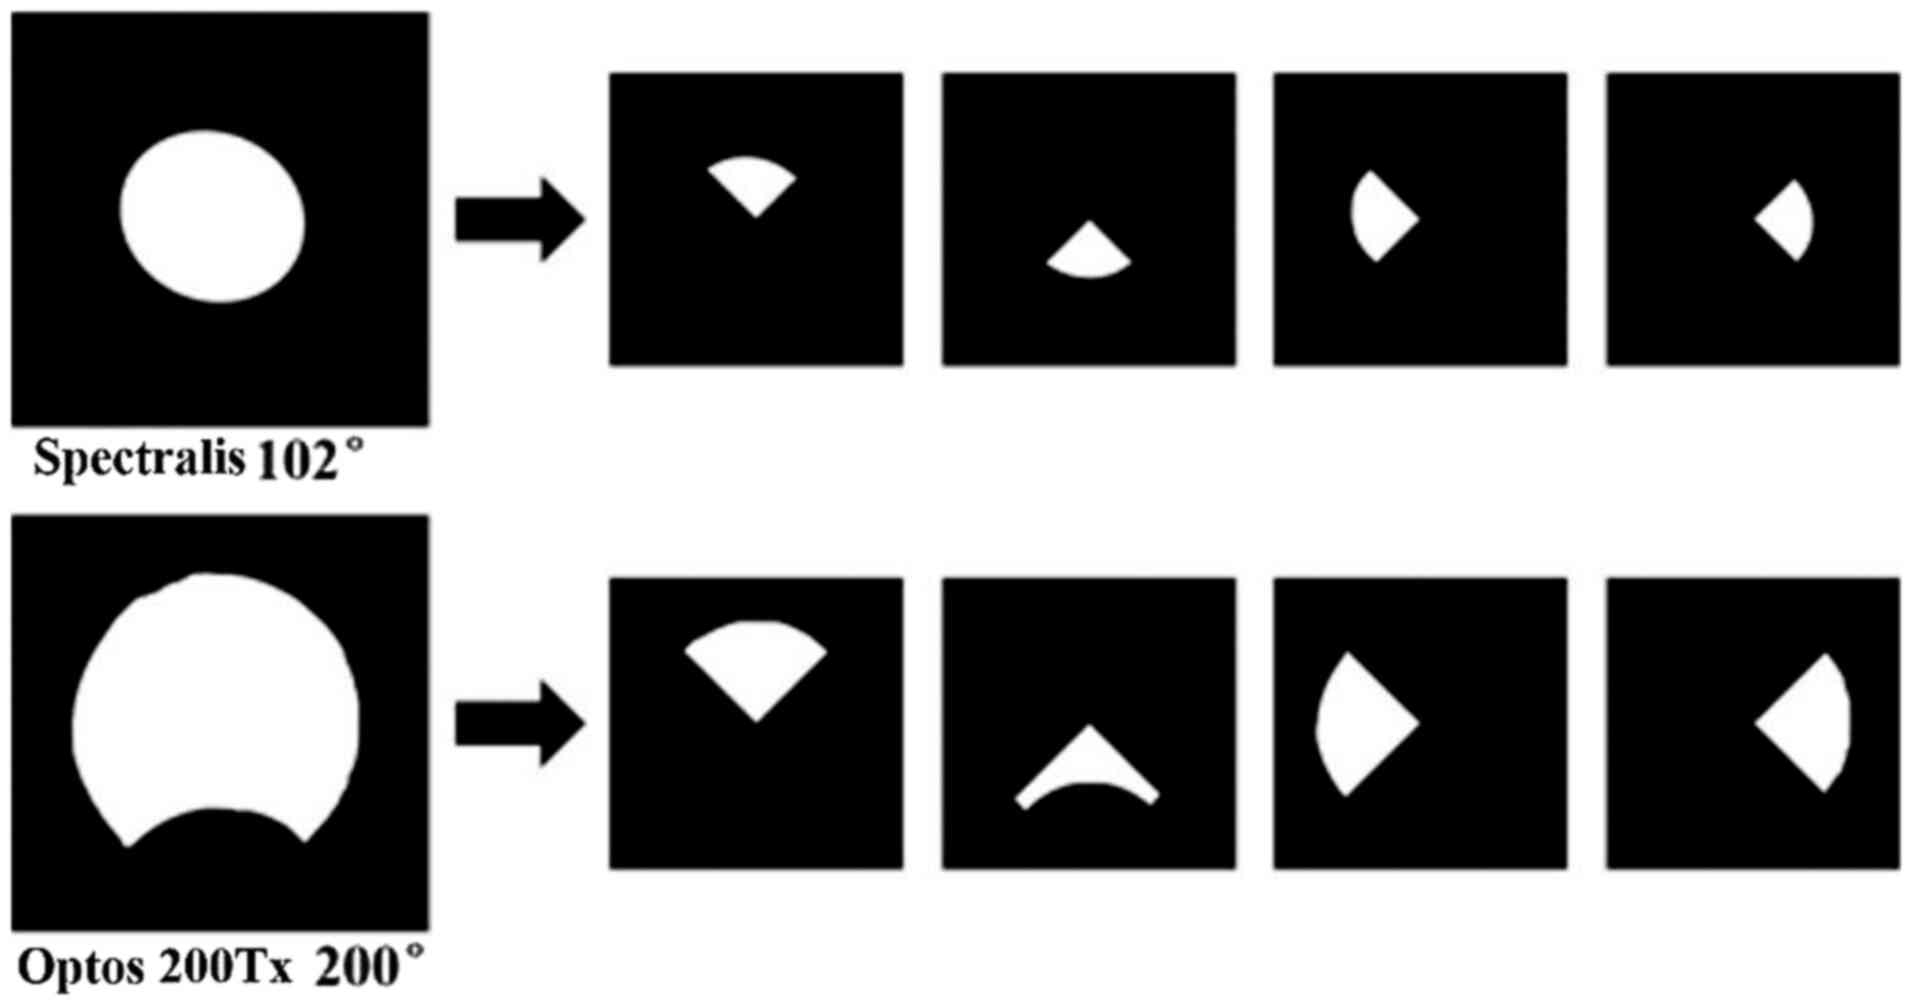
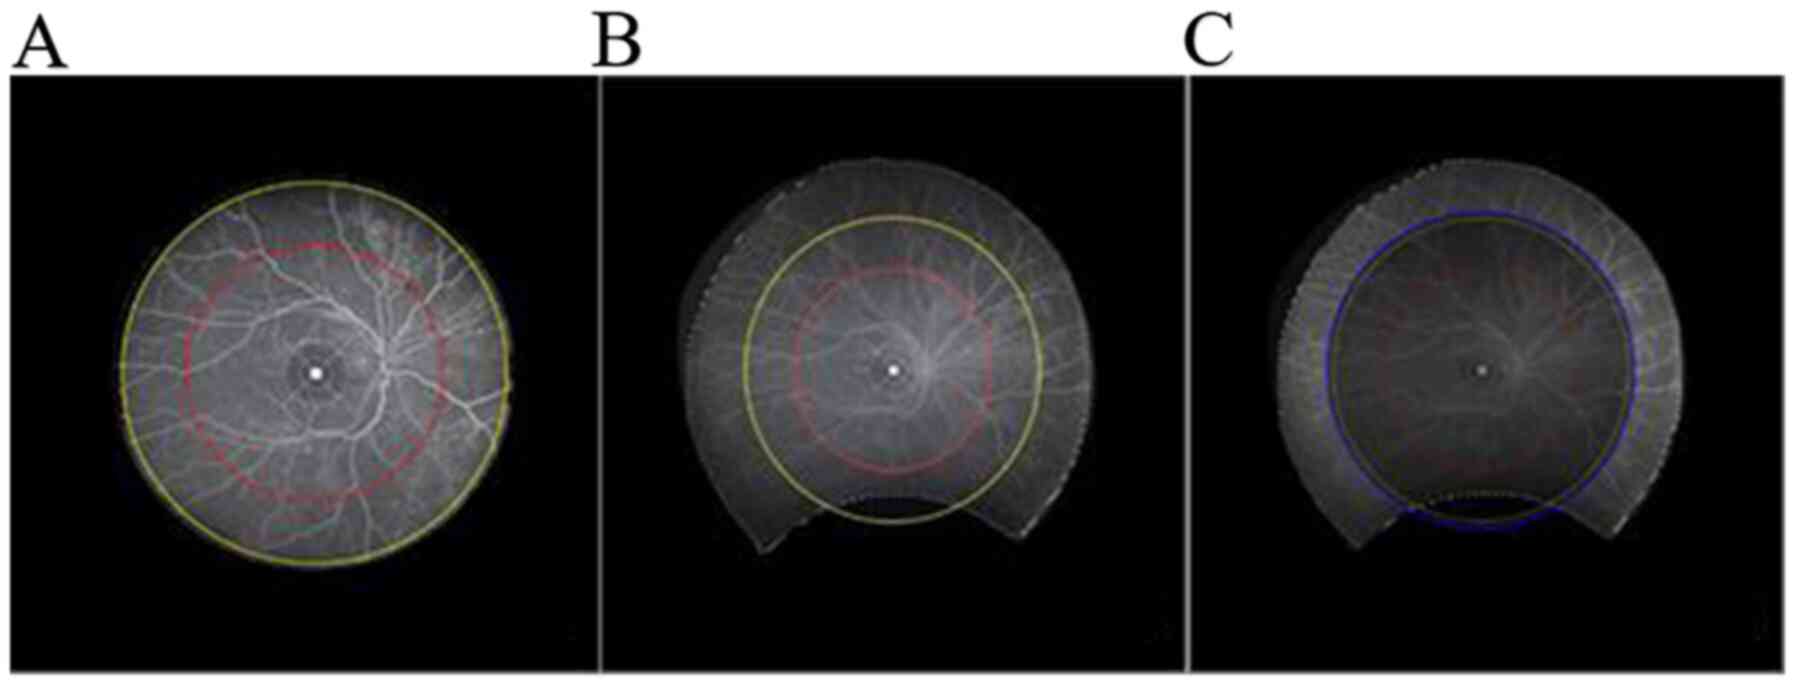
and measured. The analysis regions included the following: a)
Centered on the macula, the area was evenly divided into four
quadrants: Superior, inferior, nasal and temporal; b) centered on
the macula, areas with a diameter of 10 and 15 mm. The drawing
process is illustrated in Fig. 2
and 3. The total area and the four
quadrant areas of the contrast images captured with the two devices
were individually calculated. The total area (mm2) of
FFA retinal imaging and the captured area of the regions from the
two devices were compared.
Statistical analysis
SPSS 20.0 software (IBM Corp.) was used for
statistical analysis of the data. Measurement data were expressed
as the mean ± standard deviation. For comparison between different
devices in the same test area, a paired Student's t-test was used
when data conformed to a normal distribution and Wilcoxon's
signed-rank test was used when data did not conform to a normal
distribution. The Shapiro-Wilk method was used to test the
normality of distribution of the data. The Friedman test was used
to assess differences between directions with the same instrument,
and post-hoc analysis with a paired Student's t-test or Wilcoxon
signed-rank tests was performed with a Bonferroni correction
applied. All tests were bilateral and P<0.05 was considered to
indicate statistical significance.
Results
Characteristics of the
participants
A total of 72 FFA images from 18 patients (36 eyes)
were included in the present study (Table I), including 11 male cases with 22
eyes and 7 female cases with 14 eyes. The patients' age ranged from
53 to 82 years and the average age was 63.80±12.50 years. The
diseases included diabetic retinopathy (DR; 18 eyes), central
retinal vein occlusion (3 eyes), retinal branch vein occlusion (3
eyes), wet age-associated macular degeneration (1 eye), anterior
ischemic optic neuropathy (1 eye), ocular ischemic syndrome (1 eye)
and retina lattice degeneration (1 eye), as well as healthy eyes
(n=8). All subjects were examined with the Spectralis equipment
first and then with the Optos 200Tx after a period of time. The
interval of the two examinations was <3 months. In addition, a
paired comparison of two images obtained from the same eye of the
same patient was performed.
 | Table IDemographic characteristics of the
patients (n=18). |
Table I
Demographic characteristics of the
patients (n=18).
| Item | Value |
|---|
| Age (years) | 63.80±12.50 |
| Sex
(male/female) | 11/7 |
| Disease type
(eye/eyes) |
|
Diabetic
retinopathy | 18 |
|
Central
retinal vein occlusion | 3 |
|
Retinal
branch vein occlusion | 3 |
|
Wet
age-related macular degeneration | 1 |
|
Anterior
ischemic optic neuropathy | 1 |
|
Ocular
ischemic syndrome | 1 |
|
Retina
lattice degeneration | 1 |
|
Healthy | 8 |
Analysis of accurate measurement
results of the FFA imaging area
The total FFA retina imaging areas and the areas of
the two regions within the radius of the Spectralis and Optos 200Tx
are provided in Table II. The
areas exhibited the following trend: Spectralis 10 mm = Optos 200Tx
10 mm < Spectralis 15 mm < Spectralis total < Optos 200Tx
15 mm < Optos 200Tx total. The results suggested that there was
no statistically significant difference between total area and
15-mm area of the Spectralis (P>0.05), while the other
differences in the pairwise comparisons were statistically
significant (P<0.05).
| Table IIComparison of FFA imaging total area
between the Spectralis and Optos 200Tx. |
Table II
Comparison of FFA imaging total area
between the Spectralis and Optos 200Tx.
| Imaging method | Optos 200Tx
(mm2) | Heidelberg Spectralis
(mm2) | Statistic (t/S) | P-value |
|---|
| FFA imaging
total | 804.36±68.61 | 520.11±32.77 | -25.939 | <0.001 |
| 15 mm region | 596.45±33.24 | 509.2±49.13 | 12.676 | <0.001 |
| 10 mm region | 295.57±2.93 | 291.79±17.68 | 5.000 | 0.453 |
Analysis of area measurement results
of FFA quadrant imaging
A qualitative comparison of the retinal imaging area
in the four quadrants of the superior, temporal, inferior and nasal
field between the Spectralis and Optos 200Tx is provided in
Fig. 2, and an intra-group
comparison of the four quadrants is also displayed in Fig. 2. The four quadrant imaging areas of
the Optos 200Tx FFA were larger than those of the Spectralis and
the difference was statistically significant. The inter-group
comparison of the four quadrant imaging areas of the Spectralis and
Optos 200Tx revealed statistically significant differences
(P<0.001). The further analysis indicated that the order of the
mean area was as follows: For the Spectralis, inferior <
temporal < nasal < superior; for the Optos 200Tx, inferior
< temporal < superior < nasal (Table III). The differences in retinal
imaging area between the inferior quadrant and the superior
quadrant of the Spectralis FFA image were statistically significant
(Bonferroni-adjusted P<0.05), while the remaining pairwise
comparisons revealed no significant difference (Bonferroni-adjusted
P>0.05). Regarding the area of the Optos 200Tx FFA retina
imaging, the comparison between the temporal and the superior
quadrant indicated no statistically significant difference
(Bonferroni-adjusted P>0.05), while the results of the pairwise
comparisons of other quadrants revealed statistically significant
differences (Bonferroni-adjusted P<0.05). The intra-group
comparison for the Optos 200Tx (Friedman test, P<0.001) and the
Spectralis (Friedman test, P=0.026) is provided in Tables IV and V, respectively.
| Table IIIInter-group comparison of four
quadrant imaging areas of fluorescein fundus angiography. |
Table III
Inter-group comparison of four
quadrant imaging areas of fluorescein fundus angiography.
| Imaging
orientation | Optos 200Tx
(mm2) | Heidelberg Spectralis
(mm2) | Statistic(t/S) | P-value |
|---|
| Superior | 207.08±36.41 | 142.95±48.12 | -294.000 | <0.001 |
| Inferior | 162.21±33.56 | 124.4±11.42 | -328.000 | <0.001 |
| Nasal | 226.11±22.18 | 133.2±14.2 | -333.000 | <0.001 |
| Temporal | 204.27±33.12 | 127.43±19.94 | -20.039 | <0.001 |
| Table IVComparison of different imaging
positions of the Optos 200Tx. |
Table IV
Comparison of different imaging
positions of the Optos 200Tx.
| Imaging
orientation | Difference value
(mm2) | Statistic (t/S) | P-value |
|---|
| Superior vs.
inferior | 44.87±56.41 | 261.000 | <0.001 |
| Superior vs.
nasal | -19.02±37.92 | -210.000 | <0.001 |
| Superior vs.
temporal | 2.81±37.75 | 0.447 | 0.658 |
| Inferior vs.
nasal | -63.9±37.92 | -330.000 | <0.001 |
| Inferior vs.
temporal | -42.06±42.64 | -286.000 | <0.001 |
| Nasal vs.
temporal | 21.84±44.95 | 157.000 | 0.008 |
| Table VComparison of different imaging
positions of the Heidelberg Spectralis. |
Table V
Comparison of different imaging
positions of the Heidelberg Spectralis.
| Imaging
orientation | Difference value
(mm2) | Statistic
(t/S) | P-value |
|---|
| Superior vs.
inferior | 18.55±56.09 | 203.000 | 0.001 |
| Superior vs.
nasal | 9.75±48.96 | 80.000 | 0.213 |
| Superior vs.
temporal | 15.51±59.35 | 126.000 | 0.046 |
| Inferior vs.
nasal | -8.8±19.48 | -140.000 | 0.026 |
| Inferior vs.
temporal | -3.03±16.37 | -1.111 | 0.274 |
| Nasal vs.
temporal | 5.77±27.79 | 10.000 | 0.878 |
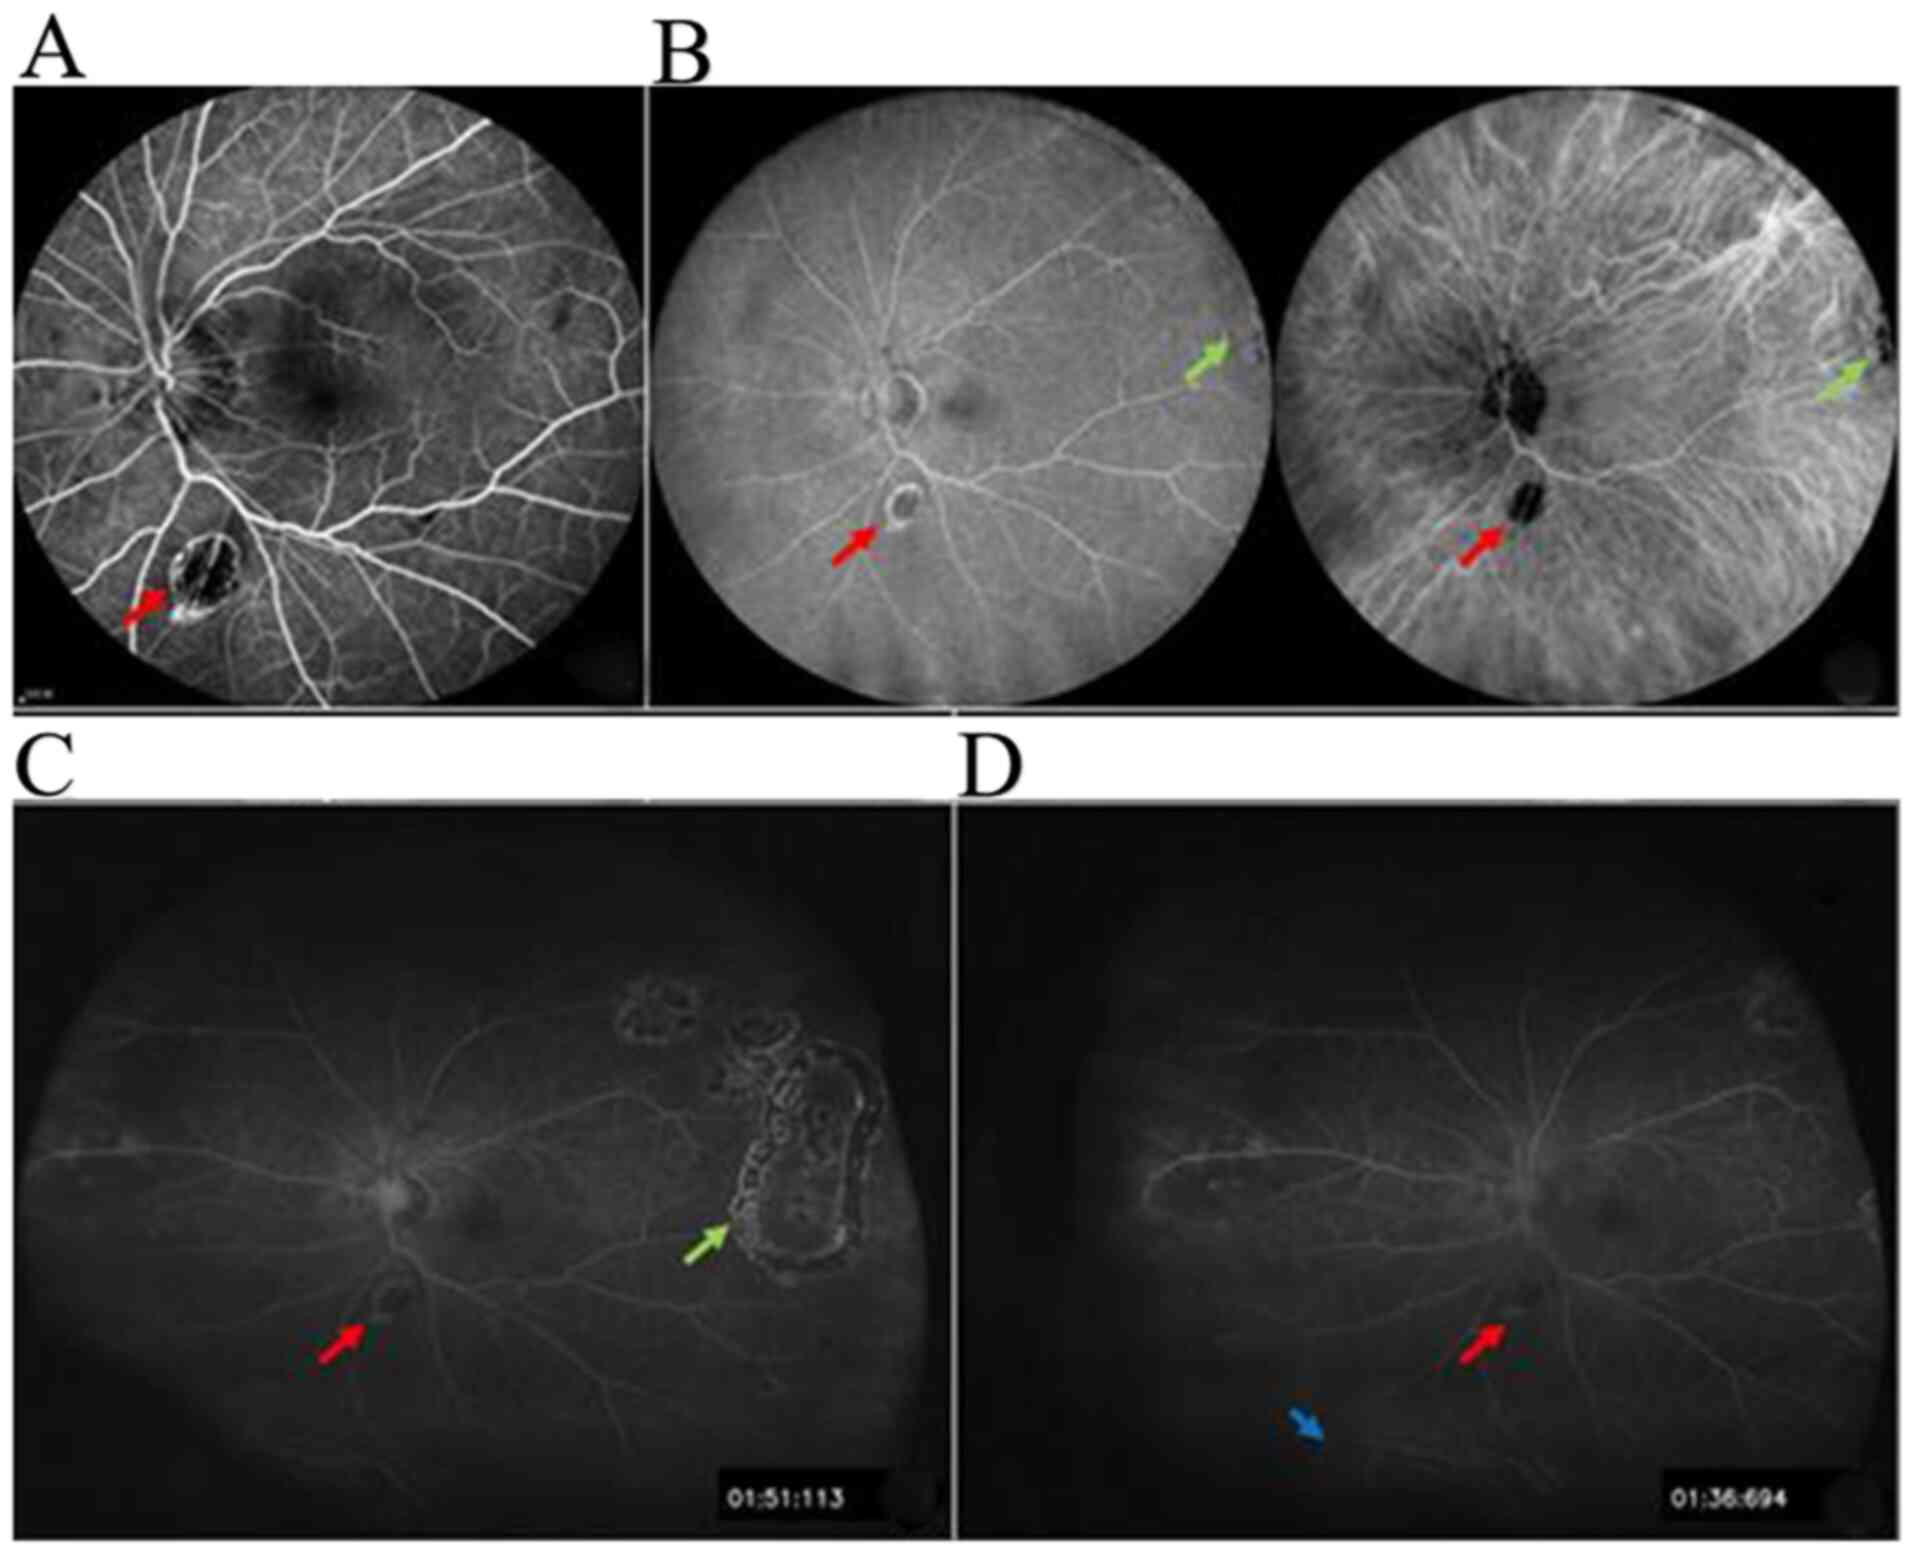
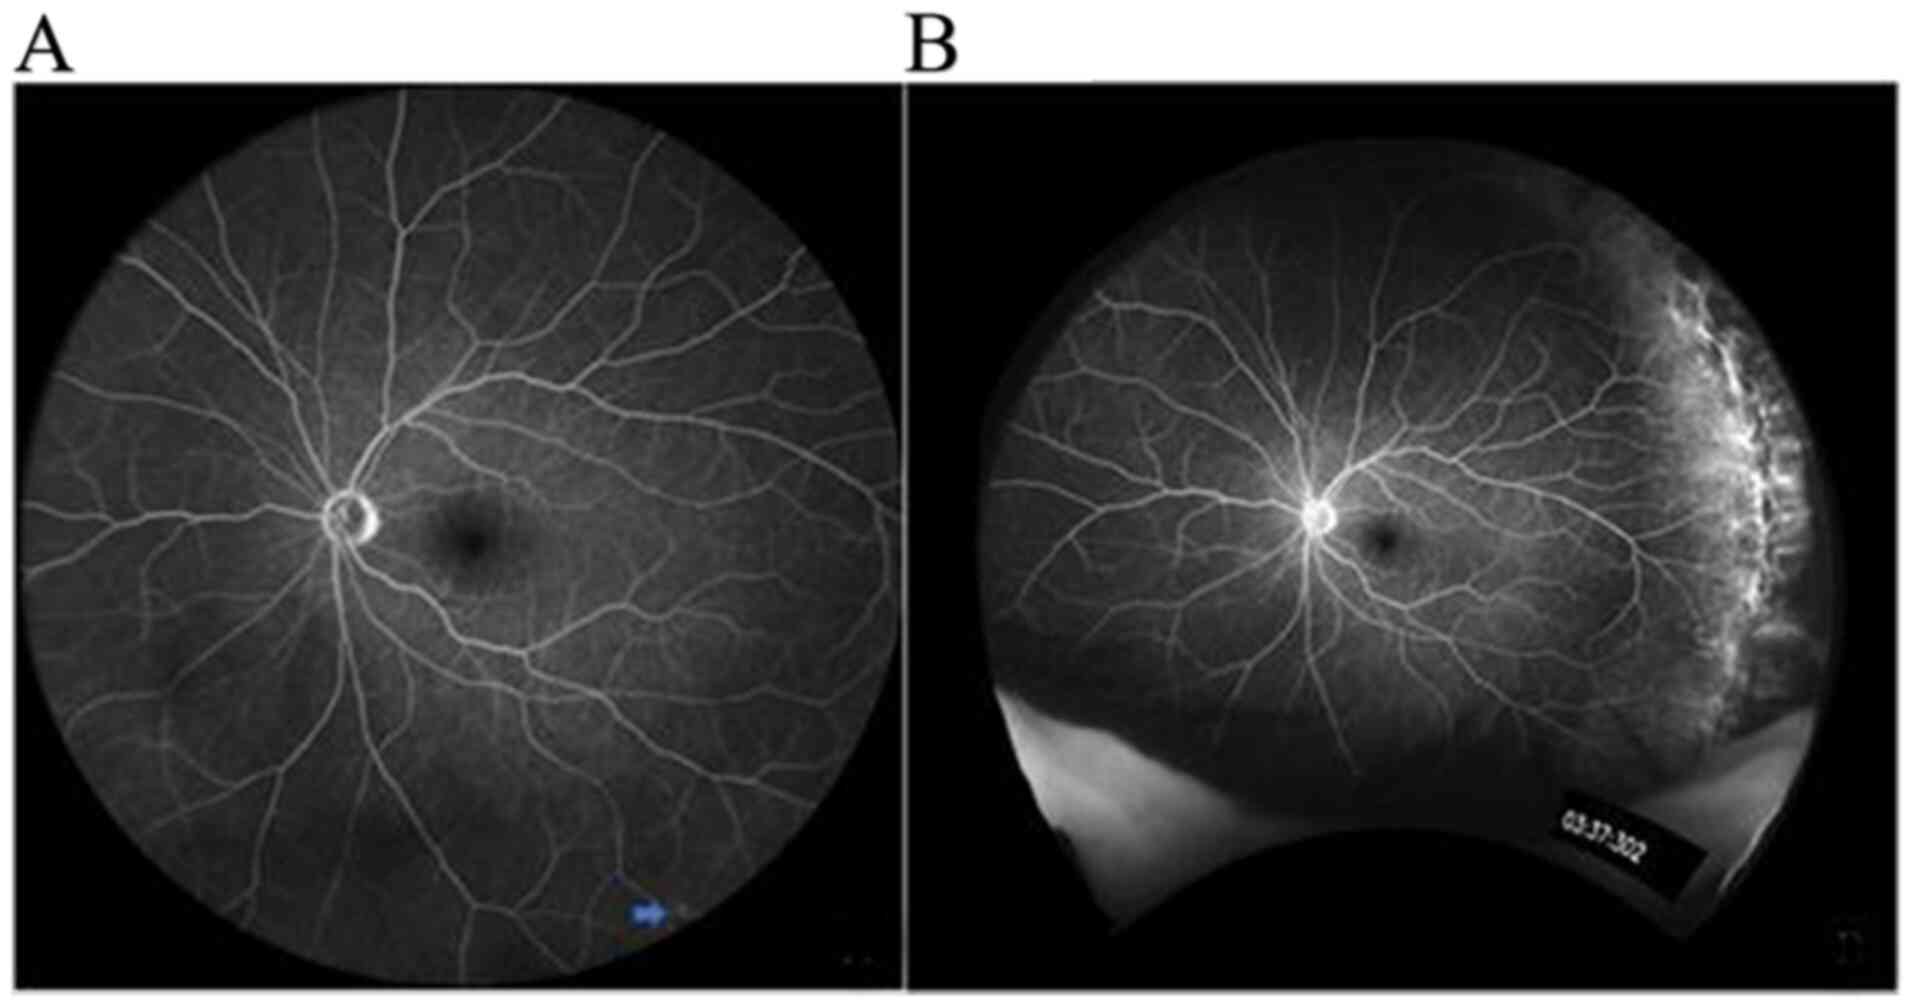
For the FFA macular-centered single-shot images that
were used to detect peripheral retinal hiatus, vascular leakage,
neovascularization and no perfusion area, the Optos 200Tx was less
likely to miss anomalies compared with the Spectralis at 55 and 102
degrees. Furthermore, the lesions may be treated by using a laser
or other methods under the guidance of the Optos 200Tx FFA, as
presented in Fig. 4.
In the representative images in Fig. 5, the images were taken for an FFA
test, as a single shot with the macula as the center and the
patient had diabetes for 10 years. A microangioma was detected in
the inferior field using the Spectralis at 102 degrees, but nothing
was detected using the Optos 200Tx.
Discussion
UWFA is a novel technology for retina examination,
but its clinical application of it is not very extensive (17), as clinicians are currently not very
familiar with it. Elucidation of the advantages and disadvantages
of UWFA technology may allow for continuous enhancement of the
clinical application of UWFA and may lead to an improved
understanding of fundus diseases. The Optos 200Tx and Spectralis
are the two most widely used devices in the clinic and the present
study compared the imaging scope and characteristics of the two
devices.
In the present study, the total imaging area and the
imaging area of the four quadrants, namely superior, temporal,
inferior and nasal, of the two devices were first compared. The
results indicated that the total FFA imaging area and the area of
the four quadrants of the Optos 200Tx were significantly larger
than those of the Spectralis.
In addition, intra-group comparisons of the four
quadrant imaging areas (superior, temporal, inferior and nasal) of
the two sets of equipment were performed in the present study. The
results indicated that in the FFA images obtained from a
macular-centered single shot, the inferior quadrant was the
smallest, while the superior and the nasal quadrants were
relatively large. It was speculated that this may be due to the
eyelash occlusion in the inferior quadrant and the contraction of
the orbicularis oculi muscle caused by strong light, while the
upper eyelid is relatively relaxed and easy to move away, so the
superior quadrant imaging is less affected. The comparison
indicated that there was almost no significant difference in the
imaging scope of the four quadrant radiography images of the
Spectralis; only the difference between the superior and inferior
was statistically significant. The possible reasons why the
inferior quadrant imaging area was less than that of the superior
quadrant were chiefly as follows: First, the small sample size may
have led to a larger class I error; furthermore, all image
peripheral deformations were corrected based on the Optos 3D first
and the area was then measured and this may have introduced certain
errors to the area measurement with the Spectralis. For the LSD
analysis of the imaging area of quadrants of the Optos 200Tx, the
pairwise comparisons revealed statistically significant differences
except for superior vs. temporal. The nasal and temporal imaging
areas were large and the superior and inferior areas were
insufficient. The study by Witmer et al (14) from 2013 indicated that the retinal
vascular imaging ranges of the nasal and temporal region of the
Optos 200Tx were closer to the edge than those of the Spectralis,
while the opposite was revealed for the superior and inferior
fields in the same aforementioned study. In the present study, for
the imaging area of each quadrant of the two systems, the inferior
field was the smallest, followed by the temporal field. The
Spectralis displayed the peripheral retina structure more
completely in the superior field, while the Optos 200Tx better
displayed the nasal and temporal areas. This was highly consistent
with the conclusions of Witmer et al (14). In addition, in the present study,
the images of the superior and inferior quadrants of the Optos
200Tx were frequently obscured by artifacts, eyelashes and
eyelids.
Widmer et al (18) divided the retina into a middle
round, a ring-shaped area with a radius of 10-15 mm, and a distal
round, which is the peripheral ring-shaped area of the retina with
a radius of >15 mm. In the present study, the imaging area of
the FFA images centered on the macula and radii of 10 and 15 mm was
measured with the two sets of devices and compared. The areas
exhibited the following trend: Spectralis 10 mm = Optos 200Tx 10 mm
< Spectralis 15 mm < Spectralis total < Optos 200Tx 15 mm
< Optos 200Tx total, and the differences were statistically
significant. The further analysis indicated that the difference of
the FFA area between the total and 15 mm of the Spectralis was not
statistically significant, but the other pairwise comparisons
revealed significant differences. The overall FFA imaging area of
the Optos 200Tx was the largest and the imaging radius was >15
mm. This means that the Optos 200Tx is able to cover the distal
part of the retina, which may display pathological changes of
common fundus diseases. The FFA imaging radius of the Spectralis
was close to or slightly longer than 15 mm, which means the
coverage of the Spectralis reached the middle retina and failed to
cover the far periphery. Therefore, the images taken with the
Spectralis system did not fully display any fundus lesions in the
distal round and the more peripheral areas, but this may be
compensated by the later image mosaicking.
The total area and the area of the four quadrants
obtained by FFA retinal imaging with the Optos 200Tx were larger
than those of the Spectralis and the total area exceeded the radius
of 15 mm. These results indicate that the imaging range of the
Optos 200Tx is better than that of the Spectralis. Although the
results of the present study suggest that the above two
ultra-wide-angle equipment provide a comprehensive display of
fundus lesions, including no perfusion area, microangioma, vascular
leakage, neovascularization and retinal degeneration, when it comes
to the peripheral retina, the Optos 200Tx was indicated to be more
capable of displaying the above-mentioned fundus lesions (19). The Optos 200Tx is able to identify
peripheral retinal lesions that are missed by the Spectralis, which
is of great value for the guidance of clinical treatments,
including laser therapy and intravitreal injection (19). This is of great significance for the
monitoring of ocular fundus diseases, e.g. DR, middle and anterior
uveitis and retinal vasculitis, which frequently involve the distal
peripheral retina.
The total imaging area of the Spectralis system was
slightly smaller than that of the Optos 200Tx and the radius of the
coverage region was between 10 and 15 mm. Although its visible
range is slightly smaller than that of the Optos 200Tx and has
certain limitations in the observation of distal peripheral fundus
lesions, the resolution of the built-in 55-degree lens and the
front 102-degree ultra-wide-angle lens were better than those of
the Optos 200Tx. Thus, small lesions may be clearly displayed with
the Spectralis and it is able to detect microlesions of the macular
region and the leakage of small-branch vessels, including macular
edema and macular microangioma (20). The 102-degree ultra-wide-angle lens
of the Spectralis combined with full mydriasis and rotation of the
eye to different directions, as well as the later image mosaicking,
extend the observation area to the near serrated edge (21). The combined application of the
high-resolution 55-degree visual field imaging and the
ultra-wide-angle lens may potentiate the comprehensive and thorough
observation of minor lesions in key areas, including the peripheral
retinopathy and the macular region of the posterior pole, and is
able to reduce the missed diagnosis rate of the focal area. This
will facilitate the diagnosis and treatment guidance of fundus
diseases, including DR and isolated retinal vasculitis. These
compensate the shortage of range of Spectralis imaging. The lesion
of DR frequently occurs in the periphery of the retina, while
lesions of retinal vein occlusion frequently appear on the
posterior pole, near the periphery and around the middle part
(22). In clinical practice,
suitable equipment should be selected according to the imaging
characteristics of UWFA equipment and the characteristics of the
disease.
There are certain drawbacks of the present study
that should be addressed: First, the sample size in the present
study was relatively small and this is also the major limitation of
the present study. Due to time constraints and difficult sample
acquisition conditions, 18 cases were finally included. Compared
with a previous study (14), in
which only 5 patients with 10 eyes underwent ultra-widefield
fluorescein angiography using the Optos® panoramic
P200Tx imaging system and the non-contact ultra-widefield module in
the Heidelberg Spectralis® HRA+OCT system, the results
were similar with those of the current study. Furthermore, the
images taken with the Optos 200Tx and Spectralis were not obtained
simultaneously. Finally, due to time constraints and the small
number of patients in line with the inclusion criteria, measurement
of the non-perfusion area and assessment of the influence of
different imaging ranges of the two UWFA devices on the ischemic
index were not performed. The analysis results and methodology in
the present study may help enhance the extent of clinical
application of UWFA technology. In the future, further cases will
be collected to reach a larger sample size and a more in-depth
comparative analysis will be performed.
Acknowledgements
Not applicable.
Funding
This work was supported by grants from the
High-level Health Technology Talents Training Program of the
Beijing Health System and Research Foundation of Beijing Friendship
Hospital, Capital Medical University (grant no. BJ-LM2017005L). The
sponsor or funding organization had no role in the design or
performance of this study.
Availability of data and materials
The datasets used and/or analyzed during the current
study are available from the corresponding author on reasonable
request.
Authors' contributions
SL and KW conceived and designed the experiments.
SL, JJW, HYL, WW, MT and XQL performed the experiments. SL and JJW
analyzed the data. SL wrote the paper. KW finally revised the
paper. All authors had reviewed and agreed on the contents of this
paper.
Ethics approval and consent to
participate
The present study was approved by the Ethics
Committee of the Affiliated Beijing Friendship Hospital, Capital
Medical University (Beijing, China), and all procedures were
designed and performed according to the Declaration of Helsinki.
All patients were informed of the purpose and methods in detail
prior to enrolment in the study and provided written informed
consent to participate in the study.
Patient consent for publication
All patients consented for the publication of the
data and photos in the current paper.
Competing interests
The authors declare that they have no competing
interests.
References
|
1
|
Shoughy SS, Arevalo JF and Kozak I: Update
on wide- and ultra-widefield retinal imaging. Indian J Ophthalmol.
63:575–581. 2015.PubMed/NCBI View Article : Google Scholar
|
|
2
|
Calvo CM and Hartnett ME: The utility of
ultra-widefield fluorescein angiography in pediatric retinal
diseases. Int J Retina Vitreous. 4(21)2018.PubMed/NCBI View Article : Google Scholar
|
|
3
|
Lim LS, Mitchell P, Seddon JM, Holz FG and
Wong TY: Age-related macular degeneration. Lancet. 379:1728–1738.
2012.PubMed/NCBI View Article : Google Scholar
|
|
4
|
Chen JJ and Kardon RH: Avoiding clinical
misinterpretation and artifacts of optical coherence tomography
analysis of the optic nerve, retinal nerve fiber layer, and
ganglion cell layer. J Neuroophthalmol. 36:417–438. 2016.PubMed/NCBI View Article : Google Scholar
|
|
5
|
Polans J, Keller B, Carrasco-Zevallos OM,
LaRocca F, Cole E, Whitson HE, Lad EM, Farsiu S and Izatt JA:
Wide-field retinal optical coherence tomography with wavefront
sensorless adaptive optics for enhanced imaging of targeted
regions. Biomed Opt Express. 8:16–37. 2016.PubMed/NCBI View Article : Google Scholar
|
|
6
|
Rasmussen ML, Broe R, Frydkjaer-Olsen U,
Olsen BS, Mortensen HB, Peto T and Grauslund J: Comparison between
early treatment diabetic retinopathy study 7-field retinal photos
and non-mydriatic, mydriatic and mydriatic steered widefield
scanning laser ophthalmoscopy for assessment of diabetic
retinopathy. J Diabetes Complications. 29:99–104. 2015.PubMed/NCBI View Article : Google Scholar
|
|
7
|
Gardner TW, Sander B, Larsen ML, Kunselman
A, Tenhave T, Lund-Andersen H, Reimers J, Hubbard L, Blankenship
GW, Quillen DA, et al: An extension of the Early Treatment Diabetic
Retinopathy Study (ETDRS) system for grading of diabetic macular
edema in the Astemizole Retinopathy Trial. Curr Eye Res.
31:535–547. 2006.PubMed/NCBI View Article : Google Scholar
|
|
8
|
Witmer MT and Kiss S: Wide-field imaging
of the retina. Surv Ophthalmol. 58:143–154. 2013.PubMed/NCBI View Article : Google Scholar
|
|
9
|
Shifera AS, Pennesi ME, Yang P and Lin P:
Ultra-wide-field fundus autofluorescence findings in patients with
acute zonal occult outer retinopathy. Retina. 37:1104–1119.
2017.PubMed/NCBI View Article : Google Scholar
|
|
10
|
Ghasemi Falavarjani K, Wang K, Khadamy J
and Sadda SR: Ultra-wide-field imaging in diabetic retinopathy; an
overview. J Curr Ophthalmol. 28:57–60. 2016.PubMed/NCBI View Article : Google Scholar
|
|
11
|
Bernardes R, Serranho P and Lobo C:
Digital ocular fundus imaging: A review. Ophthalmologica.
226:161–181. 2011.PubMed/NCBI View Article : Google Scholar
|
|
12
|
Bae K, Cho K, Kang SW, Kim SJ and Kim JM:
Peripheral reticular pigmentary degeneration and choroidal vascular
insufficiency, studied by ultra wide-field fluorescein angiography.
PLoS One. 12(e0170526)2017.PubMed/NCBI View Article : Google Scholar
|
|
13
|
Zhou J and Wei W: Optos 200Tx scanning
laser ophthalmoscope for wide-field fluorescein angiography and its
clinical application. Int Rev Ophthalmol. 2:103–106. 2015.
|
|
14
|
Witmer MT, Parlitsis G, Patel S and Kiss
S: Comparison of ultra-widefield fluorescein angiography with the
Heidelberg Spectralis(®) noncontact ultra-widefield module versus
the Optos(®) Optomap(®). Clin Ophthalmol. 7:389–394.
2013.PubMed/NCBI View Article : Google Scholar
|
|
15
|
Kernt M and Kampik A: Imaging of the
peripheral retina. Oman J Ophthalmol. 6 (Suppl 1):S32–S35.
2013.PubMed/NCBI View Article : Google Scholar
|
|
16
|
Wang K, Ghasemi Falavarjani K, Nittala MG,
Sagong M, Wykoff CC, van Hemert J, Ip M and Sadda SR:
Ultra-wide-field fluorescein angiography-guided normalization of
ischemic index calculation in eyes with retinal vein occlusion.
Invest Ophthalmol Vis Sci. 59:3278–3285. 2018.PubMed/NCBI View Article : Google Scholar
|
|
17
|
Chhablani J and Jayadev C: Future in
retinal imaging for clinicians. Indian J Ophthalmol. 63:370–372.
2015.PubMed/NCBI View Article : Google Scholar
|
|
18
|
Widmer LK, Biland L, Delley A and da Silva
A: The importance of peripheral-arterial occlusive diseases in
medical practice. Conclusions from the Basel study. Schweiz Med
Wochenschr. 113:1824–1827. 1983.(In German). PubMed/NCBI
|
|
19
|
Tan CS, Chew MC, Lim LW and Sadda SR:
Advances in retinal imaging for diabetic retinopathy and diabetic
macular edema. Indian J Ophthalmol. 64:76–83. 2016.PubMed/NCBI View Article : Google Scholar
|
|
20
|
Gelfand JM, Nolan R, Schwartz DM, Graves J
and Green AJ: Microcystic macular oedema in multiple sclerosis is
associated with disease severity. Brain. 135:1786–1793.
2012.PubMed/NCBI View Article : Google Scholar
|
|
21
|
Espina MP, Arcinue CA, Ma F, Camacho N,
Bartsch DU and Freeman WR: Analysis of a confocal scanning laser
ophthalmoscope noncontact ultra-wide field lens system in retinal
and choroidal disease. Retina. 35:2664–2668. 2015.PubMed/NCBI View Article : Google Scholar
|
|
22
|
Kida T: Mystery of retinal vein occlusion:
Vasoactivity of the vein and possible involvement of endothelin-1.
BioMed Res Int. 2017(4816527)2017.PubMed/NCBI View Article : Google Scholar
|