Introduction
Acute pancreatitis (AP) is the activation of
pancreatic enzymes followed by local inflammation of the pancreas
and systemic inflammatory response syndrome, which is the major
characteristic of the disease. AP may be divided into three
categories: Mild AP (MAP) refers to AP that is not accompanied by
organ failure or local or systemic complications. Moderately severe
AP (MSAP) is accompanied by transient organ failure (> 48 h) or
local or systemic complications. Severe AP (SAP) indicates AP with
persistent organ failure (>48 h) (1,2). The
major difference between MSAP and SAP is the duration of organ
dysfunction. Recurrent AP (RAP) refers to the presence of two or
more confirmed episodes of AP after which pancreatic tissue and
function return to normal. The treatment methods for MAP, SAP and
RAP are different (3). Thus,
suitable indicators to distinguish among MAP, SAP and RAP should be
determined. Determining the severity of AP early is important to
select the appropriate treatment and determine the prognosis.
Although the Acute Physiology and Chronic Health Evaluation II
(APACHE II) and Ranson scoring systems may be used to predict the
severity of AP, they are relatively complex (4). Therefore, simple and quick clinical
signs and serum indicators to accurately predict disease severity
may be beneficial.
Tumour necrosis factor (TNF)-α, interleukin (IL)-1β,
IL-6, IL-8 and IL-10 are important inflammatory cytokines markers
in the inflammatory development of AP. In a previous study, the
changes in monocyte chemoattractant protein (MCP)-1, TNF-α and IL-8
in the serum of the MAP group were different from those of the MSAP
and SAP groups, suggesting that the levels of MCP-1, TNF-α and IL-8
are associated with the severity of AP and may serve as diagnostic
indicators (5). Severe forms of AP
are associated with increased serum levels of IL-6, IL-10 and
IL-1(6). IL-6 is a significant
indicator of AP severity (7). These
studies suggest that inflammatory cytokines have an important role
in the severity of AP.
MicroRNAs (miRNAs/miRs) are endogenous noncoding
regulatory single-stranded small molecule RNAs, the length of which
is approximately 18-25 nucleotides. RNAs and miRNAs have an
important role in the regulation of gene expression and abnormal
expression of miRNAs may increase the incidence of AP (8). The role of miRNAs in AP is an
increasing area of study. Homo sapiens (hsa)-miR-10b and
hsa-miR-146a in the peripheral blood of patients with AP have been
indicated to be a predictor of disease severity (9). It has also been reported that
hsa-miR-126a-5p and hsa-miR-551b-5p are able to predict AP severity
(MAP and SAP) (10). Through
targeting multiple factors of crucial pathways, hsa-miR-548d-5p is
considered to be a possible superior regulator of the development
of pancreatic cancer (11).
Overexpression of miR-130b markedly reduced the invasive ability of
pancreatic cancer cells by targeting STAT3(12). However, the association between
miRNAs and AP has remained largely elusive.
The early prediction of AP severity is important for
treatment. To date, the existing indicators are not widely used in
clinics. Certain studies have reported that levels of cytokines
(e.g., TNF-α, IL-6 and IL-8) and miRNAs (e.g., hsa-miR-551b-5p,
hsa-miR-126-5p and hsa-miR-146a) may be used to distinguish between
different levels of AP severity. Severe forms of AP were associated
with the levels of IL-6, IL-10 and IL-1 receptor antagonist in
serum (5-10).
However, whether miRNA-binding inflammatory factors are able to
predict AP severity has remained to be determined. Therefore, the
aim of the present study was to explore the value of miRNAs
(hsa-miR-548d-5p, hsa-miR-126-5p and hsa-miR-130b-5p) combined with
inflammatory cytokines (TNF-α, IL-1, IL-6, IL-8 and IL-10) in
predicting the severity of AP in order to provide laboratory
indicators for the early prediction of AP severity.
Materials and methods
Human subjects
A total of 90 patients with AP who were admitted to
the Department of Critical Care Medicine of Jinjiang Hospital of
Traditional Chinese Medicine (Jinjiang, China) between May 2017 and
January 2019 were included in this study. AP was defined as
characteristic abdominal pain with a threefold increase in levels
of serum lipase or amylase. The severity of AP was determined on
the basis of the Revised Atlanta Classification of AP (2012)
(1). In the present study, patients
with clinical symptoms of acute abdominal pain and vomiting who had
signs of peritonitis, such as abdominal distension, lumbar rib
tenderness and swelling, suggested abdominal exudation,
inflammation and intraperitoneal hypertension were enrolled. Blood
samples were collected from all patients within 24 h of admission,
and serum amylase and lipase activities were measured. The
reference value of amylase was 25-125 U/l (13) and the reference value of lipase was
23-300 U/l (14). Abdominal CT scan
was used as the standard imaging method and enhanced CT scan was
performed on patients with an indefinite diagnosis (Fig. 1). The severity of AP was determined
according to the Balthazar CT scoring system (15). MAP, SAP and RAP patients of similar
age, sex and etiology were screened. There were 30 cases in each
group. The AP group consisted of 36 females and 54 males aged
between 24 and 72 years with a mean age of 46.91±9.75 years. The
exclusion criteria were an age of <18 years, pregnancy or
breastfeeding, liver or kidney failure, and malignancy, or
presentation at >24 h after the onset of symptoms. Patients who
did not agree to provide written informed consent were also
excluded.
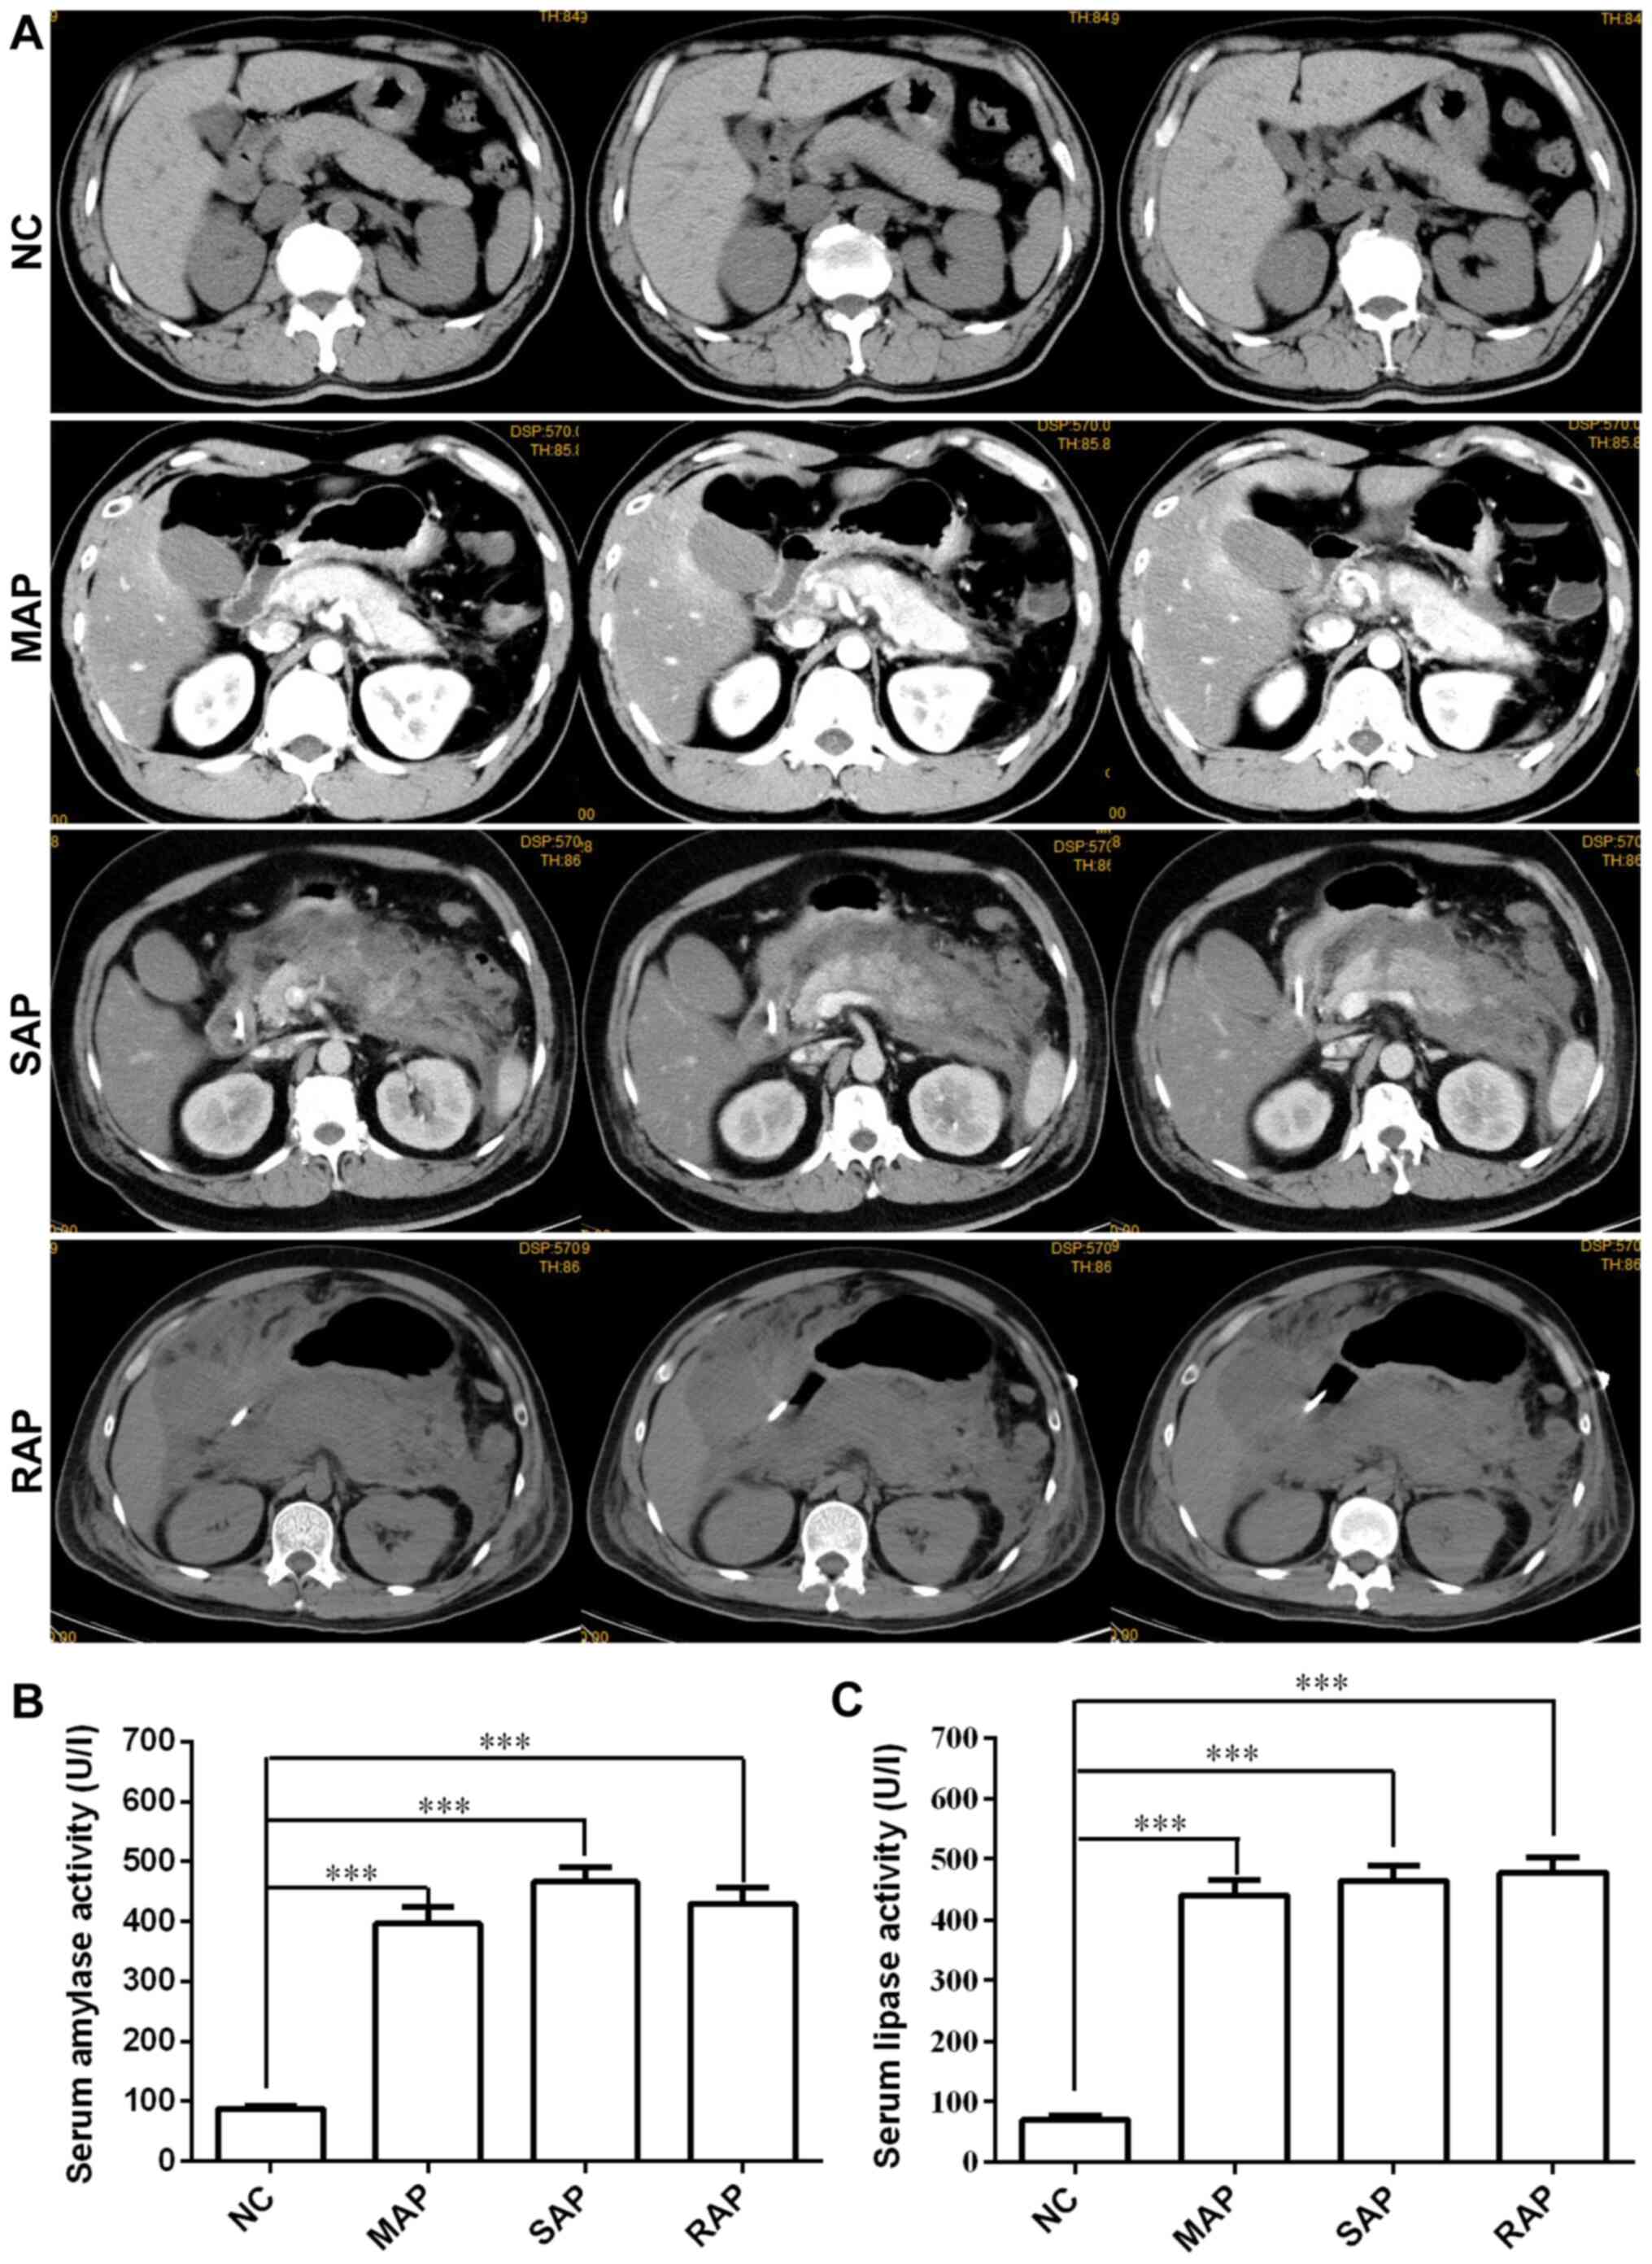 | Figure 1Clinical manifestations of patients
with different severities of AP. (A) CT or enhanced CT images of
the patients with pancreatitis. NC, normal pancreatic structure;
MAP, enhanced scanning shows uneven signal enhancement, pancreatic
oedema and exudation; SAP, a large number of flocs exudate around
the pancreas and accumulate into inflammatory masses or diffuse
extended inflammation; RAP, diffuse enlargement and vague margins
of the pancreas, visible strips and flocculent exudation in the fat
space around the pancreas, and bilateral pleural effusion. (B)
Serum amylase and (C) lipase activity in patients with acute
pancreatitis was significantly increased. Values are expressed as
the mean ± standard error. One-way analysis of variance with
Dunnett's test was used for assessment of intergroup differences.
***P<0.001. Groups: NC, normal control; MAP, mild AP;
SAP, severe AP; RAP, recurrent AP; AP, acute pancreatitis. |
As the normal control (NC) group, 30 healthy
individuals presenting in the same time period, sex and age-matched
to the cases were selected. They consisted of 15 females and 15
males aged from 29 to 71 years with a mean age of 46.56±11.05
years. The healthy controls were recruited at the Physical
Examination Center of Jinjiang Hospital of Traditional Chinese
Medicine (Jinjiang, China). The reasons for NC group patients
receiving CT scans included cholecystitis, gallbladder polyps and
gallstones. The exclusion criteria were as follows: Any systemic
and chronic diseases, such as autoimmune diseases, tumour and
diabetes, or cardiovascular diseases, such as hypertension,
coronary artery disease and hyperlipidemia. The study was approved
by the ethics committee of Jinjiang Hospital of Traditional Chinese
Medicine (Jinjiang, China).
Sample collection
Venous blood (10 ml) was extracted from the patients
prior to treatment. Samples were collected from the patients'
cubital vein using Monovette tubes (Sarstedt). Serum was separated
by centrifugation (1,000 x g, 5 min, room temperature) and stored
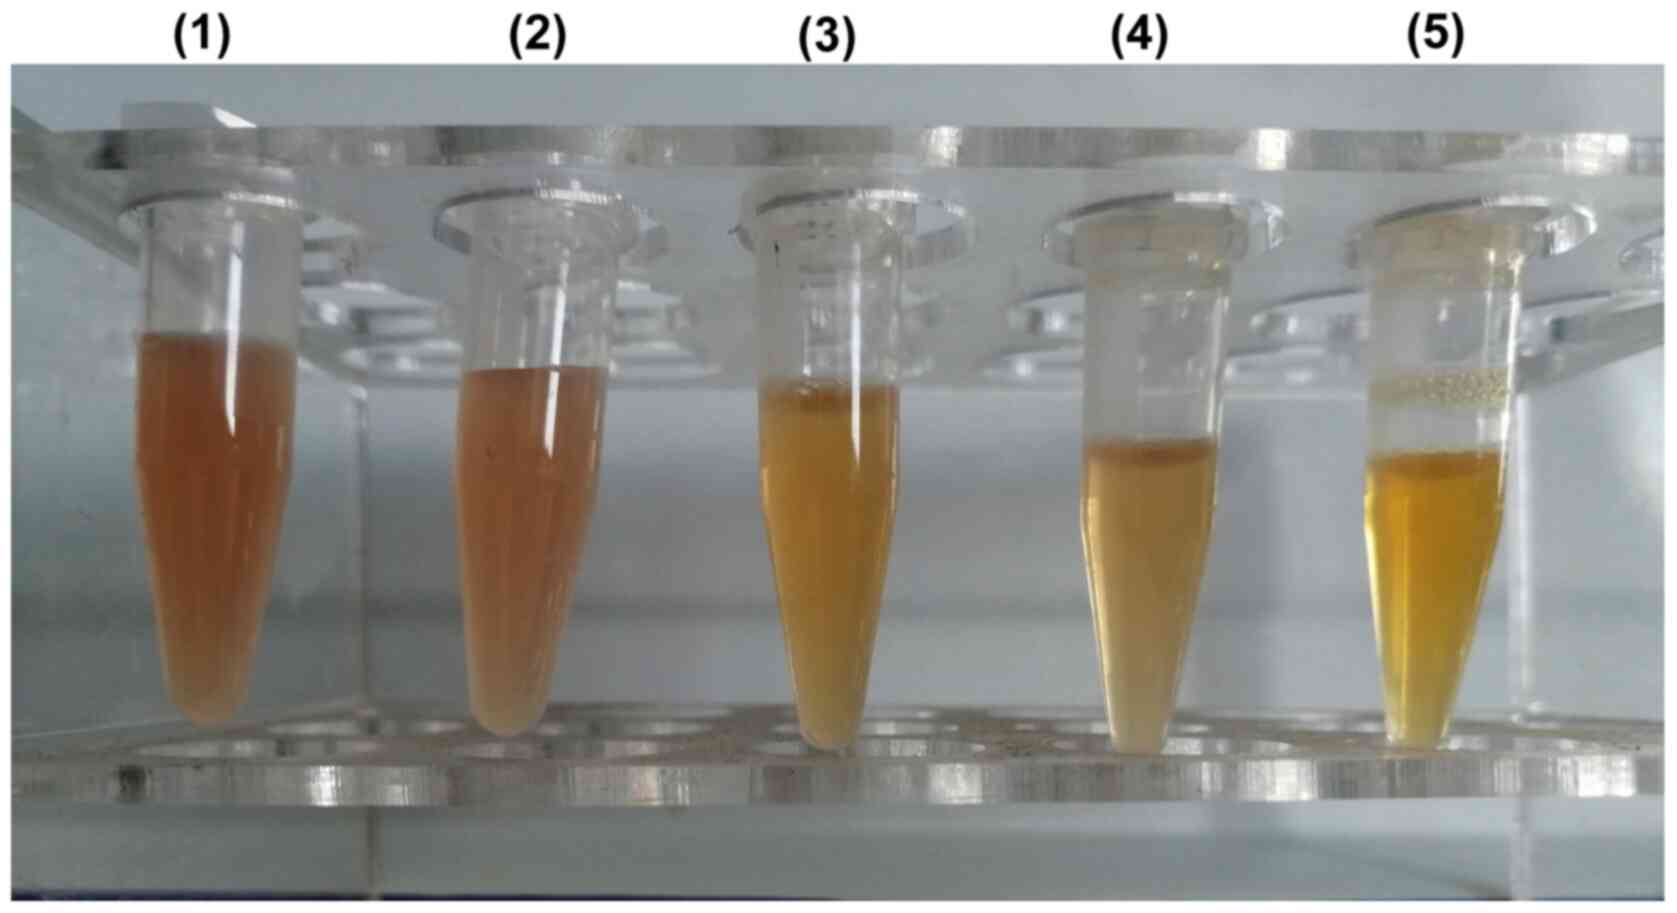
at -80˚C until analysis. As haemolysis may falsely indicate
increases in either inflammatory cytokines or miRNA levels
(16,17), each visually detected haemolysed
serum sample was rejected. In the present study, all blood samples
were processed and screened by the hospital's experienced
laboratory physician. As exemplified in Fig. 2, samples 1 and 2 were judged as
hemolyzed samples and discarded, while samples 3, 4 and 5 were
determined to be non-hemolytic samples and used for subsequent
testing.
Detection of the levels of
inflammatory factors (TNF-α, IL-1, IL-6, IL-8 and IL-10) in serum
by ELISA kits
Arterial blood (5 ml) was extracted from the
patients prior to treatment. The serum was centrifuged at 1,000 x g
for 5 min. The levels of TNF-α, IL-1, IL-6, IL-8 and IL-10 in serum
were measured by ELISA. TNF-α, IL-1, IL-6, IL-8 and IL-10 kits were
all purchased from Shanghai Novus Biotechnology Co., Ltd. The ELISA
kit details were as follows: Human TNF-α ELISA kit (colorimetric),
cat. no. NBP1-91170; human IL-1α/IL-1F1 ELISA kit (colorimetric),
cat. no. NBP1-91187; human IL-6 ELISA kit (colorimetric), cat. no.
NBP1-89869; human CXCL8/IL-8 ELISA kit (colorimetric), cat. no.
NBP1-83743; human IL-10 ELISA Kit (colorimetric), cat. no.
NBP1-89871. All procedures were performed according to the
manufacturer's instructions. The optical density values were read
by a microplate reader (wavelength, 450 nm), and the corresponding
concentrations of TNF-α, IL-1, IL-6, IL-8 and IL-10 were calculated
and recorded.
Quantification of miRNAs by reverse
transcription-quantitative (RT-q)PCR
After thawing, serum samples were centrifuged at
room temperature and 1,000 x g for 5 min to pellet any debris and
insoluble components. Circulating miRNA was extracted using the
miRCURY RNA Isolation kit (Exiqon) according to the manufacturer's
protocol. The purified miRNA was eluted with 20 µl RNase-free
water. The isolated miRNAs were assessed by an Agilent Bioanalyzer
2100 system (Agilent Technologies, Inc.). Total RNA was isolated
from the serum samples and treated with RNase-free water according
to the NucleoZOL® (Gene Co., Ltd.) method. Primers were
resuspended by adding 250 µl RNase-free water. Master mix was
prepared for each miRNA-specific assay. Each single reaction
included 10 µl of qPCR SYBR®-Green Master Mix (Promega
Corporation), 10 µl (10 µM) of primer set for an individual miRNA,
3 µl of RNase-free water and 2 µl (20 ng) of RT product added to a
single real-time PCR tube as a template.
First, 0.5 µg total RNA was reverse transcribed
using the Reverse Transcription System kit (Takara Bio, Inc.). The
synthesized complementary (c)DNA was amplified by qPCR using a Heal
Force system [Heal Force; Likang Biomedical Technology Holdings
Co., Ltd.; Lixin Instrument (Shanghai) Co., Ltd.] The reaction
conditions for the RT step were 30˚C for 10 min, 42˚C for 50 min
and 85˚C for 10 min. The resultant cDNA was used as a template for
subsequent PCR. A total of 40 cycles of PCR amplification were
performed, with initial incubation at 95˚C for 5 min and final
extension at 72˚C for 5 min. Each cycle comprised denaturation at
95˚C for 10 sec, annealing at 60˚C for 30 sec and extension at 72˚C
for 30 sec. The miRNA primers used for RT-PCR amplification are
presented in Table I. The mRNA
expression level was normalized to that of hsa-miR-103a-3p
(10). The relative expression of
candidate genes was calculated using the formula ΔΔCq = (Cq,
target-Cq, miR-103a-3p)AP-(Cq,
target-Cq, miR-103a-3p)NC, and the
estimated expression ratio was equal to 2-ΔΔCq (18).
 | Table IPrimers for RT and qPCR. |
Table I
Primers for RT and qPCR.
| Gene/miRNA | | Primer sequence
(5'-3') |
|---|
|
hsa-miR-130b-5p | F |
CGCGACTCTTTCCCTGTTG |
| | R |
AGTGCAGGGTCCGAGGTATT |
| | RT |
GTCGTATCCAGTGCAGGGTCCGAGGTATTCGCACTGGATACGACGTAGTG |
| hsa-miR-126-5p | F |
GCGCGCATTATTACTTTTGG |
| | R |
AGTGCAGGGTCCGAGGTATT |
| | RT |
GTCGTATCCAGTGCAGGGTCCGAGGTATTCGCACTGGATACGACCGCGTA |
|
hsa-miR-548d-5p | F |
GCGCGAAAAGTAATTGTGGTT |
| | R |
AGTGCAGGGTCCGAGGTATT |
| | RT |
GTCGTATCCAGTGCAGGGTCCGAGGTATTCGCACTGGATACGACGGCAAA |
|
hsa-miR-103a-3p | F |
GCGAGCAGCATTGTACAGGG |
| | R |
AGTGCAGGGTCCGAGGTATT |
| | RT |
GTCGTATCCAGTGCAGGGTCCGAGGTATTCGCACTGGATACGACTCATAG |
Statistical analysis
All data were analysed using SPSS 25.0 software (IBM
Corp.). The Shapiro-Wilk test was used to analyze normality. If the
data showed a normal distribution, one-way analysis of variance
with Dunnett's test was used. If the data did not obey normal
distribution, Mann-Whitney U test was used to compare the
differences between two groups, and the Kruskal-Wallis test with
Dunn's post-hoc test was applied to compare between multiple
groups. Spearman's rank correlation analysis was used to analyse
the correlation between inflammatory factors, miRNAs and AP.
Univariate binary classification logistic regression analysis was
used to determine the association between the clinical condition of
patients with AP and the indicators assessed. Multivariate logistic
regression analysis was used to analyse the influence of the
indexes tested on MAP, SAP and RAP. Receiver operating
characteristic (ROC) analysis was used to determine the clinical
accuracy of significant serum pro-inflammatory factors and miRNAs,
and the area under the ROC curve (AUC) was calculated for each
miRNA of interest using DeLong's method. P<0.05 was considered
to indicate statistical significance.
Results
Characteristics of participants
Clinical data for the AP and NC groups are presented
in Table II. A total of 90
patients with AP and 30 control cases were recruited into the
study. The AP group was 60% male with a median age of 47
(interquartile range, 39-54) years, and 38.89% patients with a
history of smoking. The NC group was 50% male with a median age of
48 (interquartile range, 38-56) years, and 43.33% patients had a
history of smoking. There were no significant differences in sex,
age or smoking status between the AP and NC group (P=0.34, P=0.64
and P=0.67, respectively). Biliary disease was the most common
etiology of pancreatitis, identified in 45 patients (50%), followed
by alcoholism (30%) and hypertriglyceridemia (8.89%). AP patients
had a median Bathazar CT score of 2.5 (interquartile range, 1-3),
and lipase levels of 430.59±15.18 U/l and amylase levels of
460.67±14.41 U/l, which were higher than those in the NC group
(P<0.01, respectively).
| Table IIGeneral characteristics of the
patients. |
Table II
General characteristics of the
patients.
| Factor | AP n=90 case | MAP n=30 case | SAP n=30 case | RAP n=30 case | NC n=30 case | P-value |
|---|
| Sex | | | | | | 0.86a |
|
Female | 36(40) | 13 (43.33) | 11 (36.67) | 12(40) | 15(50) | |
|
Male | 54(60) | 17 (56.67) | 19 (63.33) | 18(60) | 15(50) | |
| Age (years) | 47 (IQR,
39-54) | 46 (IQR,
39-54) | 47 (IQR,
38-56) | 47 (IQR,
40-55) | 48 (IQR,
38-56) | 0.94b |
| Etiology | | | | | | |
|
Biliary
disease | 45(50) | 16 (53.33) | 18(60) | 11 (36.67) | - | 0.33a |
|
Alcoholism | 27(30) | 8 (26.67) | 7 (23.33) | 12(40) | - | 0.53a |
|
Hypertriglyceridemia | 8 (8.89) | 3(10) | 3(10) | 2 (6.67) | - | 0.95a |
|
Other | 10 (11.11) | 3(10) | 2 (6.67) | 5 (16.67) | - | 0.67a |
| Bathazar CT
score | 2.5 (IQR, 1-3) | 1 (IQR, 1-2) | 3 (IQR, 3-4) | 2.5 (IQR,
2-3.25) | 0.5 (IQR, 0-1) |
<0.01b |
| Smoking
history | 35 (38.89) | 7 (23.33) | 13 (43.33) | 15(50) | 13 (43.33) | 0.28a |
| Lipase (U/l) | 430.59±15.18 | 396.46±26.71 | 465.72±25.40 | 429.59±26.08 | 87.67±4.48 |
<0.01c |
| Amylase (U/l) | 460.67±14.41 | 440.09±25.36 | 463.96±25.80 | 477.96±24.05 | 70.27±6.56 |
<0.01c |
Of the 90 AP patients, 30 cases were RAP patients.
Based on the Revised Atlanta Classification of AP (1), the remaining patients were classified
into the MAP and SAP group, 30 cases per group. The MAP group was
56.67% male, the median age was 46 (interquartile range, 39-54)
years and 23.33% patients had a history of smoking. The SAP group
was 63.33% male with a median age of 47 (interquartile range,
38-56) years and 43.33% of patients had a history of smoking. The
RAP group was 60% male, the median age was 47 (interquartile range,
40-55) years, and 50% of patients had a history of smoking. The
sex, age and smoking status between the AP, MAP, SAP, RAP and NC
groups were not significantly different (P=0.86, P=0.94, P=0.28,
respectively). Biliary disease was the most common etiology of MAP
(53.33%) and SAP (60%), followed by alcoholism (MAP, 26.67%; SAP,
23.33%) and hypertriglyceridemia (10% of each). In RAP patients,
alcoholism (40%) was the most common etiology, followed by biliary
disease (36.67%) and hypertriglyceridemia (6.67%). There were no
significant differences in etiologies between the MAP, SAP and RAP
groups (P>0.05). The Bathazar CT score, lipase and amylase level
in the AP, MAP, SAP and RAP groups were significantly increased
compared to those in the NC group (P<0.01).
Levels of pro-inflammatory factors and
miRNAs in the AP groups compared with the NC group
Comparison of the results with the nonparametric
Mann-Whitney U test indicated that pro-inflammatory factors and
miRNAs were significantly increased in the AP vs. the NC group
(P<0.001; Table SI).
Pro-inflammatory factors and miRNAs in
patients with different classifications of AP
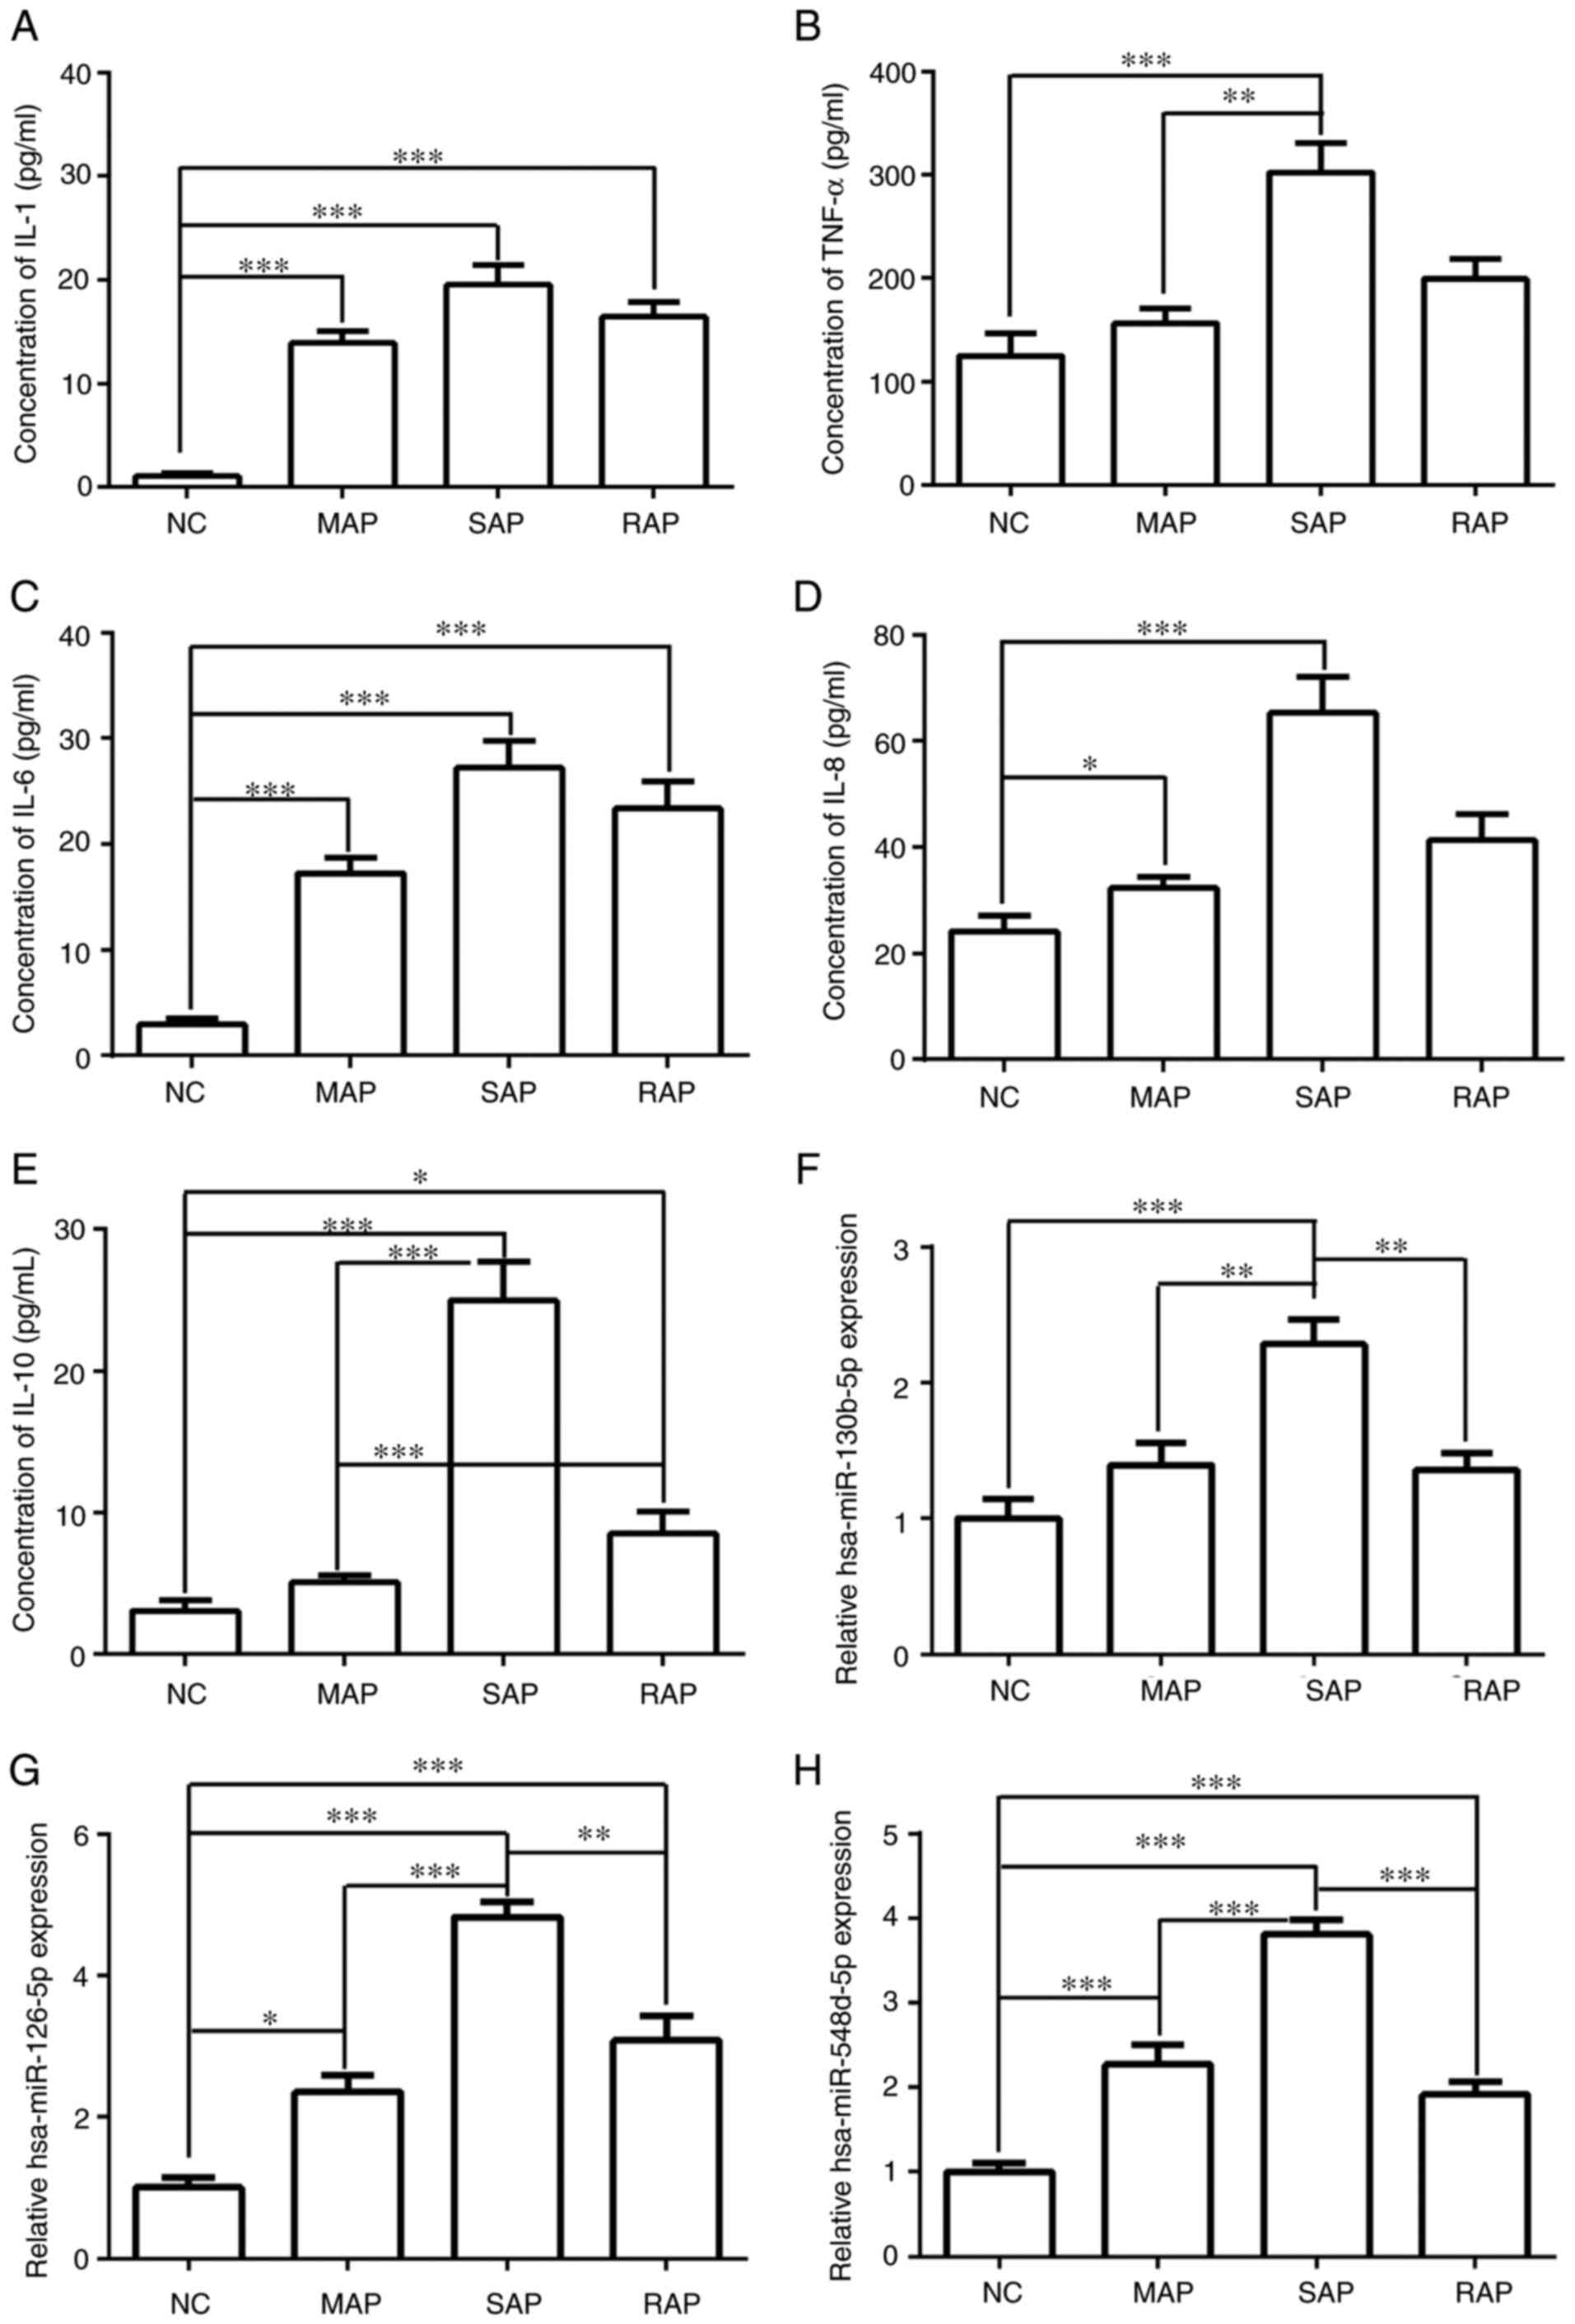
The levels of pro-inflammatory factors among the NC,
MAP, SAP and RAP groups were compared (Fig. 3A-E). The results showed that IL-1
and IL-6 expression in the MAP, SAP and RAP groups was
significantly higher than that in NC group (P<0.001). Compared
with NC group, the expression of IL-8, IL-10 and TNF-α in the SAP
group was significantly increased (P<0.001), and IL-10 was also
significantly increased in the RAP group when compared with the NC
group (P<0.05). The levels of IL-8, IL-10 and TNF-α in the MAP
group were significantly lower than those in the SAP group
(P<0.05). The levels of IL-10 in the RAP group were
significantly lower than those in the SAP group (P<0.001), but
observably increased in comparison with the MAP group (P<0.001).
These results suggested that high expression levels of IL-8, IL-10
and TNF-α may be able to distinguish SAP from MAP, but that only
IL-10 could differentiate between MAP and RAP.
In Fig. 3D-H, miRNA
expression levels were compared among NC, MAP, SAP and RAP groups.
The levels of hsa-miR-126-5p and hsa-miR-548d-5p in the MAP, SAP
and RAP groups were significantly higher than those in the NC group
(P<0.05). The expression of hsa-miR-130b-5p was markedly
increased in the SAP group in comparison with the NC group
(P<0.001). In addition, the expression levels of
hsa-miR-130b-5p, hsa-miR-126-5p and hsa-miR-548d-5p were higher in
the SAP group than the MAP and RAP groups. However, no significant
difference in the levels of these miRNAs was obtained between the
MAP and RAP group. These results suggested that high expression
levels of miRNAs were able to distinguish SAP from MAP and RAP
group but were not able to differentiate between MAP and RAP.
Analysis of candidate miRNAs and
pro-inflammatory factors to determine AP classification using
single- and multifactor binary logistic regression
Univariate logistic regression analysis was
performed with AP as the dependent variable and serum levels of the
inflammatory factors and miRNAs as independent variables (Table SII). The results of the
single-factor binary logistic regression analysis were consistent
with those of the nonparametric Mann-Whitney U test. The serum
levels of the following inflammatory factors and miRNAs were risk
factors for AP: IL-1 [odds ratio (OR)=2.311, 95% CI: 1.430-3.734,
P=0.001], IL-6 (OR=2.311, 95% CI: 1.430-3.734, P=0.001), IL-8
(OR=1.043, 95% CI: 1.018-1.070, P=0.001), IL-10 (OR=1.232, 95% CI:
1.088-1.395, P=0.001), TNF-α (OR=1.007, 95% CI: 1.003-1.011,
P=0.001), hsa-miR-126-5p (OR=3.575, 95% CI: 2.072-6.170,
P<0.001), hsa-miR-130b-5p (OR=2.716, 95% CI: 1.486-4.963,
P=0.001) and hsa-miR-548d-5p (OR=5.848, 95% CI: 2.751-12.430,
P<0.001).
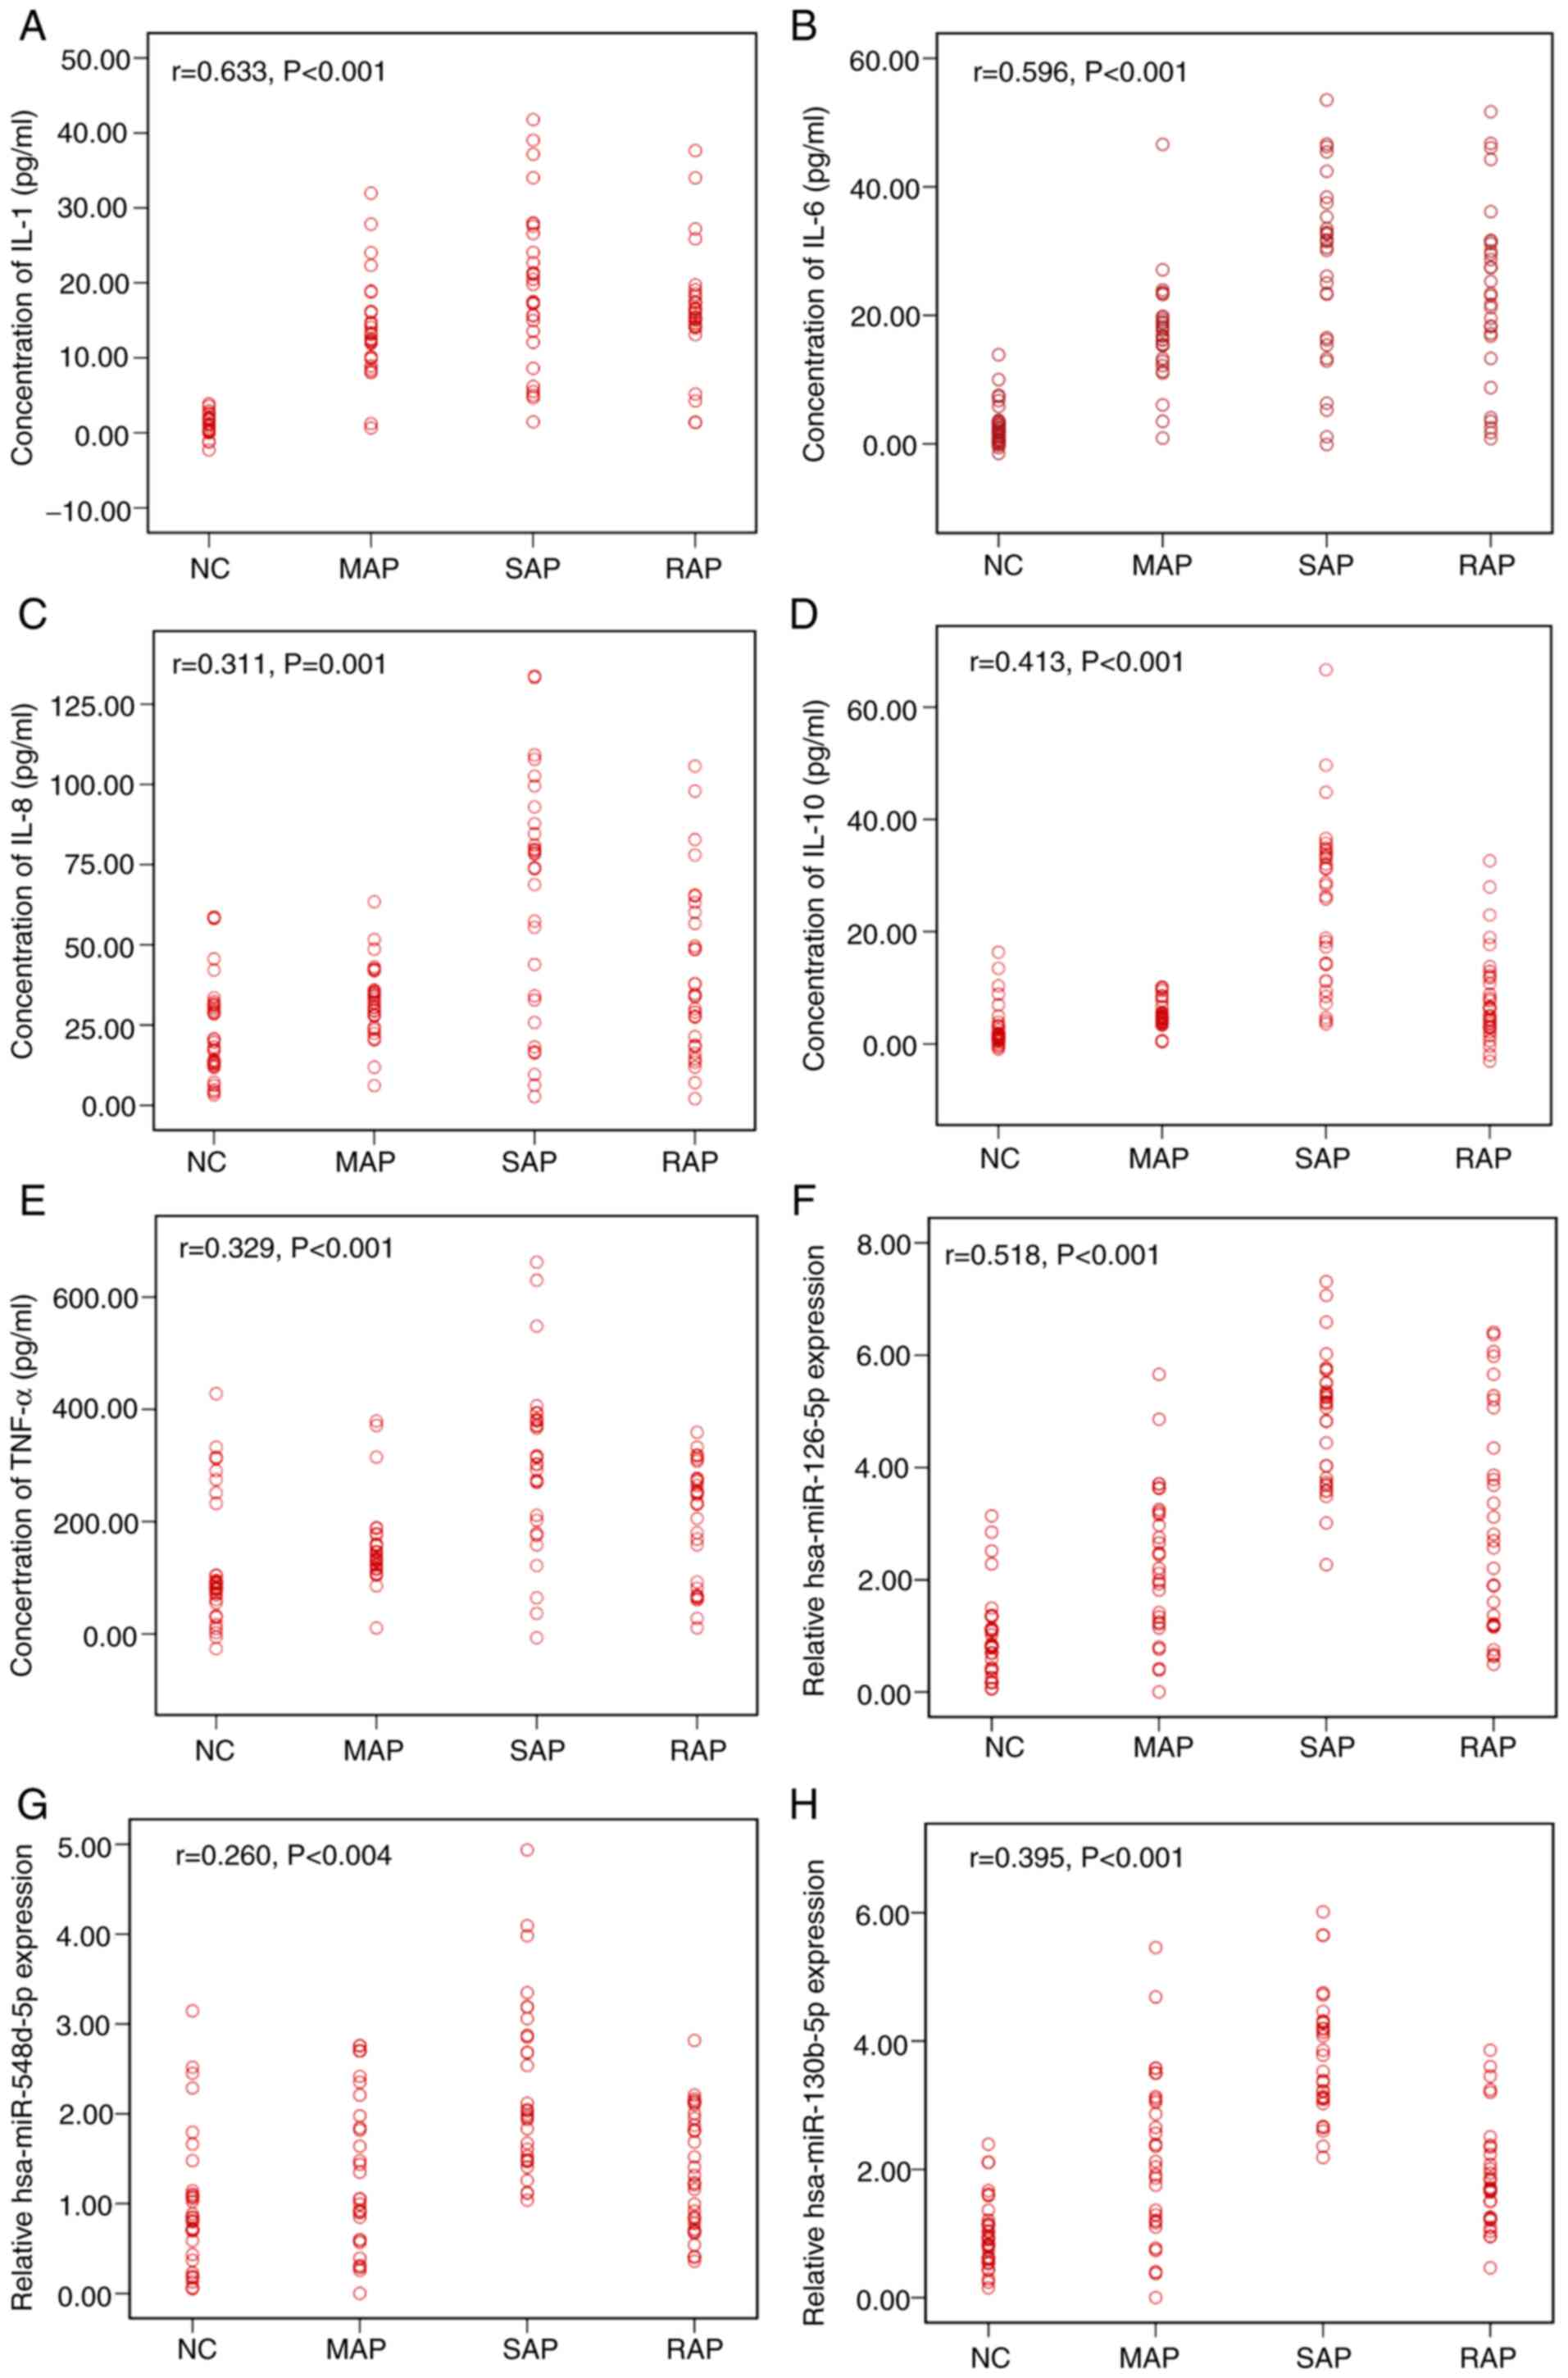
The correlation between AP severity and inflammatory
factors and miRNA in serum was determined by Spearman correlation
analysis, as presented in Fig. 4.
The levels of IL-1, IL-6, IL-10, hsa-miR-126-5p and hsa-miR-130b-5p
all had strong positive correlations with AP severity (complete
correlation: r=1; strong correlation: 0.7≤r<1; moderate
correlation: 0.4≤r<0.7; weak correlation: r<0.4; no
correlation: r=0.) (19). The
levels of IL-8, TNF-α and hsa-miR-548d-5p had moderate positive
correlations with AP severity. However, the expression of IL-1,
IL-6, hsa-miR-126-5p, and hsa-miR-548d-5p exhibited no
statistically significant association with AP when multifactor
logistic regression analysis was performed (Table SIII). This result may be due to the
existence of confounding factors. However, further multifactorial
binary logistic regression analysis (combining these 4 factors
freely) indicated that single inflammatory factor (IL-1 or IL-6)
and miRNA (hsa-miR-126-5p or hsa-miR-548d-5p) may be used to
predict the classification of AP (P<0.05). According to the
results of this analysis, an equation may in future be established
to predict the probability of AP. The results of the ROC curve
analysis were consistent with the results of the multifactorial
binary logistic regression analysis (Table III). The combined detection of
IL-1 + hsa-miR-126-5p (AUC, 0.991; sensitivity, 95.6%; specificity,
100%; cutoff value, 0.641; P<0.001), IL-6 + hsa-miR-126-5p (AUC,
0.991; sensitivity, 93.3%; specificity, 96.7%; cutoff value, 0.802;
P<0.001), IL-1 + hsa-miR-548d-5p (AUC, 0.990; sensitivity,
95.6%; specificity, 100%; cutoff value, 0.830; P<0.001), and
IL-6 + hsa-miR-548d-5p (AUC, 0.980; sensitivity, 92.2%;
specificity, 96.7%; cutoff value, 0.795; P<0.001) could
distinguish AP from NC. The results of the ROC analysis for serum
amylase (AUC, 0.999; sensitivity, 97.8%; specificity, 100%; cutoff
value, 136.95; P<0.001) and lipase (AUC, 1.000; sensitivity,
98.9%; and specificity, 100%; cutoff value, 172.75; P<0.001)
showed that they could also differentiate AP from NC. The results
indicated that the diagnostic accuracy of IL-1/IL-6 combined with
hsa-miR-126-5p/hsa-miR-548d-5p was high but not quite as good as
that for amylase and lipase.
| Table IIIResults of the ROC analysis for AP
classification. |
Table III
Results of the ROC analysis for AP
classification.
| A, AP vs. NC |
|---|
| Factors | AUC | SE | 95% CI | Sensitivity
(%) | Specificity
(%) | Cutoff value | P-value |
|---|
|
IL-1+hsa-miR-126-5p | 0.991 | 0.005 | 0.981-1.000 | 95.6 | 100 | 0.641 | <0.001 |
|
IL-6+hsa-miR-126-5p | 0.991 | 0.006 | 0.979-1.000 | 93.3 | 96.7 | 0.802 | <0.001 |
|
IL-1+hsa-miR-548d-5p | 0.990 | 0.007 | 0.977-1.000 | 95.6 | 100 | 0.830 | <0.001 |
|
IL-6+hsa-miR-548d-5p | 0.980 | 0.010 | 0.960-1.000 | 92.2 | 96.7 | 0.795 | <0.001 |
| Lipase | 1.000 | 0.001 | 0.998-1.000 | 98.9 | 100 | 172.750 | <0.001 |
| Amylase | 0.999 | 0.002 | 0.995-1.000 | 97.8 | 100 | 136.950 | <0.001 |
| B, MAP vs. SAP |
| Factors | AUC | SE | 95% CI | Sensitivity
(%) | Specificity
(%) | Cutoff value | P-value |
|
IL-1+hsa-miR-126-5p | 0.926 | 0.036 | 0.856-0.995 | 90.0 | 86.7 | 0.605 | <0.001 |
|
IL-6+hsa-miR-126-5p | 0.952 | 0.026 | 0.902-1.000 | 93.3 | 90.0 | 0.443 | <0.001 |
|
IL-1+hsa-miR-548d-5p | 0.829 | 0.053 | 0.724-0.933 | 93.3 | 60.0 | 0.357 | <0.001 |
|
IL-6+hsa-miR-548d-5p | 0.876 | 0.044 | 0.790-0.962 | 73.3 | 90.0 | 0.580 | <0.001 |
| Lipase | 0.554 | 0.075 | 0.407-0.702 | 90.0 | 30.0 | 343.000 | 0.469 |
| Amylase | 0.627 | 0.072 | 0.485-0.769 | 93.3 | 33.3 | 328.450 | 0.090 |
| C, SAP vs. RAP |
| Factors | AUC | SE | 95% CI | Sensitivity
(%) | Specificity
(%) | Cutoff value | P-value |
|
IL-1+hsa-miR-126-5p | 0.754 | 0.066 | 0.626-0.883 | 60.0 | 93.3 | 0.593 | 0.001 |
|
IL-6+hsa-miR-126-5p | 0.754 | 0.066 | 0.626-0.883 | 60.0 | 93.3 | 0.593 | 0.001 |
|
IL-1+hsa-miR-548d-5p | 0.924 | 0.033 | 0.859-0.989 | 83.3 | 93.3 | 0.632 | <0.001 |
|
IL-6+hsa-miR-548d-5p | 0.924 | 0.033 | 0.859-0.989 | 83.3 | 93.3 | 0.632 | <0.001 |
| Lipase | 0.542 | 0.075 | 0.395-0.690 | 53.3 | 63.3 | 489.650 | 0.574 |
| Amylase | 0.409 | 0.074 | 0.264-0.554 | 100.0 | 3.3 | 132.300 | 0.225 |
| D, MAP vs. RAP |
| Factors | AUC | SE | 95% CI | Sensitivity
(%) | Specificity
(%) | Cutoff value | P-value |
|
IL-1+hsa-miR-126-5p | 0.926 | 0.036 | 0.856-0.995 | 90.0 | 86.7 | 0.544 | <0.001 |
|
IL-6+hsa-miR-126-5p | 0.952 | 0.026 | 0.902-1.000 | 93.3 | 90.0 | 0.443 | <0.001 |
|
IL-1+hsa-miR-548d-5p | 0.829 | 0.053 | 0.724-0.933 | 93.3 | 60.0 | 0.358 | <0.001 |
|
IL-6+hsa-miR-548d-5p | 0.876 | 0.044 | 0.790-0.962 | 73.3 | 90.0 | 0.580 | <0.001 |
| Lipase | 0.580 | 0.074 | 0.434-0.726 | 66.7 | 50.0 | 441.450 | 0.287 |
| Amylase | 0.559 | 0.075 | 0.412-0.706 | 33.3 | 86.7 | 526.600 | 0.433 |
Analysis of candidate miRNAs and
pro-inflammatory factors by multiclassification disordered logistic
regression analysis for AP classification
On the basis of the results of the single- and
multifactor binary logistic regression analysis of AP vs. NC and
the result of the Spearman correlation analysis (Table SIV), multiclassification disordered
logistic regression analysis was performed with AP severity as the
dependent variable and the serum levels of the inflammatory factors
(IL-1/IL-6) and miRNAs (hsa-miR-126-5p/hsa-miR-548d-5p) as
independent variables (Table
SV).
Multiclassification disordered logistic regression
analysis for AP severity and RAP indicated that the combination of
IL-1/IL-6 and hsa-miR-126-5p/hsa-miR-548d-5p had a significant
diagnostic value regarding AP types, suggesting that among these
factors, IL-1/IL-6 and hsa-miR-126-5p/hsa-miR-548d-5p may be major
factors in determining of AP classification (P<0.05). According
to the results of the present analysis, with a greater amount of
available data in future an equation may be established to
determine the degree of AP severity. Based on the above results, to
further evaluate the predictive effect of miRNAs combined with
pro-inflammatory cytokines on the severity of AP, ROC curves were
drawn and their parameters are presented in Table III. When IL-6 was combined with
hsa-miR-126-5p, the AUC (0.952), sensitivity (93.3%) and
specificity (90.0%) were all the highest for distinguishing MAP
from SAP, and the values were also highest for distinguishing MAP
from RAP. The predictive effect of IL-1/IL-6 combined with
hsa-miR-126-5p ranked second in the differentiation between SAP and
RAP, and the predictive effect of IL-1 or IL-6 combined with
hsa-miR-548d-5p was the best (AUC, 0.924, sensitivity, 83.3%;
specificity, 93.3%; P<0.001). Although serum amylase and lipase
levels showed superiority in their utility in distinguishing AP
from NC, they had a low accuracy in enabling discernment of the
distinction between MAP, SAP and RAP.. The results of the present
study suggested that the combined detection of IL-6 and
hsa-miR-126-5p may be able to better distinguish MAP from SAP and
RAP than assessment of amylase or lipase.
Discussion
AP is closely linked to pro-inflammatory cytokines,
inflammatory mediators and pancreatic enzymes, which are also
associated with other diseases, including systemic inflammatory
response syndrome and supplementary anti-inflammatory response
syndrome (20). Thus, predicting AP
severity at the early stage is important to grasp the clinical
condition, take appropriate treatment measures and determine the
prognosis (21). Inflammatory
factors and miRNAs have predictive value for the severity of
pancreatitis. The combined detection of these factors may improve
the efficiency of predicting the severity of AP. In the present
study, high expression levels of IL-10, TNF-α, hsa-miR-126-5p,
hsa-miR-548d-5p and hsa-miR-130b-5p were indicated to be associated
with SAP. The combined detection of IL-1/IL-6 and hsa-miR-126-5p/
hsa-miR-548d-5p was able to effectively differentiate between MAP,
SAP and RAP. In particular, the combination of IL-6 and
hsa-miR-126-5p had the highest sensitivity and specificity, which
may be used to determine the severity of AP.
Inflammatory mediators of the innate immune response
are important in the pathogenesis of AP. IL-4, IL-6, IL-8 and
IL-10, which have numerous functions in immune responses and
apoptosis in patients with AP, may trigger the defensive response
and restrain immune function (22).
The severity of AP is associated with increased levels of various
pro-inflammatory cytokines, such as IL-6, IL-1β and TNF-α, after
pancreatic acinar cell injury (23), and the expression of these factors
increased with the severity of AP (24). TNF-α is a key initiator of
pancreatic inflammation (25), and
it stimulates acinar cells to increase the release of IL-6
(26,27). The present study demonstrated that
the concentrations of serum TNF-α and IL-8 in the MAP group were
all lower than those in the SAP group, which was consistent with
the results of Yang et al (5) and suggests that TNF-α and IL-8 are
strongly associated with the severity of AP. IL-6, which has an
important role in the pathogenesis of the disease, may be used as
an early predictive marker for AP severity, and its expression
level is positively correlated with AP severity (28,29).
Although the serum level of IL-6 was higher in the SAP group than
in the MAP and RAP groups, there was no significant difference
among these three groups in the present study. The inconsistencies
among earlier studies may be due to differences in the populations
evaluated, sample sizes and the selection of patients/controls. The
rs1800896 and 1082A/G polymorphisms of the IL-10 gene have been
identified to contribute to the process of AP development (30,31).
In the present study, the level of IL-10 was higher in the SAP
group than in the MAP and RAP groups, which also indicated that
IL-10 is associated with AP severity. Pro-inflammatory cytokines
may result in the incidence of compensatory anti-inflammatory
response syndrome in the early stage of AP, and they are able to
interact with one another to magnify the inflammatory response to
expedite the progression of renal failure (32). The expression of the
pro-inflammatory cytokines TNF-α, IL-1β and IL-6 was inhibited to
suppress the inflammatory response (33,34).
The expression levels of inflammatory factors contribute to the
severity of AP.
The stable expression of miRNAs in peripheral blood
makes their detection convenient and has important prospects in the
early diagnosis and treatment of AP (35). In the pathogenesis of AP, a series
of changes occur in the expression profile of pancreatic tissue
proteins. During this process, miRNAs have an important role in
gene expression regulation. With increasing research efforts, more
ideal markers of AP may be identified among serum miRNAs, which
will help to improve the diagnosis of AP, the therapeutic effect
and the prognosis of pancreatitis. A previous integrated
transcriptome analysis determined that hsa-miR-130b was highly
relevant to pancreatic cancer (36), and microarray data on chronic
pancreatitis (37) and pancreatic
cancer tissues (52 pairs) indicated that its expression is
significantly reduced (12). In the
present study, the serum levels of hsa-miR-130b-5p were higher in
the SAP group than in the other groups. These differences may be
due to differences in the selection and the size of the sample.
According to a previous ROC analysis, serum hsa-miR-216a-5p may be
used to distinguish MAP from SAP (10). The present study suggested that the
level of hsa-miR-216a-5p was higher in the SAP group than in the
other groups, but there was no significant difference between the
MAP and RAP groups. Other factors may be studied to predict the
severity of AP. Hsa-miR-548d overexpression in the PANC-1 human
pancreatic carcinoma cell line resulted in impaired cell
proliferation (11), suggesting
that hsa-miR-548d may be considered a marker for AP. The trend of
hsa-miR-548d-5p in RAP and other groups was similar to that of
hsa-miR-216a-5p.
Although the present study provided useful results,
certain limitations should be considered. First, the sample size of
the present study was small, and further studies with large sample
sizes are required to validate the present conclusions.
Furthermore, no bioinformatics or molecular biology studies were
performed to investigate the association between inflammatory
cytokines and miRNAs. In addition, cytokines and miRNAs were
studied only once during the onset of disease, while dynamic
monitoring may be better to assess their predictive value for AP
severity. Lastly, the study did not provide clear values for the
combined detection of IL-1/IL-6 and hsa-miR-126-5p/hsa-miR-548d-5p
to distinguish AP from NC. These will be examined in future
studies.
In conclusion, the present results suggest that the
detection of miRNAs combined with inflammatory cytokines may be
useful in predicting AP severity. In addition, the present study
indicated that, compared with the other combinations assessed, IL-6
combined with hsa-miR-126-5p had the highest sensitivity and
specificity for the stratification of AP.
Supplementary Material
Levels of proinflammatory factors and
relative expression levels of miRNAs for AP vs. NC.
Single-factor binary logistic
regression analysis for AP vs. NC.
Multi-factor binary logistic
regression analysis for acute pancreatitis vs. normal control.
Multi-classification disordered
logistic regression analysis on AP severity.
Spearman correlation analysis between
factors and AP.
Acknowledgements
Not applicable.
Funding
The present study was supported by Fujian
Traditional Chinese Medicine Science and Technology Project in
2016-2019 [document no. Fujian-Wei TCM Letter (2017) 237, grant no.
2017FJZYLC105] and the Research Subsidy Project of Jinjiang
Hospital of Traditional Chinese Medicine Affiliated to Fujian
University of Traditional Chinese Medicine in 2017 (grant no.
YN201703).
Availability of data and materials
The datasets used and/or analyzed during the current
study are available from the corresponding author on reasonable
request.
Authors' contributions
YJC and TLL made substantial contributions to the
conception and design of the study. YJC, TLL, ZC, CHY, SRG and YDZ
made substantial contributions to the acquisition, analysis and
interpretation of data. YJC participated in drafting the
manuscript, and TLL and ZC revised it critically for important
intellectual content. All authors read and approved the final
version to be published and agreed to be accountable for all
aspects of the work in ensuring that questions related to the
accuracy or integrity of any part of the work are appropriately
investigated and resolved.
Ethics approval and consent to
participate
The study was approved by the Ethics Committee of
Jinjiang Hospital of Traditional Chinese Medicine (Jinjiang,
China). Written informed consent was obtained from all the
subjects.
Patient consent for publication
Not applicable.
Competing interests
The authors declare that they have no competing
interests.
References
|
1
|
Banks PA, Bollen TL, Dervenis C, Gooszen
HG, Johnson CD, Sarr MG, Tsiotos GG and Vege SS: Acute Pancreatitis
Classification Working Group. Classification of acute pancreatitis
- 2012: Revision of the Atlanta classification and definitions by
international consensus. Gut. 62:102–111. 2013.PubMed/NCBI View Article : Google Scholar
|
|
2
|
Tenner S, Baillie J, DeWitt J and Vege SS:
ACoG. American College of Gastroenterology guideline: Management of
acute pancreatitis. Am J Gastroenterol. 109:1400–1415.
2014.PubMed/NCBI View Article : Google Scholar
|
|
3
|
Koutroumpakis E, Slivka A, Furlan A,
Dasyam AK, Dudekula A, Greer JB, Whitcomb DC, Yadav D and
Papachristou GI: Management and outcomes of acute pancreatitis
patients over the last decade: A US tertiary-center experience.
Pancreatology. 17:32–40. 2017.PubMed/NCBI View Article : Google Scholar
|
|
4
|
Żorniak M, Beyer G and Mayerle J: Risk
stratification and early conservative treatment of acute
pancreatitis. Visc Med. 35:82–89. 2019.PubMed/NCBI View Article : Google Scholar
|
|
5
|
Yang YZ, Xiang Y, Chen M, Xian LN and Deng
XY: Clinical significance of dynamic detection for serum levels of
MCP-1, TNF-α and IL-8 in patients with acute pancreatitis. Asian
Pac J Trop Med. 9:1111–1114. 2016.PubMed/NCBI View Article : Google Scholar
|
|
6
|
Vasseur P, Devaure I, Sellier J, Delwail
A, Chagneau-Derrode C, Charier F, Tougeron D, Tasu JP, Rabeony H,
Lecron JC, et al: High plasma levels of the pro-inflammatory
cytokine IL-22 and the anti-inflammatory cytokines IL-10 and IL-1ra
in acute pancreatitis. Pancreatology. 14:465–469. 2014.PubMed/NCBI View Article : Google Scholar
|
|
7
|
Ćeranić DB, Zorman M and Skok P:
Interleukins and inflammatory markers are useful in predicting the
severity of acute pancreatitis. Bosn J Basic Med Sci. 20:99–105.
2020.PubMed/NCBI View Article : Google Scholar
|
|
8
|
Qin X, Yan L, Zhao X, Li C and Fu Y:
microRNA-21 overexpression contributes to cell proliferation by
targeting PTEN in endometrioid endometrial cancer. Oncol Lett.
4:1290–1296. 2012.PubMed/NCBI View Article : Google Scholar
|
|
9
|
Cherie B, Askelund KJ, Shanbhag ST,
Mandira C, Petrov MS, Brett D, et al: MicroRNAs in mesenteric lymph
and serum during acute pancreatitis. Pancreatology. 14:S57.
2014.PubMed/NCBI View Article : Google Scholar
|
|
10
|
Kuśnierz-Cabala B, Nowak E, Sporek M,
Kowalik A, Kuźniewski M, Enguita FJ and Stępień E: Serum levels of
unique miR-551-5p and endothelial-specific miR-126a-5p allow
discrimination of patients in the early phase of acute
pancreatitis. Pancreatology. 15:344–351. 2015.PubMed/NCBI View Article : Google Scholar
|
|
11
|
Heyn H, Schreek S, Buurman R, Focken T,
Schlegelberger B and Beger C: MicroRNA miR-548d is a superior
regulator in pancreatic cancer. Pancreas. 41:218–221.
2012.PubMed/NCBI View Article : Google Scholar
|
|
12
|
Zhao G, Zhang JG, Shi Y, Qin Q, Liu Y,
Wang B, Tian K, Deng SC, Li X, Zhu S, et al: MiR-130b is a
prognostic marker and inhibits cell proliferation and invasion in
pancreatic cancer through targeting STAT3. PLoS One.
8(e73803)2013.PubMed/NCBI View Article : Google Scholar
|
|
13
|
Goyal A, Jain M, Rehberg K, Goodman W and
Gertner E: Pancreatic panniculitis in active systemic lupus
erythematosus. J Cutan Pathol. 46:688–690. 2019.PubMed/NCBI View Article : Google Scholar
|
|
14
|
Xu YW, Li R and Xu SC: Hypothyroidism with
elevated pancreatic amylase and lipase without clinical symptoms: A
case report. World J Clin Cases. 8:3299–3304. 2020.PubMed/NCBI View Article : Google Scholar
|
|
15
|
Balthazar EJ, Robinson DL, Megibow AJ and
Ranson JH: Acute pancreatitis: Value of CT in establishing
prognosis. Radiology. 174:331–336. 1990.PubMed/NCBI View Article : Google Scholar
|
|
16
|
Cholette JM, Pietropaoli AP, Henrichs KF,
Alfieris GM, Powers KS, Gensini F, Rubenstein JS, Sweeney D, Phipps
R, Spinelli SL, et al: Elevated free hemoglobin and decreased
haptoglobin levels are associated with adverse clinical outcomes,
unfavorable physiologic measures, and altered inflammatory markers
in pediatric cardiac surgery patients. Transfusion. 58:1631–1639.
2018.PubMed/NCBI View Article : Google Scholar
|
|
17
|
Blondal T, Jensby Nielsen S, Baker A,
Andreasen D, Mouritzen P, Wrang Teilum M and Dahlsveen IK:
Assessing sample and miRNA profile quality in serum and plasma or
other biofluids. Methods. 59:S1–S6. 2013.PubMed/NCBI View Article : Google Scholar
|
|
18
|
Maruyama T, Nishihara K, Umikawa M,
Arasaki A, Nakasone T, Nimura F, Matayoshi A, Takei K, Nakachi S,
Kariya KI, et al: MicroRNA-196a-5p is a potential prognostic marker
of delayed lymph node metastasis in early-stage tongue squamous
cell carcinoma. Oncol Lett. 15:2349–2363. 2018.PubMed/NCBI View Article : Google Scholar
|
|
19
|
Hashmi A, Cahill GL, Zaldana M, Davis G,
Cronin BJ, Brandel MG, et al: Can head circumference be used as a
proxy for intracranial volume in patients with craniosynostosis?
Ann Plast Surg. 82 (Suppl 4):S295–S300. 2019.PubMed/NCBI View Article : Google Scholar
|
|
20
|
Yang CJ, Chen J, Phillips ARJ, Windsor JA
and Petrov MS: Predictors of severe and critical acute
pancreatitis: A systematic review. Dig Liver Dis. 46:446–451.
2014.PubMed/NCBI View Article : Google Scholar
|
|
21
|
Dumnicka P, Kuśnierz-Cabala B, Sporek M,
Mazur-Laskowska M, Gil K, Kuźniewski M, Ceranowicz P, Warzecha Z,
Dembiński A, Bonior J, et al: Serum concentrations of
angiopoietin-2 and soluble fms-like tyrosine kinase 1 (sFlt-1) are
associated with coagulopathy among patients with acute
pancreatitis. Int J Mol Sci. 18(e753)2017.PubMed/NCBI View Article : Google Scholar
|
|
22
|
Reihmane D and Dela F: Interleukin-6:
Possible biological roles during exercise. Eur J Sport Sci.
14:242–250. 2014.PubMed/NCBI View Article : Google Scholar
|
|
23
|
Qiu L, Sun RQ, Jia RR, Ma XY, Cheng L,
Tang MC and Zhao Y: Comparison of existing clinical scoring systems
in predicting severity and prognoses of hyperlipidemic acute
pancreatitis in Chinese patients: A retrospective study. Medicine
(Baltimore). 94(e957)2015.PubMed/NCBI View Article : Google Scholar
|
|
24
|
Sternby H, Hartman H, Thorlacius H and
Regnér S: IL-1β, IL-6, IL-8 and IL-10 are important chronological
biomarkers in the inflammatory development of acute pancreatitis.
Pancreatology. 18(S100)2018.
|
|
25
|
Rae D, Bowyer RC and Wharton RQ:
Inflammatory mediators in acute pancreatitis. Br J Surg.
82(855)1995.PubMed/NCBI View Article : Google Scholar
|
|
26
|
Chi DZ, Chen J and Huang DP: Influence of
interleukin-1β and interleukin-6 gene polymorphisms on the
development of acute pancreatitis. Genet Mol Res. 14:975–980.
2015.PubMed/NCBI View Article : Google Scholar
|
|
27
|
Park J, Chang JH, Park SH, Lee HJ, Lim YS,
Kim TH, Kim CW and Han SW: Interleukin-6 is associated with
obesity, central fat distribution, and disease severity in patients
with acute pancreatitis. Pancreatology. 15:59–63. 2015.PubMed/NCBI View Article : Google Scholar
|
|
28
|
Rao SA and Kunte AR: Interleukin-6: An
early predictive marker for severity of acute pancreatitis. Indian
J Crit Care Med. 21:424–428. 2017.PubMed/NCBI View Article : Google Scholar
|
|
29
|
Dambrauskas Z, Giese N, Gulbinas A, Giese
T, Berberat PO, Pundzius J, Barauskas G and Friess H: Different
profiles of cytokine expression during mild and severe acute
pancreatitis. World J Gastroenterol. 16:1845–1853. 2010.PubMed/NCBI View Article : Google Scholar
|
|
30
|
Zhou H, Liu A, Zhou B, Zhao C and Jin G:
Interleukin-10 gene rs1800896 polymorphism increases risk of acute
pancreatitis. Medicine (Baltimore). 96(e9006)2017.PubMed/NCBI View Article : Google Scholar
|
|
31
|
Jiang BZ, Tang L, Xue H and Liu DP: Role
of IL-10 gene polymorphisms in the development of acute
pancreatitis. Genet Mol Res. 15(15027743)2016.PubMed/NCBI View Article : Google Scholar
|
|
32
|
Bao XB, Ma Z, Gu JB, Wang XQ, Li HG and
Wang WY: IL-8-251T/A polymorphism is associated with susceptibility
to acute pancreatitis. Genet Mol Res. 14:1508–1514. 2015.PubMed/NCBI View Article : Google Scholar
|
|
33
|
Wang H, Zhang Y, Bai R, Wang M and Du S:
Baicalin attenuates alcoholic liver injury through modulation of
hepatic oxidative stress, inflammation and sonic hedgehog pathway
in rats. Cell Physiol Biochem. 39:1129–1140. 2016.PubMed/NCBI View Article : Google Scholar
|
|
34
|
Ouziel R, Gustot T, Moreno C, Arvanitakis
M, Degré D, Trépo E, Quertinmont E, Vercruysse V, Demetter P, Le
Moine O, et al: The ST2 pathway is involved in acute pancreatitis:
A translational study in humans and mice. Am J Pathol.
180:2330–2339. 2012.PubMed/NCBI View Article : Google Scholar
|
|
35
|
Zhang J, Ren J, Chen H and Geng Q:
Inflammation induced-endothelial cells release angiogenesis
associated-microRNAs into circulation by microparticles. Chin Med J
(Engl). 127:2212–2217. 2014.PubMed/NCBI
|
|
36
|
Yang J and Zeng Y: Identification of
miRNA-mRNA crosstalk in pancreatic cancer by integrating
transcriptome analysis. Eur Rev Med Pharmacol Sci. 19:825–834.
2015.PubMed/NCBI
|
|
37
|
Ofori JK, Salunkhe VA, Bagge A, Vishnu N,
Nagao M, Mulder H, Wollheim CB, Eliasson L and Esguerra JL:
Elevated miR-130a/miR130b/miR-152 expression reduces intracellular
ATP levels in the pancreatic beta cell. Sci Rep.
7(44986)2017.PubMed/NCBI View Article : Google Scholar
|