Introduction
Worldwide, an estimated 240 million people have
chronic hepatitis B virus (HBV) infection, of which the majority of
people with chronic HBV infections reside in low- and middle-income
countries (1). The Asia-Pacific
region has the highest prevalence of HBV infection, with an
estimated range from 5-20% (2).
Despite the remarkable progress of HBV vaccination and antiviral
treatment, HBV-associated liver diseases remain a significant cause
of morbidity and mortality for ~650,000 deaths annually worldwide
(1). Chronic HBV-infected
individuals are subjected to an increased risk of adverse sequelae,
including liver cirrhosis (LC), decompensated liver disease and
hepatocellular carcinoma (2,3). The
annual incidence of cirrhosis in chronic HBV-infected patients is
1.0-2.4%, and the annual rate of progression from compensated
cirrhosis to decompensated cirrhosis is ~4.6% (4). The clinical outcome of decompensated
cirrhosis is poor, and the 5-year survival rate has decreased from
14 to 35% (5). Bacterial infection
is one of the most relevant complications of cirrhosis, which is
the leading cause of hospitalization. Patients with cirrhosis are
susceptible to numerous infectious diseases, and the incidence rate
of infection is much higher than that among general patients
(6,7). It was reported that infection
increased mortality by 4-fold in cirrhosis and contributed to
almost 30% of deaths within 1 month (8). Hence, the study of biomarkers for
early prevention, identification and management of infection in
patients with cirrhosis is needed.
MicroRNAs (miRs/miRNAs) are small non-coding RNAs
containing ~22 nucleotides, which can combine with the Argonaute
protein family to form the RNA-induced silencing complex (RISC).
RISC can bind the 3'- or 5'-untranslated region (UTR) of target
mRNAs, leading to RNA silencing and post-transcriptional regulation
of gene expression (9). miRNAs are
involved in multiple pathophysiological processes and various human
diseases. Moreover, as miRNAs can be conveniently isolated from
body fluids, they are ideal biomarker candidates. In recent years,
an increasing number of studies have provided overwhelming data to
support the association of miRNAs with liver diseases, including
viral hepatitis, liver cirrhosis, liver failure, steatohepatitis
and autoimmune hepatitis (10-13).
Previous studies have confirmed that miRNAs are
involved in bacterial infections (14,15).
In pulmonary tuberculosis, miR-124 can regulate the toll-like
receptor (TLR) signaling pathway by silencing downstream signals
such as TLR6, myeloid differentiation primary response 88 (MyD88),
TNF receptor-associated factor 6 (TRAF6) and TNF-α (16). Moreover, in mouse macrophage
RAW264.7 cells, Salmonella infection could repress let-7a
expression and subsequently lead to IL-10 expression, which is a
critical anti-inflammatory factor in the immune response (17). Aberrant miRNA expression was also
found in liver disease with bacterial infections. Lutz et al
(18) revealed that miR-155 is
upregulated in the ascites of patients with cirrhosis and
spontaneous bacterial peritonitis (SBP), which is associated with
adverse short-term survival; and it could be a potential
biomarker.
In the present study, the miRNA expression pattern
in HBV-related liver cirrhosis (HBV-LC) with bacterial infection
was investigated with the aim of understanding the development of
the disease and to identify potential miRNA biomarkers for early
diagnosis.
Materials and methods
Sample collection
The present study was ethically approved by Fujian
Medical University Mengchao Hepatobiliary Hospital (Fuzhou, China).
Written informed consent was obtained from all the participants
before sample and data collection. A total of 16 serum samples,
including patients with HBV-LC and infection (n=4), patients with
HBV-LC without infection (n=4), patients with chronic hepatitis B
(CHB) (n=4) and healthy controls (n=4), were collected to detect
differentially expressed (DE) miRNAs. Another 24 serum samples,
including eight patients with HBV-LC and infection, eight patients
with HBV-LC without infection and eight patients with CHB, were
also collected to validate the expression of miRNAs by reverse
transcription-quantitative PCR (RT-qPCR). The infection sites of
patients with HBV-LC and infection were SBP (n=6), bacterial
pneumonia (n=4), coinfection of SBP and pneumonia (n=3) and
bacterial urinary infection (n=2).
The characteristics and clinical information of the
participants are summarized in Table
I. All patients in the present study had confirmed diagnosis
based on the recommendations of the latest guidelines of the Asian
Pacific Association for the Study of the Liver for CHB and Liver
Fibrosis (19,20). Patients with diagnosis of infection
had both clinical symptoms and confirmed bacterial evidence.
Positive pathogen culture results were required for the confirming
bloodstream, urinary and respiratory infections. For
culture-negative pulmonary infections, significant findings of
computed tomography scans were needed.
 | Table ICharacteristics of the participants
in the study. |
Table I
Characteristics of the participants
in the study.
| Microarray | RT-qPCR
validation |
|---|
| Clinical index | HBV-LC with
infection n=4 | HBV-LC without
infection n=4 | CHB n=4 | Healthy controls
n=4 | HBV-LC with
infection n=8 | HBV-LC without
infection n=8 | CHB n=8 | P-value |
|---|
| Age (years) | 45.00
(34.50-60.50) | 53.50
(45.00-58.50) | 45.00
(38.00-48.00) | 35.50
(28.00-42.50) | 57.00
(45.00-62.50) | 50.50
(46.50-57.00) | 36.00
(29.00-42.50) | 0.97 |
| Male/female | 3/1 | 2/2 | 3/1 | 1/3 | 4/4 | 7/1 | 6/2 | / |
| ALB (g/l) | 26.50
(19.00-29.00) | 32.00
(31.00-36.00) | 42.00
(41.00-43.00) | / | 23.00
(19.50-29.00) | 31.50
(30.50-38.00) | 31.50
(30.50-38.00) | <0.01 |
| TBIL (µmol/l) | 155.30
(19.80-389.70) | 20.90
(14.80-44.70) | 11.80
(9.30-14.90) | / | 166.90
(78.30-314.95) | 23.25
(15.50-48.60) | 18.00
(12.10-25.40) | 0.02 |
| ALT (U/l) | 112.00
(34.00-318.00) | 69.50
(43.00-81.00) | 109.00
(38.00-193.00) | / | 170.00
(30.50-252.00) | 69.50
(38.50-86.50) | 101.50
(28.00-274.50) | 0.18 |
| AST (U/l) | 139.50
(29-415.00) | 56.00
(45.00-78.00) | 46.00
(32.00-134.00) | / | 247.50
(36.00-380.00) | 56.00
(46.00-80.50) | 49.00
(27.00-110.50) | 0.08 |
| GGT (U/l) | 62.50
(49.00-171.00) | 97.00
(38.00-185.00) | 30.00
(17.00-69.00) | / | 30.50
(19.50-177.00) | 97.00
(48.00-169.50) | 30.50
(19.50-177.00) | 0.90 |
| ALP (U/l) | 135.50
(99.00-173.00) | 107.00
(81.00-157.00) | 70.00
(55.00-71.00) | / | 141.50
(107.00-190.50) | 107.00
(75.50-142.00) | 88.50
(63.00-122.00) | 0.10 |
| CR (µmol/l) | 81.00
(72.00-238.00) | 76.00
(72.00-80.00) | 62.00
(60.00-70.00) | / | 72.00
(65.00-162.50) | 73.00
(67.50-78.00) | 67.00
(62.00-75.50) | 0.27 |
| PTA % | 53.50
(26.00-69.00) | 75.00
(57.00-95.00) | 99.00
(88.00-104.00) | / | 40.00
(30.00-53.50) | 78.00
(55.50-92.50) | 103.00
(87.00-113.50) | <0.01 |
| INR | 1.55
(1.27-2.93) | 1.20
(1.03-1.44) | 1.01
(0.98-1.08) | / | 1.96
(1.55-2.60) | 1.17
(1.05-1.48) | 0.99
(0.93-1.09) | <0.01 |
| PCT (ng/ml) | 0.50
(0.17-5.23) | 0.04 (0.01-0.05
) | / | / | 0.51
(0.27-3.34) | 0.04
(0.01-0.07) | / | <0.01 |
| CRP (mg/l) | 16.62
(7.87-157.84) | 1.88
(0.9-2.85) | 1.96
(1.36-2.55) | / | 14.55
(8.04-87.88) | 1.71
(1.03-2.41) | 1.71
(1.50-3.63) | <0.01 |
| WBC
(109/l) | 5.19
(2.66-13.79) | 4.45
(3.36-4.69) | 4.41
(4.29-5.09) | / | 5.89
(3.28-10.99) | 3.91
(2.73-4.60) | 5.34
(4.29-6.11) | 0.14 |
| PLT
(109/l) | 95.50
(72.00-100.00) | 94.00
(50.00-99.00) | 212.00
(199.00-216.00) | / | 84.50
(71.00-125.00) | 78.50
(51.50-98.00) | 207.50
(171.50-214.00) | 0.39 |
miRNA expression profiling
Total RNA was extracted from 200 µl serum using the
miRNeasy MicroKit (Qiagen, Inc.) according to the manufacturer's
instructions. The purity and concentration of isolated total RNA
were tested with a NanoDrop® ND-2000 spectrophotometer
(Thermo Fisher Scientific, Inc.) through absorbance measurements at
wavelengths of 260 and 280 nm. Only samples with a 260/280 ratio of
≥1.6 were selected. Isolated total RNA samples were stored at -70˚C
for later use. The Affymetrix GeneChip miRNA 4.0 Array (miRBase
version 20.0; Affymetrix; Thermo Fisher Scientific, Inc.) was
applied to compare DE miRNAs among HBV-LC with infection, HBV-LC
without infection, CHB and healthy controls. Briefly, total RNA (1
µg) from each sample was labeled using the FlashTag™ Biotin HSR RNA
labeling kit (according to the Affymetrix user guidelines). The
labeled samples were hybridized on miRNA arrays for 18 h at 48˚C.
Arrays were washed to remove non-specifically bound nucleic acids
and stained on Fluidics Station 450s (Affymetrix; Thermo Fisher
Scientific, Inc.) and then scanned on the GeneChip Scanner 3000 7G
system (Affymetrix; Thermo Fisher Scientific, Inc.). Subsequent
analysis was conducted through Affymetrix GeneChip Command Console
6.0+ software (Thermo Fisher Scientific, Inc.). Raw data were
normalized by the Robust Multi-array Average method to remove
systematic variations (21). The
raw data were analyzed by Transcriptome Analysis Console software
(version 4.0.1; Thermo Fisher Scientific, Inc.), as recommended by
Affymetrix. A probe set was considered expressed if >50% of
samples had a detection above background value below the threshold
and P<0.05. The parameter of DE miRNA was defined as a
logFC<-1 or >1 with a P-value <0.05.
Validation of miRNA array data
Validation of selected DE miRNAs by RT-qPCR was
performed as follows: Total miRNA was extracted from patients'
serum sample using a Serum/Plasma MicroRNA kit (Aidlab
Biotechnologies, Ltd.) according to the manufacturer's
instructions. RT of the extracted miRNAs of each sample was
conducted with the TaqMan™ microRNA Reverse Transcription kit
(Applied Biosystems; Thermo Fisher Scientific, Inc.). All cDNA
samples were kept at -20˚C until RT-qPCR analysis. RT-qPCR was
performed on a Cobas Z480 machine (Roche Diagnostics) using the
TaqMan™ microRNA Assay kit (Applied Biosystems; Thermo Fisher
Scientific, Inc.) according to the manufacturer's protocol. The
primers of used are provided in Table
SI. The thermocycling conditions were set as follows: Initial
activation of Taq polymerase at 95˚C for 10 min, followed by 40
cycles of PCR amplification at 95˚C for 15 sec and
annealing/elongation at 60˚C for 1 min. The expression levels of
miRNA were normalized to that of U6 small nuclear RNA (snRNA). The
relative expression of miRNA was calculated by the
2-ΔΔCq formula (22), in
which ΔCq = Cq of miRNA - Cq of U6 snRNA, and ΔΔCq = ΔCq of the
test group - ΔCq of the control group. The relative quantification
values were logarithmically transformed before comparisons.
Dual-Luciferase reporter gene
assay
The binding sites between miR-4793-3p and Gremlin-1
(Grem1) 3'-UTR were predicted used the web-based tool TargetScan
(http://www.targetscan.org/). Grem1
3'-UTR or mutant 3'-UTR (3'-UTRmut) fragments were inserted into
the psiCHECK-2 plasmid (cat. no. C8011; Promega, Inc.)
respectively, using XbaI and SacI restriction
enzymes. The wild-type or mutant reporter constructs were later
co-transfected into 293T cells (cat. no. CRL-11268™; American Type
Culture Collection). The 293T cells were cultured in RPMI-1640
medium (Gibco; Thermo Fisher Scientific, Inc.) supplemented with
10% FBS (cat. no. P30-3302; PAN Biotech UK, Ltd.), 1%
penicillin-streptomycin and 0.05 mM β-mercaptoethanol under a
humidified 5% CO2 atmosphere at 37˚C. miR-4793-3p mimic
and specific-miR-4793-3p negative control (NC) were synthesized by
General Biol. Prior to transfection, the 293T cells were
transferred to 6-well plates until the confluence reached 90-95%.
Grem1 3'-UTR-psiCHECK-2 (1 µg), 3'-UTRmut-psiCHECK-2 (1 µg),
miR-4793-3p mimic (50 µM) or specific-miR-4793-3p NC (50 µM) were
co-transfected using Lipofectamine® 2000 (Invitrogen;
Thermo Fisher Scientific, Inc.). The untransfected cells were
treated as the normalized control. After transfection, the cells
were kept in a 5% CO2 incubator at 37˚C. After 24 h, the
cells were harvested for luciferase activity detection, following
the protocol of the dual luciferase reporter assay system (cat. no.
E1910; Promega, Inc.). The assay was performed in triplicate.
Cell culture, induction and
transfection
THP-1 monocytes (cat. no. TIB-202™; American Type
Culture Collection) were cultured in RPMI-1640 medium (Gibco;
Thermo Fisher Scientific, Inc.) supplemented with 10% FBS (cat. no.
P30-3302; PAN Biotech UK, Ltd.), and 2 mmol/l L-glutamine under a
humidified 5% CO2 atmosphere at 37˚C. The cells were
pre-treated with 20 ng/ml TGF-β (cat. no. HY-P2294; MedChemExpress)
for 48 h and then collected. Firstly, to interrogate the function
of TGF-β in macrophage differentiation, total cellular RNA was
extracted and used to detect macrophage phenotype-related markers
by RT-qPCR. Secondly, to investigate the association between
miR-4793-3p, Grem1 and the TGF-β signaling pathway, TGF-β-treated
THP-1 cells were transfected with specific miR-4793-3p NC and
mimics separately, while non-transfected cells served as the blank
control. miRNA-4793-3p mimics (1.25 µl; 20 µM) or miR-4793-3p NC
(1.25 µl; 20 µM) were diluted by 30 µl 1X ribo FECT™ CP Buffer
(Guangzhou RiboBio Co., Ltd) and added with 3 µl ribo FECT™ CP
Reagent (Guangzhou RiboBio Co., Ltd) at room temperature for 15
min. The mixture was then added to the prepared TGF-β-treated THP-1
cells, kept in a 5% CO2 incubator at 37˚C. After 36 h,
the cells were collected and used to extract total RNA and protein
for RT-qPCR and western blotting experiments.
mRNA expression and western
blotting
TRIzol® reagent (Invitrogen; Thermo
Fisher Scientific, Inc.) was used to obtain total RNA from 293T and
THP-1 cells, which was reverse transcribed into cDNA using the
SuperScript™ IV First-Strand Synthesis System (cat. no. 18091050;
Thermo Fisher Scientific, Inc.). Primer information is listed in
Table SI. Fluorescent qPCR was
performed based on the protocols of the SYBR-GreenER™ qPCR SuperMix
Universal kit (cat. no. 11762500; Thermo Fisher Scientific, Inc.)
on the Applied Biosystems 2720 Thermal Cycler (Thermo Fisher
Scientific, Inc.). The initial of RT-qPCR was 95˚C for 10 sec,
followed by 40 cycles of 95˚C for 5 sec, and then 60˚C for 30 sec.
A melting-curve analysis was performed to ensure specificity of the
PCR products. The relative gene expression was normalized to
β-actin and calculated by 2-ΔΔCq formula (22).
The THP-1 cells were lysed to extract cellular
protein with 400 µl lysis buffer (cat. no. P0013; Beyotime
Institute of Biotechnology) for 30 min on ice. A total of 20 µg of
cell lysates were separated on 10% Tris-Glycine eXtended gradient
gels (cat. no. 5671093; Bio-Rad Laboratories, Inc.). The targeted
proteins were transferred onto 0.2 µm nitrocellulose membranes
(Cytiva) After transferring proteins, the proteins were blocked
with 5% bovine serum albumin (cat. no. 37525; Thermo Fisher
Scientific, Inc.) at room temperature for 1 h. Subsequently, the
membranes were incubated at 4˚C overnight with the following
primary antibodies: Mouse antibody against Grem1 (1:500; cat. no.
sc-515877; Santa Cruz Biotechnology, Inc.) or mouse monoclonal
antibody against β-actin (1:5,000; cat. no. HC201-01; TransGen
Biotech Co., Ltd.). Subsequently, the membrane was incubated with
ProteinFind® goat anti-mouse IgG (H+L), HRP Conjugate
(1:10,000; cat. no. HS201-01; TransGen Biotech Co., Ltd.) secondary
antibody for 1 h at room temperature. The protein bands were
visualized by enhanced Chemiluminescent detection (SuperSignal™
West Pico PLUS Chemiluminescent Substrate; cat. no. 34580; Thermo
Fisher Scientific, Inc.) and quantified by densitometry using a Gel
Imaging System (JS-1070; Shanghai Peiqing Science & Technology
Co., Ltd) for gray value analysis.
Statistical analysis, target gene
prediction and functional analysis
The results were analyzed using R (version 3.6.1;
https://cran.r-project.org) and GraphPad
Prism (version 8.0 for Windows, GraphPad Software, Inc.). Data are
represented as the median and interquartile range. Skewed data were
power-transformed to approximate normality. P<0.05 was
considered to indicate a statistically significant difference.
Levene's test was used for evaluating homogeneity of variance
across groups. Student's t-test was used for two-group comparisons,
while one-way ANOVA was applied for multiple group comparisons. The
Holm correction method was used by the pairwise.t.test function of
R language as the post-hoc test to determine whether the mean
difference between specific pairs of group was statistically
significant. Since linear regression was not applicable to the
small sample size used in the present study, non-parametric random
forest regression was applied to build the classification model. A
receiver operating characteristic (ROC) curve was plotted to access
the diagnostic value of the model. The target genes of miRNAs were
predicted with TargetScan and miRDB (http://www.mirdb.org) (23,24).
Gene Ontology (GO; Website: http://geneontology.org) and Kyoto Encyclopedia of
Genes and Genomes (KEGG; Website: https://www.genome.jp/kegg) enrichment analyses were
conducted by the R package, clusterProfiler (version 3.12)
(25). Publicly available gene
expression data were obtained from the Gene Expression Omnibus
(GEO) to analyze the miRNA target genes in bacterial infection.
After searching, the dataset GSE46955 was selected, which compared
DE genes between patients with bacterial sepsis and healthy
controls (26). The relative
datasets were downloaded from GEO (https://www.ncbi.nlm.nih.gov/geo/query/acc.cgi?acc=GSE46955).
Results
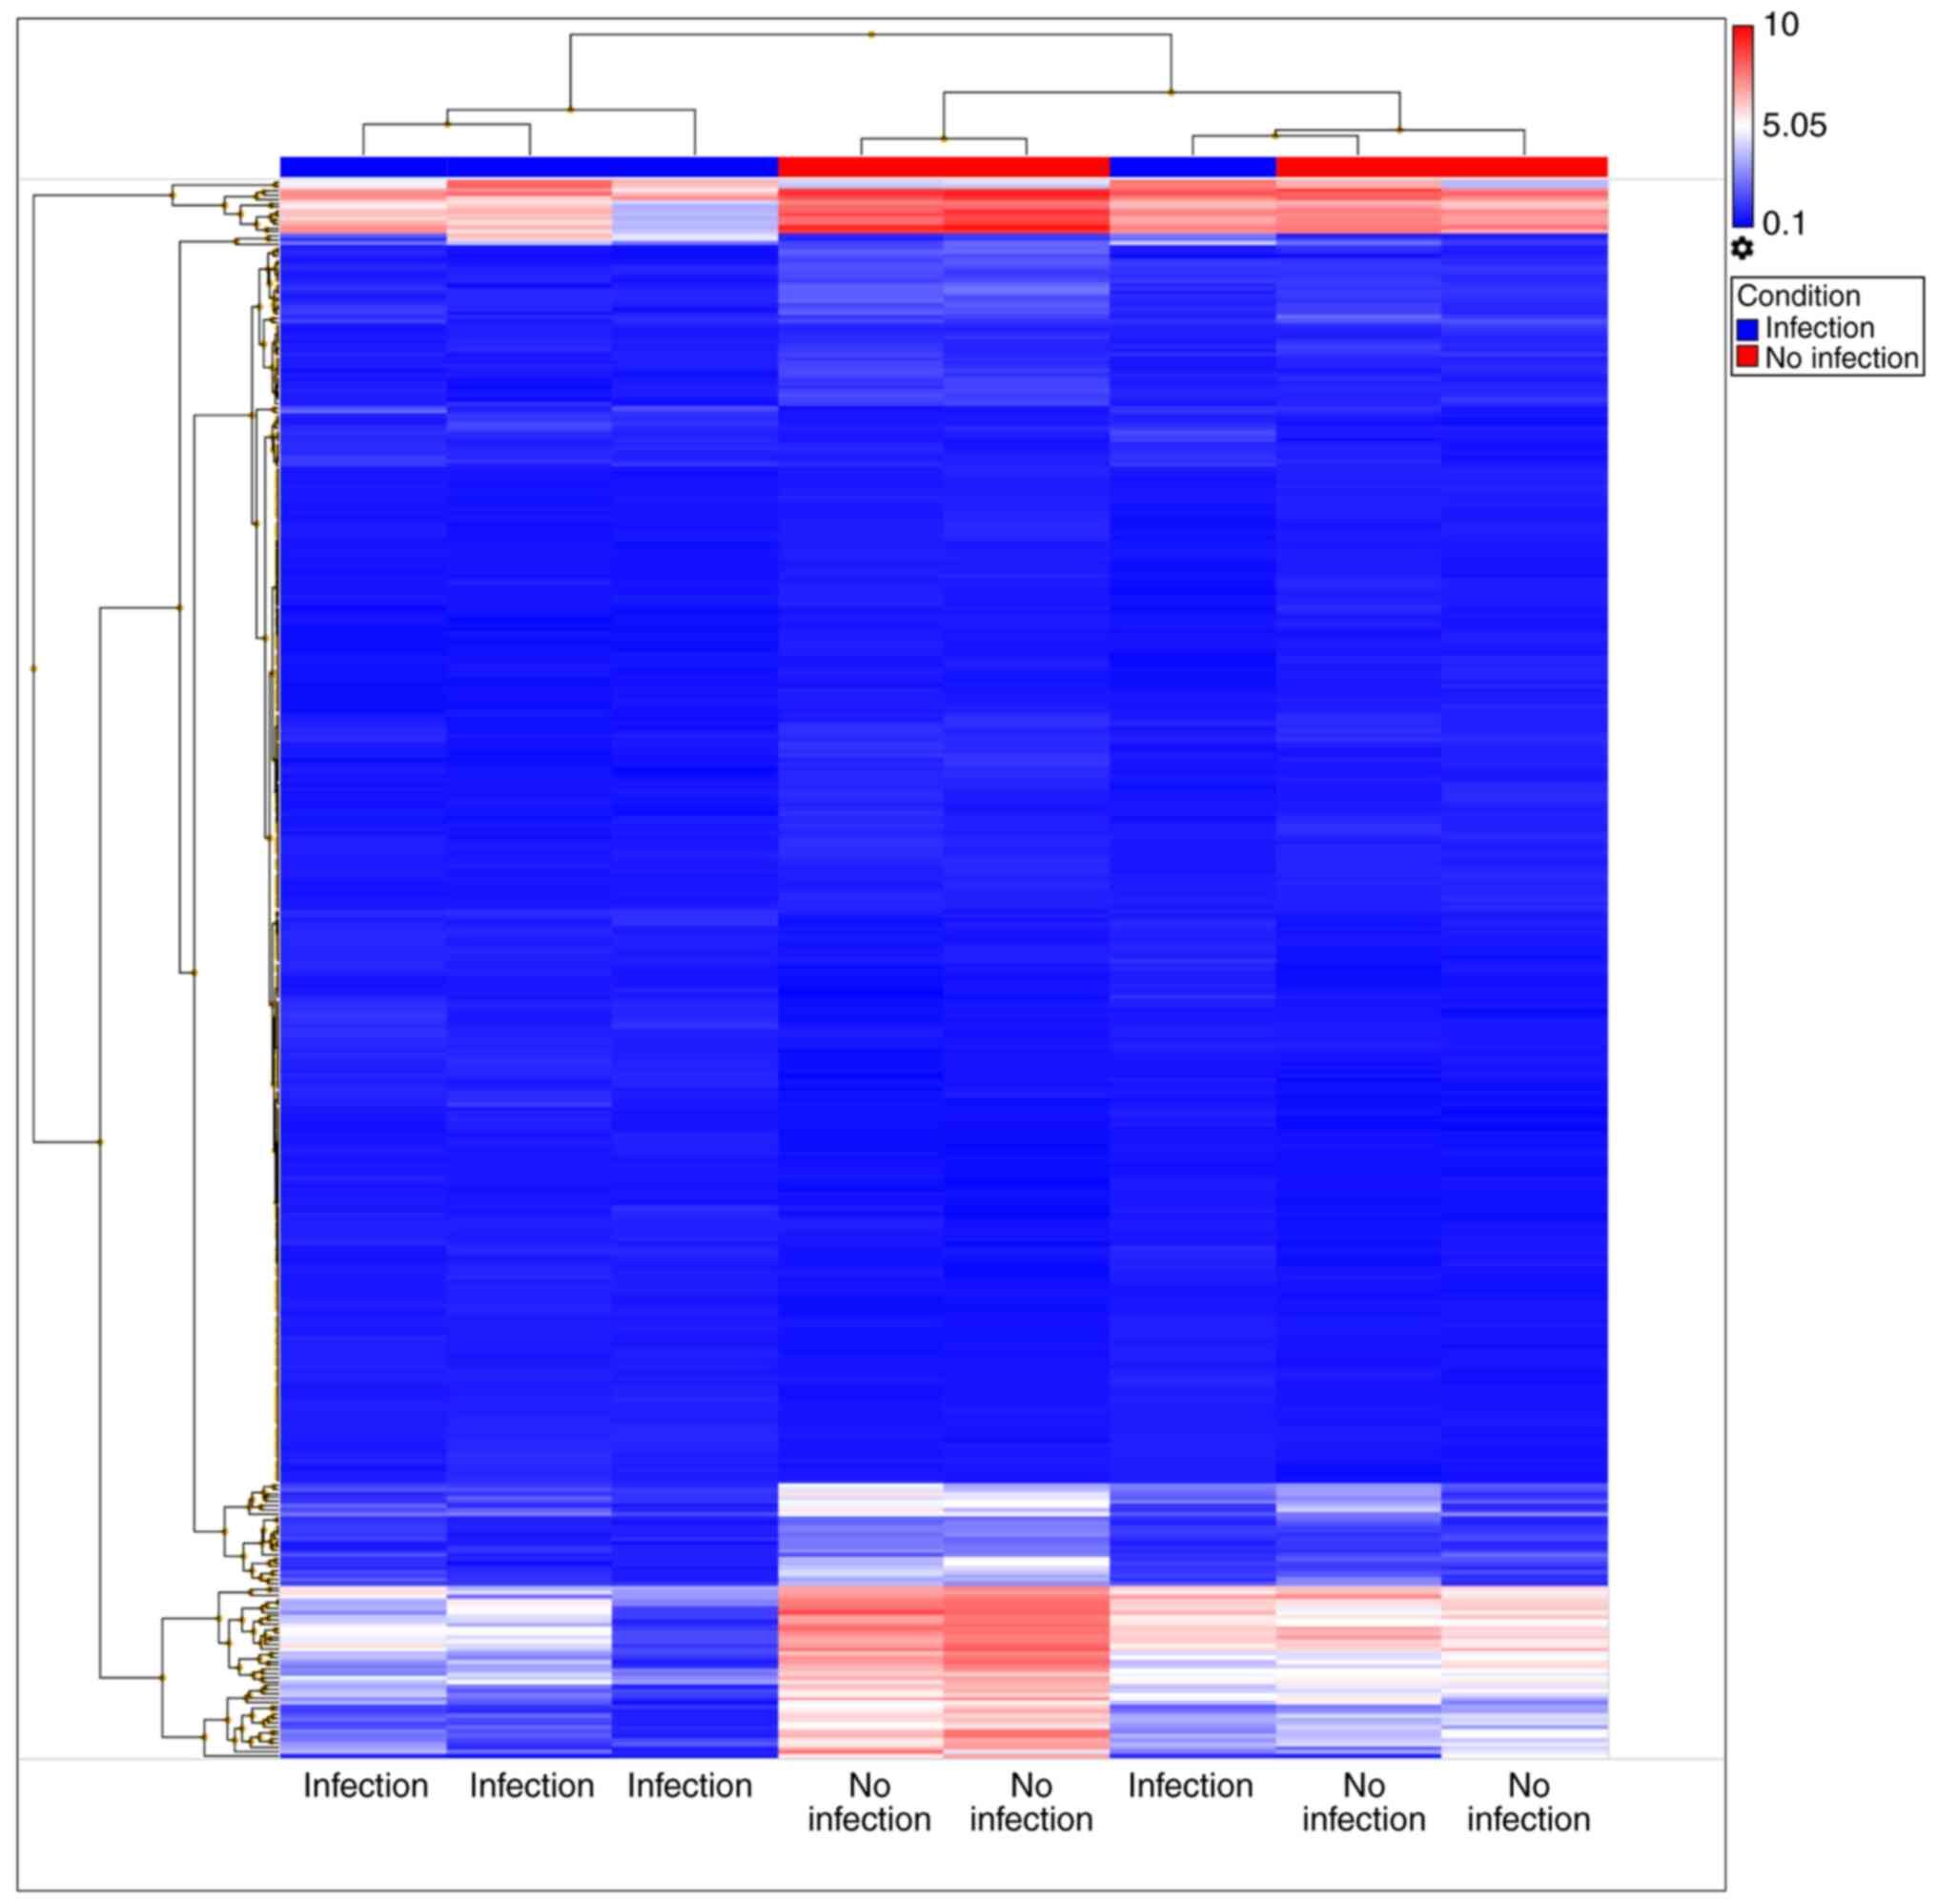
Identification of DE miRNA sets
The microarray experiment identified 385 DE miRNAs
between the cirrhosis with infection and cirrhosis without
infection groups, among which 160 miRNAs were upregulated and 225
were downregulated (Fig. 1). The
top five upregulated and the top five downregulated miRNAs are
listed in Table II. The available
miRNA as a biomarker should express at a high level in patients
with cirrhosis and bacterial infection compared to other groups.
Under this premise, only miR-4793-3p and miR-4440 matched the
criteria. As shown in Table II,
miR-4793-3p was upregulated in patients with cirrhosis and
infection compared with the levels in patients with cirrhosis
without infection (logFC=7.96; P=0.0458), patients with CHB
(logFC=34.53; P=0.0003) and healthy controls (logFC=3.34;
P=0.0219). miR-4440 was upregulated in patients with cirrhosis and
infection compared with its levels in cirrhosis patients without
infection (logFC=7.65; P=0.0408), CHB (logFC=53.11; P=0.0004) and
healthy controls (logFC=3.18; P=0.0292).
| Table IIDifferentially expressed microRNAs in
patients with HBV-LC with infection, HBV-LC without infection, CHB
and healthy controls. |
Table II
Differentially expressed microRNAs in
patients with HBV-LC with infection, HBV-LC without infection, CHB
and healthy controls.
| Comparisons | ID | Accession | logFC | P-value |
|---|
| HBV-LC with
infection vs. |
hsa-miR-4793-3p | MIMAT0019966 | 7.96 | 0.0458 |
| HBV-LC without
infection | hsa-miR-4440 | MIMAT0018958 | 7.65 | 0.0408 |
| |
hsa-miR-4668-5p | MIMAT0019745 | 6.97 | 0.0112 |
| |
hsa-miR-3613-3p | MIMAT0017991 | 4.69 | 0.0491 |
| | hsa-miR-5093 | MIMAT0021085 | 2.51 | 0.0185 |
| |
hsa-miR-6824-5p | MIMAT0027548 | -29.86 | 0.0088 |
| |
hsa-miR-6789-5p | MIMAT0027478 | -15.38 | 0.0164 |
| |
hsa-miR-4433-3p | MIMAT0018949 | -13.61 | 0.0009 |
| |
hsa-miR-6722-3p | MIMAT0025854 | -12.96 | 0.0037 |
| |
hsa-miR-6798-5p | MIMAT0027496 | -12.73 | 0.0016 |
| HBV-LC with
infection vs. CHB | hsa-miR-4440 | MIMAT0018958 | 53.11 | 0.0004 |
| |
hsa-miR-4793-3p | MIMAT0019966 | 34.53 | 0.0003 |
| | hsa-miR-297 | MIMAT0004450 | 10.37 | 0.0128 |
| |
ENSG00000239063 |
ENSG00000239063 | 9.44 | 0.0056 |
| |
ENSG00000239063 |
ENSG00000239063 | 7.28 | 0.0064 |
| | hsa-miR-122-5p | MIMAT0000421 | -23.98 | 0.0297 |
| | hsa-miR-4487 | MIMAT0019021 | -6.29 | 0.0141 |
| | hsa-miR-4270 | MIMAT0016900 | -5.36 | 0.0279 |
| |
hsa-miR-1343-5p | MIMAT0027038 | -4.30 | 0.0493 |
| | hsa-miR-4463 | MIMAT0018987 | -3.44 | 0.0293 |
| HBV-LC with
infection vs. healthy |
ENSG00000239063 |
ENSG00000239063 | 5.06 | 0.0285 |
| | hsa-miR-4532 | MIMAT0019071 | 4.18 | 0.0146 |
| |
hsa-miR-4793-3p | MIMAT0019966 | 3.34 | 0.0219 |
| | hsa-miR-4440 | MIMAT0018958 | 3.18 | 0.0292 |
| | hsa-miR-4462 | MIMAT0018986 | 2.75 | 0.0421 |
| | hsa-miR-4487 | MIMAT0019021 | -3.53 | 0.0448 |
| |
hsa-miR-1298-3p | MIMAT0026641 | -1.35 | 0.0104 |
| |
hsa-miR-3675-3p | MIMAT0018099 | -1.31 | 0.0182 |
| | hsa-mir-3924 | MI0016432 | -1.29 | 0.0102 |
| |
ENSG00000252154 |
ENSG00000252154 | -1.28 | 0.0008 |
Validation and evaluation of
miR-4793-3p as a biomarker
RT-qPCR was used to assess the abundance of
miR-4793-3p and miR-4440 in another batch of clinical samples. A
higher level of miR-4793-3p was detected in patients with cirrhosis
and infection compared with those without infection (P=0.018) and
with CHB (P=0.013). The expression level of miR-4793-3p in patients
with cirrhosis without infection and CHB was not significantly
different (P=0.397; data not shown). However, the expression of
miR-4440 was not significantly different in validation samples
between infection and non-infection groups (P<0.05; data not
shown). The expression of miR-4793-3p was consistent with previous
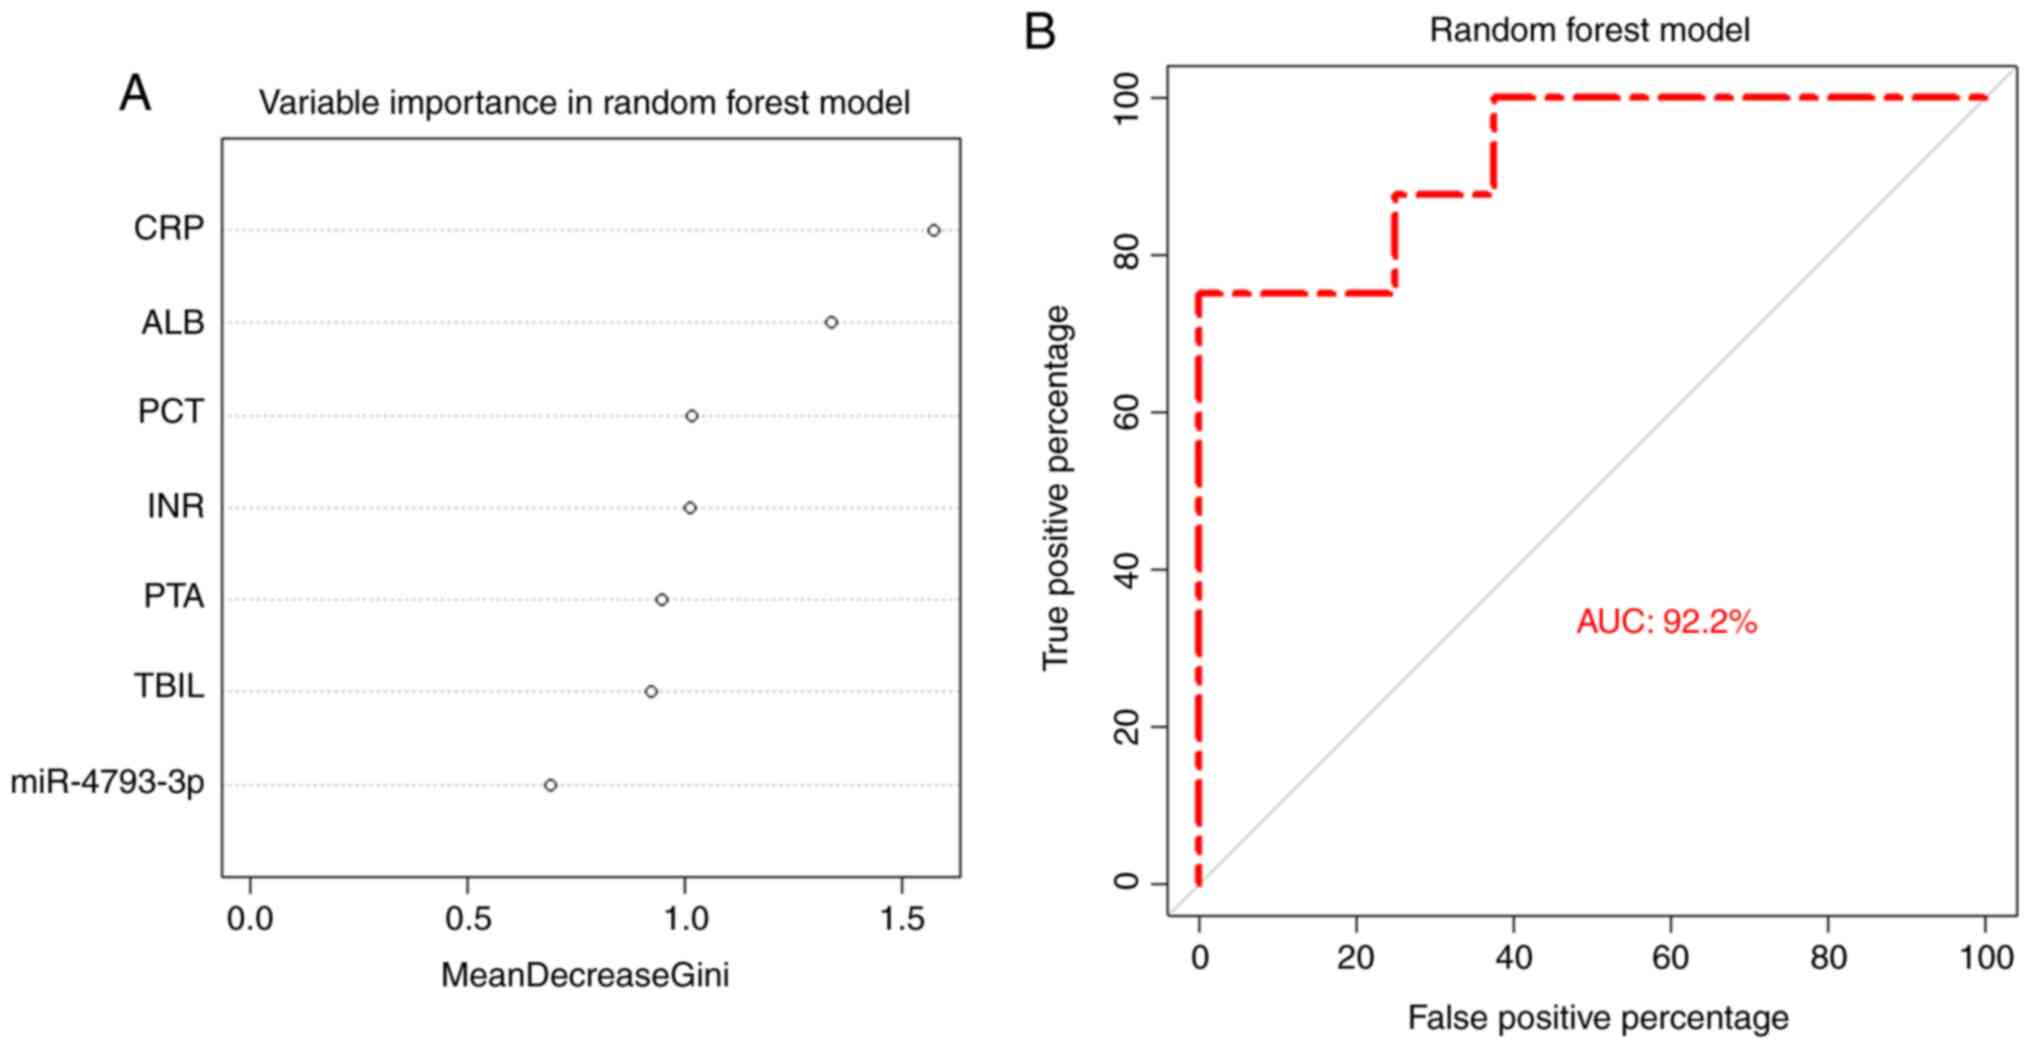
microarray data. Non-parametric machine-learning random forest
regression was applied to assess the diagnostic value of
miR-4793-3p. Previous analysis showed that C-reactive protein
(CRP), albumin, international normalized ratio, prothrombin
activity, procalcitonin (PCT) and total bilirubin were associated
with infections in patients with cirrhosis (Table I). These variables, together with
miR-4793-3p, were used to build the random forest model. As
demonstrated in the ROC plot, the model had an area under the curve
(AUC) of 92.2%. The plot of variable importance showed that CRP was
the most critical factor (Fig.
2).
Target genes and functional
prediction
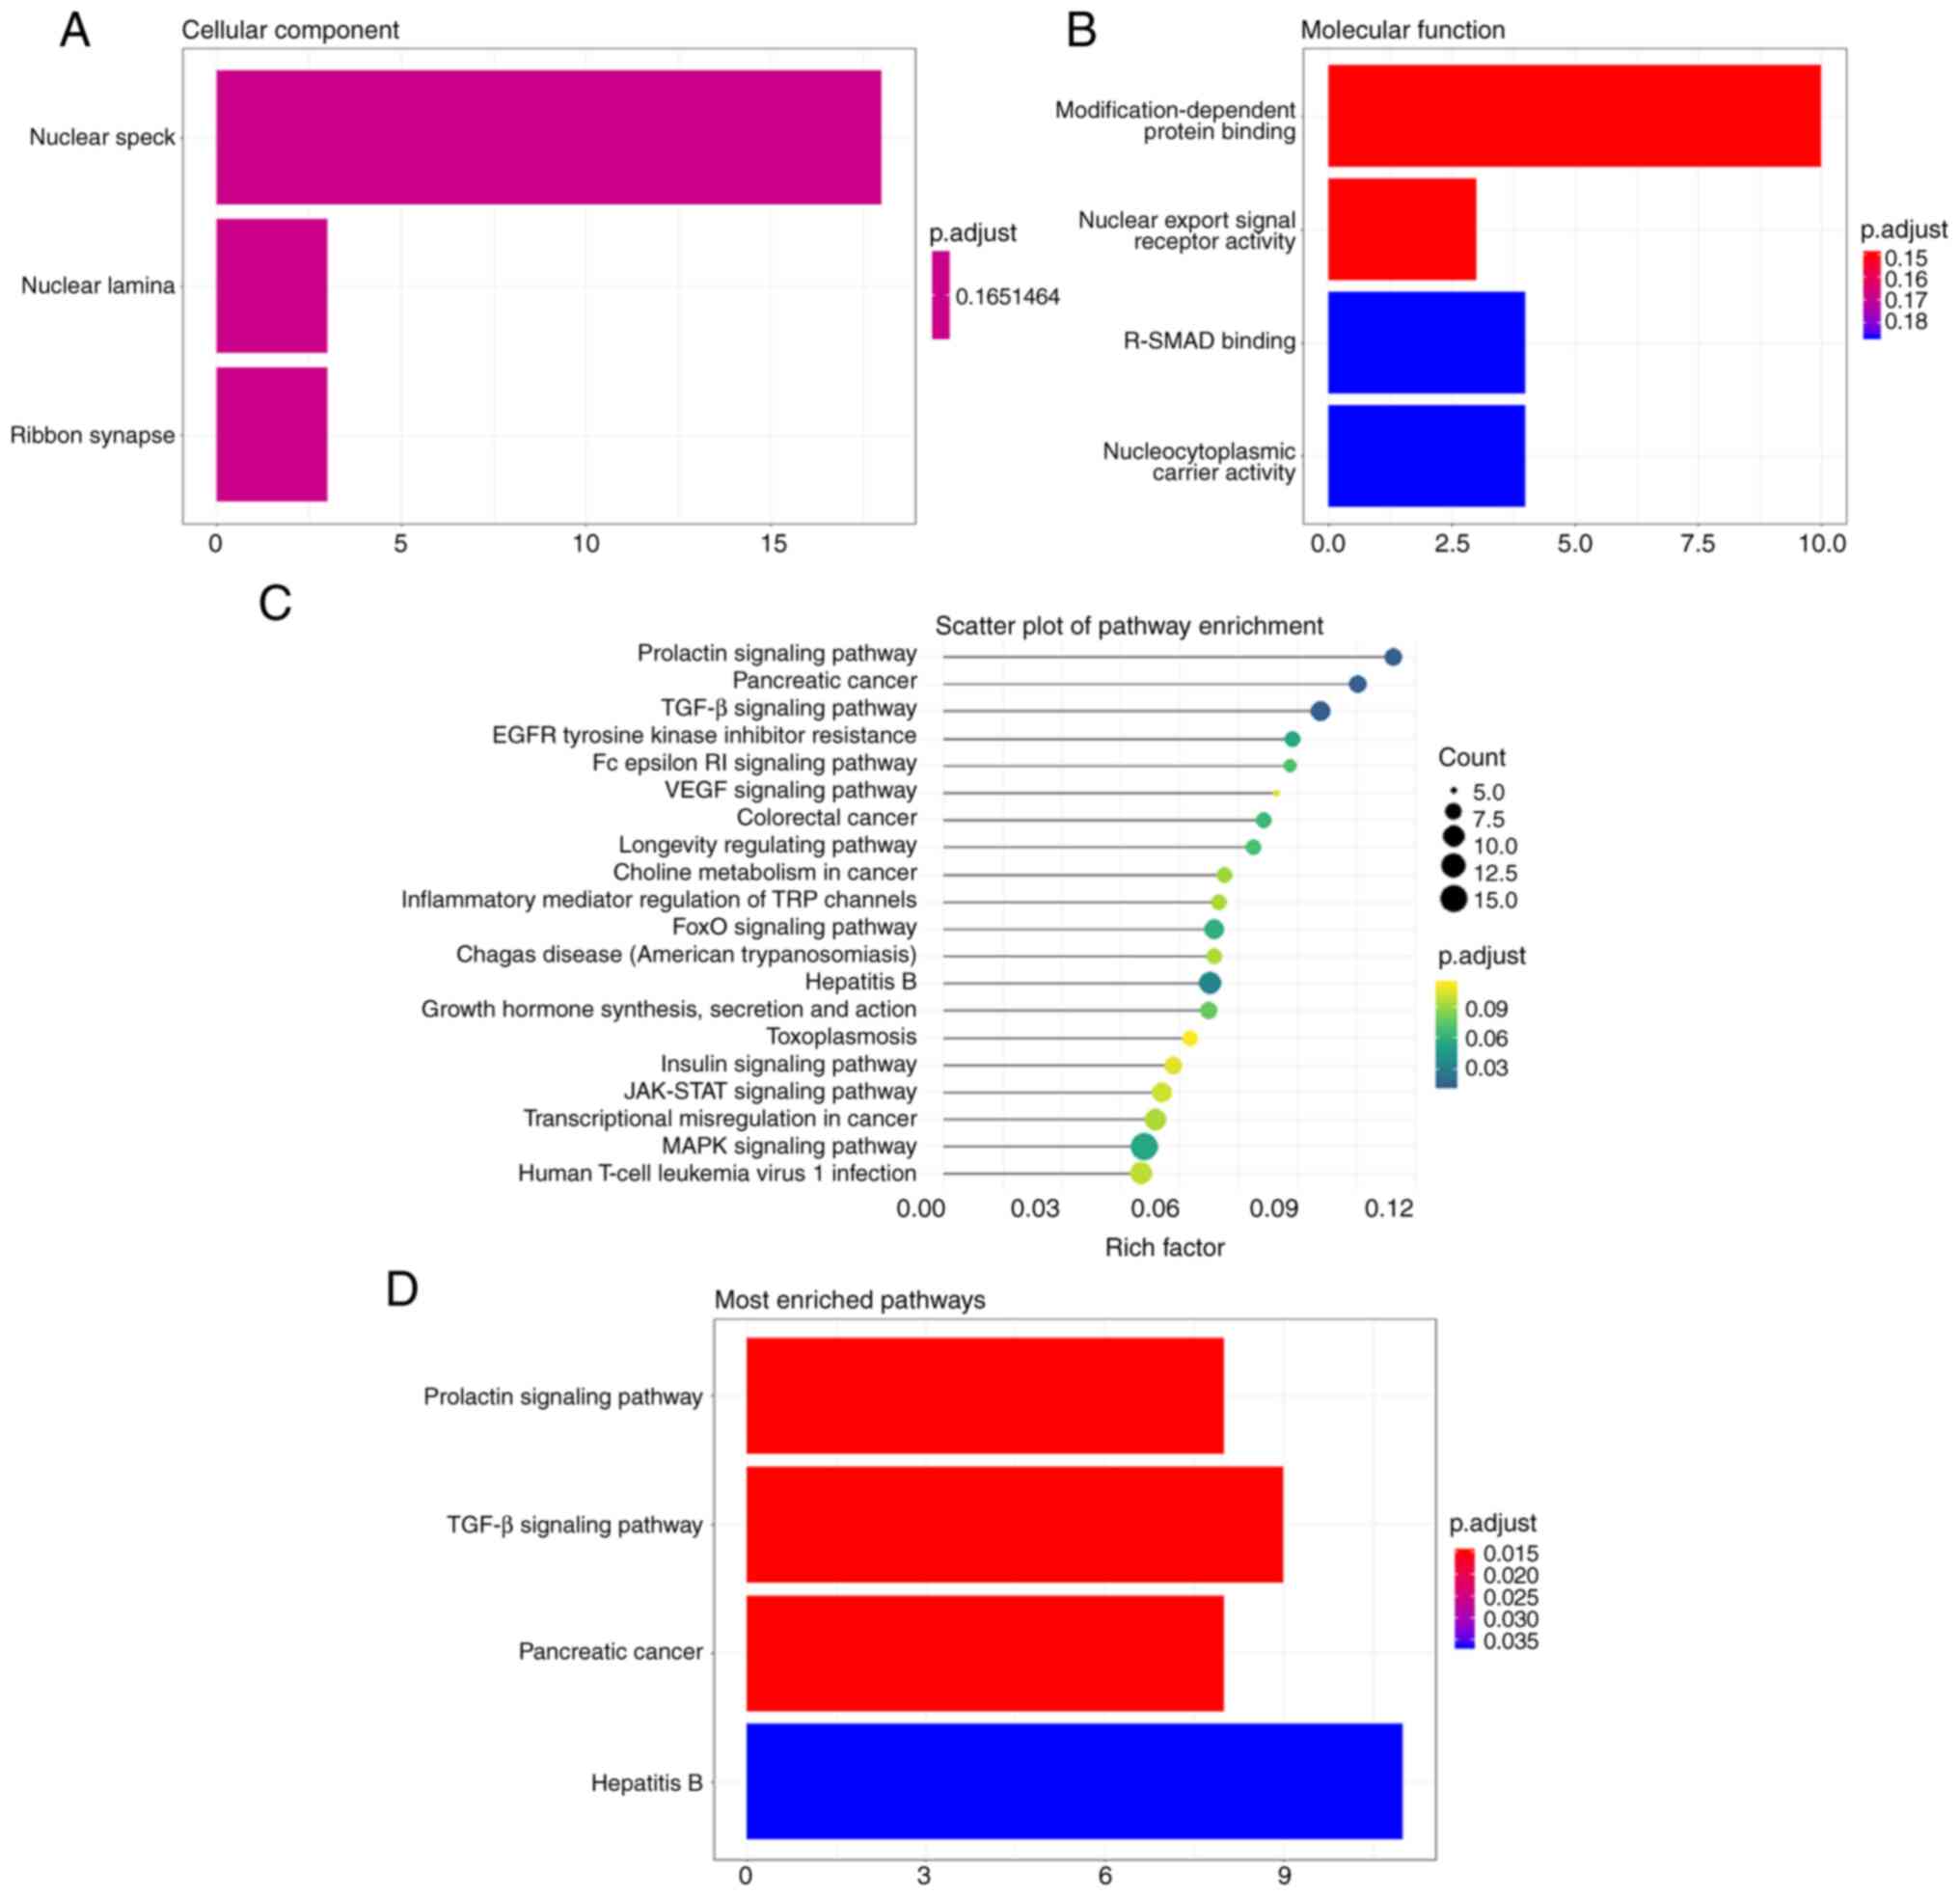
A total of 383 potential target genes of miR-4793-3p
were both found in TargetScan (n=4,995) and miRDB (n=424). GO and
KEGG enrichment analyses were conducted on these 383 genes. The GO
analysis demonstrated that the target genes clustered in cellular
components of ‘nuclear speck’, ‘nuclear lamina’ and ‘ribbon
synapse’; in the molecular functions of ‘modification-dependent
protein binding’, ‘nuclear export signal receptor activity’,
‘receptor-regulated SMAD binding’ and ‘nucleocytoplasmic carrier
activity’ (Fig. 3A and B). The KEGG analysis showed that the
target genes were also involved in many signaling pathways
(Fig. 3C), and most enriched in the
pathways of ‘prolactin signaling pathway’, ‘TGF-β signaling
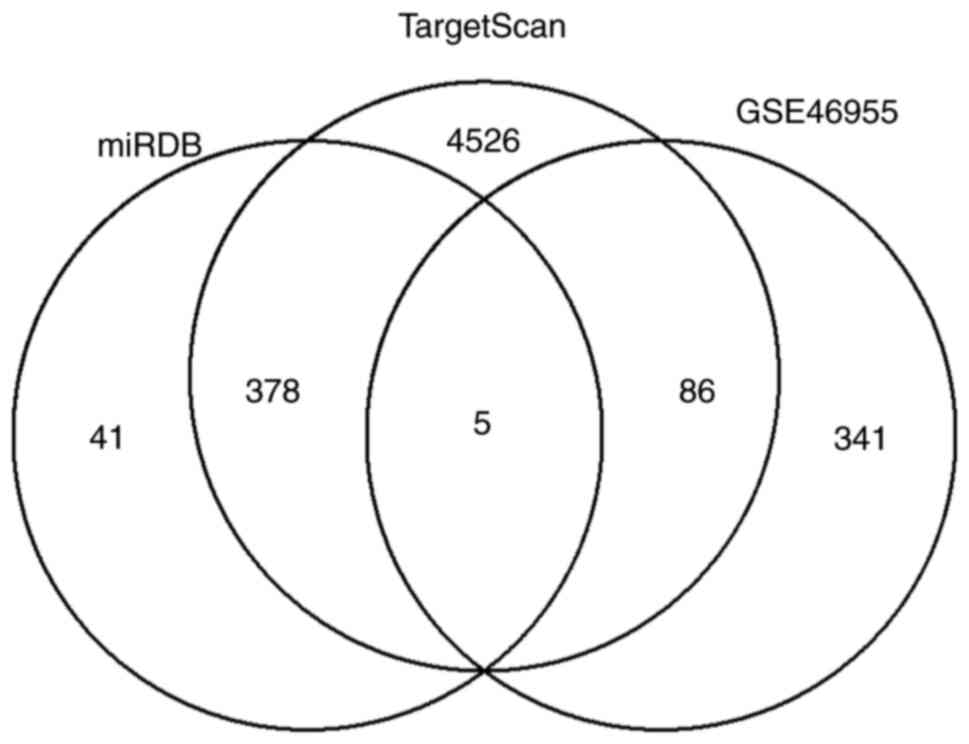
pathway’, ‘pancreatic cancer’ and ‘hepatitis B’ (Fig. 3D). Meanwhile, a previously reported
gene expression data of patients with bacterial sepsis was
downloaded from the GEO database (GSE46955). After analyzing the
data, 432 downregulated DE genes associated with bacterial
infection were obtained (Table
SII). Among them, five genes are also found in the 383
potential target genes list, including Grem1, progestin and adipoQ
receptor family member 4 (paqr4), calnexin (canx), macrophage
scavenger receptor 1 (msr1) and zinc binding alcohol dehydrogenase
domain containing 2 (zadh2) (Fig. 4
and Table III).
| Table IIIExpression of Grem1, paqr4, canx,
msr1 and zadh2 in the public dataset GSE46955. |
Table III
Expression of Grem1, paqr4, canx,
msr1 and zadh2 in the public dataset GSE46955.
| Gene | logFC | AveExpr | t | P-value | adj.P.Val | B |
|---|
| msr1 | -1.90 | 7.04 | -12.59 |
1.67x10⁻⁹ |
4.62x10⁻⁷ | 12.21 |
| paqr4 | -1.47 | 8.23 | -6.92 |
4.32x10⁻⁶ |
8.60x10⁻⁵ | 4.31 |
| canx | -1.27 | 10.47 | -6.56 |
8.02x10⁻⁶ |
1.32x10⁻⁴ | 3.68 |
| zadh2 | -1.32 | 8.03 | -4.95 |
1.62x10⁻⁴ |
1.22x10⁻³ | 0.63 |
| Grem1 | -2.55 | 7.49 | -4.22 |
7.03x10⁻⁴ |
3.59x10⁻³ | -0.86 |
Overexpressed miR-4793-3p can impair
the TGF-β pathway by targeting Grem1
In response to pathogens, macrophages can
dichotomize into M1-like macrophage as a pro-inflammatory phenotype
or M2-like macrophage as an anti-inflammatory phenotype (27). As reported in previous studies,
TGF-β could induce macrophages into the M2 phenotype (28-30),
which was consistent with the present study. Compared with the
control group, M2-related makers such as C-X-C motif chemokine
receptor 4; IL-10 and arginase 1 were upregulated, while M1-related
makers such as human leukocyte antigen-DR isotype, IL-12, CD80,
inducible nitric oxide synthase, TNF-α and monocyte chemoattractant
protein were significantly downregulated in TGF-β-treated THP-1
cells (Fig. 5A). Smad2 and Smad3
are known as the downstream genes of the TGF-β pathway. Following
TGF-β stimulus, together with Smad2 and Smad3, Grem1 was also
expressed in relatively compared with the control group, which
indicated that Grem1 could be activated by TGF-β. However, when
miR-4793-3p mimics were transfected into TGF-β-treated THP-1 cells,
the expression of Smad2, Smad3 and Grem1 was significantly reduced
(Fig. 5B). This suggested that
overexpressed miR-4793-3p could negatively regulate the TGF-β
pathway by targeting Grem1.
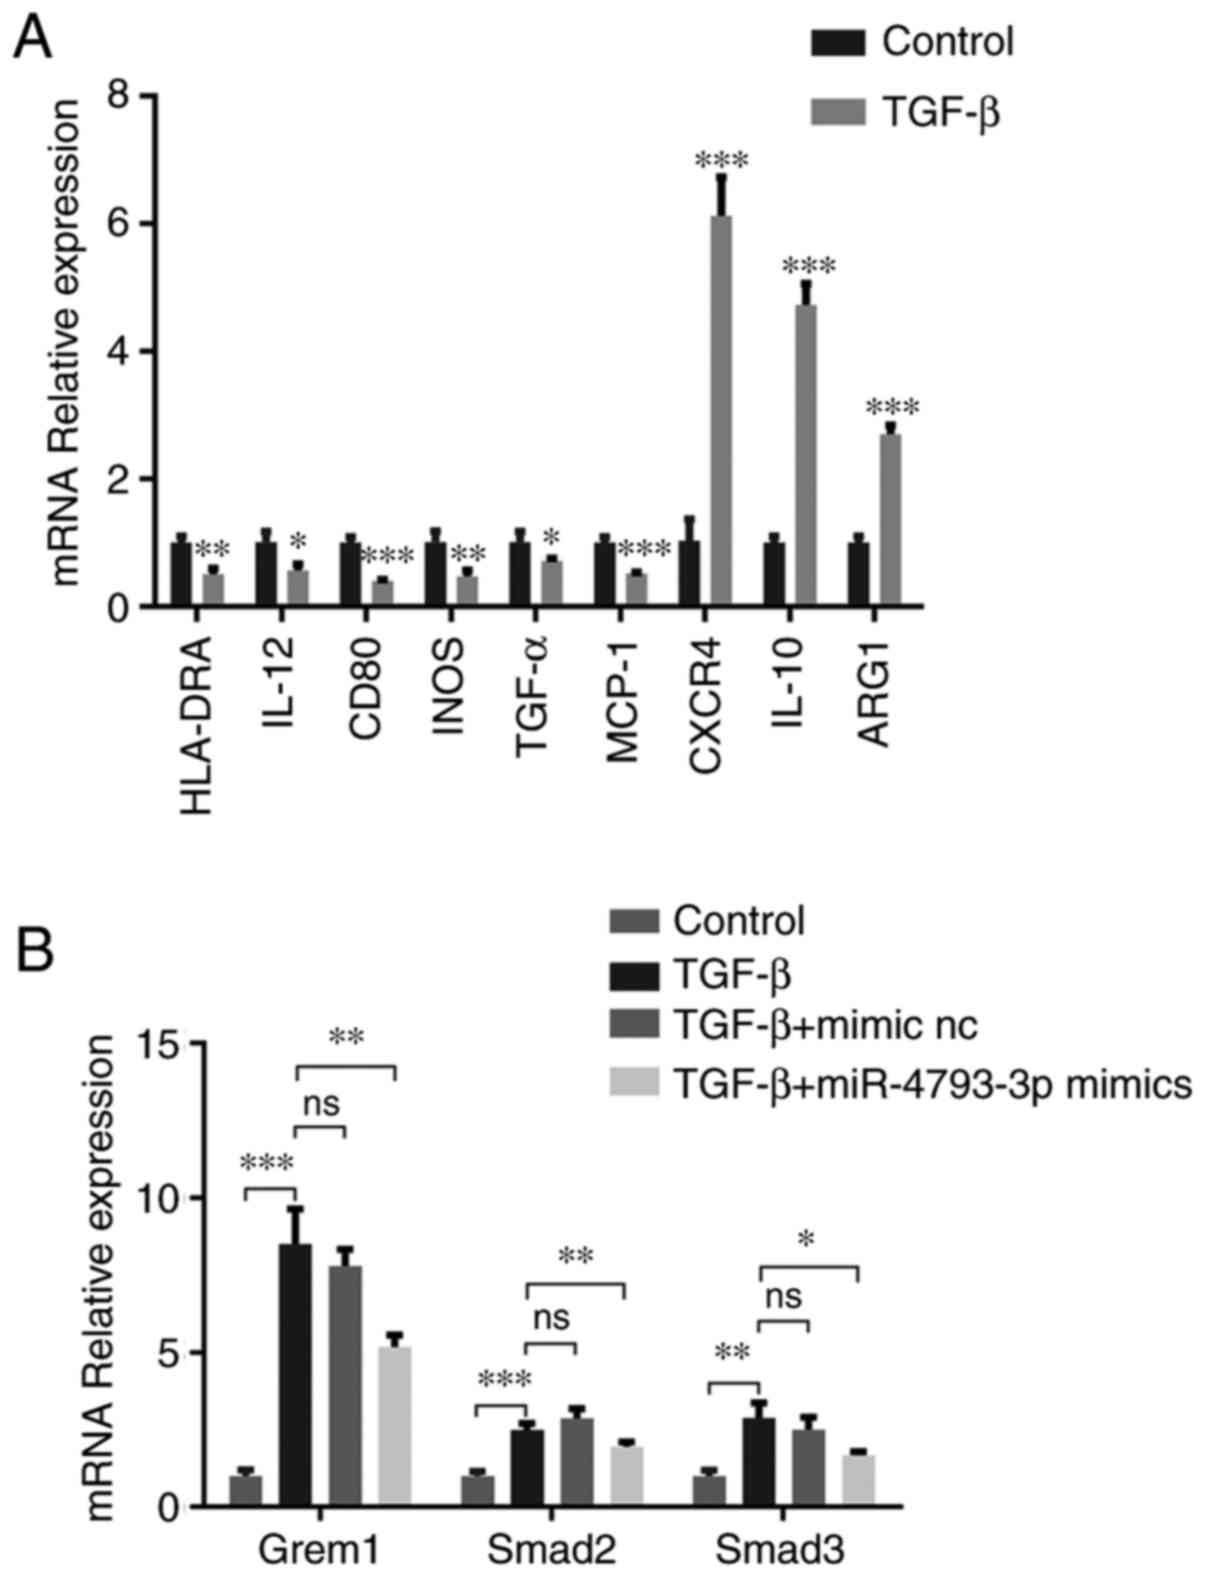 | Figure 5miR-4793-3p negatively regulates the
TGF-β pathway. (A) In TGF-β-treated THP-1 cells, the expression
levels of M2-related makers, CXCR4, IL-10 and ARG1, were
significantly upregulated. By contrast, the expression levels of
M2-related makers, HLA-DR, IL-12, CD80, iNOS, TNF-α and MCP-1, were
significantly downregulated. (B) TGF-β-treated THP-1 cells
increased Grem1, Smad2 and Smad3 levels compared with controls.
When the cells were transfected with miR-4793-3p mimics, the
expression levels of Grem1, Smad2 and Smad3 significantly
decreased. There was no significant change in the expression levels
of Grem1, Smad2 or Smad3 in the specific miR-4793-3p mimic NC group
compared with controls. *P<0.05; **P<
0.01 and ***P<0.001. CXCR4, C-X-C motif chemokine
receptor 4; ARG1, arginase 1; HLA-DR, human leukocyte antigen-DR
isotype; iNOS, inducible nitric oxide synthase; MCP1, monocyte
chemoattractant protein; NC, negative control; ns, not significant;
miR, microRNA. |
Grem1 is validated as the target of
miR-4793-3p
To confirm the association between miR-4793-3p and
Grem1, a dual luciferase reporter assay was performed. As shown in
Fig. 6A, the relative luciferase
activity was significantly declined when 293T cells were
co-transfected with Grem1-wild-type and miR-4793-3p mimics compared
with the NC group. However, no significant difference was observed
when cells were co-transfected with Grem1-mutant and miR-4793-3p
mimics compared with the levels in the NC group. Significantly
higher expression of miR-4793 was detected in 293T cells
transfected with miR-4793-3p mimics compared with cells transfected
with miR-4793-3p mimic NC or the control (Fig. 6B). Overexpressed miR-4793-3p could
downregulate Grem1 expression both at the mRNA and protein levels
(Fig. 6C and D). These results provided evidence that
miR-4793-3p could bind to the 3'-UTR of Grem1 and negatively
regulate Grem1 expression.
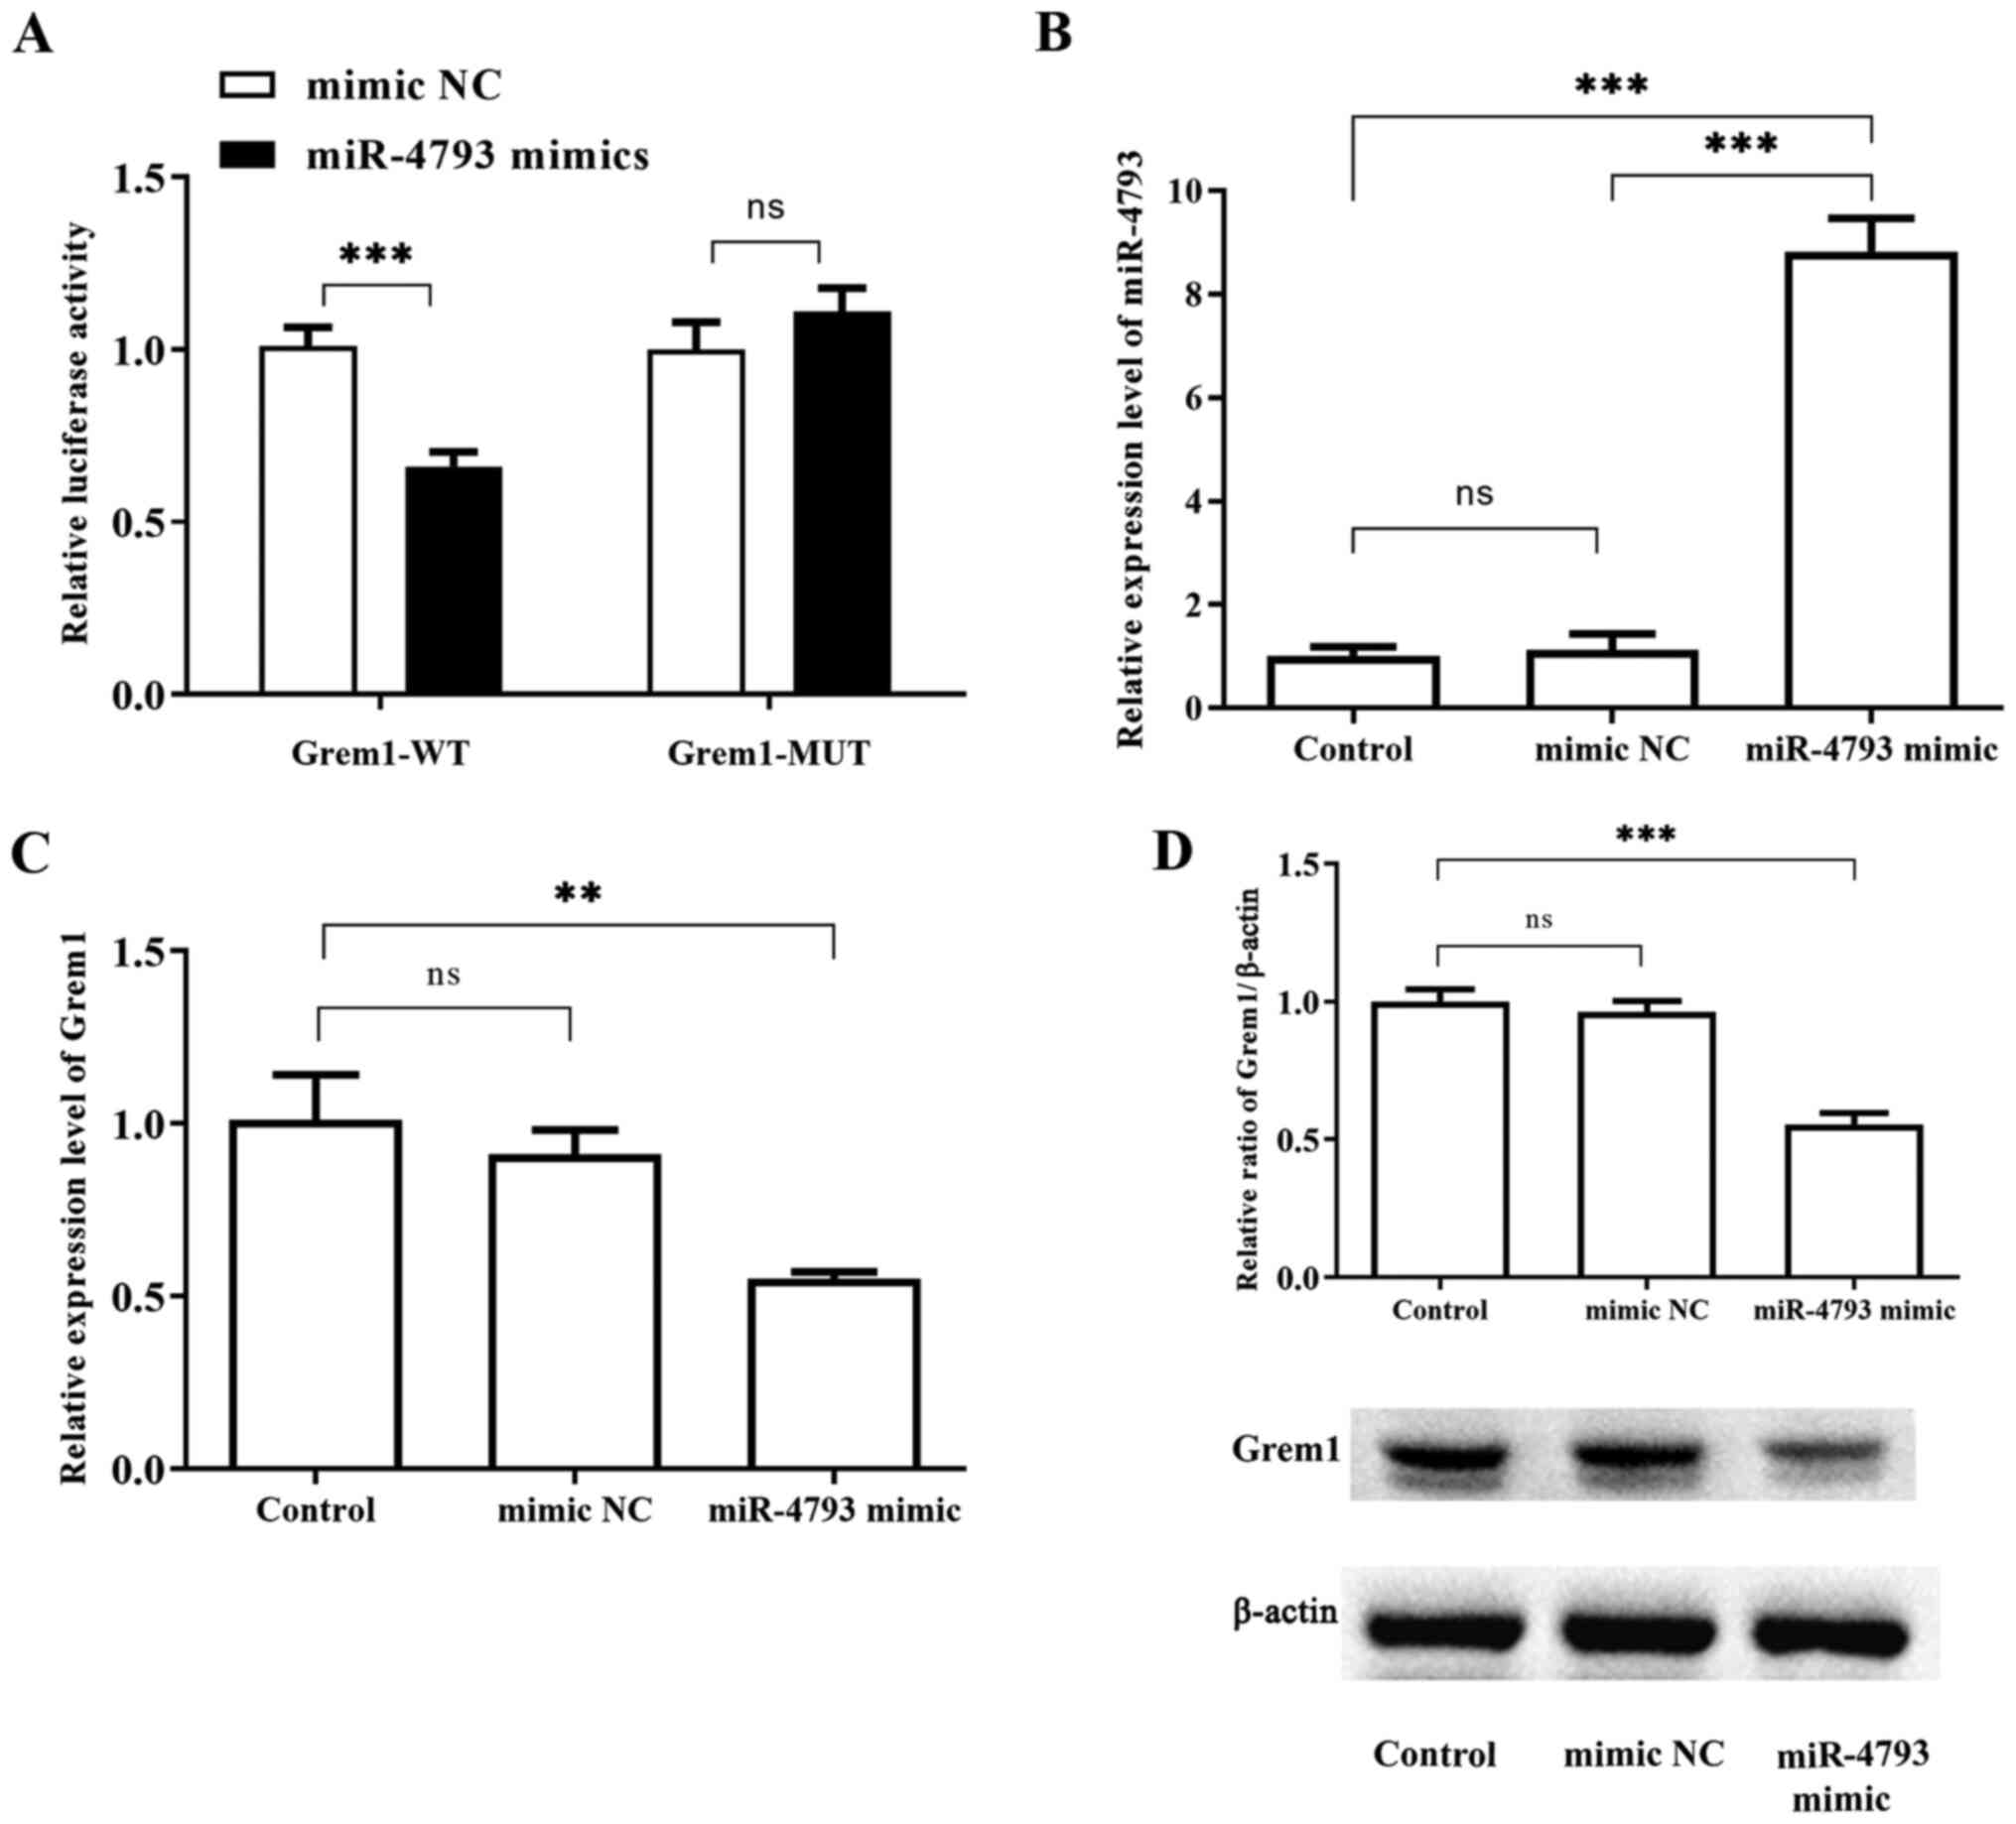 | Figure 6Grem1 is a target gene of
miR-4793-3p. (A). Dual-Luciferase assay demonstrated significantly
declined luciferase activity in the 293T cells, which were
co-transfected with Grem1-WT and miR-4793-3p mimics compared with
mimic-NC. By contrast, no significant change in luciferase activity
was observed in cells co-transfected with Grem1-MUT and miR-4793-3p
mimics compared with mimic-NC. (B) Significantly higher expression
of miR-4793 was detected by fluorescent reverse
transcription-quantitative PCR in 293T cells transfected with
miR-4793-3p mimics compared with cells transfected with miR-4793-3p
mimic NC or the control. No significant difference was observed
between miR-4793-3p mimic NC and the control groups. (C) In
TGF-β-treated THP-1 cells transfected with miR-4793-3p mimics,
significantly downregulated Grem1 mRNA levels was observed compared
with the control. By contrast, the mRNA levels of Grem1 was not
significantly different between the miR-4793-3p mimic NC group and
the control. (D) Western blotting showed significantly
downregulated Grem1 protein levels in the miR-4793-3p mimics group
compared with the control. There was no significant change in Grem1
protein levels in the miR-4793-3p mimic NC group compared the
control. β-actin served as the internal reference gene.
**P<0.01 and ***P<0.001. WT, wild-type;
MUT, mutant; NC, negative control; ns, not significant; miR,
microRNA; Grem1, Gremlin-1. |
Discussion
Early detection of bacterial infection is crucial
for patients with cirrhosis. However, the broad use of biomarkers
in cirrhosis such as CRP and procalcitonin for bacterial infections
has several limitations, and the study results remain controversial
(7). A recently reported biomarker,
soluble CD14 subtype (presepsin), shows a favorable outcome in
patients with cirrhosis and bacterial infection, which requires
more supporting data (31). The
present study investigated DE miRNAs in patients with HBV-related
cirrhosis and bacterial infections. As presented, miR-4793-3p was
upregulated in patients with cirrhosis and infection in both the
microarray experiment and RT-qPCR validation. Thus, miR-4793 could
be a feasible biomarker for patients with cirrhosis and bacterial
infections.
In the GO and KEGG enrichment analyses, the
predicted target genes of miR-4793-3p were mostly enriched in the
TGF-β signaling pathway. TGF-β is critical in the innate immune
system. While TGF-β serves as an anti-inflammatory factor, which
could suppress the augmentation of bacterial infection,
overexpressed TGF-β could also impair the immune clearance of the
pathogen (32). A previous study
demonstrated that TGF-β could induce macrophages to transform into
the M2 phenotype, which is anti-inflammatory rather than
pro-inflammatory (28). Upregulated
TGF-β was associated with the lack of maturation of NK cells in
infant mice, which are prone to viral infection in early life
(33). Endogenous TGF-β modulates
NK cell responses to cytokines and TLR agonists. Downregulated
endogenous TGF-β expression significantly induced NK cells to
produce interferon-gamma (IFN-γ), amplifying the innate immune
response to pathogens (34).
Moreover, TGF-β could also regulate Th17 and Treg cell
differentiation by inducing T cell-related factor forkhead box
protein P3 expression (35). TGF-β
was reported to participate in bacterial infection. Overexpressed
TGF-β in a sepsis mouse model could protect the host from bacterial
infection (36). TLR4, known as a
critical receptor for pathogen-associated molecular patterns, can
be stimulated by lipopolysaccharide from Gram-negative bacteria and
initiate the innate immune defense against bacterial attack
(37). Smad6, one of the inhibitory
SMADs of TGF-β signaling, could inhibit the TLR4 signaling pathway
by disrupting the Pellino-1-mediated TLR4 signaling complex,
leading to anti-inflammatory activity (38). Intriguingly, it was also reported
that miR-4793-3p expressed inversely to TLR4 gene expression in
necrotizing enterocolitis, suggesting that miR-4793-3p may be
associated with the TLR4 pathway (39). The present study proposed that
miR-4793-3p could play a role in the innate immune response as part
of the TGF-β signaling pathway.
To further evaluate the function of miR-4793-3p,
public gene expression data of patients with bacterial-induced
sepsis were obtained from the GEO database (GSE46955). After
analyzing the data, a total of 432 downregulated genes associated
with bacterial infection were obtained. Comparing the potential
target genes of miR-4793-3p and the public gene expression data,
the present study found five genes that were common in two gene
lists, including Grem1, paqr4, canx, msr1 and zadh2. Grem1 encodes
Gremlin-1 protein, which is a member of the bone morphogenic
protein antagonist family. TGF-β stimulates Grem1 expression in
bronchial and kidney epithelial cells, which could promote tissue
fibrosis (40). In a study of
cervical cancer, miR-137 could suppress the TGF-β signaling pathway
by downregulating Grem1(41). These
findings are consistent with the present study, as the expression
of Grem1, Smad2 and Smad3 were upregulated in TGF-β-treated THP-1
cells, suggesting that Grem1 could be a downstream gene of the
TGF-β signaling pathway. In the present study, Grem1 was validated
as a target gene of miR-4793-3p. Overexpressed miR-4793-3p could
reduce Grem1 expression at the mRNA and protein levels. Therefore,
upregulated miR-4793-3p in patients with cirrhosis and bacterial
infection could suppress the TGF-β signaling pathway via binding to
Grem1, which could augment bacteria-induced inflammation and
aggravate infection.
Certain limitations existed in the present study. In
the microarray analysis, the DE miRNA results could be affected by
the small sample size. The hierarchical clustering of the
microarray data showed that one patient with LC and bacterial
infection was assigned to the non-infection group. It could be that
the inter-patient variation was quite high, making the distinction
difficult. However, despite inter-patient variability, the
consistent differential expression effects were detected in the
inferred group. Moreover, not all DE miRNAs were validated by
RT-qPCR in clinical patients, due to a shortage of research
funding. The diagnostic value of miR-4793-3p was analyzed with
non-parametric random forest regression, which also requires large
samples to build a reliable model. Lastly, not all the potential
targeted genes of miR-4793-3p were analyzed in the present study.
Notably, macrophage scavenger receptor 1 (msr1), also known as
class A scavenger receptor (SR-A), is a multifunctional receptor
which is expressed primarily on macrophages (42). It was reported to be associated with
macrophage polarization, the innate immune response to autoimmune
conditions and pathogens-associated molecular patterns (43). Mrs1-deficient mice were susceptible
to pneumococcal pneumonia (44,45).
Meanwhile, the mRNA levels of mrs1 and mannose receptor C type 1
were reduced in influenza virus infection, which could lead to
impairment of macrophage phagocytosis and secondary bacterial
infection (46). Thus, the
association between miR-4793-3p and mrs1 in HBV-related cirrhosis
with bacterial infection requires further investigation.
In the present pilot study, microarray was performed
to detect highly expressed miR-4793-3p in patients with cirrhosis
and bacterial infection. Combined with bioinformatics and public
data analysis, miR-4793-3p was found to participate in the TGF-β
signaling pathway. Functional experiments demonstrated that
miR-4793-3p could negatively regulate the TGF-β pathway via binding
to Grem1. Therefore, miR-4793-3p could be a potential biomarker for
bacterial infection in HBV-related cirrhosis, and it would be
worthy of further investigation.
Supplementary Material
Reverse transcription quantitative PCR
primer sets.
The differentially expressed genes
associated with bacterial infection. The dataset GSE46955 was
downloaded from the Gene Expression Omnibus (GEO), which compared
gene expression between patients with bacterial sepsis and healthy
controls. The parameter of differentially expressed (DE) genes was
defined as a logFC <-1 or >1 with a P-value <0.05. A total
of 432 DE genes were downregulated.
Acknowledgements
Not applicable.
Funding
The present study was supported by the grants of
Middle-aged and Young Talents in Health Science Fostering Project
of Fujian Province, PRC (grant no. 2016-ZQN-77); the Natural
Science Foundation of Fujian Province, PRC (grant no. 2017J01160);
the Key Clinical Specialty Discipline Construction Program of
Fuzhou, Fujian Province, PRC (grant no. 201510301) and the
Infectious Disease Medical Center Construction Program of Fuzhou,
Fujian Province, P.R. China (grant no. 2018080306).
Availability of data and materials
The datasets generated and analyzed during the
current study are available in the GEO repository (https://www.ncbi.nlm.nih.gov/geo/query/acc.cgi?acc=GSE156347).
Authors' contributions
SL and HG designed the study, analyzed the data and
wrote the manuscript. HM, WW and JL recruited the participates and
collected the samples. XW and DZ performed the experiments. ML
analyzed and interpreted the data, revised and edited the
manuscript. All authors read and approved the final manuscript.
Ethics approval and consent to
participate
The present study complied with the Declaration of
Helsinki and was ethically approved by Fujian Medical University
Mengchao Hepatobiliary Hospital (Fuzhou, China). Written informed
consent was obtained from all the participants before sample and
data collection.
Patient consent for publication
Not applicable.
Competing interests
The authors declare that they have no competing
interests.
References
|
1
|
Guidelines WHO; Approved by the Guidelines
Review Committee: In: Guidelines for the Prevention, Care and
Treatment of Persons with Chronic Hepatitis B Infection. World
Health Organization Copyright © World Health Organization 2015.,
Geneva2015.
|
|
2
|
Lesmana LA, Leung NWY, Mahachai V, Phiet
PH, Suh DJ, Yao G and Zhuang H: Hepatitis B: Overview of the burden
of disease in the Asia-Pacific region. Liver Int. 26 (S2):3–10.
2006.
|
|
3
|
Lin X, Robinson NJ, Thursz M, Rosenberg
DM, Weild A, Pimenta JM and Hall AJ: Chronic hepatitis B virus
infection in the Asia-Pacific region and Africa: Review of disease
progression. J Gastroenterol Hepatol. 20:833–843. 2005.PubMed/NCBI View Article : Google Scholar
|
|
4
|
Guan R and Lui HF: Treatment of hepatitis
B in decompensated liver cirrhosis. Int J Hepatol.
2011(918017)2011.urihttps://doi.org/10.4061/2011/918017simplehttps://doi.org/10.4061/2011/918017.
|
|
5
|
Peng CY, Chien RN and Liaw YF: Hepatitis B
virus-related decompensated liver cirrhosis: Benefits of antiviral
therapy. J Hepatol. 57:442–450. 2012.PubMed/NCBI View Article : Google Scholar
|
|
6
|
Bajaj JS, O'Leary JG, Wong F, Reddy KR and
Kamath PS: Bacterial infections in end-stage liver disease: Current
challenges and future directions. Gut. 61:1219–1225.
2012.PubMed/NCBI View Article : Google Scholar
|
|
7
|
Jalan R, Fernandez J, Wiest R, Schnabl B,
Moreau R, Angeli P, Stadlbauer V, Gustot T, Bernardi M, Canton R,
et al: Bacterial infections in cirrhosis: A position statement
based on the EASL Special Conference 2013. J Hepatol. 60:1310–1324.
2014.PubMed/NCBI View Article : Google Scholar
|
|
8
|
Arvaniti V, D'Amico G, Fede G, Manousou P,
Tsochatzis E, Pleguezuelo M and Burroughs AK: Infections in
patients with cirrhosis increase mortality four-fold and should be
used in determining prognosis. Gastroenterology. 139:1246–1256,
e1245. 2010.PubMed/NCBI View Article : Google Scholar
|
|
9
|
Dueck A, Ziegler C, Eichner A, Berezikov E
and Meister G: microRNAs associated with the different human
Argonaute proteins. Nucleic Acids Res. 40:9850–9862.
2012.PubMed/NCBI View Article : Google Scholar
|
|
10
|
Loosen SH, Schueller F, Trautwein C, Roy S
and Roderburg C: Role of circulating microRNAs in liver diseases.
World J Hepatol. 9:586–594. 2017.PubMed/NCBI View Article : Google Scholar
|
|
11
|
Starkey Lewis PJ, Dear J, Platt V, Simpson
KJ, Craig DG, Antoine DJ, French NS, Dhaun N, Webb DJ, Costello EM,
et al: Circulating microRNAs as potential markers of human
drug-induced liver injury. Hepatology. 54:1767–1776.
2011.PubMed/NCBI View Article : Google Scholar
|
|
12
|
DiStefano JK and Gerhard GS: Circulating
microRNAs in nonalcoholic fatty liver disease. Expert Rev
Gastroenterol Hepatol. 10:161–163. 2016.PubMed/NCBI View Article : Google Scholar
|
|
13
|
Migita K, Komori A, Kozuru H, Jiuchi Y,
Nakamura M, Yasunami M, Furukawa H, Abiru S, Yamasaki K, Nagaoka S,
et al: Circulating microRNA profiles in patients with type-1
autoimmune hepatitis. PLoS One. 10(e0136908)2015.PubMed/NCBI View Article : Google Scholar
|
|
14
|
Das K, Garnica O and Dhandayuthapani S:
Modulation of Host miRNAs by intracellular bacterial pathogens.
Front Cell Infect Microbiol. 6(79)2016.PubMed/NCBI View Article : Google Scholar
|
|
15
|
Zhou X, Li X and Wu M: miRNAs reshape
immunity and inflammatory responses in bacterial infection. Signal
Transduct Target Ther. 3(14)2018.PubMed/NCBI View Article : Google Scholar
|
|
16
|
Ma C, Li Y, Li M, Deng G, Wu X, Zeng J,
Hao X, Wang X, Liu J, Cho WC, et al: microRNA-124 negatively
regulates TLR signaling in alveolar macrophages in response to
mycobacterial infection. Mol Immunol. 62:150–158. 2014.PubMed/NCBI View Article : Google Scholar
|
|
17
|
Schulte LN, Eulalio A, Mollenkopf HJ,
Reinhardt R and Vogel J: Analysis of the host microRNA response to
Salmonella uncovers the control of major cytokines by the let-7
family. EMBO J. 30:1977–1989. 2011.PubMed/NCBI View Article : Google Scholar
|
|
18
|
Lutz P, M Haimid M, Pohlmann A, Lehmann J,
Jansen C, Schierwagen R, Klein S, Strassburg CP, Spengler U and
Trebicka J: MicroRNA-155 is upregulated in ascites in patients with
spontaneous bacterial peritonitis. Sci Rep. 7(40556)2017.PubMed/NCBI View Article : Google Scholar
|
|
19
|
Sarin SK, Kumar M, Lau GK, Abbas Z, Chan
HL, Chen CJ, Chen DS, Chen HL, Chen PJ, Chien RN, et al:
Asian-Pacific clinical practice guidelines on the management of
hepatitis B: A 2015 update. Hepatol Int. 10:1–98. 2016.PubMed/NCBI View Article : Google Scholar
|
|
20
|
Shiha G, Sarin SK, Ibrahim AE, Omata M,
Kumar A, Lesmana LA, Leung N, Tozun N, Hamid S, Jafri W, et al:
Jury of the APASL Consensus Development Meeting 29 January 2008 on
Liver Fibrosis With Without Hepatitis B or C: Liver fibrosis:
Consensus recommendations of the Asian Pacific Association for the
Study of the Liver (APASL). Hepatol Int. 3:323–333. 2009.PubMed/NCBI View Article : Google Scholar
|
|
21
|
Bolstad BM, Irizarry RA, Åstrand M and
Speed TP: A comparison of normalization methods for high density
oligonucleotide array data based on variance and bias.
Bioinformatics. 19:185–193. 2003.PubMed/NCBI View Article : Google Scholar
|
|
22
|
Livak KJ and Schmittgen TD: Analysis of
relative gene expression data using real-time quantitative PCR and
the 2(-Delta Delta C(T)) Method. Methods. 25:402–408.
2001.PubMed/NCBI View Article : Google Scholar
|
|
23
|
Agarwal V, Bell GW, Nam JW and Bartel DP:
Predicting effective microRNA target sites in mammalian mRNAs.
eLife 42015.
|
|
24
|
Liu W and Wang X: Prediction of functional
microRNA targets by integrative modeling of microRNA binding and
target expression data. 20: 18, 2019.
|
|
25
|
Yu G, Wang LG, Han Y and He QY:
clusterProfiler: An R package for comparing biological themes among
gene clusters. OMICS. 16:284–287. 2012.PubMed/NCBI View Article : Google Scholar
|
|
26
|
Shalova IN, Lim JY, Chittezhath M,
Zinkernagel AS, Beasley F, Hernández-Jiménez E, Toledano V,
Cubillos-Zapata C, Rapisarda A, Chen J, et al: Human monocytes
undergo functional re-programming during sepsis mediated by
hypoxia-inducible factor-1α. Immunity. 42:484–498. 2015.PubMed/NCBI View Article : Google Scholar
|
|
27
|
Atri C, Guerfali FZ and Laouini D: Role of
human macrophage polarization in inflammation during infectious
diseases. Int J Mol Sci. 19(1801)2018.PubMed/NCBI View Article : Google Scholar
|
|
28
|
Zhang F, Wang H, Wang X, Jiang G, Liu H,
Zhang G, Wang H, Fang R, Bu X, Cai S, et al: TGF-β induces M2-like
macrophage polarization via SNAIL-mediated suppression of a
pro-inflammatory phenotype. Oncotarget. 7:52294–52306.
2016.PubMed/NCBI View Article : Google Scholar
|
|
29
|
Song X, Xie S, Lu K and Wang C:
Mesenchymal stem cells alleviate experimental asthma by inducing
polarization of alveolar macrophages. Inflammation. 38:485–492.
2015.PubMed/NCBI View Article : Google Scholar
|
|
30
|
Saha B, Kodys K, Szabo G and Hepatitis C:
Hepatitis C virus-induced monocyte differentiation into polarized
M2 macrophages promotes stellate cell activation via TGF-β. Cell
Mol Gastroenterol Hepatol. 2:302–316.e8. 2016.PubMed/NCBI View Article : Google Scholar
|
|
31
|
ischer P, Grigoras C, Bugariu A,
Nicoara-Farcau O, Stefanescu H, Benea A, Hadade A, Margarit S,
Sparchez Z, Tantau M, Ionescu D and Procopet B: Are presepsin and
resistin better markers for bacterial infection in patients with
decompensated liver cirrhosis? Dig Liver Dis. 51:1685–1691.
2019.PubMed/NCBI View Article : Google Scholar
|
|
32
|
Johnston CJ, Smyth DJ, Dresser DW and
Maizels RM: TGF-β in tolerance, development and regulation of
immunity. Cell Immunol. 299:14–22. 2016.PubMed/NCBI View Article : Google Scholar
|
|
33
|
Marcoe JP, Lim JR, Schaubert KL,
Fodil-Cornu N, Matka M, McCubbrey AL, Farr AR, Vidal SM and Laouar
Y: TGF-β is responsible for NK cell immaturity during ontogeny and
increased susceptibility to infection during mouse infancy. Nat
Immunol. 13:843–850. 2012.PubMed/NCBI View
Article : Google Scholar
|
|
34
|
Meadows SK, Eriksson M, Barber A and
Sentman CL: Human NK cell IFN-gamma production is regulated by
endogenous TGF-beta. Int Immunopharmacol. 6:1020–1028.
2006.PubMed/NCBI View Article : Google Scholar
|
|
35
|
Dong C: TH17 cells in development: An
updated view of their molecular identity and genetic programming.
Nat Rev Immunol. 8:337–348. 2008.PubMed/NCBI View Article : Google Scholar
|
|
36
|
Lee YS, Park JS, Jung SM, Kim SD, Kim JH,
Lee JY, Jung KC, Mamura M, Lee S, Kim SJ, et al: Inhibition of
lethal inflammatory responses through the targeting of
membrane-associated Toll-like receptor 4 signaling complexes with a
Smad6-derived peptide. EMBO Mol Med. 7:577–592. 2015.PubMed/NCBI View Article : Google Scholar
|
|
37
|
Park BS and Lee JO: Recognition of
lipopolysaccharide pattern by TLR4 complexes. Exp Mol Med.
45(e66)2013.PubMed/NCBI View Article : Google Scholar
|
|
38
|
Choi KC, Lee YS, Lim S, Choi HK, Lee CH,
Lee EK, Hong S, Kim IH, Kim SJ and Park SH: Smad6 negatively
regulates interleukin 1-receptor-Toll-like receptor signaling
through direct interaction with the adaptor Pellino-1. Nat Immunol.
7:1057–1065. 2006.PubMed/NCBI View
Article : Google Scholar
|
|
39
|
Ng PC, Chan KY, Leung KT, Tam YH, Ma TP,
Lam HS, Cheung HM, Lee KH, To KF and Li K: Comparative MiRNA
Expressional profiles and molecular networks in human small bowel
tissues of necrotizing enterocolitis and spontaneous intestinal
perforation. PLoS One. 10(e0135737)2015.PubMed/NCBI View Article : Google Scholar
|
|
40
|
Staloch D, Gao X, Liu K, Xu M, Feng X,
Aronson JF, Falzon M, Greeley GH, Rastellini C, Chao C, et al:
Gremlin is a key pro-fibrogenic factor in chronic pancreatitis. J
Mol Med (Berl). 93:1085–1093. 2015.PubMed/NCBI View Article : Google Scholar
|
|
41
|
Miao H, Wang N, Shi LX, Wang Z and Song
WB: Overexpression of mircoRNA-137 inhibits cervical cancer cell
invasion, migration and epithelial-mesenchymal transition by
suppressing the TGF-β/smad pathway via binding to GREM1. Cancer
Cell Int. 19(147)2019.PubMed/NCBI View Article : Google Scholar
|
|
42
|
Mori T, Takahashi K, Naito M, Kodama T,
Hakamata H, Sakai M, Miyazaki A, Horiuchi S and Ando M: Endocytic
pathway of scavenger receptors via trans-Golgi system in bovine
alveolar macrophages. Lab Invest. 71:409–416. 1994.PubMed/NCBI
|
|
43
|
Xu Z, Xu L, Li W, Jin X, Song X, Chen X,
Zhu J, Zhou S, Li Y, Zhang W, et al: Innate scavenger receptor-A
regulates adaptive T helper cell responses to pathogen infection.
Nat Commun. 8(16035)2017.PubMed/NCBI View Article : Google Scholar
|
|
44
|
Thomas CA, Li Y, Kodama T, Suzuki H,
Silverstein SC and El Khoury J: Protection from lethal
gram-positive infection by macrophage scavenger receptor-dependent
phagocytosis. J Exp Med. 191:147–156. 2000.PubMed/NCBI View Article : Google Scholar
|
|
45
|
Arredouani MS, Yang Z, Imrich A, Ning Y,
Qin G and Kobzik L: The macrophage scavenger receptor SR-AI/II and
lung defense against pneumococci and particles. Am J Respir Cell
Mol Biol. 35:474–478. 2006.PubMed/NCBI View Article : Google Scholar
|
|
46
|
Wang J, Nikrad MP, Travanty EA, Zhou B,
Phang T, Gao B, Alford T, Ito Y, Nahreini P, Hartshorn K, et al:
Innate immune response of human alveolar macrophages during
influenza A infection. PLoS One. 7(e29879)2012.PubMed/NCBI View Article : Google Scholar
|