Introduction
Liver cancer is one of the commonest malignant
tumors worldwide. In 2018, the estimated global incidence was
~841,000, with ~782,000 related deaths, while the incidence in
China accounts for ~55%, with 110,000 deaths every year (1-3).
Currently, there are a variety of treatment options for liver
cancer at different stages, including routine options (such as
hepatectomy and transcatheter arterial chemoembolization),
molecular targeted therapy (VEGF/VEGF monoclonal antibody, EGF
receptor inhibitors) and immunotherapy (programmed
death-1/programmed death-ligand 1), which can prolong the survival
time and prognosis of some patients (4-6).
However, due to the selection of indications, sensitivity to
treatment and other reasons, most patients have not received
effective treatment. Therefore, it is important to explore the
mechanism of proliferation, invasion and metastasis of liver
cancer. In recent years, research on PKN1 in tumors has attracted
much attention and PKN1 has been reported as a promising
therapeutic target for prostate cancer (7,8).
However, the role of PKN1 in liver cancer remains to be
elucidated.
PKN1, also known as PKC-related protein 1, is a
serine/threonine protein kinase belonging to the PKC superfamily
(9). It is reported that PKN1 may
participate in cytoskeletal reconstruction, cell adhesion,
apoptosis, tumor cells and other life processes (10-12).
Overexpression of PKN1 serves an important role in the development
of neurodegenerative diseases, prostate cancer, ovarian cancer,
endometrial cancer and other tumors (9,13-16).
PKN1 contains a unique regulatory domain in the amino terminus,
which presents a loop of serine/threonine protein kinase that
serves a key role in activation of PKN1. PKN1 can act upstream of
mitogen-activated PKs, C-Jun N-terminal kinase and p38, or
downstream of EGF signaling and TGF-β (12,16,17).
Activated PKN1 regulates the invasion of prostate cancer cells and
phosphorylation of p38, which further regulates a signaling cascade
of invasion-related genes PXN, NEDD9 and NT5E/CD73(8). Yang et al (18) demonstrated that PKN1, as an
important member of PI3K/AKT/mTOR signaling pathway, affects the
differentiation of prostate adenocarcinoma cells and is closely
associated with Gleason score. Inhibition of PKN1 blocks
transcriptional activation in androgen-dependent cancer cells
(7). In endometrial cancer cells,
PKN1 modulates TGF-β and EGF-dependent regulation of cell
proliferation, migration and invasiveness and therefore is a
component of the network signaling downstream of TGF-β and EGF
(15). James et al (19) demonstrated that inhibition of PKN1
expression stimulates apoptosis in malignant melanoma cells by
regulating the WNT/β-catenin pathway.
In the present study, the expression of PKN1 in
surgical specimens was investigated by immunohistochemistry and the
correlation with VEGF, MVD, Ki67 index and clinicopathological
parameters was analyzed. At the same time, the effects of PKN1 on
the proliferation, invasion and apoptosis of liver cancer cells
were detected in vitro and the role of PKN1 in liver cancer
progression was further explored.
Materials and methods
Patients and specimens
A total of 36 patients with hepatocellular carcinoma
(HCC) who were treated at Binzhou Medical University Hospital were
enrolled. Patients who had received preoperative radiotherapy or
chemotherapy or had tumors of other sites were excluded. Complete
clinical and pathological data were recorded and hepatectomy
specimens were collected by the Pathology Department of the
Hospital. There were 27 males and 9 female patients, with a mean
age of 58.8±9.6 years (range 36-77 years). The study was approved
by the Ethics Committee of Binzhou Medical University (Yantai,
China; approval no. 2018-012) as required by the Declaration of
Helsinki. Prior to sample collection, written consent to use their
tissues was obtained from all patients.
The present study is a retrospective study and all
36 patients had single lesions, including 13 in the left hepatic
lobe and 23 in the right hepatic lobe, and adjacent normal tissue
was also obtained from the patients. The longest diameter ranged
from 2 cm to 13 cm, with an average of 6.6±3.4 cm (<6.6 cm in 23
cases and ≥6.6 cm in 13 cases). Histological grading of HCC was
divided into well-differentiated (grade I; n=7), moderately
differentiated (grade II and III; n=21) and poorly differentiated
(grade IV; n=8) according to Edmondson-Steiner grading system
(20,21).
Immunohistochemistry
All samples of pathological specimens were fixed in
4% paraformaldehyde for 24 h at room temperature, followed by
gradient dehydration and paraffin embedding; 4-µm sections were
prepared for immunohistochemical staining. The sections were
incubated with 0.01 mol/l citrate buffer (pH 6.0) in a microwave
oven at 98˚C, three times for 5 min, for antigen retrieval.
Endogenous peroxidase was blocked by treatment with 3%
H2O2 for 20 min at room temperature. After
pretreatment with normal goat serum (OriGene Technologies, Inc.)
for 30 min at room temperature to block nonspecific binding, the
sections were incubated with rabbit anti-PKN1 polyclonal antibody
(cat. no. bs-7478R; BIOSS; 1:500), rabbit anti-VEGF polyclonal
antibody (cat. no. 190031; ProteinTech Group, Inc.; 1:500) and
rabbit anti-Ki67 ready-to use antibody (cat. no. ZM-0167; OriGene
Technologies, Inc.; 1:100) and rabbit anti cluster of
differentiation (CD)34 ready-to use antibody (cat. no. ZM-0046;
OriGene Technologies, Inc.) overnight at 4˚C. Negative control was
obtained by replacing the primary antibody with phosphate-buffered
saline. Biotinylated goat anti-rabbit immunoglobulin G (cat. no.
ZB-2301; OriGene Technologies, Inc.; 1:500) was applied as a
secondary antibody for 30 min at 37˚C. The peroxidase reactivity
was visualized by the application of 3,3'-diaminobenzidine solution
(OriGene Technologies, Inc.) for 5 min. Finally, the sections were
counterstained with hematoxylin for 2 min at room temperature.
The necrotic area and severe inflammatory area were
avoided in the selection of liver cancer specimens and significant
areas of expression were selected for analysis. The
immunoreactivity of PKN1 and VEGF was evaluated according to
integral optical density (IOD) by Image-Pro Plus 6.0 (Media
Cybernetics, Inc.). Ki67 proliferation index was calculated with
Image Pro Plus 6.0 as follows: Ki67 (%)=positive tumor cells/all
tumor cells x100%. MVD was marked by CD34 (a classic endothelium
marker). The mean number of stained microvessels was recorded from
five unduplicated high-power fields (magnification, x400) per
specimen.
Cells culture and reagents
The human liver cancer cell lines (HepG2 and Hep3B)
were purchased from the cell banks of the Chinese Academy of
Science and were cultured in Dulbecco's modified Eagle medium
(DMEM) with high glucose (HyClone; Cytiva) and 10% fetal bovine
serum (FBS; Gibco; Thermo Fisher Scientific, Inc.) at 37˚C in a
humidified atmosphere with 5% CO2. Then, three siRNAs
against PKN1 were designed (19)
and synthesized by Shanghai GenePharma Co., Ltd.: siPKN1-1:
5'-CCUCGAAGAUUUCAAGUUC-3'; siPKN1-2:
5'-GAACAUGAUCCAGACCUACAGCAAU-3'; siPKN1-3:
5'-ACAGUAAGACCAAGAUUGA-3'; and Negative control (NC) group
5'-UUCUCCGAACGUGUCACGUTT-3'. HepG2 and Hep3B cells were seeded in
six-well plates and transfected with 100 pmol siRNA using
Lipofectamine® 2000 (Thermo Fisher Scientific, Inc.).
PKN1 expression was detected using western blotting to confirm
transfection efficiency. Of the three siRNAs, the two more
efficient silencing sequences were selected for the following
assays.
Reverse transcription-quantitative
(RT-q) PCR
Total RNA (24 h after transfection) of liver cancer
cells was isolated with RNAiso plus reagent (Takara Biotechnology
Co., Ltd.) and cDNA was generated with a PrimeScript RT Reagent kit
with gDNA Eraser (Takara Biotechnology Co., Ltd.). Quantitative
gene expression was performed for PKN1 and GAPDH (internal control)
by LightCycler 480 SYBR-Green I Master Mix Reagent kit and the
LightCycler 480 real-time System (Roche Diagnostics). Nucleotide
sequences of specific primer for genes were as follows: PKN1
forward, 5'-AAAGCAGAAGCCGAGAACAC-3' and reverse,
5'-ACACAGCCAACTCCAGTTCC-3'; GAPDH forward,
5'-GAAGGTGAAGGTCGGAGTC-3' and reverse, 5'-GAAGATGGTGATGGGATTTC-3'.
PCR amplification was performed under the following conditions:
Initial denaturation for 10 min at 96˚C, followed by 40 cycles at
95˚C for 15 sec and 60˚C for 60 sec. For each sample, the data was
normalized to GAPDH to obtain ΔCt and
calculated using the 2-ΔΔCq method (22). Gene silencing rate
(%)=(1-2ΔΔCq) x100%.
Western blotting
Cellular proteins were collected 72 h after
transfection and lysed with RIPA lysis buffer and
phenylmethanesulfonyl fluoride (Beyotime Institute of
Biotechnology). A BCA Protein Assay kit (cat. no. P0010; Beyotime
Institute of Biotechnology) was used to detect protein
concentration. Protein samples (40 µg/lane) were separated by 12%
SDS-PAGE and transferred to polyvinylidene fluoride membranes.
Membranes were blocked with 5% skimmed milk in TBST buffer (TBS
with 0.1% Tween-20) for 2 h at room temperature to avoid
non-specific staining, then incubated with primary antibody
overnight at 4˚C and HRP-conjugated secondary antibodies (cat. no.
ZB-2301; OriGene Technologies, Inc.; 1:50,000) for 30 min at 37˚C.
Primary antibodies used were as follows: PKN1 (cat. no. ab231038;
Abcam; 1:500) and GAPDH (cat. no. sc-25778; Santa Cruz
Biotechnology, Inc.; 1:5,000). Protein bands were visualized by
enhanced ECL chemiluminescence (Beyotime Institute of
Biotechnology). IOD values were measured with the Image-Pro Plus
6.0 system (Media Cybernetics, Inc.).
Cell proliferation assay
Proliferation of HepG2 and Hep3B cells was detected
using Cell Counting Kit-8 (CCK-8; Biosharp Life Sciences). Cells
were seeded in a 96-well plate at a density of 5x10³
cells/well and incubated for 0, 24 and 48 h. Cells were incubated
for 1 h and OD at 450 nm was measured using an automatic
spectrophotometer (SpectraMax M2; Molecular Devices, LLC). Cell
viability was calculated based on OD values using the following
equation: Cell viability=ODtest group/ODcontrol
group x100%. Experiments were performed in triplicate.
Colony formation assay
HepG2 and Hep3B cells were seeded into six-well
plates (5x10³ cells/well) at 24 h after transfection and
incubated with 10% FBS DMEM for 10 days. Cells were stained with
0.1% crystal violet staining solution (G1064; Solarbio) for 20 min
and the number of colonies with >50 cells counted. Colony
formation rate (%)=colony numbers/seeded cells x100%. Five random
unduplicated fields were analyzed for each well and each experiment
was performed in triplicate.
Wound scratch assay
Cells (5x10⁵) were seeded in six-well
plates and cultured for 24 h at 37˚C with 5% CO2.
Mitomycin C (10 µg/ml) was added for 1 h before processing to
eliminate the effect of cell proliferation. Horizontal lines were
scratched with 20-µl pipette tips and the wells were washed three
times with PBS to remove the scratched-out cells at room
temperature, then incubated with 1% FBS DMEM at 37˚C with 5%
CO2 (1). Images were
captured at 0, 12 and 24 h and measured the scratch healing ability
of the cells with an Image-Pro Plus 6.0 system. Each experiment was
performed in triplicate.
Cell invasion assay
Transwell chambers with 8-mm pores (Corning Inc.)
were used to detect cell invasion ability. In the upper chambers,
5x10⁴ cells were resuspended in 200 µl serum-free DMEM
after Matrigel was coated at the bottom of the upper portion at 4˚C
and incubated at 37˚C for 2 h. The lower portion of the chamber
contained 500 µl 10% FBS DMEM. The cells were cultured at 37˚C in
5% CO2 for 24 h. Cells traversing the Matrigel were
fixed in 95% anhydrous methanol for 15 min at room temperature,
air-dried for 10 min and stained with 0.1% crystal violet (Beijing
Solarbio Science & Technology Co., Ltd.) for 20 min at room
temperature. Each experiment was performed in triplicate.
Apoptosis assay
The Annexin V method was used to detect apoptosis.
Cells were collected by trypsin digestion at 48 h after
transfection. A suspension of 1x10⁶ cells/ml was made by
1X Binding Buffer. Next, 5 µl Annexin V-fluorescein isothiocyanate
was added, followed by 5 µl propidium iodide for 15 min in the dark
at room temperature. Fluorescence signals from at least 10,000
cells were evaluated using a flow cytometer (EPICS XL; Beckman
Coulter, Inc.). FACSDiva version 6.1.3 software (BD Biosciences)
was used to analyze and generated percentages in all of the
quadrants. The mean percentage of apoptosis rate (early + late
apoptotic cells) and standard deviation were calculated from three
repeated assays.
Statistical analysis
All data were analyzed with SPSS 22.0 software (IBM
Corp.). The values are presented as the mean ± standard deviation.
Tukey's post hoc test was performed following one-way ANOVA to
analyze statistically the mean values among multiple groups and
Student's t test was used to compare the differences between two
groups. Spearman rank test was used to verify the correlations.
P<0.05 was considered to indicate a statistically significant
difference. GraphPad Prism version 5 (GraphPad Software) was used
for charts.
Results
Correlation of PKN1 expression with
VEGF, Ki67, MVD and clinicopathological parameters in HCC
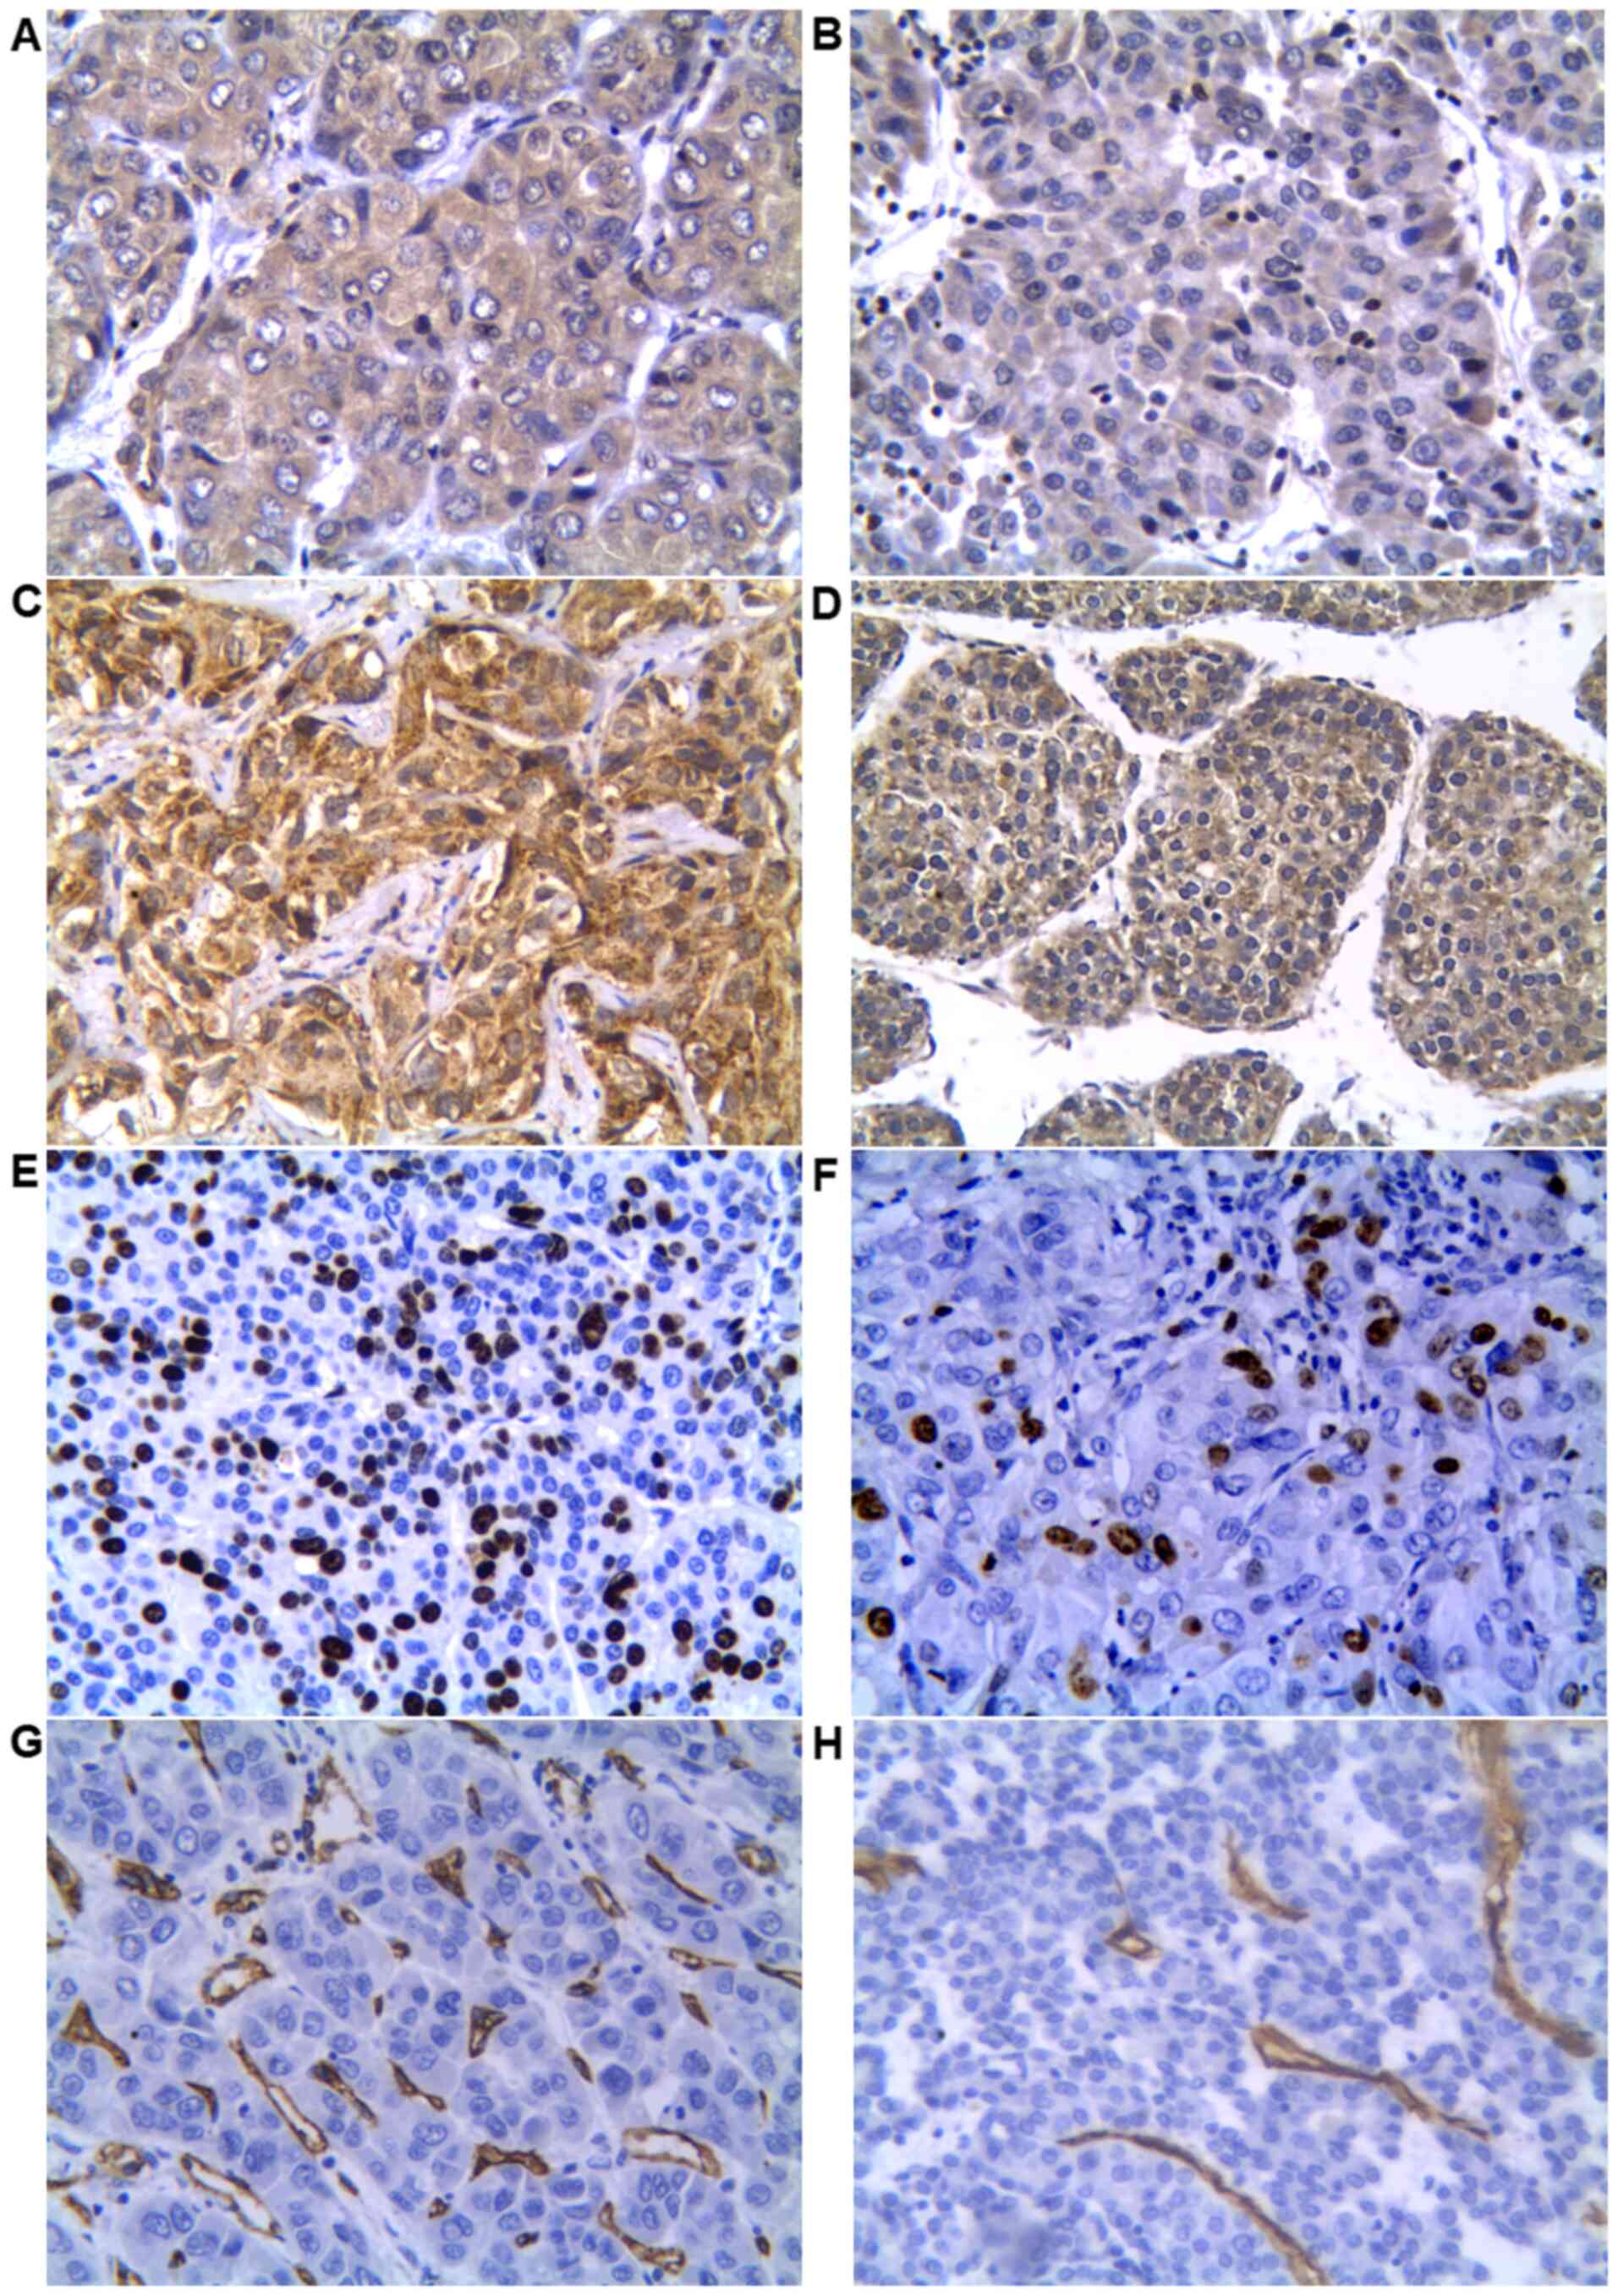
The immunoreactivity of PKN1, VEGF, Ki67 and CD34 in
all 36 HCC specimens was tested and expression was analyzed with
Image Pro Plus 6.0. No significant differences were observed in
patients' sex, age, or tumor location and size in PKN1, VEGF, Ki67
and MVD (P>0.05; Table I). PKN1
was expressed in all HCC tissues (Fig.
1A and B) and its expression
was positively correlated with tumor histological grading, while
PKN1 expression in adjacent normal tissue was very weak. The IOD of
PKN1 in moderately and poorly differentiated HCC was significantly
higher compared with highly differentiated HCC (P<0.01), but no
significant difference was observed between moderately and poorly
differentiated HCC (P>0.05). The expression of VEGF in
moderately and poorly differentiated HCC was significantly higher
compared with highly differentiated tumor (P<0.05), which was in
accordance with PKN1 expression (Fig.
1C and D). Correlation analysis
of PKN1, VEGF, Ki67 expression and MVD in HCC demonstrated that
expression of PKN1 was positively correlated with Ki67 (P<0.01;
r=0.493) and MVD (P<0.01; r=0.442), and the
expression of Ki67 (Fig. 1E and
F) was positively correlated with
MVD (Fig. 1G and H; P<0.01; r=0.445; Table II).
 | Table ICorrelation of expression of PKN1,
VEGF, Ki67 and MVD with clinicopathological parameters in HCC. |
Table I
Correlation of expression of PKN1,
VEGF, Ki67 and MVD with clinicopathological parameters in HCC.
| Feature | n | PKN1, IOD | VEGF, IOD | MVD, microvessel
number | Ki67 rate, %, |
|---|
| Age | | | | | |
|
<59 | 16 |
39,972.39±12,397.59 |
52,774.82±10,833.22 | 21.89±7.81 | 35.86±13.52 |
|
≥59 | 20 |
33,338.48±12,097.38 |
52,392±12,905.93 | 20.87±5.16 | 32.57±15.95 |
| Sex | | | | | |
|
Male | 27 |
36,516.58±12,886.37 |
53,665.35±12,464.26 | 21.66±6.53 | 34.95±15.97 |
|
Female | 9 |
35,597.82±12,010.71 |
49,252.54±9,718.765 | 20.33±6.21 | 31.31±10.92 |
| Tumor location | | | | | |
|
Left
lobe | 13 |
34,161.05±10,294.14 |
51,360.11±14,249.16 | 19.57±7.24 | 30.29±12.07 |
|
Right
lobe | 23 |
37,488.45±13,674.28 |
53,241.56±10,575.52 | 22.32±5.79 | 36.15±16.02 |
| Tumor size | | | | | |
|
<6.6
cm | 23 |
35,465.07±11,013.2 |
54,168.92±12,992.34 | 22.05±6.76 | 36.31±14.26 |
|
≥6.6 cm | 13 |
37,740.88±15,181.86 |
49,719.4±9,346.68 | 20.04±5.70 | 30.02±15.47 |
| Histological
grading | | | | | |
|
Highly | 7 |
23,094.83±8,535.475 |
42,483.76±9,727.804 | 14.39±7.93 | 21.56±4.77 |
|
Moderately | 21 |
39,205.88±11,414.21b |
53,875.5±10,686.89a |
22.74±4.79b |
34.42±14.71a |
|
Poorly | 8 |
40,167.58±11,444.56b |
57,933.17±12,515.03a |
23.68±4.91a |
43.95±13.80b |
| Table IICorrelation analysis of the
expression of PKN1, VEGF, Ki67 and MVD in HCC. |
Table II
Correlation analysis of the
expression of PKN1, VEGF, Ki67 and MVD in HCC.
| | PKN1 | VEGF | MVD | Ki67 |
|---|
| PKN1 | | | | |
|
P-value | / | 0.128 |
0.007b |
0.002b |
|
r | / | 0.258 | 0.442 | 0.493 |
| VEGF | | | | |
|
P-value | 0.128 | / | 0.236 | 0.36 |
|
r | 0.258 | / | 0.203 | 0.157 |
| MVD | | | | |
|
P-value |
0.007b | 0.236 | / |
0.007b |
|
r | 0.442 | 0.203 | / | 0.445 |
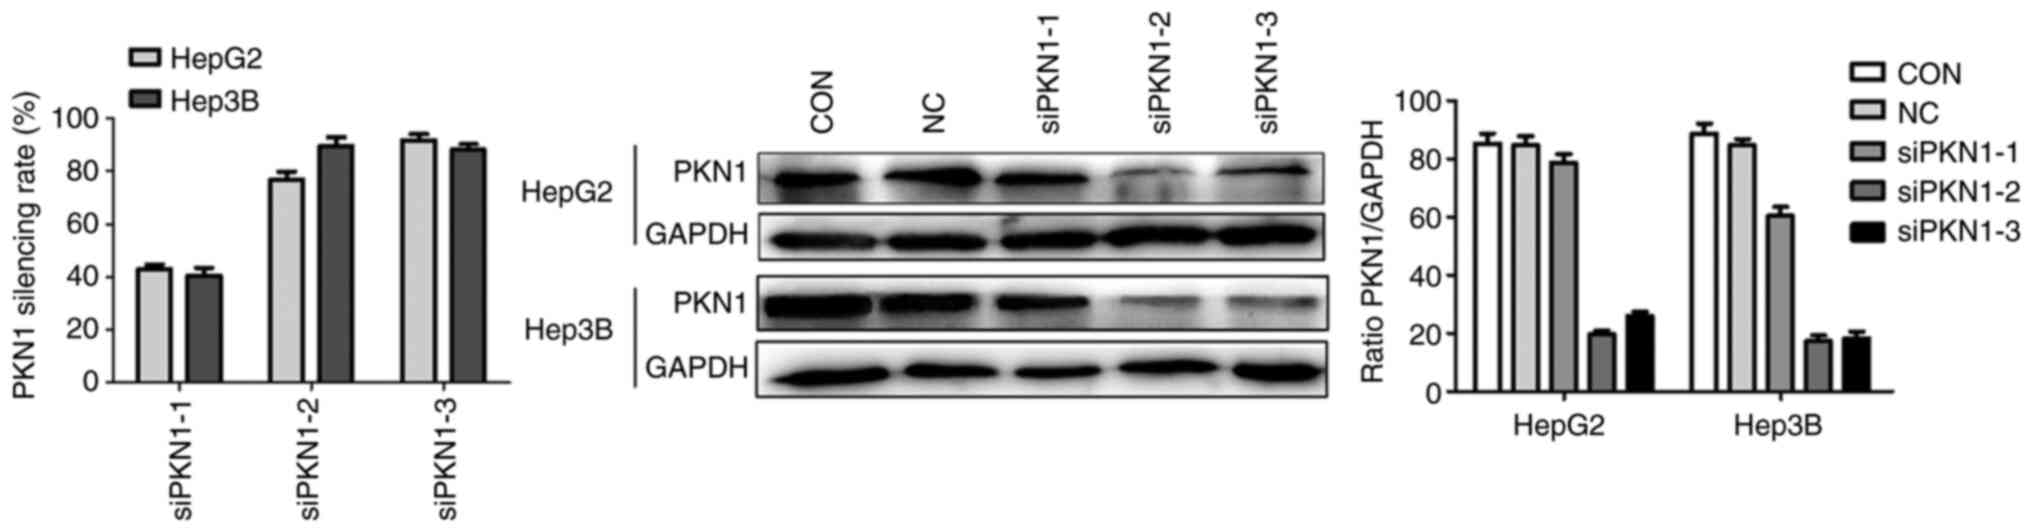
Acquisition of efficient silencing
sequence
According to RT-qPCR (24 h after transfection), the
efficient silencing sequences were siPKN1-2 and siPKN1-3, with a
rate of gene silencing of >75%. Western blotting demonstrated
that expression of PKN1 (72 h after transfection) was downregulated
in the siPKN1-2 and siPKN1-3 groups (Fig. 2). Thus, two different efficient
silencing sequences (siPKN1-2 and siPKN1-3) were confirmed to
explore the following biological function of PKN1 in liver cancer
cells.
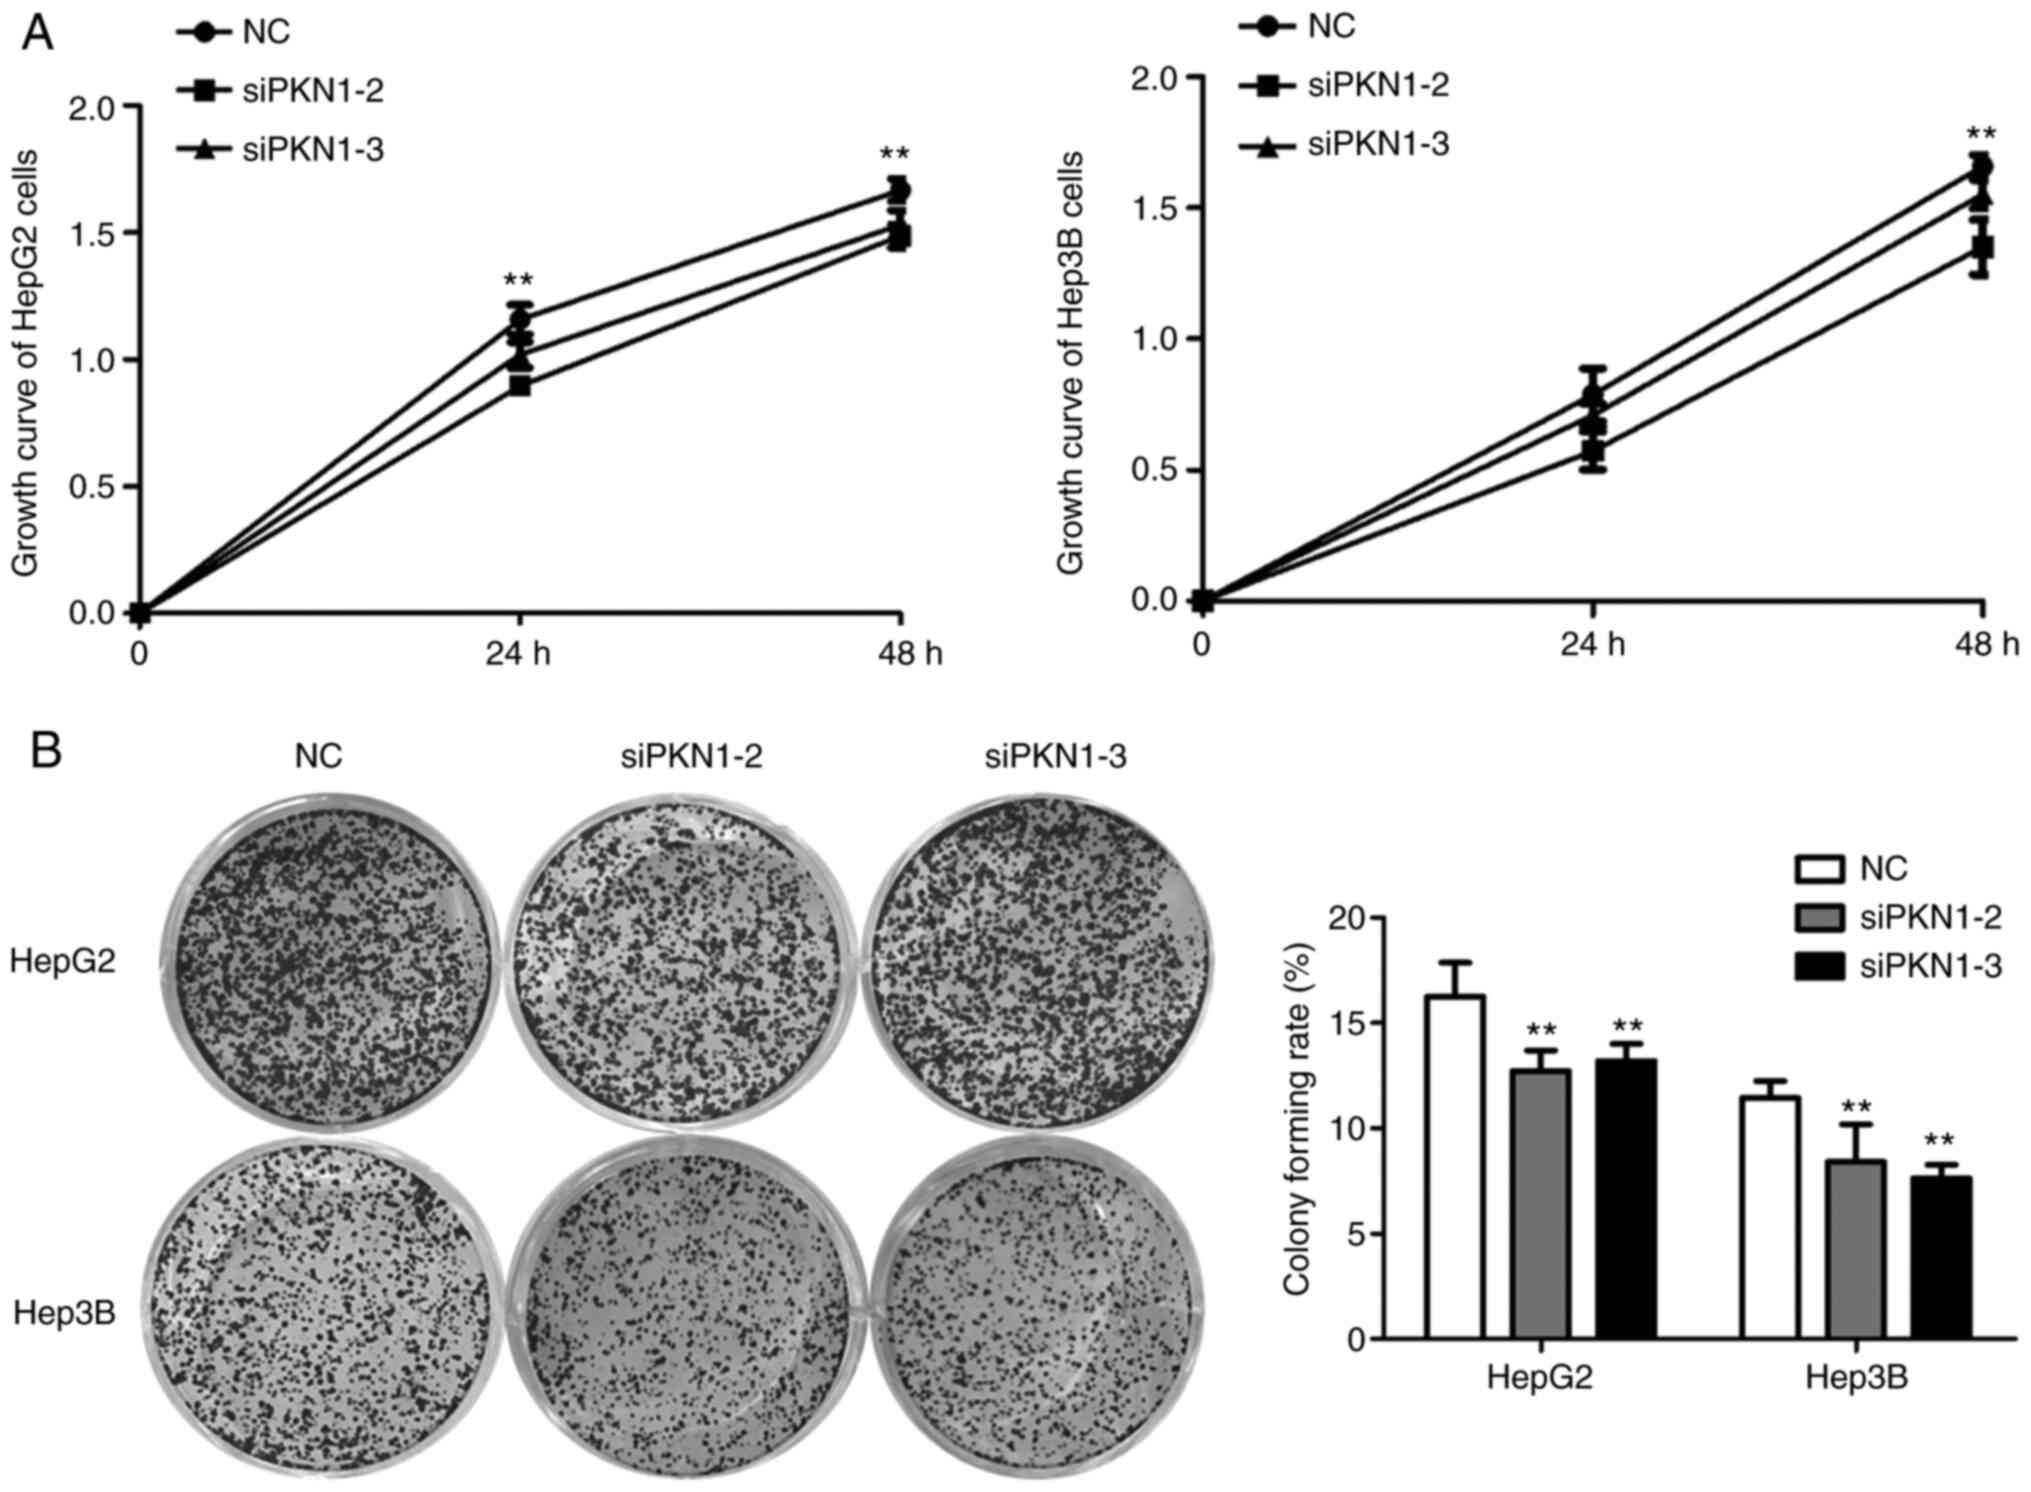
Downregulated PKN1 expression
suppresses proliferation of liver cancer cells
CCK-8 assay demonstrated that OD of HepG2 and Hep3B
cells after transfection were significantly suppressed compared
with the NC group, particularly at 48 h after transfection
(P<0.01; Fig. 3A). The colony
formation assay demonstrated that downregulation of PKN1 in HepG2
and Hep3B cells inhibited the number of colonies (P<0.01;
Fig. 3B). These results indicated
that downregulation of PKN1 expression suppresses viability and
proliferation of liver cancer cells.
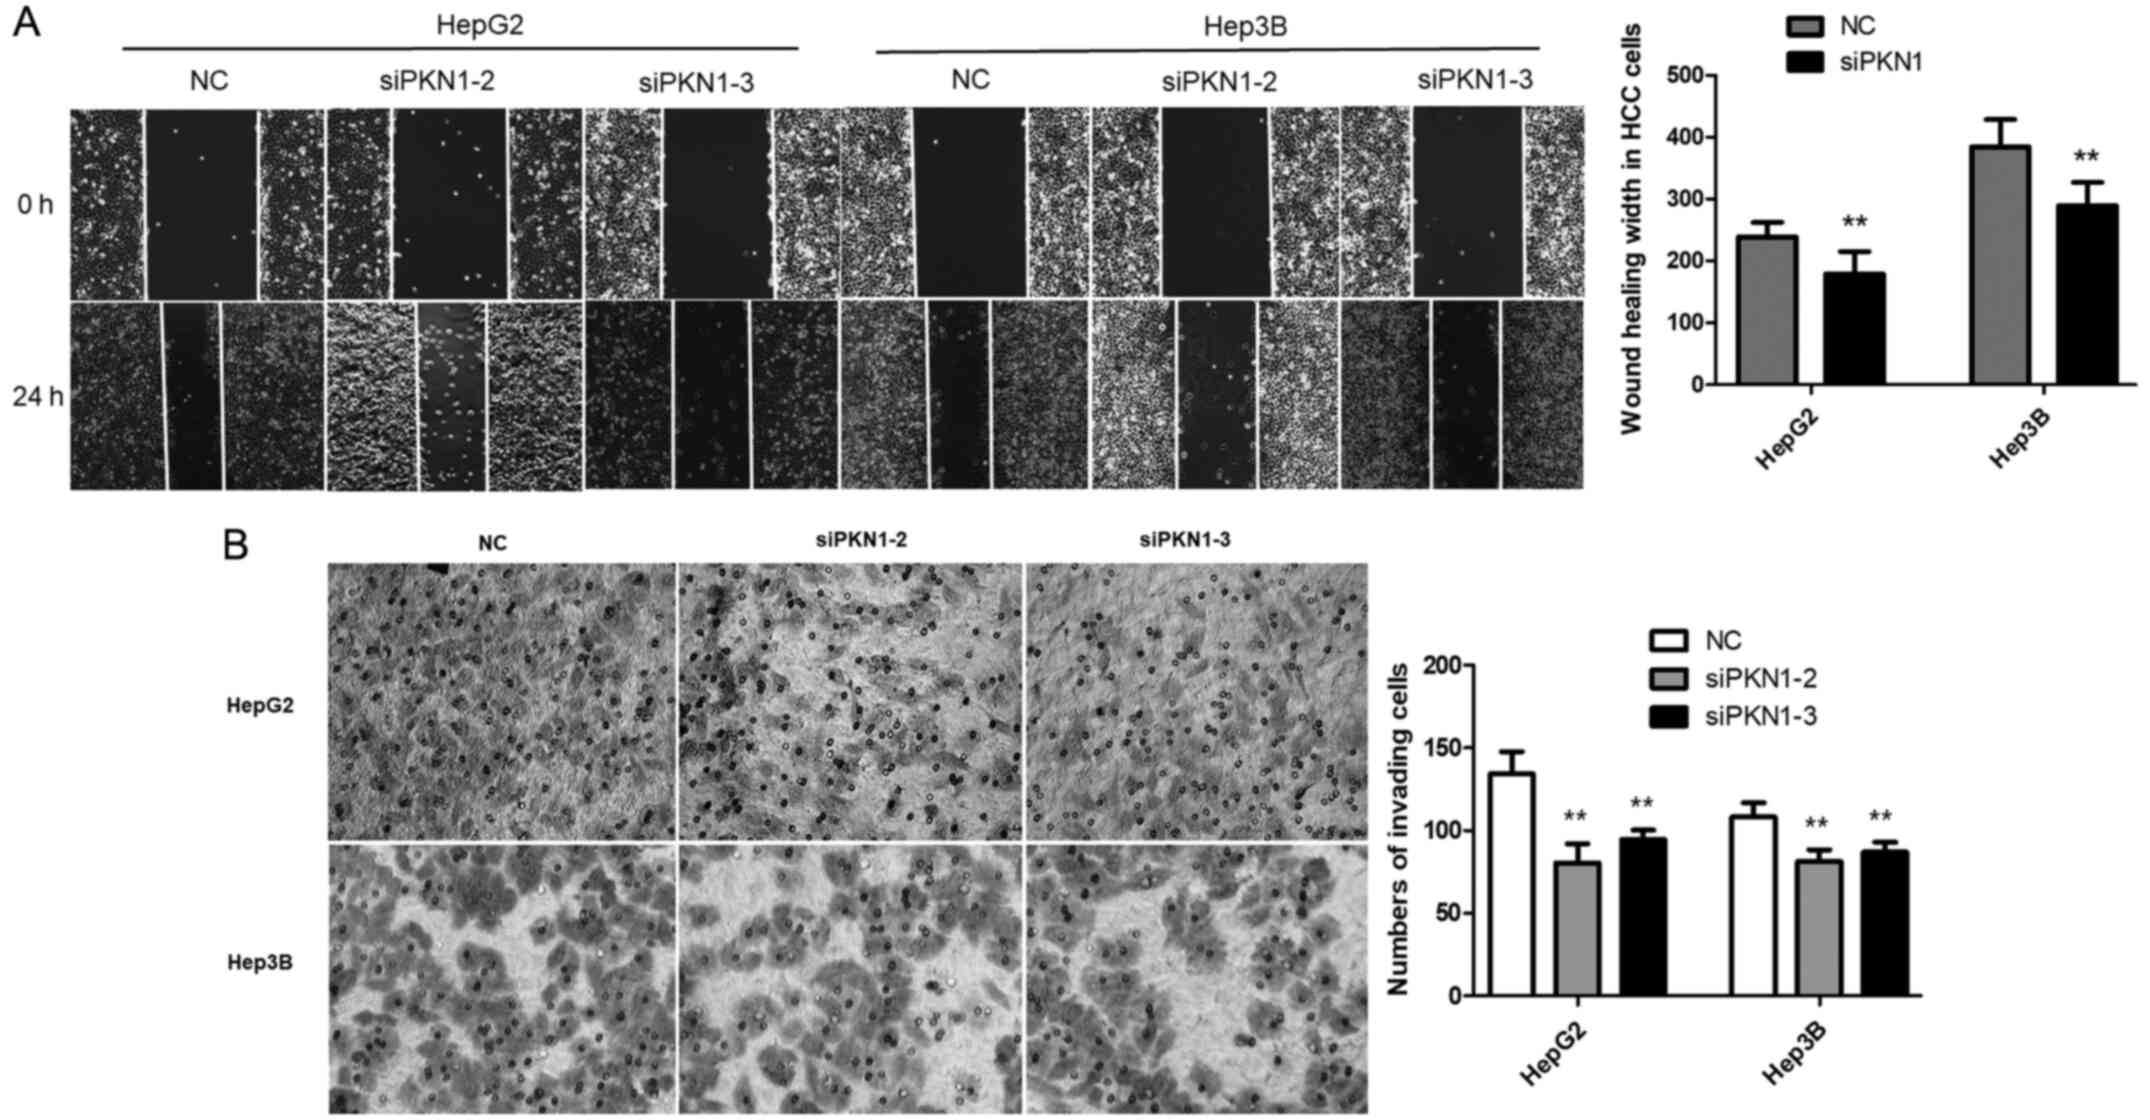
Downregulated PKN1 expression inhibits
migration and invasion of liver cancer cells
To investigate the effects of PKN1 on migration and
invasion of liver cancer cells, a wound scratch assay and Transwell
invasion assay were performed. The wound scratch assay revealed
that cell healing in the siPKN1 group was significantly slower
compared with the NC group at 24 h after transfection (P<0.01;
Fig. 4A). The Transwell invasion
assay demonstrated that downregulation of PKN1 significantly
reduced invasion of HepG2 and Hep3B cells across the Matrigel
(P<0.01; Fig. 4B). These results
suggest that PKN1 knockdown inhibits migration and invasion of
liver cancer cells.
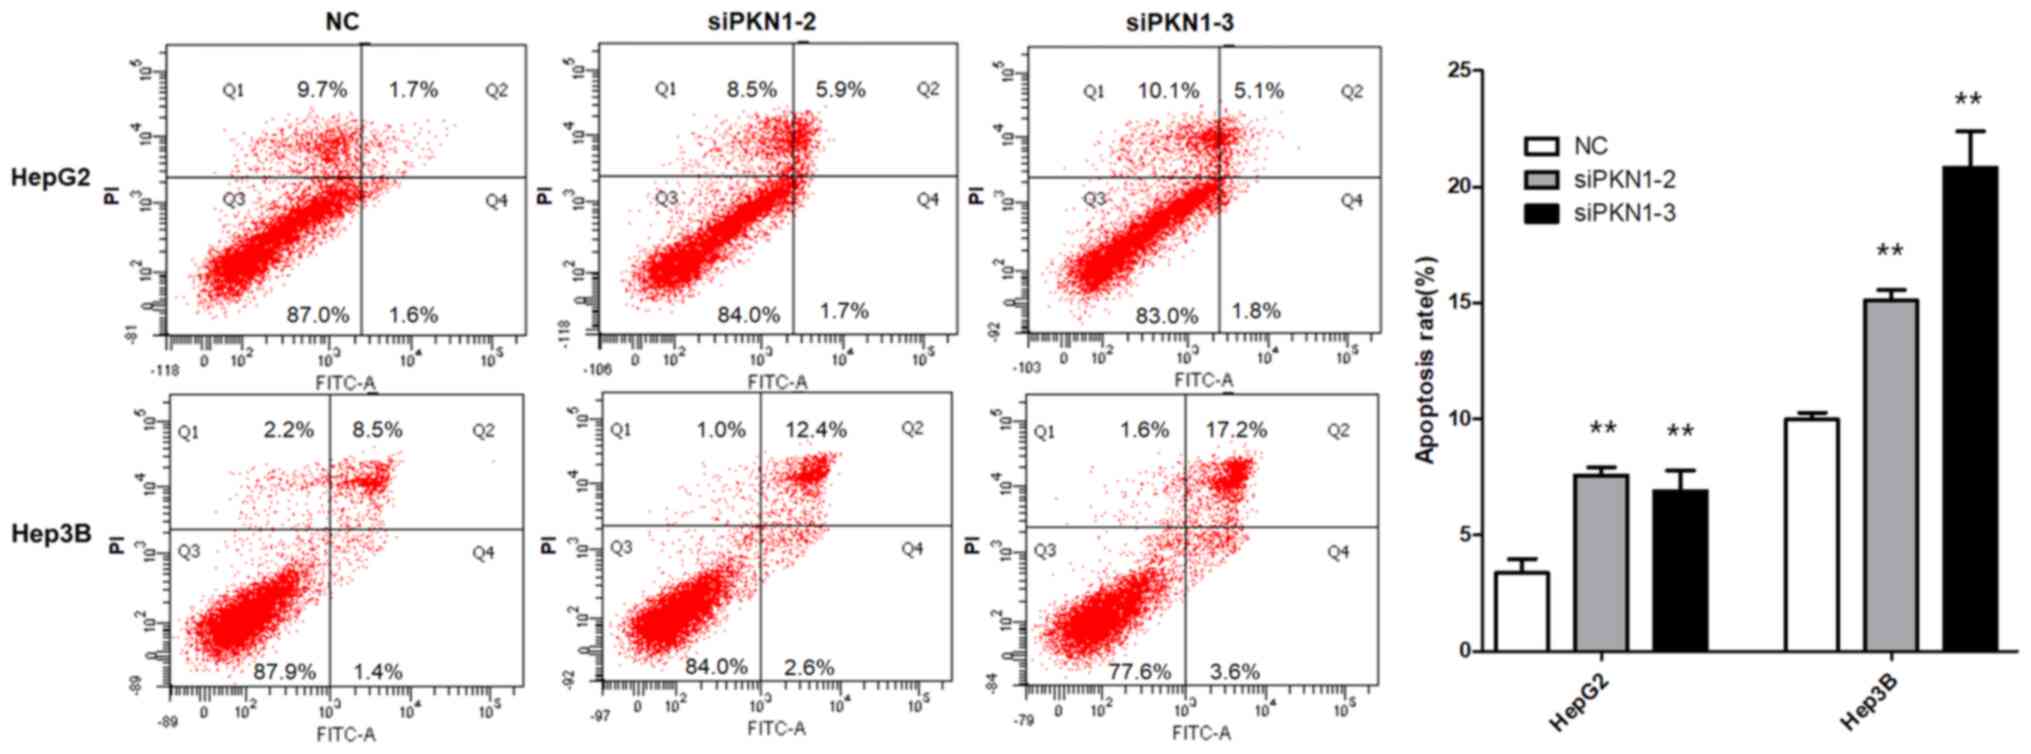
Downregulated PKN1 expression enhances
apoptosis of liver cancer cells
To verify the effect of PKN1 silencing on apoptosis
of liver cancer cells, the Annexin V method with flow cytometry was
used, which demonstrated that the apoptosis rate of HepG2 and Hep3B
cells transfected with siPKN1 was significantly higher compared
with cells transfected with negative siRNA (P<0.01; Fig. 5). This indicated that downregulation
of PKN1 expression enhances apoptosis of liver cancer cells.
Discussion
With the advance of medical technology, the
treatment of liver cancer has entered the era of precise and
multi-disciplinary combination therapy. Currently, molecular
targeted drugs such as sorafenib, regorafenib, lenvatinib and
immune checkpoint inhibitors have prolonged the survival of some
patients (23-26).
However, for complex reasons, the prognosis of most liver cancer
patients is still unsatisfactory (27). Abnormal activation or overexpression
of oncogenes is closely associated with tumor occurrence and
development. Elucidating the role of oncogenes is important for the
prevention and treatment of liver cancer.
Recent studies have shown that abnormal PKN family
expression is closely associated with the occurrence and
development of many diseases (8,9,13-16).
The three subtypes PKN1, PKN2 and PKN3 are involved in many
cellular processes, such as cytoskeletal remodeling and glucose
transport and potential roles served in neurodegeneration and
cancer (11-13).
As a major member of the PKN family, PKN1 gene is activated when
cancer cells are hypoxic-ischemic, which can affect cell adhesion,
regulate angiogenesis and influence invasion and metastasis
(7,8). In the present study, PKN1 expression
was detected in the samples of all patients with HCC and expression
was closely associated with the histopathological grading of HCC.
PKN1 expression in moderately and poorly differentiated HCC was
significantly higher compared with highly differentiated HCC. Some
researchers have noted that the histological grading of HCC is an
important prognostic factor after surgery and compared with
low-grade HCC, high-grade HCC is prognostic of a worse survival
rate (24,25).
Previous studies have shown that liver cancer is a
highly vascularized malignant tumor and angiogenesis is a marker of
tumor development (26,28). MVD, an important indicator of tumor
angiogenesis activity, can reflect the angiogenesis and
distribution of tumors and is one of the markers for prediction of
tumor progression and prognosis (29). Mukai et al (30) showed that PKN3 (an isoform of PKN
family) knock-down induces a glycosylation defect of cell-surface
glycoproteins, including intercellular adhesion molecule-1,
integrin β1 and integrin α5 in human umbilical vascular endothelial
cells and the PKN3 knockout mice exhibited an impaired lung
metastasis of melanoma cells. PKN3 inhibition increases its
downstream target gene VE-cadherin levels and alters endothelial
function, resulting in reduced colonization and micro-metastasis
formation (31). Unfortunately,
there have been few studies about PKN1 and tumor vascular
endothelial activity. In the present study, the trend in expression
of VEGF was similar to that of PKN1; both of which were
significantly higher in moderately and poorly differentiated HCC
compared with highly differentiated HCC. MVD marked with CD34 in
moderately and poorly differentiated HCC was significantly higher
compared with highly differentiated HCC. However, no definite
correlation was found between MVD and VEGF in HCC.
Ki67 proliferation index reflects the degree of
tumor proliferation, which is significantly correlated with tumor
doubling time (32). In the present
study, the Ki67 index in moderately and poorly differentiated HCC
was also significantly higher compared with highly differentiated
HCC, which was positively correlated with PKN1 expression. The
above immunohistochemical results suggested that PKN1 served a role
in promoting angiogenesis and proliferation of HCC.
Invasion, metastasis, proliferation and apoptosis of
tumor cells are important biological indicators of malignant tumor
cells. Previous studies have validated the roles of PKN1 in
promoting the progression of endometrial and prostate cancer cells
and malignant melanoma cells (15,18,19).
HepG2 and Hep3B cells have been cultured as liver cancer cells for
studies on biological and pharmaceutical properties of liver cancer
(1,33). In vitro, it was found that
migration and invasion of liver cancer cells were significantly
inhibited when PKN1 expression was silenced compared with the NC
group. As described earlier, the catalytic region at the carboxyl
end of PKN1 is 50% homologous to members of the PKC family and once
PKN1 is switched, the signaling pathways such as TGF-β/EGF,
PI3K/AKT/mTOR and Wnt/β-catenin are activated (15,18).
Downstream effects of PKN1 and signaling pathways had been shown to
be important in some cancer types (17,18)
and it is hoped to explore the mechanism of PKN1 in HCC in
follow-up experiments. PKN1 is also an effector molecule of Ras
homolog gene family, member A (RhoA)/Ras-related C3 botulinum toxin
substrate 1 (RAC1) and mediates cell migration by phosphorylating
cytoskeleton organization proteins. PKN1 phosphorylation/activation
may be involved in the regulation of endothelial cell proliferation
and migration; two events that are essential for angiogenesis
(34-36).
The imbalance between apoptosis and cell
proliferation contributes to tumor formation and progression.
Previous studies have shown that PKN1 has a cleavage site of
caspase-3 and is hydrolyzed into 55-kD kinase protein by caspase-3
and apoptotic protease, which strengthens the activity of PKN1
(37-39).
However, Koh et al (40)
report that PKN2 suppresses the antiapoptotic activity of AKT by
blocking the phosphorylation of Thr308, Ser473 and its downstream
target protein BAD. Tofacitinib, as an inhibitor of JAK1 and JAK3,
has been approved for the treatment of rheumatoid arthritis and
myeloproliferative diseases. Inhibiting JAK function has been shown
to efficiently prevent the uncontrolled growth of cancerous cells
(41). Previous studies also
suggest that JAK1-3 inhibitor tofacitinib and analogs potently
blocks PKN1 activity for the treatment of cancer as well as
immune-mediated diseases (42,43).
The present study demonstrated that cell proliferation decreased
and apoptosis of liver cancer cells increased significantly when
PKN1 expression was silenced. In other words, inhibition of PKN1
may inhibit proliferation and increase apoptosis of tumor cells,
thus inhibiting tumor growth. The in vitro experiments
suggested that PKN1 served a role as an oncogene in the development
and progression of liver cancer, which is consistent with the
immune response results in clinical studies of liver cancer. Future
experiments will be performed to observe the PKN1 gene therapeutic
effect in vivo using a liver cancer transplantation
model.
In conclusion, PKN1 was highly expressed in HCC
clinical specimens and was positively correlated with HCC
histological grading, Ki67 expression and MVD. When the expression
of PKN1 is silenced, apoptosis is enhanced and proliferation,
migration and invasiveness of liver cancer cells are decreased.
Acknowledgements
The authors would like to thank Professor Shuhua Wu,
Miss Yingying Han and Miss Yangyang Li (Binzhou Medical University
Hospital, Binzhou, China). In addition, the authors would like to
thank the teachers of the Medical Research Centre of Binzhou
Medical University (Yantai, China).
Funding
Funding: Professor Peiyuan Wang was supported by the Natural
Science Fund of Shandong Province (grant no. ZR2018MH034).
Availability of data and materials
All data generated or analyzed during this study are
included in this published article.
Authors' contributions
PW and XW designed the research. XW, YG, MS and HD
performed the research. WL and PW analyzed the data. PW and XW
drafted the manuscript, and confirmed the authenticity of all the
raw data. All authors read and approved the final manuscript.
Ethics approval and consent to
participate
All experimental protocols involving human tissue
samples were approved by the Ethics Committee of Binzhou Medical
University (Yantai, China; approval no. 2018-012). The patients
provided written informed consent.
Patient consent for publication
Not applicable.
Competing interests
The authors declare that they have no competing
interests.
References
|
1
|
Xie L, Dai H, Li M, Yang W, Yu G, Wang X,
Wang P, Liu W, Hu X and Zhao M: MARCH1 encourages tumour
progression of hepatocellular carcinoma via regulation of
PI3K-AKT-β-catenin pathways. J Cell Mol Med. 23:3386–3401.
2019.PubMed/NCBI View Article : Google Scholar
|
|
2
|
Torre LA, Bray F, Siegel RL, Ferlay J,
Lortet-Tieulent J and Jemal A: Global cancer statistics, 2012. CA
Cancer J Clin. 65:87–108. 2015.PubMed/NCBI View Article : Google Scholar
|
|
3
|
Bray F, Ferlay J, Soerjomataram I, Siegel
RL, Torre LA and Jemal A: Global cancer statistics 2018: GLOBOCAN
estimates of incidence and mortality worldwide for 36 cancers in
185 countries. CA Cancer J Clin. 68:394–424. 2018.PubMed/NCBI View Article : Google Scholar
|
|
4
|
Syed YY: Ramucirumab: A review in
hepatocellular carcinoma. Drugs. 80:315–322. 2020.PubMed/NCBI View Article : Google Scholar
|
|
5
|
Cui H, Dai G and Guan J: Programmed cell
death protein-1 (PD-1)-targeted immunotherapy for advanced
hepatocellular carcinoma in real world. Onco Targets Ther.
13:143–149. 2020.PubMed/NCBI View Article : Google Scholar
|
|
6
|
Kirstein MM and Wirth TC: Multimodal
treatment of hepatocellular carcinoma. Internist (Berl).
61:164–169. 2020.PubMed/NCBI View Article : Google Scholar : (In German).
|
|
7
|
Metzger E, Yin N, Wissmann M, Kunowska N,
Fischer K, Friedrichs N, Patnaik D, Higgins JM, Potier N,
Scheidtmann KH, et al: Phosphorylation of histone H3 at threonine
11 establishes a novel chromatin mark for transcriptional
regulation. Nat Cell Biol. 10:53–60. 2008.PubMed/NCBI View
Article : Google Scholar
|
|
8
|
Jilg CA, Ketscher A, Metzger E, Hummel B,
Willmann D, Rüsseler V, Drendel V, Imhof A, Jung M, Franz H, et al:
PRK1/PKN1 controls migration and metastasis of androgen-independent
prostate cancer cells. Oncotarget. 5:12646–12664. 2014.PubMed/NCBI View Article : Google Scholar
|
|
9
|
Mukai H: The structure and function of
PKN, a protein kinase having a catalytic domain homologous to that
of PKC. J Biochem. 133:17–27. 2003.PubMed/NCBI View Article : Google Scholar
|
|
10
|
Dong LQ, Landa LR, Wick MJ, Zhu L, Mukai
H, Ono Y and Liu F: Phosphorylation of protein kinase N by
phosphoinositide-dependent protein kinase-1 mediates insulin
signals to the actin cytoskeleton. Proc Natl Acad Sci USA.
97:5089–5094. 2000.PubMed/NCBI View Article : Google Scholar
|
|
11
|
Yasui T, Sakakibara-Yada K, Nishimura T,
Morita K, Tada S, Mosialos G, Kieff E and Kikutani H: Protein
kinase N1, a cell inhibitor of Akt kinase, has a central role in
quality control of germinal center formation. Proc Natl Acad Sci
USA. 109:21022–21027. 2012.PubMed/NCBI View Article : Google Scholar
|
|
12
|
Lachmann S, Jevons A, De Rycker M,
Casamassima A, Radtke S, Collazos A and Parker PJ: Regulatory
domain selectivity in the cell-type specific PKN-dependence of cell
migration. PLoS One. 6(e21732)2011.PubMed/NCBI View Article : Google Scholar
|
|
13
|
Cuny GD: Kinase inhibitors as potential
therapeutics for acute and chronic neurodegenerative conditions.
Curr Pharm Des. 15:3919–3939. 2009.PubMed/NCBI View Article : Google Scholar
|
|
14
|
Galgano MT, Conaway M, Spencer AM, Paschal
BM and Frierson HF Jr: PRK1 distribution in normal tissues and
carcinomas: Overexpression and activation in ovarian serous
carcinoma. Hum Pathol. 40:1434–1440. 2009.PubMed/NCBI View Article : Google Scholar
|
|
15
|
Attarha S, Saini RK, Andersson S, Mints M
and Souchelnytskyi S: PKN1 modulates TGFβ and EGF signaling in
HEC-1-A endometrial cancer cell line. Onco Targets Ther.
7:1397–1408. 2014.PubMed/NCBI View Article : Google Scholar
|
|
16
|
Zeng R, Wang Z, Li X, Chen Y, Yang S and
Dong J: Cyclin-dependent kinase 1-mediated phosphorylation of
protein kinase N1 promotes anchorage-independent growth and
migration. Cell Signal. 69(109546)2020.PubMed/NCBI View Article : Google Scholar
|
|
17
|
Deaton RA, Su C, Valencia TG and Grant SR:
Transforming growth factor-beta1-induced expression of smooth
muscle marker genes involves activation of PKN and p38 MAPK. J Biol
Chem. 280:31172–31181. 2005.PubMed/NCBI View Article : Google Scholar
|
|
18
|
Yang CS, Melhuish TA, Spencer A, Ni L, Hao
Y, Jividen K, Harris TE, Snow C, Frierson HF, Wotton D and Paschal
BM: The protein kinase C super-family member PKN is regulated by
mTOR and influences differentiation during prostate cancer
progression. Prostate. 77:1452–1467. 2017.PubMed/NCBI View Article : Google Scholar
|
|
19
|
James RG, Bosch KA, Kulikauskas RM, Yang
PT, Robin NC, Toroni RA, Biechele TL, Berndt JD, von Haller PD, Eng
JK, et al: Protein kinase PKN1 represses Wnt/β-catenin signaling in
human melanoma cells. J Biol Chem. 288:34658–34670. 2013.PubMed/NCBI View Article : Google Scholar
|
|
20
|
Park BV, Gaba RC, Huang YH, Chen YF,
Guzman G and Lokken RP: Histology of hepatocellular carcinoma:
Association with clinical features, radiological findings, and
locoregional therapy outcomes. J Clin Imaging Sci.
9(52)2019.PubMed/NCBI View Article : Google Scholar
|
|
21
|
Zhou L, Rui JA, Zhou WX, Wang SB, Chen SG
and Qu Q: Edmondson-Steiner grade: A crucial predictor of
recurrence and survival in hepatocellular carcinoma without
microvascular invasion. Pathol Res Pract. 213:824–830.
2017.PubMed/NCBI View Article : Google Scholar
|
|
22
|
Livak KJ and Schmittgen TD: Analysis of
relative gene expression data using real-time quantitative PCR and
the 2(-Delta Delta C(T)) method. Methods. 25:402–408.
2001.PubMed/NCBI View Article : Google Scholar
|
|
23
|
Faivre S, Rimassa L and Finn RS: Molecular
therapies for HCC: Looking outside the box. J Hepatol. 72:342–352.
2020.PubMed/NCBI View Article : Google Scholar
|
|
24
|
Jonas S, Bechstein WO, Steinmüller T,
Herrmann M, Radke C, Berg T, Settmacher U and Neuhaus P: Vascular
invasion and histopathologic grading determine outcome after liver
transplantation for hepatocellular carcinoma in cirrhosis.
Hepatology. 33:1080–1086. 2001.PubMed/NCBI View Article : Google Scholar
|
|
25
|
Zhou L, Rui JA, Wang SB, Chen SG and Qu Q:
Clinicopathological predictors of poor survival and recurrence
after curative resection in hepatocellular carcinoma without portal
vein tumor thrombosis. Pathol Oncol Res. 21:131–138.
2015.PubMed/NCBI View Article : Google Scholar
|
|
26
|
Zhang W, Kim R, Quintini C, Hashimoto K,
Fujiki M, Diago T, Eghtesad B, Miller C, Fung J, Tan A, et al:
Prognostic role of plasma vascular endothelial growth factor in
patients with hepatocellular carcinoma undergoing liver
transplantation. Liver Transpl. 21:101–111. 2015.PubMed/NCBI View
Article : Google Scholar
|
|
27
|
Raoul JL and Edeline J: Systemic treatment
of hepatocellular carcinoma: Standard of care in China and
elsewhere. Lancet Oncol. 21:479–481. 2020.PubMed/NCBI View Article : Google Scholar
|
|
28
|
Tong X, Wang Q, Wu D, Bao L, Yin T and
Chen H: MEK inhibition by cobimetinib suppresses hepatocellular
carcinoma and angiogenesis in vitro and in vivo. Biochem Biophys
Res Commun. 523:147–152. 2020.PubMed/NCBI View Article : Google Scholar
|
|
29
|
Berretta M, Cobellis G, Franco R, Panarese
I, Rinaldi B, Nasti G, Di Francia R and Rinaldi L: Features of
microvessel density (MVD) and angiogenesis inhibitors in
therapeutic approach of hepatocellular carcinoma (HCC). Eur Rev Med
Pharmacol Sci. 23:10139–10150. 2019.PubMed/NCBI View Article : Google Scholar
|
|
30
|
Mukai H, Muramatsu A, Mashud R, Kubouchi
K, Tsujimoto S, Hongu T, Kanaho Y, Tsubaki M, Nishida S, Shioi G,
et al: PKN3 is the major regulator of angiogenesis and tumor
metastasis in mice. Sci Rep. 6(18979)2016.PubMed/NCBI View Article : Google Scholar
|
|
31
|
Santel A, Aleku M, Röder N, Möpert K,
Durieux B, Janke O, Keil O, Endruschat J, Dames S, Lange C, et al:
Atu027 prevents pulmonary metastasis in experimental and
spontaneous mouse metastasis models. Clin Cancer Res. 16:5469–5480.
2010.PubMed/NCBI View Article : Google Scholar
|
|
32
|
Stroescu C, Dragnea A, Ivanov B, Pechianu
C, Herlea V, Sgarbura O, Popescu A and Popescu I: Expression of
p53, Bcl-2, VEGF, Ki67 and PCNA and prognostic significance in
hepatocellular carcinoma. J Gastrointestin Liver Dis. 17:411–417.
2008.PubMed/NCBI
|
|
33
|
Xie L, Li M, Liu D, Wang X, Wang P, Dai H,
Yang W, Liu W, Hu X and Zhao M: Secalonic Acid-F, a novel
mycotoxin, represses the progression of hepatocellular carcinoma
via MARCH1 regulation of the PI3K/AKT/β-catenin signaling pathway.
Molecules. 24(393)2019.PubMed/NCBI View Article : Google Scholar
|
|
34
|
Turner EC, Kavanagh DJ, Mulvaney EP,
McLean C, Wikström K, Reid HM and Kinsella BT: Identification of an
interaction between the TPand TP isoforms of the human thromboxane
A2 receptor with protein kinase C-related kinase (PRK) 1.
Implications for prostate cancer. J Biol Chem. 286:15440–15457.
2011.PubMed/NCBI View Article : Google Scholar
|
|
35
|
Owen D, Lowe PN, Nietlispach D, Brosnan
CE, Chirgadze DY, Parker PJ, Blundell TL and Mott HR: Molecular
dissection of the interaction between the small G proteins Rac1 and
RhoA and protein kinase C-related kinase 1 (PRK1). J Biol Chem.
278:50578–50587. 2003.PubMed/NCBI View Article : Google Scholar
|
|
36
|
Modha R, Campbell LJ, Nietlispach D,
Buhecha HR, Owen D and Mott HR: The Rac1 polybasic region is
required for interaction with its effector PRK1. J Biol Chem.
283:1492–1500. 2008.PubMed/NCBI View Article : Google Scholar
|
|
37
|
Takahashi M, Mukai H, Toshimori M,
Miyamoto M and Ono Y: Proteolytic activation of PKN by caspase·3 or
related protease during apoptosis. Proc Natl Acad Sci USA.
95:11566–11571. 1998.PubMed/NCBI View Article : Google Scholar
|
|
38
|
Ueyama T, Ren Y, Sakai N, Takahashi M, Ono
Y, Kondoh T, Tamaki N and Saito N: Generation of a constitutively
active fragment of PKN in microglia/macrophages after middle
cerebral artery occlusion in rats. J Neurochem. 79:903–913.
2001.PubMed/NCBI View Article : Google Scholar
|
|
39
|
Cryns VL, Byun Y, Rana A, Mellor H, Lustig
KD, Ghanem L, Parker PJ, Kirschner MW and Yuan J: Specific
proteolysis of the kinase protein kinase C-related kinase 2 by
caspase·3 during apoptosis. Identification by a novel, small pool
expression cloning strategy. J Biol Chem. 272:29449–29453.
1997.PubMed/NCBI View Article : Google Scholar
|
|
40
|
Koh H, Lee KH, Kim D, Kim S, Kim JW and
Chung J: Inhibition of Akt and its anti-apoptotic activities by
tumor necrosis factor-induced protein kinase C-related kinase 2
(PRK2) cleavage. J Biol Chem. 275:34451–34458. 2000.PubMed/NCBI View Article : Google Scholar
|
|
41
|
Aittomäki S and Pesu M: Therapeutic
targeting of the Jak/STAT pathway. Basic Clin Pharmacol Toxicol.
114:18–23. 2014.PubMed/NCBI View Article : Google Scholar
|
|
42
|
Ostrovskyi D, Rumpf T, Eib J, Lumbroso A,
Slynko I, Klaeger S, Heinzlmeir S, Forster M, Gehringer M,
Pfaffenrot E, et al: Tofacitinib and analogs as inhibitors of the
histone kinase PRK1 (PKN1). Future Med Chem. 8:1537–1551.
2016.PubMed/NCBI View Article : Google Scholar
|
|
43
|
Hosseini A, Gharibi T, Marofi F, Javadian
M, Babaloo Z and Baradaran B: Janus kinase inhibitors: A
therapeutic strategy for cancer and autoimmune diseases. J Cell
Physiol. 235:5903–5924. 2020.PubMed/NCBI View Article : Google Scholar
|