Introduction
Multiple myeloma (MM) is a neoplasm of the B
lymphocytes characterized by the uncontrolled proliferation of a
plasmocyte clone, with subsequent accumulation in the hematopoietic
marrow, and the overproduction of a monoclonal protein, that can be
identified by electrophoresis (1).
The role of imaging examinations in MM includes diagnostic
assessment of the extent and severity of bone lesions,
identification and characterization of complications as well as
periodic evaluation (2).
Conventional radiographs were previously used as the
‘gold-standard’ in the detection of bone lesions in MM (3). Advances have been made in imaging
technology, with more widespread use of magnetic resonance imaging
(MRI). MRI remains the most sensitive and specific imaging method
for the detection of bone marrow infiltration, before macroscopic
bone changes are visible, with evidence that the detection rate and
overall performance of MRI could be enhanced by applying
diffusion-weighted imaging (DWI) (4).
DWI is a MRI sequence that is increasingly being
used to assess bone marrow because of its sensitivity to cell
density, the relative content of fat, marrow cells, water as well
as bone marrow perfusion (5). The
signal intensity of DWI relies on the stochastic Brownian motion or
self-diffusion of water molecules at a microscopic level within
tissues (6); that is why changes in
DWI and implicitly apparent diffusion coefficient (ADC) values
predate morphological bone changes (7,8).
The use of DWI and implicitly ADC values represent a
quantitative method of assessing the severity of bone infiltration
and may be a possible prognostic factor (9).
The aim of our research was to evaluate whether
measuring ADC values in newly diagnosed patients with MM could be a
prognostic factor for the course of the disease and to ascertain
whether there is any correlation with other prognostic factors in
MM including age, male gender, MM stage II or III, type of marrow
infiltration, or treatment regimen.
Patients and methods
Settings and patients
Our retrospective study was performed on a group of
32 patients admitted to the Department of Hematology, City
Emergency Hospital of Timisoara from December 15, 2016 until
December 31, 2019. After searching the medical records, we included
patients with newly diagnosed MM that underwent at least two whole
body (WB)-MRIs-one before and one after induction therapy.
MRI evaluation
WB-MRI was performed using a 1.5 T MRI scanner
(Magnetom Aera, Siemens, Erlangen, Germany). Scans included T1
weighted (T1w), short-TI inversion recovery (STIR) and
diffusion-weighted image (DWI) (0 and 800 sec/mm2
b-value) sequences. Initial assessment of bone marrow disease on
DWI was made by visually assessing the signal intensity on high
b-value images (b800); the quantified parameter derived from DWI is
the ADC coefficient, which is a direct indicator of water motion
within extracellular and intracellular space and is thus directly
related to tissue cell density (4,10).
OsiriX software (Pixmeo SARL, Bernex, Switzerland)
was used to calculate ADC values after averaging the region of
interest (ROI) values measuring one square centimeter from 5
different vertebral bodies (in cases of normal marrow MM patients)
and from 5 different lesions with a minimum 2 cm in diameter (for
patients with focal lesions and focal and diffuse infiltration).
ADC values are expressed in mm2/sec.
Based on the morphologic T1w and STIR sequences, we
considered 3 patterns of bone marrow infiltration on MR imaging,
including a normal appearing marrow (normal M), focal infiltration
marrow (focal M) and combined focal and diffuse infiltration marrow
(focal-diffuse M).
Multiple myeloma treatment regimens
and evaluation of response to treatment
The treatment protocol in our study consisted of
first-line therapy before transplant: VAD regimen or BD
regimen.
The VAD regimen consisted of vincristine (0.4
mg/day, days 1-4), doxorubicin (9 mg/day, days 1-4) and
dexamethasone (40 mg/day, days 1-4, 9-12, 17-20 during odd cycles
and days 1-4, 9-12 during even cycles). The cycle was repeated
after 28 days.
The BD (bortezomib and dexamethasone) regimen
consisted of bortezomib (1.3 mg/day, days 1,4,8,11) and
dexamethasone (40 mg/day, days 1, 2, 3, 4, 5, 8, 9, 11, 12). The
cycle was repeated after 21 days.
Evaluation of the stage of
disease
The International Staging System (ISS) was used for
staging the disease; stage I was considered when venous blood β2
microglobulin and albumin were lower than 3.5 mg/l; stage III when
β2 microglobulin was higher than 5.5 mg/l; and stage II when values
were not included in stages I or III (11). The response to treatment was
evaluated as complete remission, partial remission, stable disease
or progressive disease following the International Myeloma Working
Group Response Criteria (11).
Statistical analysis
Data are presented as average ± standard deviation
(numerical variables with Gaussian distribution), median and
interquartile range (numerical variables with non-Gaussian
distributions) respectively percentage from the sub-group total and
number of individuals. Continuous variable distributions were
tested for normality using Shapiro-Wilk test. ADC levels between
more than two groups (MRI results, initial disease stage and
evolution) were compared using the Kruskal-Wallis H test followed
by post-hoc analysis with pairwise Mann-Whitney U test with
Bonferroni correction applied.
The association between two continuous variables
from non-Gaussian populations was analyzed using Spearman's
correlation coefficient. The individual impact of several
confounding factors on the variance of a continuous variable was
assessed by building multivariate regression models. The quality of
the model was described using the accuracy of prediction and by
Nagelkerke's R2. The predictors, in the final regression equations,
were accepted according to a repeated backward-stepwise algorithm
(inclusion criteria P<0.05, exclusion criteria P>0.10) in
order to obtain the most appropriate theoretical model to fit the
collected data.
In this study, a P-value of 0.05 was considered the
threshold for statistical significance. Data were analyzed using
SPSS v26 statistical software package (SPSS Inc.) for Linux.
Ethical issues
The research was conducted in accordance with the
1964 Helsinki Declaration and all patients signed a written
consent. The study was approved by the local Ethics Committee of
the City Emergency Hospital Timisoara (no. 31322/2020) in
compliance with the European Union laws.
Results
General features of the MM
patients
Our study included 19 males and 13 females with a
mean age of 67.5 years. A detailed description of the features of
the patients is represented in Table
I.
 | Table IGeneral characteristics of the
patients with MM. |
Table I
General characteristics of the
patients with MM.
| Age, in years; median
(Q1-Q3) | 67.5
(61.75-77.5) |
|---|
| Male/female, n
(%) | 19 (59.4)/13
(40.6) |
| MRI results, n
(%) | |
|
Normal
marrow | 10 (31.3) |
|
Focal
lesions | 11 (34.4) |
|
Focal and
diffuse infiltration | 11 (34.4) |
| Disease stage
(pre-therapeutic), n (%) | |
|
1 | 5 (15.6) |
|
2 | 6 (18.8) |
|
3 | 21 (65.6) |
| Treatment, n (%) | |
|
BD | 19 (59.4) |
|
VAD | 13 (40.6) |
| Evolution, n (%) | |
|
Complete
remission | 9 (28.1) |
|
Partial
remission | 5 (15.6) |
|
Stable
disease | 7 (21.9) |
|
Progressive
disease | 11 (34.4) |
| Survival, in months;
median (Q1-Q3) | 15.5 (10.5-24) |
There was no statistically difference of initial ADC
levels between males and females (1.01 vs. 0.86; P=0.520), and no
correlation of ADC levels with age (r=0.050; P=0.784).
Increased ADC values and advanced
stage of the disease
A significant difference was observed regarding ADC
values in the patients grouped according to the stage of disease (1
vs. 2 vs. 3; P=0.037) or between pairs of two separate groups.
However, the significance threshold was reached only for the
variation of medians between the three groups, respectively,
between stage 1 vs. stage 2 (0.289 vs. 1.162; P=0.033); stage 1 vs.
stage 3 (0.289 vs. 0.867; P=0.041); but not for stage 2 vs. stage 3
patients (1.169 vs. 0.867; P=0.661). The detailed comparison of ADC
values, stratified by stage of disease is presented in Table II.
| Table IIComparison of initial ADC values in
patients according to the stage of disease and MRI aspect. |
Table II
Comparison of initial ADC values in
patients according to the stage of disease and MRI aspect.
| | P-value |
|---|
| | Stage 1 | Stage 2 | Stage 3 | (1 vs. 2 vs.
3)b | (1 vs.
2)c | (1 vs.
3)c | (2 vs.
3)c |
|---|
| ADC
(mm2/sec) | 0.289
(0.19-0.72) | 1.162
(0.73-1.28) | 0.867
(0.58-1.12) | 0.037a | 0.033a | 0.041a | 0.661 |
| | P-value |
| | Normal (N)
marrow | Focal lesions
(L) | Marrow infiltration
(I) | (N vs. L vs.
I)b | (N vs.
L)c | (N vs.
I)c | (L vs.
I)c |
| ADC
(mm2/sec) | 0.307
(0.26-0.42) | 1.010
(0.87-1.34) | 1.123
(0.85-1.13) |
<0.001a |
<0.001a | 0.001a | 0.585 |
Kruskal-Wallis test showed a statistically
significant difference of initial ADC levels between the MRI result
groups (P<0.001). Mann-Whitney U pairwise test conducted with
Bonferroni correction showed a statistically significant difference
of initial ADC levels between normal marrow vs. focal-diffuse
marrow (0.307 vs. 1.123, P=0.001) as well as focal marrow (0.307
vs. 1.010, P<0.001); there was no statistical difference between
focal and diffuse infiltration and focal lesions (Table II).
ADC values and treatment regimen
No statistically significant difference of initial
(pre-therapeutic) ADC values were found in patients from both
regimen groups (BD vs. VAD): Pre-therapeutic (0.860 vs. 0.876;
P=0.910) and post-therapeutic, respectively (0.528 vs. 0.763;
P=0.362).
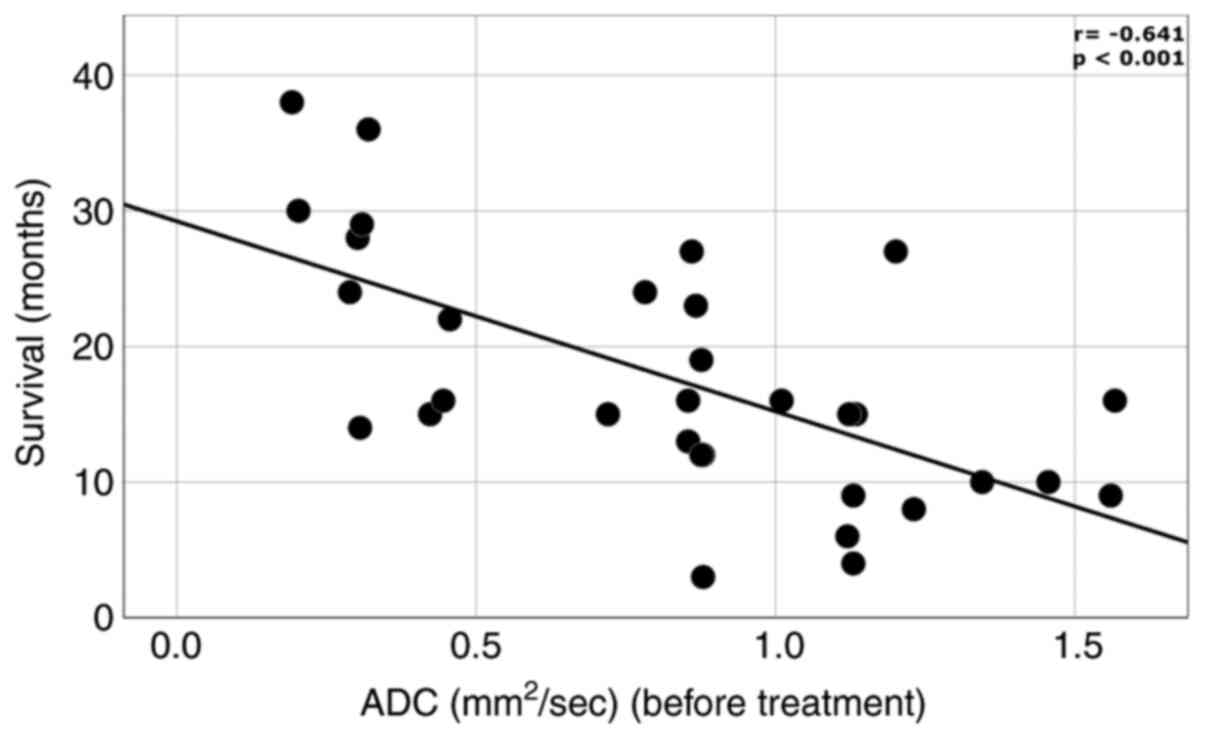
ADC levels and patient outcome
We found a difference between initial ADC values in
patients with complete remission, partial remission, stable disease
respectively progressive course of disease (Table III). We found a moderate inverse
correlation between initial ADC levels and survival time.
(r=-0.641; P<0.001) (Fig.
1).
| Table IIIInitial ADC values in patients
according to outcome. |
Table III
Initial ADC values in patients
according to outcome.
| | Complete
remission | Partial
remission | Stable disease | Progression | P-value |
|---|
| ADC
(mm2/sec) | 0.782
(0.30-0.87) | 0.854
(0.24-0.86) | 1.120
(0.72-1.13) | 1.130
(0.44-1.34) | 0.040 |
Multivariate linear regression
model
In order to determine the factors associated with
survival times, we employed a multivariate linear regression model
that included: Age, sex, initial ADC values and treatment.
According to the multivariate linear regression model, we observed
that for every point of ADC value (before treatment) the survival
was decreased/reduced by 14.5 months. In addition, BD Bortezomib
therapy predicted an increase in the survival length/duration by
7.9 months (Table IV). Our
regression equation proved to be a good fit for the model,
explaining 57.8% of survival duration (adjusted
R2=0.578).
| Table IVMultivariate linear regression of
independent factors for survival. |
Table IV
Multivariate linear regression of
independent factors for survival.
| Variable | B | S.E. | P-value | 95% confidence
interval |
|---|
| Treatment VAD | (Reference) | | | |
|
BD | 7.940 | 2.093 | 0.001 | 3.659; 12.221 |
| ADC
(mm2/sec) | -14.479 | 2.559 | <0.001 | -19.712;
-9.245 |
Discussion
In the present study, there was no statistical
correlation between initial apparent diffusion coefficient (ADC)
values and age or sex. It would be expected that ADC values should
have a direct correlation with age because it is known that females
show a higher grade of osteoporosis, in which case ADC values
should be lower. In a study by He et al, ADC values were
positively correlated with osteoporosis in women (12). A possible explanation that there was
no correlation in our study is the fact that the median age was
high and osteoporosis is a common finding in both elder men and
women.
Moreover, the amount of yellow (fatty) bone marrow
is known to be increased with age, in both women and men (13). Because most of our patients were in
an advanced stage of disease (II or III) and because the ADC
measurements were made only on myeloma lesions, this seems to be a
plausible explanation for the lack of correlation between ADC and
age.
β2 microglobulin is a serum marker of tumor burden
in lymphoid malignancies including MM (14) and is currently used for multiple
myeloma (MM) staging (stage I, II or III). The ADC map represents a
quantitative assessment of the cellularity of bone marrow. A low
ADC value correlates with low/normal cellularity while a higher ADC
value corresponds to an infiltrated bone marrow.
A significant difference was observed regarding ADC
values in patients grouped according the stage of disease (I-III)
or between pairs of two separate groups. However, the significance
threshold was reached only for the variation of medians between the
three groups, respectively, between stage II and I or stage III and
I, but not for stage II vs. stage III patients. According to this,
ADC values can differentiate between early disease (stage I) and
advanced disease (stages II and III). This is an interesting
finding, as diffusion-weighted imaging (DWI) and implicitly the ADC
values should be further used as a morphological and disease
staging criteria to better assess the extent of the local tumor and
reveal occult lesions in newly diagnosed patients (15,16).
Although the currently accepted guidelines for MM staging use only
serum parameters, the addition of ADC values could help to ensure a
more accurate staging of patients especially in the cases of serum
β2 microglobulin false-positive reactions (17).
The Kruskal-Wallis test showed a statistically
significant difference in pre-therapeutic ADC levels between
magnetic resonance imaging (MRI) marrow infiltration patterns;
there was a statistically significant difference of initial ADC
levels between normal marrow and focal-diffuse marrow as well as
focal marrow; there was no statistical difference between focal and
diffuse infiltration and focal lesions. Conversely, Koutoulidis
et al found statistically significant different ADC values
between all the types of evaluated MRI patterns (5). Although in our study there were no
significant differences between all types of bone marrow
infiltrations, it was observed that patients with early imaging
disease (normal marrow) can be differentiated based on ADC values
from those with advanced disease (diffuse bone marrow infiltration
and osteolytic lesions).
Regarding treatment, no differences in
pre-therapeutic or post-therapeutic ADC values were found in
patients from both treatment regimen groups, although BD treatment
represents the first line therapy (18). Although we obtained no significant
differences, this is an interesting future study topic, as
treatment options after induction therapy could be tailored after
ADC values; and thus the patients would receive personalized
treatment (19). Moreover, ADC
values could be used as a useful treatment response tool in
clinical trials (20).
We found a difference between pre-therapeutic ADC
values in patients with complete remission, partial remission,
stable disease and progressive course of disease. This is a
promising observation, but further studies with larger patient
cohorts are required to calculate a sensitive cut-off value for the
initial ADC value and good treatment response (complete and partial
remission).
Another study suggested that an initial baseline ADC
≤1.00x10⁻³ mm2/sec had a positive predictive
value (PPV) at 54.5% (adjusted 61.7%) in predicting post-induction
deep response (complete and partial remission) (21). Similar results were obtained in
other malignancies; lower pre-treatment ADC being associated with a
better response to treatment (22).
Conversely, in a study by Bonaffini et al, no significant
differences were observed in pretreatment ADC values between
responders and non-responders (23).
The ability of whole-body MRI to demonstrate focal
and diffuse marrow infiltration makes this technique an objective
way for monitoring disease status and response assessment. Added to
this, ADC measurements offer the capability to quantify disease
burden of the entire skeleton because dimension-based assessments
are not applicable to diffuse infiltration (24). Pretreatment ADC values were
significantly higher in patients with diffuse infiltration and
focal lesions compared to those with normal appearing bone marrow.
This can be explained by the fact that normal bone marrow contains
predominantly fat which has a low diffusivity index.
When looking at patient outcomes, irrespective of
the used treatment, MRI showed excellent correlation both for
morphologic sequences (showing marrow involvement) as well as DWI
using ADC values. Patients with normal marrow had an estimated
survival of 25.2 months, patients with focal lesions had an
estimated survival of 15.3 months while the patients with focal and
diffuse infiltration had an estimated survival of 12.7 months.
Moreover, according to the multivariate linear regression model we
observed that for every point of ADC value (before treatment) the
survival was decreased/reduced by 14.5 months. The degree of marrow
infiltration and ADC values before treatment seem to be an
excellent tool in assessing patient survival and can be used for
personalized treatment schemes; patients with higher marrow
infiltration and higher ADC values could benefit from more
aggressive treatment options while patients with no or minimal
marrow involvement could receive less aggressive treatment regimens
with fewer side effects.
The number of studies that have evaluated ADC values
and ADC changes after treatment for MM is low and the results are
conflicting (25). It is possible
that the direction of ADC changes is influenced by the timing of
the measurement. Early following treatment, ADC in responders was
found to increase probably due to plasma cell death and necrosis,
resulting in a T2 shine-through artifact (26). In cases where there was no necrosis,
later follow-up measurements showed an ADC decrease when marrow fat
was restored (26).
The small number of patients evaluated and the
retrospective nature of the present study represent the main
limitations of this analysis; further studies, with larger cohorts
are needed to confirm these results.
In conclusion, there is a long list of prognostic
factors for MM other than imaging; however, no single one can
accurately predict the survival of these patients. Whole-body MRI
negative prognostic factors are represented by high ADC values
before treatment (for every point of ADC the survival was
decreased/reduced by 14.5 months) and focal/diffuse marrow
involvement. Positive prognostic factors are represented by normal
appearing bone marrow and low ADC values before treatment.
Acknowledgements
Not applicable.
Funding
Funding: No funding was received.
Availability of data and materials
The datasets used and/or analyzed during the present
study are available from the first author on reasonable
request.
Authors' contributions
DC, II, GNP, HI and DCM were involved in the
conception of the study. ECB, OP, CP, DBN, AE and AB contributed to
data collection and interpretation. DC, GNP and DBN performed the
statistical analysis. DC, II, AB, GNP and DBN wrote the manuscript.
ECB, OP, CP, HI, AE and DCM revised the manuscript for important
intellectual content. All authors read and approved the final
version of the manuscript.
Ethics approval and consent to
participate
The study meets the ethical guidelines, including
adherence to the legal requirements of the study country. The study
was approved by the local Ethics Committee of the City Emergency
Hospital Timisoara (no. 31322/2020) in compliance with European
Union laws.
Patient consent for publication
Not applicable.
Competing interests
The authors declare that they have no competing
interests.
References
|
1
|
Fairfield H, Falank C, Avery L and Reagan
MR: Multiple myeloma in the marrow: Pathogenesis and treatments.
Ann NY Acad Sci. 1364:32–51. 2016.PubMed/NCBI View Article : Google Scholar
|
|
2
|
Mena E, Choyke P, Tan E, Landgren O and
Kurdziel K: Molecular imaging in myeloma precursor disease. Semin
Hematol. 48:22–31. 2011.PubMed/NCBI View Article : Google Scholar
|
|
3
|
Caers J, Withofs N, Hillengass J, Simoni
P, Zamagni E, Hustinx R and Beguin Y: The role of positron emission
tomography-computed tomography and magnetic resonance imaging in
diagnosis and follow up of multiple myeloma. Haematologica.
99:629–637. 2014.PubMed/NCBI View Article : Google Scholar
|
|
4
|
Dutoit JC and Verstraete KL: MRI in
multiple myeloma: A pictorial review of diagnostic and
post-treatment findings. Insights Imaging. 7:553–569.
2016.PubMed/NCBI View Article : Google Scholar
|
|
5
|
Koutoulidis V, Papanikolaou N and
Moulopoulos LA: Functional and molecular MRI of the bone marrow in
multiple myeloma. Br J Radiol. 91(20170389)2018.PubMed/NCBI View Article : Google Scholar
|
|
6
|
Dietrich O, Biffar A, Baur-Melnyk A and
Reiser MF: Technical aspects of MR diffusion imaging of the body.
Eur J Radiol. 76:314–322. 2010.PubMed/NCBI View Article : Google Scholar
|
|
7
|
Messiou C, Giles S, Collins DJ, West S,
Davies FE, Morgan GJ and Desouza NM: Assessing response of myeloma
bone disease with diffusion-weighted MRI. Br J Radiol.
85:e1198–e1203. 2012.PubMed/NCBI View Article : Google Scholar
|
|
8
|
Messiou C and Kaiser M: Whole body
diffusion weighted MRI-a new view of myeloma. Br J Haematol.
171:29–37. 2015.PubMed/NCBI View Article : Google Scholar
|
|
9
|
Kwee TC, Takahara T, Ochiai R, Katahira K,
van Cauteren M, Imai Y, Nievelstein RA and Lujiten PR: Whole-body
diffusion-weighted magnetic resonance imaging. Eur J Radiol.
70:409–417. 2009.PubMed/NCBI View Article : Google Scholar
|
|
10
|
Dutoit JC and Verstraete KL: Whole-body
MRI, dynamic contrast-enhanced MRI, and diffusion-weighted imaging
for the staging of multiple myeloma. Skeletal Radiol. 46:733–750.
2017.PubMed/NCBI View Article : Google Scholar
|
|
11
|
Kumar S, Paiva B, Anderson KC, Durie B,
Landgren O, Moreau P, Munshi N, Lonial S, Bladé J, Mateos MV, et
al: International Myeloma Working Group consensus criteria for
response and minimal residual disease assessment in multiple
myeloma. Lancet Oncol. 17:e328–e346. 2016.PubMed/NCBI View Article : Google Scholar
|
|
12
|
He J, Fang H and Na Li X: Vertebral bone
marrow diffusivity in normal adults with varying bone densities at
3T diffusion-weighted imaging. Acta Radiol. 59:89–96.
2018.PubMed/NCBI View Article : Google Scholar
|
|
13
|
Griffith JF, Yeung DK, Ma HT, Leung JC,
Kwok TC and Leung PC: Bone marrow fat content in the elderly: A
reversal of sex difference seen in younger subjects. J Magn Reson
Imaging. 36:225–230. 2012.PubMed/NCBI View Article : Google Scholar
|
|
14
|
D'Anastasi M, Notohamiprodjo M, Schmidt
GP, Dürr HR, Reiser MF and Baur-Melnyk A: Tumor load in patients
with multiple myeloma: β2-microglobulin levels versus whole-body
MRI. AJR Am J Roentgenol. 203:854–862. 2014.PubMed/NCBI View Article : Google Scholar
|
|
15
|
Dimopoulos MA, Hillengass J, Usmani S,
Zamagni E, Lentzsch S, Davies FE, Raje N, Sezer O, Zweegman S, Shah
J, et al: Role of magnetic resonance imaging in the management of
patients with multiple myeloma: A consensus statement. J Clin
Oncol. 33:657–664. 2015.PubMed/NCBI View Article : Google Scholar
|
|
16
|
Cavo M, Terpos E, Nanni C, Moreau P,
Lentzsch S, Zweegman S, Hillengass J, Engelhardt M, Usmani SZ,
Vesole DH, et al: Role of 18F-FDG PET/CT in the
diagnosis and management of multiple myeloma and other plasma cell
disorders: A consensus statement by the International Myeloma
Working Group. Lancet Oncol. 18:e206–e217. 2017.PubMed/NCBI View Article : Google Scholar
|
|
17
|
Argyropoulos CP, Chen SS, Ng YH,
Roumelioti ME, Shaffi K, Singh PP and Tzamaloukas AH: Rediscovering
beta-2 Microglobulin as a biomarker across the spectrum of kidney
diseases. Front Med (Lausanne). 4(73)2017.PubMed/NCBI View Article : Google Scholar
|
|
18
|
Borsi E, Bucur A, Oncu CP, Oncu OP, Cerbu
B, Costachescu D, Ionita I, Luca CT and Ionita H: First line
therapy in multiple myeloma: Vad vs. bortezomib-dexamethasone. Rev
Chim. 70:1017–1022. 2019.
|
|
19
|
Pawlyn C and Davies FE: Toward
personalized treatment in multiple myeloma based on molecular
characteristics. Blood. 133:660–675. 2019.PubMed/NCBI View Article : Google Scholar
|
|
20
|
de Souza NM, Winfield JM, Waterton JC,
Weller A, Papoutsaki MV, Doran SJ, Collins DJ, Fournier L, Sullivan
D, Chenevert T, et al: Implementing diffusion-weighted MRI for body
imaging in prospective multicentre trials: Current considerations
and future perspectives. Eur Radiol. 28:1118–1131. 2018.PubMed/NCBI View Article : Google Scholar
|
|
21
|
Wu C, Huang J, Xu WB, Guan YJ, Ling HW, Mi
JQ and Yan H: Discriminating depth of response to therapy in
multiple myeloma using whole-body diffusion-weighted MRI with
apparent diffusion coefficient: Preliminary results from a
single-center study. Acad Radiol. 25:904–914. 2018.PubMed/NCBI View Article : Google Scholar
|
|
22
|
Mosavi F, Wassberg C, Selling J, Molin D
and Ahlstrom H: Whole-body diffusion-weighted MRI and 18F-FDG
PET/CT can discriminate between different lymphoma subtypes. Clin
Radiol. 70:1229–1236. 2015.PubMed/NCBI View Article : Google Scholar
|
|
23
|
Bonaffini PA, Ippolito D, Casiraghi A,
Besostri V, Franzesi CT and Sironi S: Apparent diffusion
coefficient maps integrated in whole-body MRI examination for the
evaluation of tumor response to chemotherapy in patients with
multiple myeloma. Acad Radiol. 22:1163–1171. 2015.PubMed/NCBI View Article : Google Scholar
|
|
24
|
Messiou C and Kaiser M: Whole-Body imaging
in multiple myeloma. Magn Reson Imaging Clin N Am. 26:509–525.
2018.PubMed/NCBI View Article : Google Scholar
|
|
25
|
Giles SL, Messiou C, Collins DJ, Morgan
VA, Simpkin CJ, West S, Davies FE, Morgan GJ and de Souza NM:
Whole-body diffusion-weighted MR imaging for assessment of
treatment response in myeloma. Radiology. 271:785–794.
2014.PubMed/NCBI View Article : Google Scholar
|
|
26
|
Koh DM and Thoeny HC (eds): MRI for
Disease Detection. In: Diffusion-weighted MR imaging, medical
radiology. Springer Berlin, Heidelberg, pp97-115, 2010.
|