Introduction
Under certain circumstances, such as embryogenesis,
organ development, tissue regeneration, and tumor progression and
metastasis, epithelial cells are able to induce a biological
process known as epithelial-mesenchymal transition (EMT) (1,2).
During EMT, epithelial cells lose their epithelial characteristics
(cell-cell contact and epithelial polarity) and transform into a
mesenchymal phenotype (higher motility and cell-extracellular
matrix interactions) (1,2). EMT has been classified into three
types based on the biological events during which it occurs
(2,3). Type 1 EMT is associated with
developmental processes, such as gastrulation and neural crest cell
migration. This embryological EMT occurs in the orofacial region
during palate formation (2,3). Type 2 EMT is associated with wound
healing. Under certain conditions, such as prolonged inflammation,
type 2 EMT can lead to fibrosis of damaged tissues mediated by
enhanced cytokine production, such as TGF-β1 and TNFα (2,3). Type
3 EMT is associated with tumor progression and metastasis. Cancer
cells acquire an invasiveness and metastatic potential through
induction of the EMT process in the tumor microenvironment
(2,3).
It has been reported that a subset of transcription
factors, including members of the snail family transcriptional
repressor (SNAI), twist family bHLH transcription factor (TWIST),
and zinc finger E-box binding homeobox (ZEB) families, trigger
changes in dynamic gene expression that include the suppression of
epithelial phenotypic genes, such as E-cadherin, claudin and
cytokeratin as well as the induction of mesenchymal genes, such as
N-cadherin and fibronectin (4,5). SNAI2
(Slug) is an EMT transcription factor of the SNAI family and is
known to be involved in type 2 EMT during cutaneous wound healing
(6-8).
Epithelial cells at the edge of the wound undergo partial EMT in
which the cells attain a hybrid epithelial/mesenchymal phenotype
enabling them to move to the damaged area and re-constitute healthy
epithelial tissue (9). It is
thought that the partial EMT of squamous epithelial cells is
mediated by SNAI2, which in turn is mediated by the epidermal
growth factor receptor (6,7). In our previous study, elevated SNAI2
mRNA levels were observed during TGF-β1-induced EMT in the human
keratinocyte cell line HaCaT (10).
These findings suggested that SNAI2 triggers the EMT transcription
program and plays a critical role in managing the dynamic behavior
of squamous epithelial cells.
The present study aimed to investigate the molecular
mechanisms underlying EMT in squamous epithelial cells. Thus, the
role of SNAI2 in a TGF-β1-induced EMT model in HaCaT cells was
examined. The findings of the present study may advance the
understanding of the molecular mechanisms underlying EMT, and
contribute to the identification of novel therapeutic targets for
diseases and pathological conditions, such as cancers and wound
healing.
Materials and methods
Cell culture
HaCaT cells (a gift from Dr Tetsuro Ikebe, Fukuoka
Dental College, Japan), NIH3T3 cells (a gift from Dr Tsuyako
Ohkubo, Fukuoka Nursing College, Japan) and GP2-293 cells (cat. no.
631458; Takara Bio, Inc.) were cultured in a medium consisting of
DMEM (cat. no. 08458-45; Nacalai Tesque, Inc.) supplemented with
10% FBS (cat. no. S1820-500; BioWest), 50 U/ml penicillin and 50
µg/ml streptomycin. The cells were maintained by subculturing twice
a week at 37˚C with 5% CO2. Short tandem repeat analysis
was performed using a GenePrint 24 System (cat. no. B1870; Promega
Corporation) in order to authenticate the HaCaT cell line. To
induce EMT in HaCaT cells, 20 ng/ml recombinant TGF-β1 (cat. no.
5231; Cell Signaling Technology, Inc.) was added to the culture
medium and the cells were cultured for 48 h at 37˚C with 5%
CO2 as previously described (10). The morphology of the cells was
observed with a phase contrast microscope (Nikon Corporation;
magnification, x100).
Plasmid construction and generation of
SNAI2 overexpressing cells
The pMXs-TY1 plasmid was generated by inserting DNA
fragments corresponding to TY1-tag into the BamH1-EcoRI site of the
pMXs-puro retrovirus vector (Cell Bio, Inc.). PCR-amplification of
human SNAI2 cDNA was carried out using PrimeSTAR® Max
DNA polymerase (cat. no. R045A; Takara Bio, Inc.) with the
following primers (5'-CGCGGATCCCCATGCCGCGCTCCTTCCTGGTCAAG-3' and
5'-CGCGGATCCTCAGTGTGCTACACAGCAGCCAGA-3'). The thermocycling
conditions were as follows: 94˚C for 1 min; followed by 40 cycles
at 98˚C for 10 sec, 55˚C for 15 sec and 72˚C for 30 sec; followed
by final extension at 72˚C for 2 min. cDNA was subcloned into the
pMXs-TY1 (pMXs-TY1-SNAI2). Lipofectamine 2000®
(Invitrogen; Thermo Fisher Scientific, Inc.) was used to
co-transfect 1 µg of the pMXs-TY1 or pMXs-TY1-SNAI2 plasmid and 1
µg of the p10A1 vector (1:1) into the GP2-293 cells
(1x10⁶ cells; cat. no. 631458; Takara Bio, Inc.), which
is a HEK 293-based retroviral packaging cell line stably expressing
the MoMuL V Gag and Pol proteins. At 48 h post-transfection, the
virus-containing supernatants were collected and added to the
HaCaT-cell growth medium, followed by the addition of 7.5 µg/ml
polybrene. HaCaT cells (5x10⁵ cells) were cultured for
24 h in the virus-containing medium, which was then replaced with
fresh growth medium. A total of 48 h after virus transduction, the
cells were cultured in the HaCaT cell growth medium containing 2
µg/ml puromycin (Sigma-Aldrich; Merck KGaA) to enable the selection
of stably transduced cells.
Establishment of SNAI2-knockdown
cells
Oligonucleotides for generating short hairpin
(sh)RNA-targeting human SNAI2 (shSNAI2;
5'-GATCCGGCATTTGCAGACAGGTCAAATTTCAAGAGAATTTGACCTGTCTGCAAATGCCTTTTTTGCTAGCG-3')
and the non-targeting control (shNC;
5'-GATCCGTGCGTTGCTAGTACCAACTTCAAGAGATTTTTTACGCGTG-3') were
synthesized. Fragments of annealed oligonucleotides were cloned
into a pSIREN-RetroQ retroviral shRNA expression vector (a gift
from Dr Kazuya Yamagata, Kumamoto University, Japan).
Retrovirus-mediated gene transfer was used to establish stable
cells expressing shRNA. Briefly, 1 µg of the shRNA expression
plasmid (pSIREN-RetroQ-shSNAI2 or pSIREN-RetroQ-shNC) and 1 µg of
the p10A1 vector (1:1) were transfected into the GP2-293 cells
(1x10⁶ cells; Takara Bio, Inc.) using Lipofectamine
2000® (Invitrogen; Thermo Fisher Scientific, Inc.) at
37˚C for 48 h, after which the virus-containing supernatants were
collected and immediately added to the HaCaT-cell growth medium,
followed by the addition of 7.5 µg/ml polybrene. The retroviral
transduction of HaCaT cells was performed as described
previously.
Reverse transcription-quantitative
(RT-q) PCR
Extraction of total RNA from HaCaT cells was
performed using a NucleoSpin RNA kit (cat. no. 740955.50;
Machrey-Nagel, GmBH) and reverse-transcription into cDNA was
performed using a PrimeScript™ RT Master Mix (cat. no. RR036A;
Takara Bio, Inc.) according to the manufacturer's instructions.
Fluorescence dye-based qPCR was performed on a CFX96 Real-time
System (Bio-Rad Laboratories, Inc.) using TB Green Premix Ex Taq II
(cat. no. RR820A; Takara Bio, Inc.). The primers used were as
follows SNAI2 forward, 5'-CGAACTGGACACACATACAGTG-3' and reverse,
5'-CTGAGGATCTCTGGTTGTGGT-3'; and GAPDH, forward
5'-GGAGCGAGATCCCTCCAAAAT-3' and reverse,
5'-GGCTGTTGTCATACTTCTCATGG-3'. The thermocycling conditions were as
follows: 95˚C for 30 sec; followed by 40 cycles at 95˚C for 5 sec
and 60˚C for 30 sec. mRNA expression levels were normalized to the
levels of GAPDH and the 2-ΔΔCq method was used for
relative quantification (CFX Manager version 3.1; Bio-Rad
Laboratories, Inc.) (11).
Western blotting
Total protein was isolated from the cells using a
lysis buffer [50 mM Tris-HCl (pH 8.0), 300 mM NaCl, 1% SDS] and
quantified using a BCA assay. Total protein extracts (10-20 µg)
were resolved by electrophoresis in 4-20% polyacrylamide-SDS gels
and transferred onto PVDF membranes. The membranes were blocked
with 0.1% Tween-TBS (TBST) containing 4% (w/v) ECL Prime Blocking
Agent (cat. no. RPN418; Cytiva) or by using an EzBlock Chemi (cat.
no. AE-1475; ATTO), according to the manufacturer's instructions.
The membranes were then incubated with primary antibodies for
specific proteins for 1.5 h at 21-25˚C or overnight at 4˚C. After
washing with TBST for 3 times at 10 min each, the membranes were
incubated with horseradish peroxidase (HRP)-conjugated secondary
antibodies against mouse IgG or rabbit IgG for 1 h at 21-25˚C.
Chemiluminescence reactions were detected using a LAS-4000 imaging
system (Cytiva) and the intensity of each band was quantified using
ImageJ v.1.53a (National Institutes of Health). Expression levels
were normalized to the levels of β-actin. The primary antibodies
used in the present study were as follows: Anti-Slug (SNAI2;
1:2,500; cat. no. 9585; Cell Signaling Technology Inc.),
anti-E-cadherin (1:2,500; cat. no. 3195; Cell Signaling Technology
Inc.), anti-N-cadherin (1:2,500; cat. no. 13116; Cell Signaling
Technology, Inc.), anti-Claudin-1 (1:2,500; cat. no. 13255, Cell
Signaling Technology, Inc.), anti-Snail (1:2,500; cat. no. 3879;
Cell Signaling Technology, Inc.), anti-Twist (1:2,500; cat. no.
ab50887; Abcam), anti-Cytokeratin 13 (1:2,500; cat. no. ab92551;
Abcam), anti-Cytokeratin 15 (1:2,500; cat. no. ab52816; Abcam),
anti-Fibronectin/NF1 (1:2,500; cat. no. 26836; Cell Signaling
Technology Inc.), anti-TCF8/ZEB1 (1:2,500; cat. no. 3396; Cell
Signaling Technology Inc.), anti-β-Actin (1:5,000; cat. no.
sc-69879; Santa Cruz Biotechnology, Inc.), anti-mouse IgG
HRP-conjugated antibody (1:2,500; cat. no. 7076; Cell Signaling
Technology, Inc.) and anti-rabbit IgG HRP-conjugated antibody
(1:2,500; cat. no. 7074; Cell Signaling Technology, Inc.).
Immunocytochemical staining
Immunocytochemical staining was performed as in our
previous study (10). Briefly,
HaCaT cells were plated on Nunc Lab-Tek Chamber Slides (cat. no.
177429; Thermo Fisher Scientific Inc.) and cultured with or without
TGF-β1 for 48 h at 37˚C with 5% CO2. The cells were
fixed with 4% paraformaldehyde in PBS for 20 min at 21-25˚C,
permeabilized with 0.1% Triton X-100 in PBS for 3 min, and then
washed 3 times with PBS. Staining of filamentous actin (F-actin)
was achieved by blocking with 1% BSA in PBS for 30 min at 21-25˚C,
followed by probing with Alexa Fluor 488 Phalloidin (1:50; cat. no.
A-12379; Thermo Fisher Scientific, Inc.) for 1 h at 21-25˚C.
Staining of SNAI2 was carried out by probing first with an
anti-Slug (1:100; cat. no. 9585; Cell Signaling Technology, Inc.)
for 2 h at 21-25˚C and then anti-rabbit IgG antibody conjugated
with Alexa Fluor 488 (1:800; cat. no. A-11008; Thermo Fisher
Scientific, Inc.) for 1.5 h at 21-25˚C. After staining, DAPI
Fluoromount-G® (cat. no. 0100-20; SouthernBiotech) was
used to visualize nuclei and preserve fluorescence. Finally,
fluorescent images were captured by a fluorescence microscope
(BZ-9000; Keyence Corporation; magnification, x200).
DNA microarray
Total RNA of the non-treated HaCaT, TGF-β1-treated
(20 ng/ml TGF-β1; treated for 48 h at 37˚C), TY1 tag-overexpressing
and TY1-tagged SNAI2-overexpressing cells was extracted using a
NucleoSpin RNA kit (Machrey-Nagel, GmBH & Co.). The cRNA was
amplified and labeled using a Low-Input QuickAmp Labeling kit
(Agilent Technologies, Inc.) and hybridized to a SurePrint G3 Human
Gene Expression Microarray 8x60K v3 (Agilent Technologies, Inc.).
The procedure was carried out as previously described (12-14).
All hybridized microarray slides were scanned by an Agilent
scanner, after which relative hybridization intensities and
background hybridization values were calculated using Agilent
Feature Extraction Software (9.5.1.1). The raw signal intensities
and flags for each probe were calculated and normalized by a
quantile algorithm. Identification of differentially expressed
genes was carried out by calculating Z-scores and non-log scaled
fold-change ratios. Criteria for upregulated genes were Z-score
>2.0 and ratio >2.0, whereas those for downregulated genes
were Z-score <−2.0 and ratio <0.5. The DNA microarray
datasets were deposited in the Gene Expression Omnibus (GEO)
database (https://www.ncbi.nlm.nih.gov/geo/) at the National
Center for Biotechnology Information (NCBI) with the accession
numbers GSE166199 and GSE166200.
Heatmap and gene ontology (GO) and
pathway enrichment analyses
A heatmap was generated as previously described
(15) and genes were sorted using a
hierarchical clustering technique, with the distance from the
median of each row indicated by color. The ToppGene Suite
(https//toppgene.cchmc.org) (16) was used to perform both the GO
pathway analysis of biological processes, cell components, and
molecular functions, and the Kyoto Encyclopedia of Genes and
Genomes (KEGG) pathway analysis of genes differentially expressed
between non-treated and TGF-β-treated HaCaT cells, or between
TY1-tag and TY1-tagged SNAI2-overexpressing cells.
Transcription factor binding site
enrichment analysis
ChIP-X Enrichment Analysis 3 (https://amp.pharm.mssm.edu/ChEA3) (17) was used to identify the transcription
factors responsible for TGF-β-mediated EMT in HaCaT cells.
Statistical analysis
Data are expressed as the mean ± standard error of
the mean (SEM) of 3-6 biological replicates for each group.
Statistical analysis was performed using KaleidaGraph 4.5 (Hulinks,
Inc.) Statistical differences were calculated using an unpaired
Student's t-test for two groups or one-way analysis of variance
(ANOVA) followed by the post hoc Bonferroni's test for multiple
comparisons. P<0.05 was considered to indicate a statistically
significant difference.
Results
Increased expression of SNAI2 in HaCaT
cells during TGF-β1-mediated EMT
To elucidate the molecular mechanisms of the EMT
transcription program, an in vitro model of TGF-β1-induced
EMT in HaCaT cells (10) was used.
Firstly, the TGF-β1-induced phenotypic changes in HaCaT cells were
determined. The change in morphology from a paving stone-like
appearance to a spindle-shape was observed under a phase contrast
microscope (Fig. 1A). In addition,
F-actin staining indicated that well-aligned actin stress fibers
were formed as a result of TGF-β1 treatment (Fig. 1B). Western blot analysis was carried
out to examine the degree to which mesenchymal markers and
epithelial markers were expressed. The mesenchymal marker
fibronectin was substantially increased, whereas the epithelial
markers claudin 1, keratin 13 and keratin 15 were decreased in
EMT-induced HaCaT cells (18)
(P<0.05 or P<0.01; Fig. 1C).
However, no significant changes in the protein levels of N-cadherin
and E-cadherin were found (Fig.
1C). Our previous study revealed that the mRNA levels of the
EMT transcription factors SNAI2 and TWIST1 were increased by TGF-β1
in HaCaT cells (10). Hence, the
protein levels of these factors were evaluated by western blotting
in the present study. SNAI2, but not SNAI1, TWIST, or ZEB1, was
expressed in HaCaT cells, and its protein levels were significantly
increased by TGF-β1 treatment (P<0.01; Fig. 1D). The lysate of mouse embryonic
fibroblast-derived NIH3T3 cells was used as a positive control for
the protein expression of EMT transcription factors (19). In addition, immunocytochemical
staining demonstrated that SNAI2 was increased in the EMT-induced
HaCaT cells compared with the non-treated cells (Fig. 1E). These data suggested that TGF-β1
induced SNAI2 expression and partially promoted the EMT-related
alterations of epithelial and mesenchymal markers in HaCaT
cells.
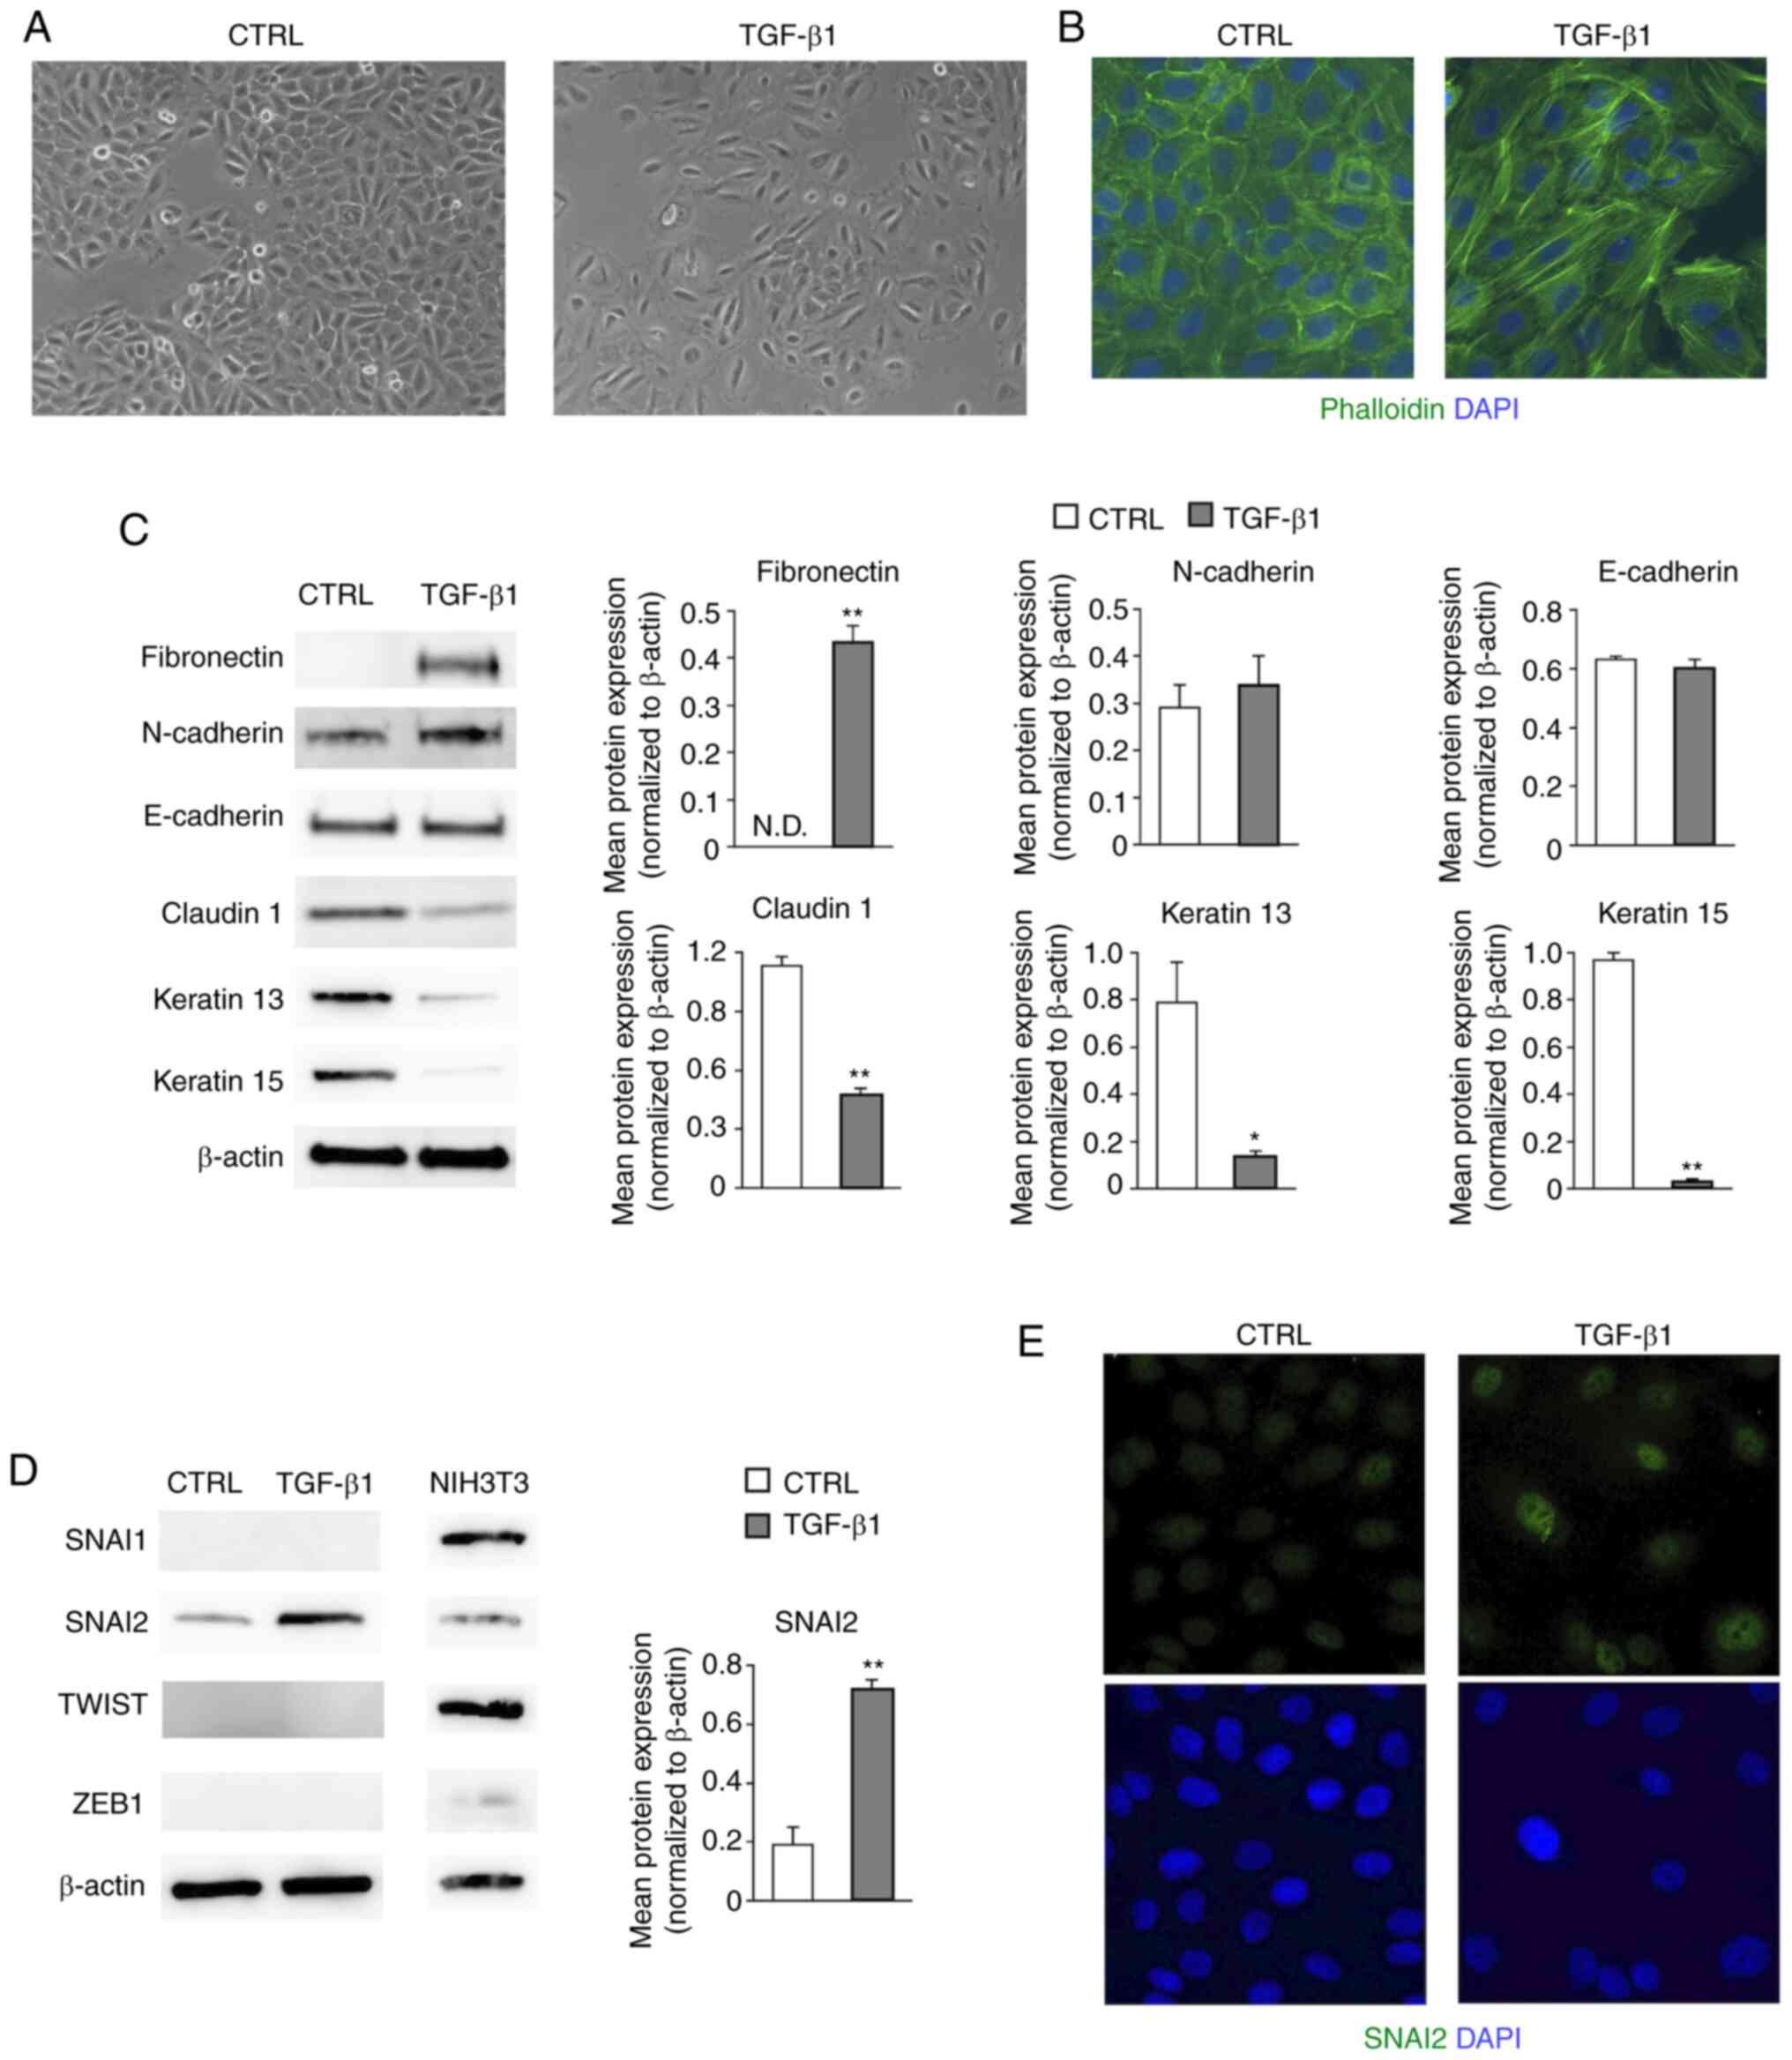 | Figure 1SNAI2 is increased in HaCaT cells
during TGF-β1-mediated EMT. (A) Changes in the cell morphology of
HaCaT cells were observed under a phase contrast microscope.
Representative images are shown (magnification, x100). (B) The
distribution of F-actin was visualized by staining with
fluorescence-conjugated phalloidin and the nuclei were labeled with
DAPI. Representative images are shown (magnification, x200). (C)
Changes in the mesenchymal markers (fibronectin and N-cadherin) and
the epithelial markers (E-cadherin, claudin1, keratin 13 and
keratin 15) were observed by western blotting. Representative
images are shown. Protein levels were quantified by calculating the
band intensity and normalized to the levels of β-actin. Data are
shown as the mean (bar) and SEM (whisker). *P<0.05,
**P<0.01. (D) Expression levels of EMT transcription
factors (SNAI1, SNAI2, TWIST1/2 and ZEB1) were analyzed by western
blotting. NIH3T3 cells were used for positive controls of each
antibodies. Representative images are shown. SNAI2 protein levels
were quantified by calculating the band intensity and normalized to
the levels of β-actin. Data are shown as the mean (bar) and SEM
(whisker). **P<0.01. (E) SNAI2 expression was
examined by immunofluorescence staining and nuclei were visualized
with DAPI staining. The representative images shown here were
obtained using a conventional fluorescence microscope
(magnification, x200). EMT, epithelial-mesenchymal transition;
SNAI2, Slug; ND, not detectable; TGF-β1, transforming growth
factor-β1; CTRL, control (non-treated); SNAI1, snail family
transcriptional repressor 1; ZEB1, zinc finger E-box binding
homeobox 1; TWIST 1/2, twist family bHLH transcription factor
1/2. |
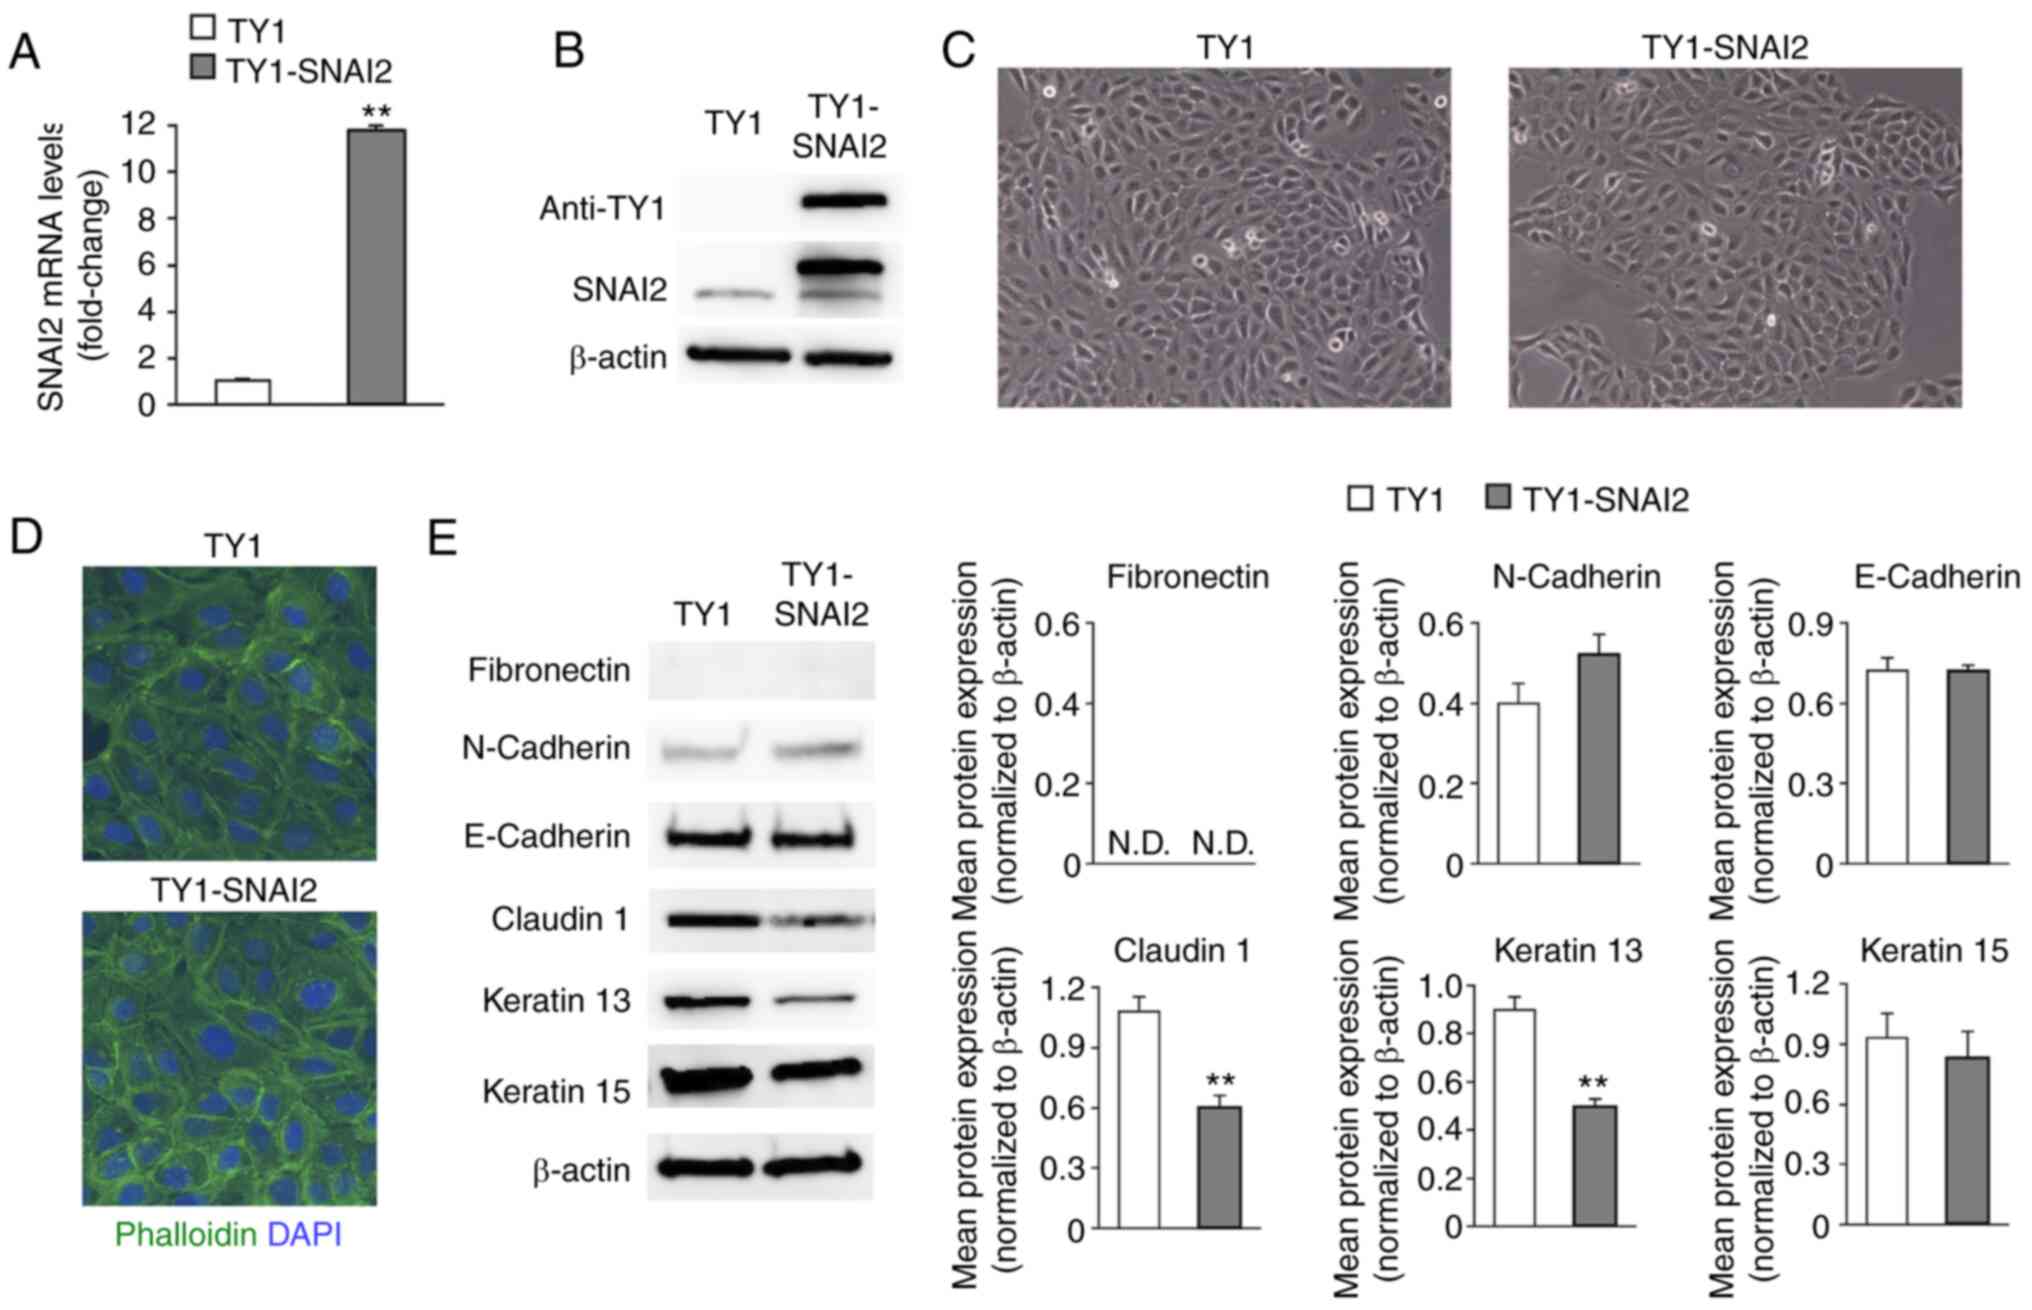
Overexpression or knockdown of SNAI2
has less impact on the phenotypic characteristics of HaCaT
cells
To investigate whether SNAI2 serves a critical role
in the TGF-β1-induced EMT of HaCaT cells, TY1-tagged
SNAI2-overexpressing HaCaT cells (TY1-SNAI2) were generated and the
enhanced expression of SNAI2 was confirmed by RT-qPCR and western
blotting (P<0.01; Fig. 2A and
B). There was no significant
difference in cell morphology, including cell shape and
cytoskeletal architecture, between SNAI2-overexpressing cells and
their corresponding control cells (TY1) (Fig. 2C and D). Subsequently, EMT-marker expression was
evaluated by western blotting. SNAI2-overexpression did not induce
the expression of fibronectin and no marked changes in the protein
levels of N-cadherin, E-cadherin, and keratin 15 were observed
(Fig. 2E). However, it was found
that both claudin 1, which is involved in epithelial cell-cell
adhesion, and keratin 13 cytoskeletal protein were decreased in the
SNAI2 overexpressing cells compared with the control cells
(20,21) (P<0.01; Fig. 2E).
Next, SNAI2-knockdown HaCaT cells (shSNAI2) were
created by using the shRNA expression system. The level of SNAI2
mRNA was reduced to 50% compared with the shNC (P<0.01; Fig. 3A). Cell morphology was not
significantly changed in the SNAI2-knockdown cells under the
control condition (Fig. 3B). Both
shNC and shSNAI2 cells were treated with TGF-β1 in order to
investigate the effect of SNAI2 knockdown on the EMT phenotype. The
same levels of EMT-related morphological change were induced by
TGF-β1 in both SNAI2-knockdown and control cells (Fig. 3B), and F-actin staining demonstrated
no significant difference between the two types of cells (Fig. 3C). Western blotting was performed to
examine the expression of SNAI2 and other EMT markers. As shown in
Fig. 3D, SNAI2 protein level was
effectively decreased and knockdown had a large impact on the
TGF-β1-induced expression of SNAI2. The protein levels of the
epithelial markers claudin 1, keratin 13 and keratin 15 were
increased in SNAI2-knockdown cells compared with control cells.
Furthermore, the protein levels of claudin 1 and keratin 15, but
not keratin 13, were downregulated by TGF-β1 (P<0.05 or
P<0.01; Fig. 3D). The induction
of fibronectin in response to TGF-β1 and the expression levels of
N-cadherin and E-cadherin were not significantly changed in either
group of cells (Fig. 3D). These
data suggested that SNAI2 affected a subset of the epithelial
markers but was unable to induce the EMT-related markers in HaCaT
cells. In addition, SNAI2 knockdown had less of an impact on the
TGF-β1-induced EMT.
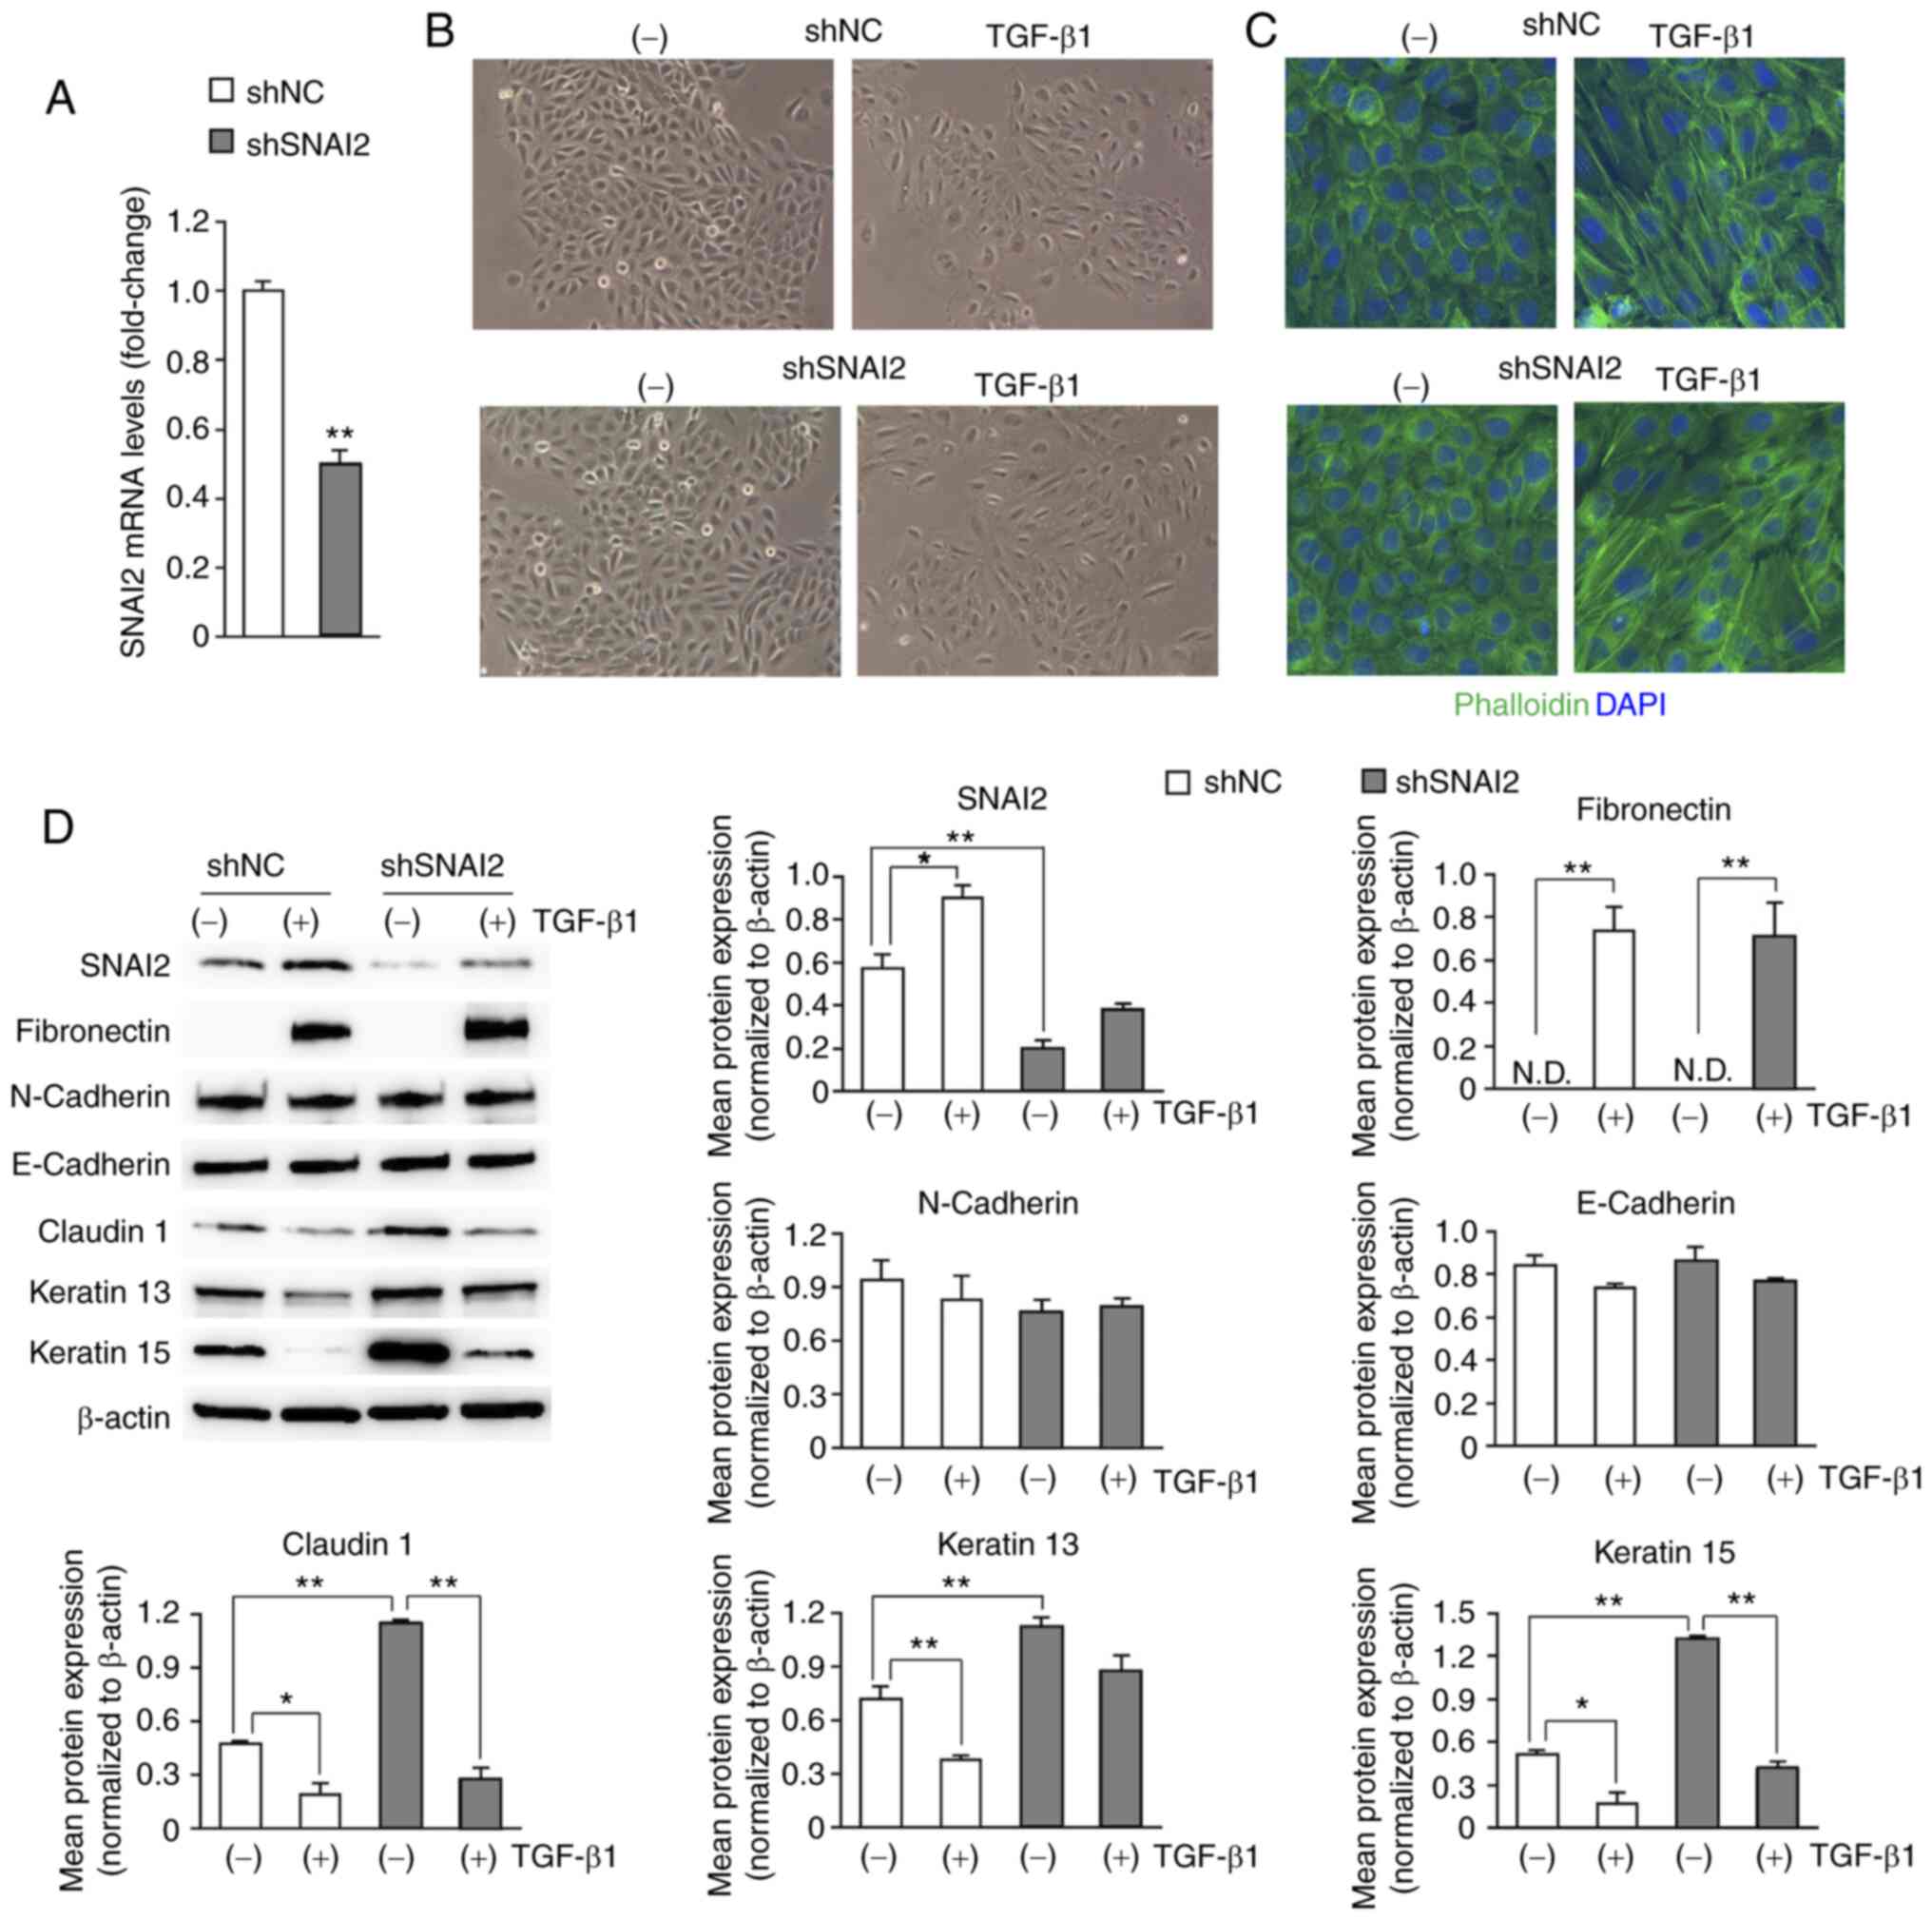 | Figure 3Knockdown of SNAI2 does not affect
the TGF-β1-induced EMT phenotype of HaCaT cells, compared with the
non-targeting control. (A) SNAI2 mRNA levels in shNC (as a control)
and shSNAI2 HaCaT cells were evaluated using RT-qPCR. The fold
change in mRNA levels was normalized to the levels of GAPDH and
calculated relative to that of control cells. Data are the mean
(bar) plus SEM (whisker). **P<0.01. (B) Cell
morphology of shNC and shSNAI2 HaCaT cells with or without TGF-β1
treatment were examined using a phase contrast microscope.
Representative images are shown (magnification, x100). (C)
Organization of F-actin was examined by staining with
fluorescence-conjugated phalloidin and the nuclei were labeled with
DAPI. Representative images are shown (magnification, x200). (D)
SNAI2, the mesenchymal markers (fibronectin and N-cadherin) and the
epithelial markers (E-cadherin, claudin1, keratin 13 and keratin
15) were analyzed by western blotting. Representative images are
shown. The protein levels were quantified by calculating the band
intensity and normalized to the levels of β-actin. Data are shown
as the mean (bar) and SEM (whisker). *P<0.05,
**P<0.01. N.D., not detectable; sh, short hairpin;
NC, negative control (non-targeting); RT-q, reverse
transcription-quantitative; TGF-β1, transforming growth
factor-β1. |
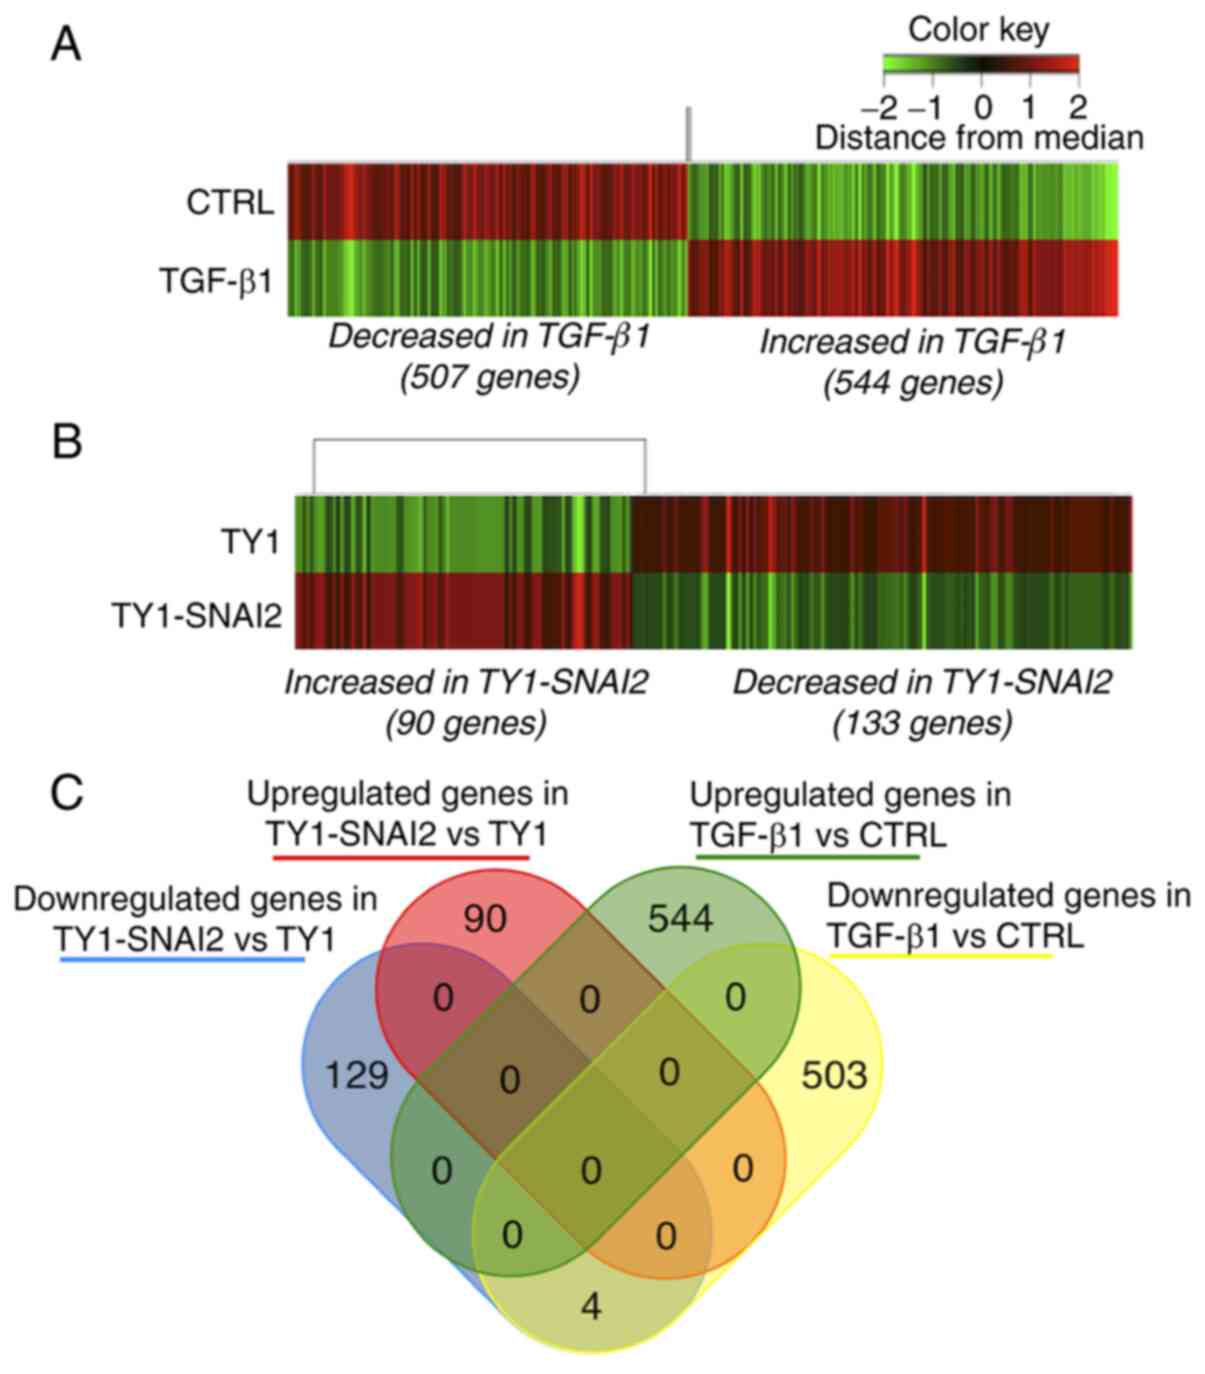
Identification of differentially
expressed genes
DNA microarray was performed to elucidate the
molecular mechanism underlying the difference between
TGF-β1-induced EMT and the directed overexpression of SNAI2. The
hierarchical clustering analysis demonstrated significant changes
in the gene expression profile of TGF-β1-treated HaCaT cells
compared with control cells (Fig.
4A). A total of 507 downregulated and 544 upregulated genes (a
2-fold change) were observed on TGF-β1 treatment (Fig. 4A). Hierarchical clustering also
revealed that induced expression of SNAI2 downregulated 133 genes
and upregulated 90 genes in HaCaT cells (Fig. 4B). In addition, it was investigated
whether SNAI2-induced transcriptomic changes overlapped with that
of TGF-β1-induced EMT in HaCaT cells. As demonstrated in Fig. 4C, four genes; RNF157-AS1 (RNF157
antisense RNA 1), SCGB1A1 (secretoglobin family 1A member 1), S100P
(S100 calcium binding protein P) and OLFM4 (olfactomedin 4) were
identified as commonly downregulated genes and no other overlap was
found. These data suggested that SNAI2 was not involved in the
transcription program of TGF-β1-induced EMT in HaCaT cells.
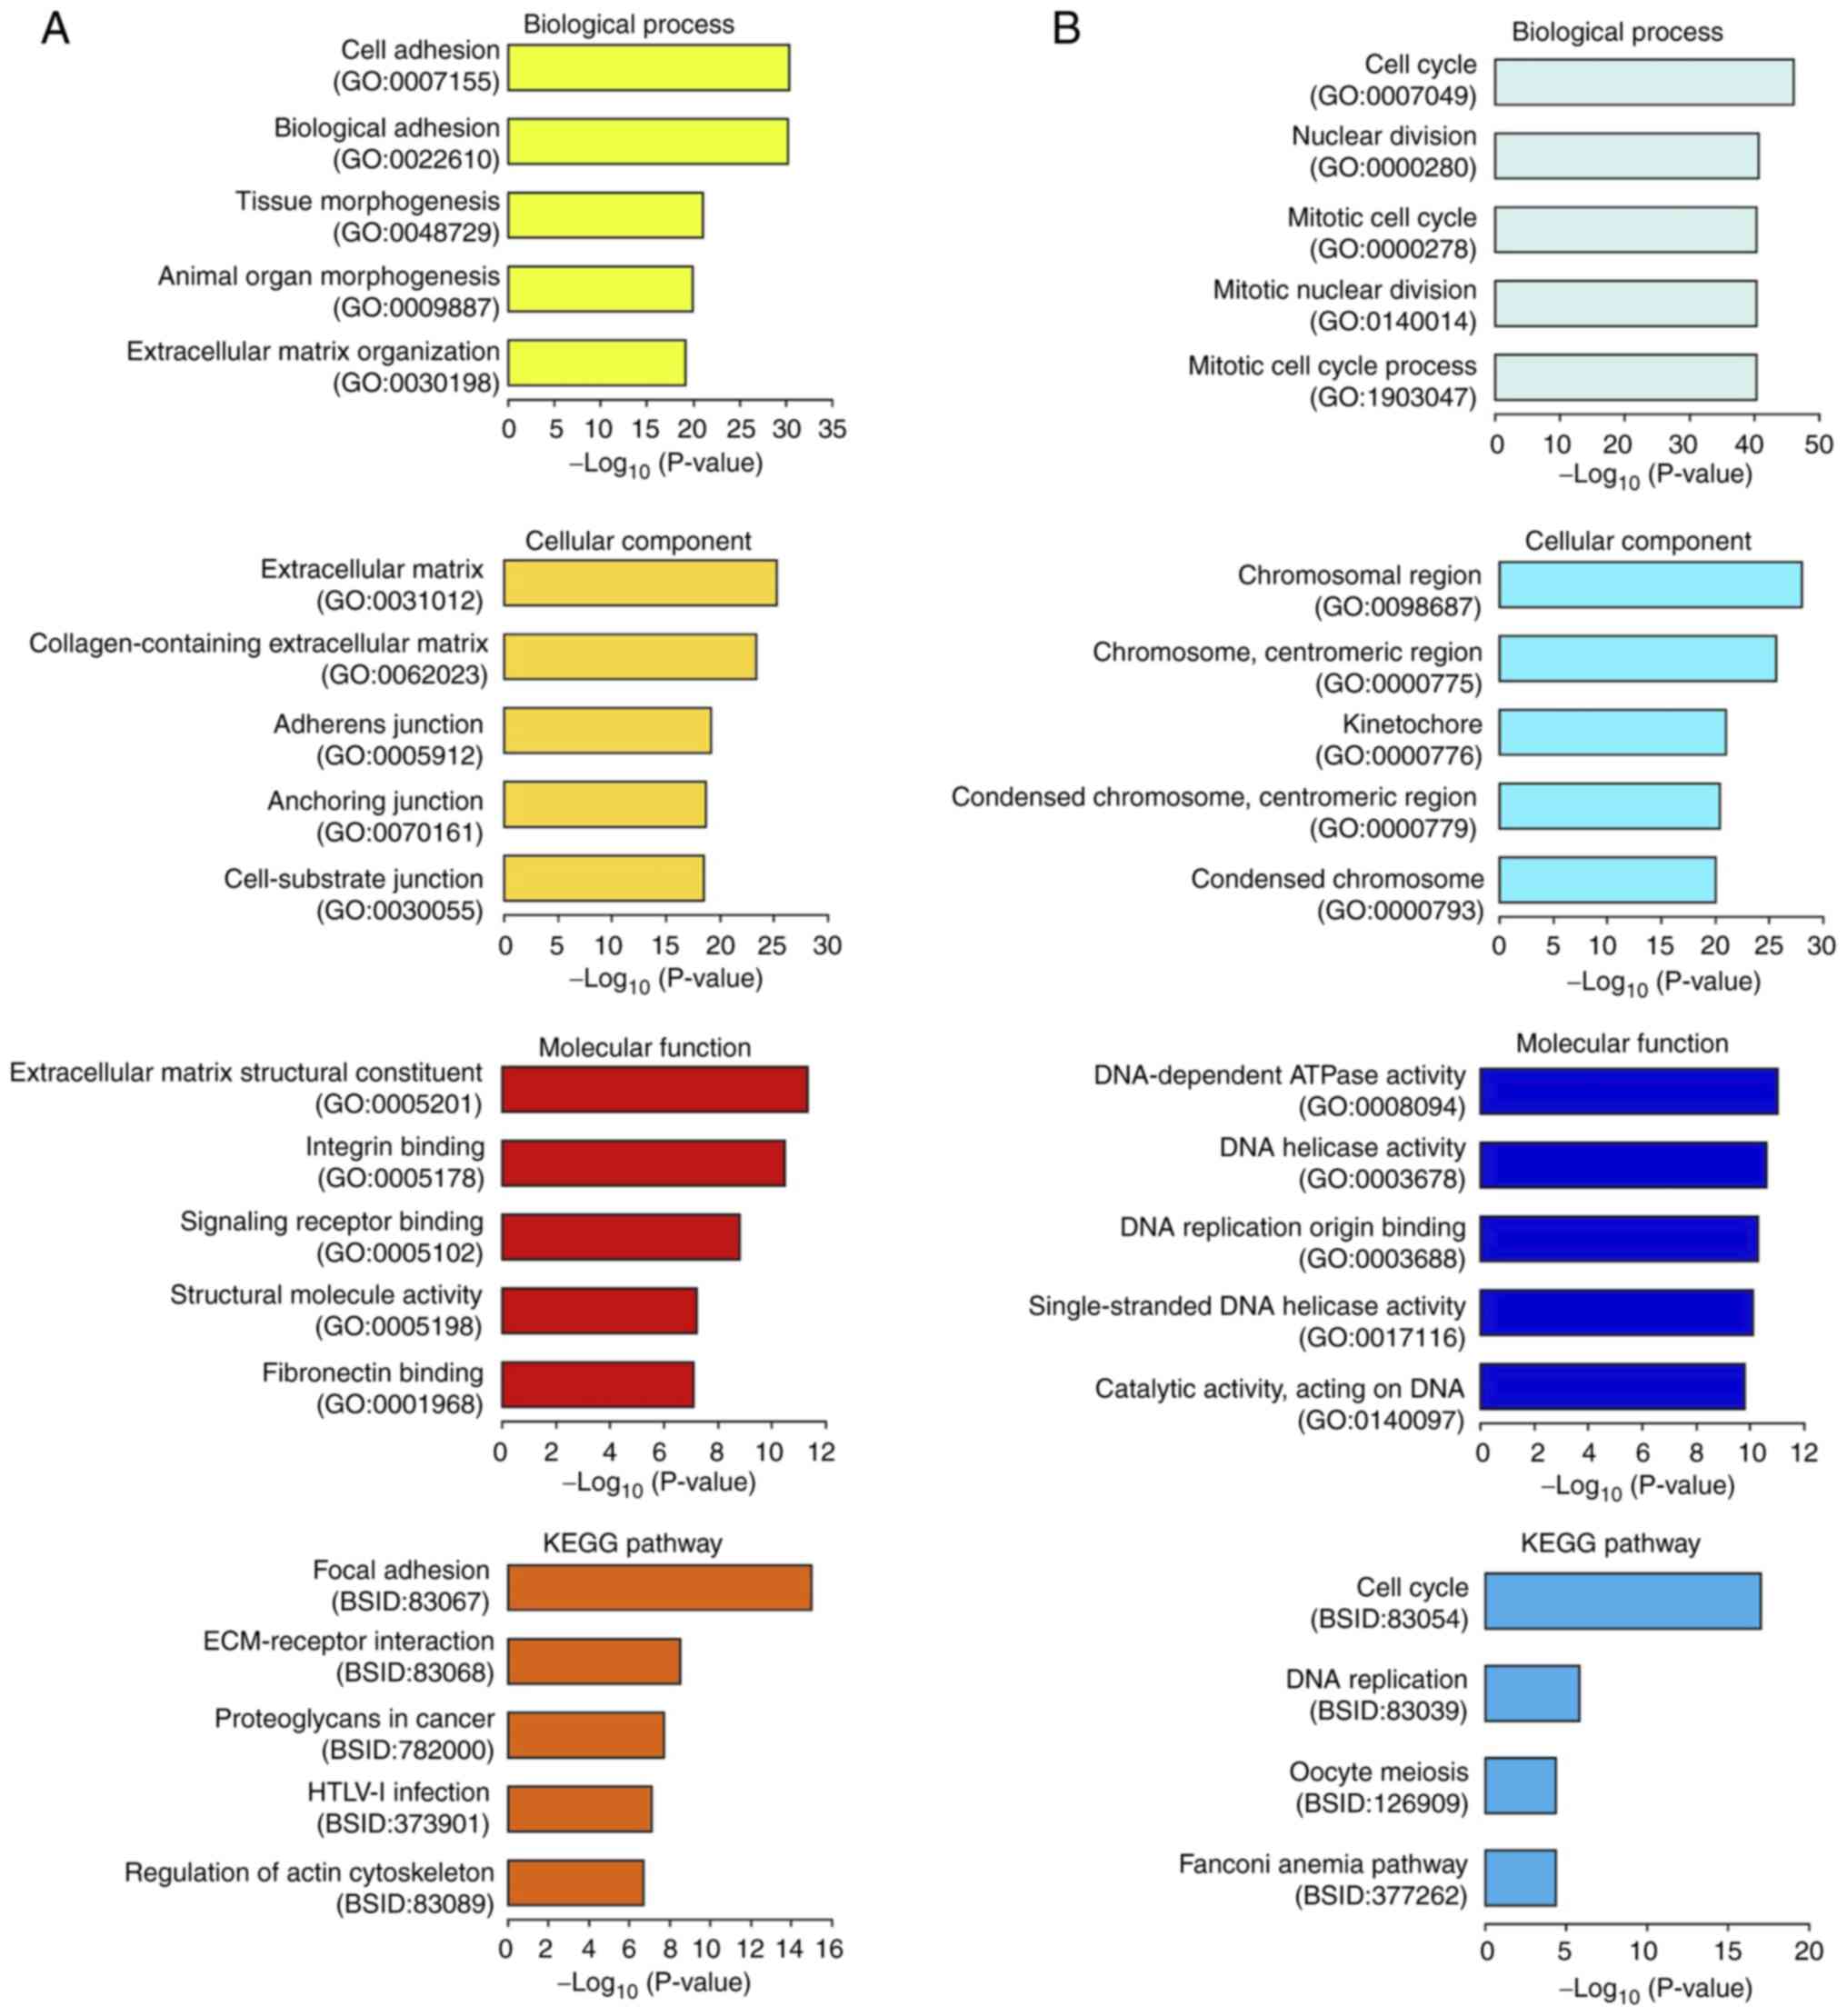
GO and KEGG pathway enrichment
analysis of differentially expressed genes
GO and KEGG pathway enrichment analyses were
performed to identify the biological attributes of differentially
expressed genes in TGF-β1-treated HaCaT cells and
SNAI2-overexpressing HaCaT cells. The top 5 enriched terms for the
544 genes upregulated by TGF-β1 treatment are shown in Fig. 5A. These genes were found to be
significantly enriched in biological processes, such as ‘cell
adhesion’ (GO:0007155), ‘tissue morphogenesis’ (GO:0048729) and
‘extracellular matrix (ECM) organization’ (GO:0030198), as well as
in cellular components, including ‘ECM’ (GO:0031012),
‘collagen-containing ECM’ (GO:0062023), ‘adherens junction’
(GO:0005912), ‘anchoring junction’ (GO:0070161) and ‘cell-substrate
junction’ (GO:0030055). In terms of molecular function, the
upregulated genes were enriched in ‘ECM structural constituent’
(GO:0005201), ‘integrin binding’ (GO:0005102), ‘signaling receptor
binding’ (GO:0005102), ‘structural molecule activity’ (GO:0005198)
and ‘fibronectin binding’ (GO:0001968). KEGG pathway analysis
revealed a strong association of the upregulated genes with
pathways, such as focal adhesion (BSID:83067), ECM-receptor
interaction (BSID:83068) and the regulation of actin cytoskeleton
(BSID:83089) (Fig. 5A). The top 5
downregulated GO terms and KEGG pathway results are illustrated in
Fig. 5B. The downregulated genes
were significantly enriched in biological processes, such as the
‘cell cycle’ (GO:0007049), ‘nuclear division’ (GO:0000280) and
‘mitosis’ (GO:0000278), in cellular components such as the
‘chromosome region’ (GO:0098687), and in molecular functions,
including several enzymatic activities associated with DNA.
Similarly, the KEGG pathway analysis revealed significant
enrichment of downregulated genes in the cell cycle (BSID:83054).
Although the GO and KEGG pathway enrichment analyses were performed
for 90 SNAI2-upregulated genes and 133 SNAI2-downregulated genes,
no significant GO terms or pathways were found in either the
upregulated or downregulated genes (data not shown). These results
suggested that TGF-β1 induced dynamic transcriptomic alterations,
which led to the EMT features in HaCaT cells.
Identification of transcription
factors regulating the differentially expressed genes
Finally, a transcription factor enrichment analysis
(ChEA3) was conducted to determine which transcription factors are
likely to regulate differentially expressed genes in TGF-β1-treated
HaCaT cells. The top 5 transcription factors responsible for the
expression of the TGF-β1-upregulated genes were identified as
transcription factor 12 (TCF12), nuclear factor I C (NFIC), GATA
binding protein 3 (GATA3), FOS like 2 (FOSL2), AP-1 transcription
factor subunit and TEA domain transcription factor 4 (TEAD4;
Fig. 6A). In addition, E2F
transcription factor 4 (E2F4), forkhead box M1 (FOXM1), interferon
regulatory factor 3 (IRF3), nuclear transcription factor Y subunit
β (NFYB) and nuclear transcription factor Y subunit α (NFYA) were
predicted to downregulate gene expression in response to TGF-β1
treatment (Fig. 6B). These data
suggest that multiple transcription factors are involved in the
transcription program of TGF-β1-induced EMT in HaCaT cells.
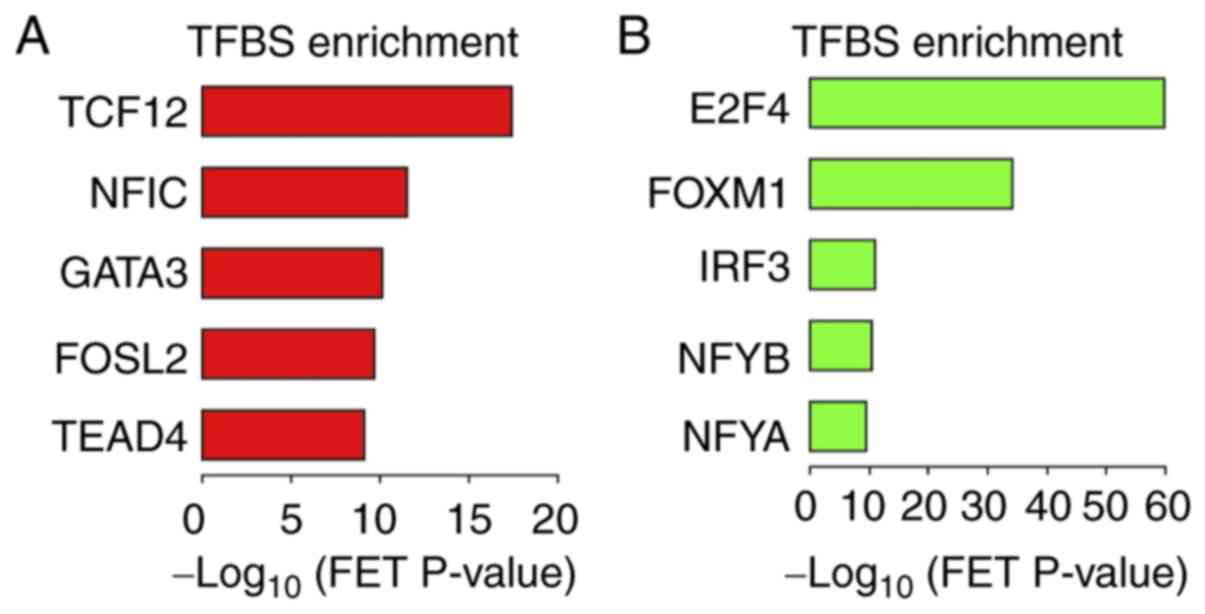 | Figure 6Transcription factor binding site
enrichment analysis of differentially expressed genes in HaCaT
cells treated with TGF-β1. Top 5 transcription factors associated
with (A) 544 upregulated genes and (B) 507 downregulated genes in
TGF-β1 treated HaCaT cells. Bars represent the negative
log10 of the FET P-value. TGF-β1, transforming growth
factor-β1; TFBS, transcription factor binding site; FET, Fisher's
exact test; TCF12, transcription factor 12; NFIC, nuclear factor I
C; GATA 3, GATA binding protein 3; FOSL2, FOS like 2, AP-1
transcription factor subunit; TEAD 4, TEA domain transcription
factor 4; E2F4, E2F transcription factor 4; FOXM1, forkhead box M1;
IRF3, interferon regulatory factor 3; NFYB, nuclear transcription
factor Y subunit β; NFYA, nuclear transcription factor Y subunit
α. |
Discussion
The EMT-associated transcription program is known to
be triggered by the induction of EMT transcription factors
(5). The present study demonstrated
that the levels of SNAI2 protein, but not other EMT transcription
factors were increased during EMT induced by TGF-β1 treatment in
HaCaT cells. SNAI2 has been known to stimulate keratinocyte
motility in response to the release of epidermal growth factor
signaling, as well as maintain the undifferentiated status of basal
cells in squamous epithelial tissues (6-8,22).
In addition, SNAI2 dysregulation has been linked to the progression
of oral tongue cancers and EMT in the oral squamous cell carcinoma
cells, such as SCC9 and UM1 cells (23). Hence, it was speculated that SNAI2
plays an important role in controlling the EMT-related gene
expression in HaCaT cells. In the present study,
SNAI2-overexpressing and -knockdown HaCaT cells were generated to
investigate how the phenotypic characteristics of HaCaT cells were
affected by SNAI2. The findings of this study revealed that unlike
TGF-β1 signaling, overexpressed SNAI2 is not able to induce EMT
features and is not needed to promote the EMT program induced by
TGF-β1 in HaCaT cells. However, the results demonstrated that the
epithelial markers claudin 1 and keratin 13 as well as the
transcription factor SNAI2 were reciprocally expressed in HaCaT
cells. It has been reported that keratin 13 is epigenetically
silenced by TGF-β1 in HaCaT cells (10); that study raised the possibility
that SNAI2 may serve a role in the regulatory mechanism of keratin
13 expression. Claudin 1 is a major component of tight junction
complexes in epithelial cells (20). Claudin 1 mRNA levels were not
changed by either SNAI2 overexpression or knockdown (data not
shown), it is possible that SNAI2 negatively regulates claudin 1 by
affecting its translation rate or protein stability. It is also
likely that SNAI2 plays different roles in a context-dependent
manner and participates in the modulation of epithelial traits, but
not the EMT program in non-transformed HaCaT cells.
This study investigated differentially expressed
genes in TGF-β1-treated HaCaT cells and SNAI2-overexpressing HaCaT
cells. Functional GO annotations and KEGG pathway analysis of genes
upregulated by TGF-β1-treatment clearly demonstrated enrichment of
gene sets associated with cell-matrix adhesions. The genes
downregulated by TGF-β1-treatment in this study were involved in
the cell cycle. These transcriptomic changes induced by
TGF-β1-treatment should be translated into phenotypic alterations
during EMT in HaCaT cells. However, no significant GO terms and
pathway were found in the differentially expressed genes of
SNAI2-overexpressing cells, which did not show EMT-like phenotypes.
In addition, there was almost no overlap of differentially
expressed genes between the TGF-β1-treated cells and the
SNAI2-overexpressing cells. These findings suggested that SNAI2 is
not involved in the transcriptional regulation of the
TGF-β1-induced EMT program in HaCaT cells. A previous study
reported that ETS proto-oncogene 2 transcription factor, hepatocyte
nuclear factor-4α, and JunB proto-oncogene AP-1 transcription
factor subunit, but not canonical EMT transcription factors such as
SNAI1/2, TWIST1/2, and ZEB1/2, cooperatively control TGF-β1-induced
EMT in human lung cancer A549 cells (24). Hence, in the present study, ChEA3
analysis using the lists of differentially expressed genes was
performed to identify candidates for master transcription factors
that regulate TGF-β1-induced EMT in HaCaT cells. As expected,
canonical EMT transcription factors were not listed as master
transcription factors responsible for the differentially expressed
genes. TCF12, NFIC, GATA3, FOSL2, and TEAD4 were identified as the
major regulators of the upregulated genes. TCF12 is a member of
basic helix-loop-helix (HLH) protein family and mutations in TCF12
have been linked to coronal craniosynostosis (25). NFIC, which belongs to the CTF/NF-I
family, has been reported to transcriptionally regulate the α6
integrin gene during corneal wound healing (26). GATA3 and FOSL2 have been reported to
regulate the differentiation process of keratinocytes (27,28).
TEAD4 is a transcription factor of Hippo pathway signaling involved
in the control of organ size and its overexpression has been
associated with tumor progression of head and neck squamous cell
carcinomas and EMT in cancer cell lines, such as Cal27 and Fadu
cells (29). In addition, E2F4,
FOXM1, IRF3, NFY and NFYA were identified as the major regulators
of the downregulated genes. E2F4 and FOXM1 have been reported to
regulate cell cycle genes, including MYC proto-oncogene bHLH
transcription factor, cyclin B1, cyclin dependent kinase inhibitor
1A, and to form complexes with the effector SMAD proteins
(Smad3/Smad4) to modulate the cellular response to TGF-β1 (30-33).
IRF3 is a transcription factor that serves an important role in the
innate immune response of cells, such as keratinocytes (34). NFYA and NFYB form complexes with
NFYC and bind to the CCAAT box motif of the target genes (35). NFYs have been found to regulate the
promoter activity of p63, which is a master regulator of epidermal
development (36). Although the
results of the present study suggest that the identified
transcription factors, but not the canonical EMT transcription
factors, control the TGF-β1-induced transcription program of HaCaT
cells in a cooperative manner, the functional roles of these
factors need to be experimentally validated. Moreover, it is
possible that additional undiscovered factors could be involved in
the regulation of gene expression and chromatin structure.
In conclusion, the present study demonstrated that
SNAI2 is not essential for TGF-β1-induced EMT in HaCaT cells and
that multiple transcription factors, but not canonical EMT
transcription factors, may cooperatively regulate the EMT-related
gene expression induced by TGF-β1. Although further studies are
required to clarify the understanding of molecular events in EMT,
the findings of the present study provide insights into the
molecular mechanisms underlying the EMT transcription program, and
the therapeutic target of EMT in diseases and pathological
conditions.
Acknowledgements
We thank Dr Kazuya Yamagata (Department of Medical
Biochemistry, Faculty of Life Sciences, Kumamoto University,
Kumamoto, Japan) for providing the pSIREN-RetroQ vector, Dr Tetsuro
Ikebe (Department of Oral and Maxillofacial Surgery, Fukuoka Dental
College, Fukuoka, Japan) for providing the HaCaT cells and Dr
Tsuyako Ohkubo (Educational Support and Institutional Research
Office, Fukuoka Nursing College, Fukuoka, Japan) for providing the
NIH3T3 cells.
Funding
Funding: This study was supported by JSPS KAKENHI (grant no.
JP17K11659).
Availability of data and materials
The datasets used and/or analyzed during the current
study are available from the corresponding author on reasonable
request.
Authors' contributions
YM and MH conceived and designed the study. YM, YN,
YT and MH performed the experiments. YM, YN, YT, KO, ST and MH
analyzed the data. YM and MH wrote the manuscript. YM and MH
confirm the authenticity of all the raw data All authors read and
approved the final manuscript.
Ethics approval and consent to
participate
Not applicable.
Patient consent for publication
Not applicable.
Competing interests
The authors declare that they have no competing
interests.
References
|
1
|
Hay ED: An overview of
epithelio-mesenchymal transition. Acta Anat (Basel). 154:8–20.
1995.PubMed/NCBI View Article : Google Scholar
|
|
2
|
Kalluri R and Weinberg RA: The basics of
epithelial-mesenchymal transition. J Clin Invest. 119:1420–1428.
2009.PubMed/NCBI View
Article : Google Scholar
|
|
3
|
Thiery JP, Acloque H, Huang RY and Nieto
MA: Epithelial-mesenchymal transitions in development and disease.
Cell. 139:871–890. 2009.PubMed/NCBI View Article : Google Scholar
|
|
4
|
Xu J, Lamouille S and Derynck R:
TGF-beta-induced epithelial to mesenchymal transition. Cell Res.
19:156–172. 2009.PubMed/NCBI View Article : Google Scholar
|
|
5
|
Lamouille S, Xu J and Derynck R: Molecular
mechanisms of epithelial-mesenchymal transition. Nat Rev Mol Cell
Biol. 15:178–196. 2014.PubMed/NCBI View
Article : Google Scholar
|
|
6
|
Kusewitt DF, Choi C, Newkirk KM, Leroy P,
Li Y, Chavez MG and Hudson LG: Slug/Snai2 is a downstream mediator
of epidermal growth factor receptor-stimulated reepithelialization.
J Invest Dermatol. 129:491–495. 2009.PubMed/NCBI View Article : Google Scholar
|
|
7
|
Arnoux V, Nassour M, L'Helgoualc'h A,
Hipskind RA and Savagner P: Erk5 controls Slug expression and
keratinocyte activation during wound healing. Mol Biol Cell.
19:4738–4749. 2008.PubMed/NCBI View Article : Google Scholar
|
|
8
|
Hudson LG, Newkirk KM, Chandler HL, Choi
C, Fossey SL, Parent AE and Kusewitt DF: Cutaneous wound
reepithelialization is compromised in mice lacking functional Slug
(Snai2). J Dermatol Sci. 56:19–26. 2009.PubMed/NCBI View Article : Google Scholar
|
|
9
|
Shaw TJ and Martin P: Wound repair: A
showcase for cell plasticity and migration. Curr Opin Cell Biol.
42:29–37. 2016.PubMed/NCBI View Article : Google Scholar
|
|
10
|
Hatta M, Miyake Y, Uchida K and Yamazaki
J: Keratin 13 gene is epigenetically suppressed during transforming
growth factor-β1-induced epithelial-mesenchymal transition in a
human keratinocyte cell line. Biochem Biophys Res Commun.
496:381–386. 2018.PubMed/NCBI View Article : Google Scholar
|
|
11
|
Livak KJ and Schmittgen TD: Analysis of
relative gene expression data using real-time quantitative PCR and
the 2(-Delta Delta C(T)) method. Methods. 25:402–408.
2001.PubMed/NCBI View Article : Google Scholar
|
|
12
|
Bolstad BM, Irizarry RA, Astrand M and
Speed TP: A comparison of normalization methods for high density
oligonucleotide array data based on variance and bias.
Bioinformatics. 19:185–193. 2003.PubMed/NCBI View Article : Google Scholar
|
|
13
|
Gentleman RC, Carey VJ, Bates DM, Bolstad
B, Dettling M, Dudoit S, Ellis B, Gautier L, Ge Y, Gentry J, et al:
Bioconductor: Open software development for computational biology
and bioinformatics. Genome Biol. 5(R80)2004.PubMed/NCBI View Article : Google Scholar
|
|
14
|
Quackenbush J: Microarray data
normalization and transformation. Nat Genet. (Suppl 32):S496–S501.
2002.PubMed/NCBI View
Article : Google Scholar
|
|
15
|
Saeed AI, Sharov V, White J, Li J, Liang
W, Bhagabati N, Braisted J, Klapa M, Currier T, Thiagarajan M, et
al: TM4: A free, open-source system for microarray data management
and analysis. Biotechniques. 34:374–378. 2003.PubMed/NCBI View Article : Google Scholar
|
|
16
|
Chen J, Bardes EE, Aronow BJ and Jegga AG:
ToppGene Suite for gene list enrichment analysis and candidate gene
prioritization. Nucleic Acids Res. 37:W305–W311. 2009.PubMed/NCBI View Article : Google Scholar
|
|
17
|
Keenan AB, Torre D, Lachmann A, Leong AK,
Wojciechowicz ML, Utti V, Jagodnik KM, Kropiwnicki E, Wang Z and
Ma'ayan A: ChEA3: Transcription factor enrichment analysis by
orthogonal omics integration. Nucleic Acids Res. 47:W212–W224.
2019.PubMed/NCBI View Article : Google Scholar
|
|
18
|
Zeisberg M and Neilson EG: Biomarker for
epithelial-mesenchymal transitions. J Clin Invest. 119:1429–1437.
2009.PubMed/NCBI View
Article : Google Scholar
|
|
19
|
Jainchill JL, Aaronson SA and Todaro GJ:
Murine sarcoma and leukemia viruses: Assay using clonal lines of
contact-inhibited mouse cells. J Virol. 4:549–553. 1969.PubMed/NCBI View Article : Google Scholar
|
|
20
|
Krause G, Winkler L, Mueller SL, Haseloff
RF, Piontek J and Blasig IE: Structure and function of claudins.
Biochim Biophys Acta. 1778:631–645. 2008.PubMed/NCBI View Article : Google Scholar
|
|
21
|
Moll R, Divo M and Langbein L: The human
keratins: Biology and pathology. Histochem Cell Biol. 129:705–733.
2008.PubMed/NCBI View Article : Google Scholar
|
|
22
|
Mistry DS, Chen Y, Wang Y, Zhang K and Sen
GL: SNAI2 controls the undifferentiated state of human epidermal
progenitor cells. Stem Cells. 32:3209–3218. 2014.PubMed/NCBI View Article : Google Scholar
|
|
23
|
Wang C, Liu X, Huang H, Ma H, Cai W, Hou
J, Huang L, Dai Y, Yu T and Zhou X: Deregulation of Snai2 is
associated with metastasis and poor prognosis in tongue squamous
cell carcinoma. Int J Cancer. 130:2249–2258. 2012.PubMed/NCBI View Article : Google Scholar
|
|
24
|
Chang H, Liu Y, Xue M, Liu H, Du S, Zhang
L and Wang P: Synergistic action of master transcription factors
controls epithelial-to-mesenchymal transition. Nucleic Acids Res.
44:2514–2527. 2016.PubMed/NCBI View Article : Google Scholar
|
|
25
|
Sharma VP, Fenwick AL, Brockop MS, McGowan
SJ, Goos JA, Hoogeboom AJ, Brady AF, Jeelani NO, Lynch SA, Mulliken
JB, et al: Mutations of TCF12, encoding a basic helix-loop-helix
partner of TWIST1, are a frequent cause of coronal
craniosynostosis. Nat Genet. 45:304–307. 2013.PubMed/NCBI View
Article : Google Scholar
|
|
26
|
Gaudreault M, Vigneault F, Gingras ME,
Leclerc S, Carrier P, Germain L and Guérin SL: Transcriptional
regulation of the human alpha6 integrin gene by the transcription
factor NFI during corneal wound healing. Invest Ophthalmol Vis Sci.
49:3758–3767. 2008.PubMed/NCBI View Article : Google Scholar
|
|
27
|
Masse I, Barbollat-Boutrand L, Kharbili
ME, Berthier-Vergnes O, Aubert D and Lamartine J: GATA3 inhibits
proliferation and induces expression of both early and late
differentiation markers in keratinocytes of the human epidermis.
Arch Dermatol Res. 306:201–208. 2014.PubMed/NCBI View Article : Google Scholar
|
|
28
|
Wurm S, Zhang J, Guinea-Viniegra J, García
F, Muñoz J, Bakiri L, Ezhkova E and Wagner EF: Terminal epidermal
differentiation is regulated by the interaction of Fra-2/AP-1 with
Ezh2 and ERK1/2. Genes Dev. 29:144–156. 2015.PubMed/NCBI View Article : Google Scholar
|
|
29
|
Zhang W, Li J, Wu Y, Ge H, Song Y, Wang D,
Yuan H, Jiang H, Wang Y and Cheng J: TEAD4 overexpression promotes
epithelial-mesenchymal transition and associates with
aggressiveness and adverse prognosis in head neck squamous cell
carcinoma. Cancer Cell Int. 18(178)2018.PubMed/NCBI View Article : Google Scholar
|
|
30
|
Chen CR, Kang Y, Siegel PM and Massagué J:
E2F4/5 and p107 as Smad cofactors linking the TGFbeta receptor to
c-myc repression. Cell. 110:19–32. 2002.PubMed/NCBI View Article : Google Scholar
|
|
31
|
Yagi K, Furuhashi M, Aoki H, Goto D,
Kuwano H, Sugamura K, Miyazono K and Kato M: c-myc is a downstream
target of the Smad pathway. J Biol Chem. 277:854–861.
2002.PubMed/NCBI View Article : Google Scholar
|
|
32
|
Laoukili J, Kooistra MR, Brás A, Kauw J,
Kerkhoven RM, Morrison A, Clevers H and Medema RH: FoxM1 is
required for execution of the mitotic programme and chromosome
stability. Nat Cell Biol. 7:126–136. 2005.PubMed/NCBI View
Article : Google Scholar
|
|
33
|
Xue J, Lin X, Chiu WT, Chen YH, Yu G, Liu
M, Feng XH, Sawaya R, Medema RH, Hung MC, et al: Sustained
activation of SMAD3/SMAD4 by FOXM1 promotes TGF-β-dependent cancer
metastasis. J Clin Invest. 124:564–579. 2014.PubMed/NCBI View
Article : Google Scholar
|
|
34
|
Hiscott J: Triggering the innate antiviral
response through IRF-3 activation. J Biol Chem. 282:15325–15329.
2007.PubMed/NCBI View Article : Google Scholar
|
|
35
|
Ly LL, Yoshida H and Yamaguchi M: Nuclear
transcription factor Y and its roles in cellular processes related
to human disease. Am J Cancer Res. 3:339–346. 2013.PubMed/NCBI
|
|
36
|
Romano RA, Birkaya B and Sinha S: Defining
the regulatory elements in the proximal promoter of DeltaNp63 in
keratinocytes: Potential roles for Sp1/Sp3, NF-Y, and p63. J Invest
Dermatol. 126:1469–1479. 2006.PubMed/NCBI View Article : Google Scholar
|