Introduction
Neurofibromatosis type I (NF1) is an autosomal
dominant genetic disorder caused by mutations in the NF1
gene (1-3).
The reported incidence of NF1 varies from 1/2,500 to 1/3,500
individuals worldwide (1-3).
The clinical manifestations of NF1 are varied and include
cafe-au-lait spots, hamartomas of the iris and skeletal
abnormalities (2,4). It has been reported that 50% patients
with NF1 have associated skeletal abnormalities, including long
bone dysplasia, sphenoid wing dysplasia, scoliosis and congenital
pseudarthrosis of the tibia (5,6).
Although mutations in the neurofibromin
(NF1) gene are considered to be the primary cause of the
occurrence of NF1 (1,7), the mechanism underlying the formation
of skeletal abnormalities associated with NF1 is still not
fully understood. The NF1 gene encodes a Ras GTPase that
consists of 2,818 amino acids (1).
Mutations in NF1 lead to the functional deficiency of
neurofibromin and hyperactivation of p21-Ras (1,7). In
addition, NF1 has been documented to regulate bone mesenchymal stem
cell, neuronal, and glial cell proliferation, differentiation and
survival (1).
Previous studies have demonstrated the existence of
significantly impaired osteogenic differentiation in human bone
mesenchymal stem cells (BMSCs) in patients with NF1-associated
skeletal abnormalities (8,9). Furthermore, abnormal osteoblast
differentiation and proliferation have been reported to occur due
to the loss of NF1 function (10-12).
A previous study showed that the NF1 gene can modulate the
proliferation and osteogenic differentiation of BMSCs (13). In addition, it has been demonstrated
that inhibiting the expression of NF1 can activate mTOR
complex 1 (mTORC1) signaling and subsequently inhibit the
osteogenic differentiation of BMSCs (13).
Autophagy is an evolutionarily conserved adaptive
response that takes part in numerous physiological and pathological
processes (14). Previous studies
have reported that autophagy serves an important role in the
osteogenic differentiation of BMSCs (15,16).
The PI3K/AKT/mTOR pathway is an important signaling pathway that is
involved in the regulation of signal transduction and biological
processes, such as cell proliferation, differentiation, apoptosis,
metabolism and angiogenesis (17).
The PI3K/AKT/mTOR pathway is also considered to be a classical
signaling pathway for autophagy activation (18), such that mTORC1 is the main
gatekeeper to autophagy that connects environmental cues to
metabolic processes in order to preserve cellular homoeostasis
(19). In a recent study, Tan et
al (20) revealed that
overexpression of NF1 gene enhanced the osteogenic
differentiation of BMSCs by promoting autophagy and that mTORC1
signaling was involved in this process. However, this previous
study only established NF1-overexpression BMSC models, which
is different from the clinical situation in patients with
NF1, where the function of the NF1 gene is typically
insufficient (20). Therefore, a
cell model with the inhibited expression of NF1 would
simulate the pathological conditions of NF1 more closely
compared with one modeling the overexpression of NF1.
The present study established cell models of BMSCs
that with reduced NF1 expression or overexpressed
NF1, similar to the protocol followed in a previous study
(13). To investigate the effect of
autophagy on the osteogenic differentiation of BMSCs, a classical
autophagy inhibitor 3-methyladenine (3-MA) and a specific mTOR
inhibitor rapamycin (RAPA), were used. The aims of the present
study were as follows: i) To evaluate the effect of NF1 on
the autophagy of BMSCs; ii) to investigate the effect of autophagy
on NF1-modulated osteogenic differentiation of BMSCs; and
iii) to verify the effect of the PI3K/AKT/mTOR signaling pathway on
NF1-mediated regulation of BMSC autophagy.
Materials and methods
Culture of human BMSCs
BMSCs were purchased from the American Type Culture
Collection (cat. no. CRL-3421). They were cultured in Human Bone
Marrow Mesenchymal Stem Cell Basal Medium (Cyagen Biosciences,
Inc.) supplemented with 10% qualified FBS (Takara Bio, Inc.), 10%
glutamine and 10% penicillin-streptomycin at 37˚C in a humidified
atmosphere with 5% CO2 for 14 days (13). The standard procedure to induce
osteogenic differentiation of BMSCs is by culturing cells in Human
Mesenchymal Stem Cell Osteogenic Differentiation Basal Medium
(Cyagen Biosciences, Inc.) containing 10% FBS (Takara Bio, Inc.),
0.2% ascorbate acid (Shanghai Aladdin Biochemical Technology Co.,
Ltd.), 0.01% dexamethasone (Shanghai Aladdin Biochemical Technology
Co., Ltd.), 1% glutamine, 100 units of penicillin/streptomycin and
1% β-glycerophosphate sodium (13).
Cell transfection and treatment
BMSC models with inhibited or overexpressed
NF1 were established using a method similar to that used by
a previous study (13). Briefly, a
small interfering RNA (siRNA) targeting NF1 and a negative
control (NC) siRNA (non-targeting sequence) were purchased from
Shanghai GenePharma Co., Ltd. The siRNA targeting sequences were as
follows: NF1-siRNA, 5'-ACATACCAAAGTCAGTACT-3'; and NC-siRNA,
5'-AACAAGATGAAGAGCACCA-3'. Human BMSCs were grown in 6/12-well
culture plates until ~80% confluence, then transfected with 100 nm
siRNA-NF1 or NC-siRNA for 48 h at 37˚C using
Lipofectamine® 2000 (Invitrogen; Thermo Fisher
Scientific, Inc.). Human NF1 cDNA was amplified by PCR and
inserted into pcDNA3.0 (NF1-pcDNA3.0; Invitrogen; Thermo
Fisher Scientific, Inc.). Then NF1-pcDNA3.0 (1/2 µg) or
pcDNA3.0 (1/2 µg) was transfected into BMSCs using
Lipofectamine® 2000 in accordance with the
manufacturer's protocol. Twenty-four hours later, the transfected
cells were divided into the following four groups: NC-siRNA,
NF1-siRNA, pcDNA3.0 and NF1-pcDNA3.0. Additionally, a
control group was established containing untransfected BMSCs. The
transfected BMSCs were treated with 50 nM RAPA (cat. no. AY 22989;
MedChemExpress) or 5 mM 3-MA (cat. no. S2767-1; Selleck Chemicals)
for 24 h at 37˚C for the detection of autophagy and associated
pathways. The concentrations used in the present study were based
on those used in previous studies (21,22).
In addition, osteogenic differentiation experiments were conducted
on day 14 following transfection.
RNA extraction and reverse
transcription-quantitative PCR (RT-qPCR)
Following transfection and differentiation on day
14, total RNA was isolated from cultured cells using
TRIzol® reagent (Invitrogen; Thermo Fisher Scientific,
Inc.) according to the manufacturer's instructions. Gene expression
levels were measured in a real-time PCR detection system (Bio-Rad
Laboratories, Inc.) by SYBR® Green (Bio-Rad
Laboratories, Inc.) detection. Briefly, the extracted RNA was
reverse transcribed in the presence of a poly (A) polymerase with
an oligo-dT adaptor, using the PrimeScript™ RT Reagent kit with
gDNA Eraser (Perfect Real Time; cat. no. RR047A; Takara Bio, Inc.),
according to the manufacturer's protocol. The thermocycling
conditions were as follows: 42˚C for 2 min; followed by 37˚C for 15
min and 85˚C for 5 sec. The expression of NF1, runt-related
transcription factor 2 (Runx2), alkaline phosphatase (ALP) and
Osterix were quantified by qPCR using TB Green® Fast
qPCR Mix (cat. no. RR430; Takara Bio, Inc.). Thermocycling
conditions were as follows: Initial denaturation at 95˚C for 15
min; followed by 40 cycles of 95˚C for 15 sec, annealing 50-60˚C
for 30 sec, 72˚C for 30 sec; followed by final extension at 72˚C
for 7 min. GAPDH was used as the internal control. The PCR primers
are listed in Table I. The Cq value
obtained for the gene of interest was normalized to that of the
housekeeping gene GAPDH to obtain the ΔCq value. The ΔΔCq value was
then obtained by subtracting the ΔCq value for each gene of
interest from the ΔCq value for the control sample. The results
were calculated using the equation RQ=2-ΔΔCq, where RQ
is the relative quantity and is expressed as the fold-change
relative to the corresponding gene expression level in the control
sample (23).
 | Table IPrimers used in the present
study. |
Table I
Primers used in the present
study.
| ID | Orientation | Sequence
(direction, 5'-3') |
|---|
| NF1 | F |
GTATTGAATTGAAGCACCTTTGTTTGG |
| NF1 | R |
CTGCCCAAGGCTCCCCCAG |
| ALP | F |
CCAACTCTTTTGTGCCAGAGA |
| ALP | R |
GGCTACATTGGTGTTGAGCTTTT |
| Runx2 | F |
GACTGTGGTTACCGTCATGGC |
| Runx2 | R |
ACTTGGTTTTTCATAACAGCGGA |
| Osterix | F | ACCTACCC
ATCTGACTTTGCTC |
| Osterix | R |
CTGCCCACTATTTCCCACTG |
| GAPDH | F |
AGGTCGGTGTGAACGGATTTG |
| GAPDH | R |
GGGGTCGTTGATGGCAACA |
Western blotting
Transfected and treated BMSC proteins were extracted
using lysis buffer containing 50 mM Tris (pH 7.6), 150 mM NaCl, 1%
Triton X-100, 1% deoxycholate, 0.1% SDS, 1 mM PMSF and 0.2%
aprotinin (Beyotime Institute of Biotechnology). A BCA™ Protein
Assay kit (Pierce; Thermo Fisher Scientific, Inc.) was used for
quantification of protein samples. Equal amounts of protein samples
(30 µg per lane) were separated on 15% SDS-PAGE gels and
transferred onto PVDF membranes. After blocking in 5% BSA serum
(Roche Diagnostics GmbH) for 1 h at 37˚C, the blocked membranes
were incubated with the corresponding primary antibodies overnight
at 4˚C. The membranes were then washed in Tris-buffered saline
(Tris 20 mM, NaCl 137 mM, pH 7.6) containing 0.1% Tween-20 (TBST;
cat. no. P2287; Sigma-Aldrich; Merck KgaA) three times and
incubated for 1 h at room temperature with appropriate secondary
antibodies conjugated to horseradish peroxidase (HRP). The
membranes were incubated with ECL reagent (Immun-Star HRP Substrate
kit; cat. no. 1705040; Bio-Rad Laboratories, Inc.). The signals
were then visualized and analyzed using Image Lab™ software 5.2
(Bio-Rad Laboratories, Inc.). For the present study, primary
antibodies against NF1 (1:1,000; cat. no. ab128054; Abcam),
Beclin-1 (1:1,000; cat. no. ab210498; Abcam), p62 (1:1,000; cat.
no. ab109012; Abcam), LC3BI/II (1:1,000; cat. no. ab192890; Abcam),
GAPDH (1:1,000; cat. no. ab8245; Abcam), ALP (1:1,000; cat. no.
ab229126; Abcam), Runx2 (1:1,000; cat. no. ab236639; Abcam) and
Osterix (1:1,000; cat. no. ab209484; Abcam) were used. Antibodies
against phosphorylated (p)-mTOR (1:1,000; cat. no. 5536; Cell
Signaling Technology), total (t)-mTOR (1:1,000; cat. no. 2983; Cell
Signaling Technology), p-p70S6 kinase (p70S6K; 1:1,000; cat. no.
9204; Cell Signaling Technology), t-p70S6K (1:1,000; cat. no. 2708;
Cell Signaling Technology), AKT (1:1,000; cat. no. 9272; Cell
Signaling Technology), p-AKT (1:1,000; cat. no. 4060; Cell
Signaling Technology), PI3K (1:1,000; cat. no. 4249; Cell Signaling
Technology) and p-PI3K (1:1,000; cat. no. 17366; Cell Signaling
Technology) were also used. HRP-conjugated anti-mouse IgG (1:5,000;
cat. no. ab6728; Abcam) and HRP-conjugated anti-rabbit IgG
(1:5,000; cat. no. ab6721; Abcam) were used as secondary
antibodies.
Acridine orange (AO) staining
After conditioning, BMSCs were harvested and
suspended in PBS at 1x10⁶ cells/ml. Next, 95 µl of this
cell suspension was considered and 5 µl AO staining solution
(Sigma-Aldrich; Merck KGaA) was added. The reaction was allowed to
proceed for 10 min in the dark at room temperature. Subsequently, 5
ml PBS was added and the suspension was then centrifuged on a
conventional centrifuge at 150 x g at room temperature for 5 min.
The supernatant was then discarded and washed twice with PBS. The
cells suspended in PBS were pipetted onto slides and sealed with
cover glass. Autophagy was visualized under a fluorescence
microscope (magnification, x40; Leica DMIRB; Leica Microsystems
GmbH).
Autophagic flux/lysosomal
detection
To track and observe the formation of autophagosomes
and autophagic flux, 1x10⁶ cells/ml were grown to ~80%
confluence, infected with Ad-GFP-LC3B (cat. no. C3006; Beyotime
Institute of Biotechnology) at 7 log10 PFU/ml for 24 h
and cultured in a 6-well plate on cover glass to monitor autophagy
flux. Furthermore, the slides were washed with PBS and 3%
paraformaldehyde was added into each well. The plate was then
placed in the dark for 20 min at room temperature. The slides were
washed three times with PBS before 2 ml PBS was then added to each
well. The plate was incubated with shaking at room temperature for
10 min. The coverslips were mounted with an anti-fade mounting
solution (cat. no. P0126; Beyotime Institute of Biotechnology) and
dried for 1 min at room temperature. Subsequently, the slides were
observed with a fluorescence microscope (magnification, x40; Leica
DMIRB; Leica Microsystems GmbH). During this procedure, GFP-LC3 was
combined with autophagosomes, and detected using fluorescence
microscopy. Under the fluorescence microscope, the GFP-LC3 combined
autophagosomes were indicated by granular green fluorescence.
ALP staining
BMSCs were inoculated into a 12-well culture plate
at a density of 1x10⁴ cells per well at 37˚C in 5%
CO2. After 24 h, the medium was replaced with the
osteogenic induction medium (cat. no. CTCC-Y001, PH Biomedicine)
and cultured at 37˚C in 5% CO2. The medium was changed
every 2-3 days and removed after 14 days. The cells were washed
twice with PBS and fixed with 4% paraformaldehyde for 30 min at
room temperature. The paraformaldehyde was then removed and the
cells were washed three times with ddH2O and an ALP
staining solution (Shanghai Gefan Biotechnology Co., Ltd.) was
added for 30 min at room temperature. The ALP staining solution was
removed, the cells were washed three times with ddH2O
and visualized under a microscope (magnification, x40; Leica DMIRB;
Leica Microsystems GmbH); in addition, images were captured.
Alizarin red staining
BMSCs were cultured with osteogenic induction medium
for 14 days before examination of Alizarin red staining. The
culture medium was discarded and the cells (1x10⁶) were
fixed with 4% paraformaldehyde for 15-20 min at room temperature,
following which they were washed three times with PBS. Alizarin red
staining solution (ScienCell Research Laboratories, Inc.) was
prepared in advance and was added to the culture plate and placed
in the incubator for 15 min at room temperature. The staining
solution was then discarded, the plate was washed three times with
PBS solution and placed under a differential interference contrast
microscope (magnification, x40; Leica DMIRB; Leica Microsystems
GmbH) to capture images.
Transmission electron microscopy
BMSCs were cultured in 6-well plates and transfected
with NF1-pcDNA3.0 for 48 h, and then collected and fixed
with a mixture of 2.5% glutaraldehyde and 1% acetic acid for 2 h at
room temperature. Samples were then processed following a standard
protocol (24). Briefly, samples
were dehydrated using ethanol, stained for 2 h using uranyl acetate
and alkaline lead citrate at room temperature, embedded using Epon
resin at 37˚C overnight, and cut into 500 nm-thick sections using
an automatic microwave sample processor (Leica EM AMW; Leica
Microsystems GmbH) at room temperature. Observation and imaging
were then performed by using a JEM-1400 transmission electron
microscope (JEOL, Ltd.).
Statistical analysis
All experiments were repeated ≥ three times. The
results are expressed as the mean ± standard deviation. Data were
processed using the SPSS 10.0 statistical software (SPSS, Inc.).
For between-group comparisons, data were analyzed using an unpaired
Student's t-test. One-way analysis of variance followed by a post
hoc test of LSD was used to analyze the data among the three
groups. P<0.05 was considered to indicate a statistically
significant difference.
Results
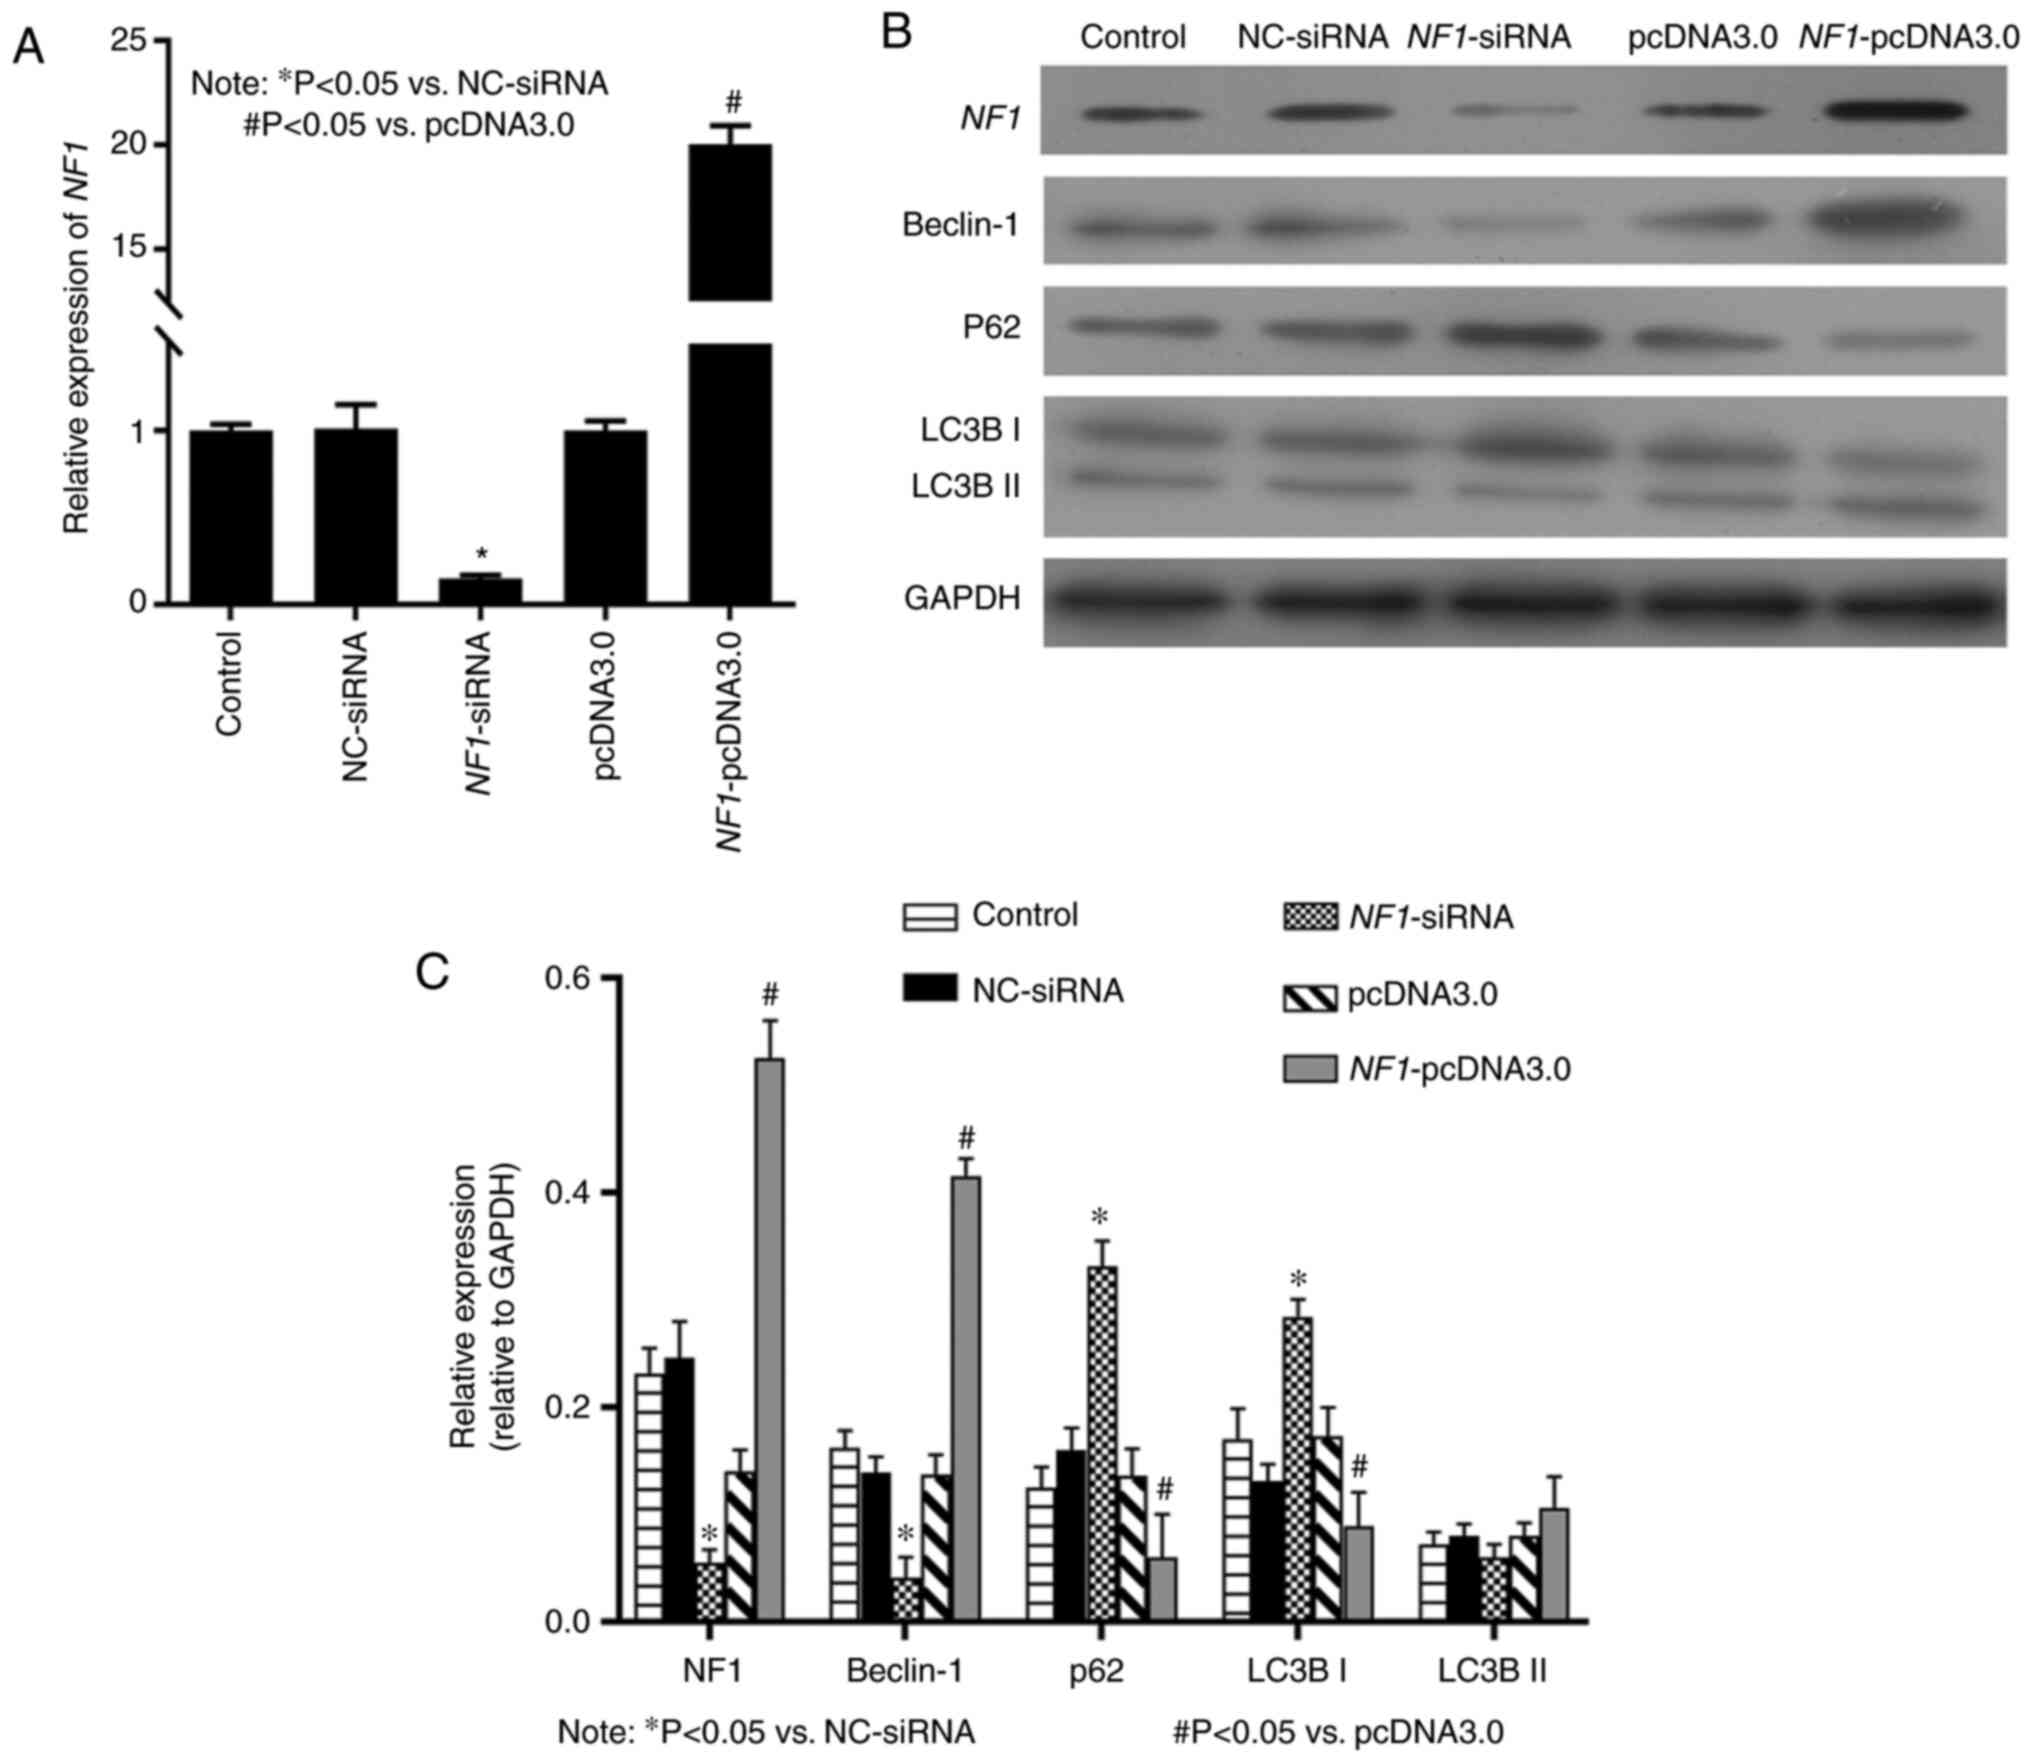
NF1 regulates the autophagic activity
of BMSCs
To detect the effect of NF1 on the autophagic
activity of BMSCs, cell models of BMSCs with NF1 knockdown
using NF1-siRNA or NF1 overexpression
(NF1-pcDNA3.0) o were established. RT-qPCR and western
blotting results showed that the mRNA (Fig. 1A) and protein (Fig. 1B and C) expression levels of NF1 were
significantly decreased in the NF1-siRNA group compared with
those in NC siRNA, but significantly increased in the
NF1-pcDNA3.0 group compared with those in the pcDNA3.0
group. Western blotting results indicated that in the
NF1-siRNA group, the expression of Beclin-1 was
significantly decreased, whereas that of LC3B-I and p62, a marker
of autophagosome degradation (25),
were significantly increased compared with that in the NC siRNA
group (Fig. 1B and C). In addition, in the NF1-pcDNA3.0
group, the expression of autophagy markers Beclin-1, was
significantly increased, whereas that of LC3B-I and p62 was
significantly decreased compared with that in the pcDNA3.0 group
(Fig. 1B and C).
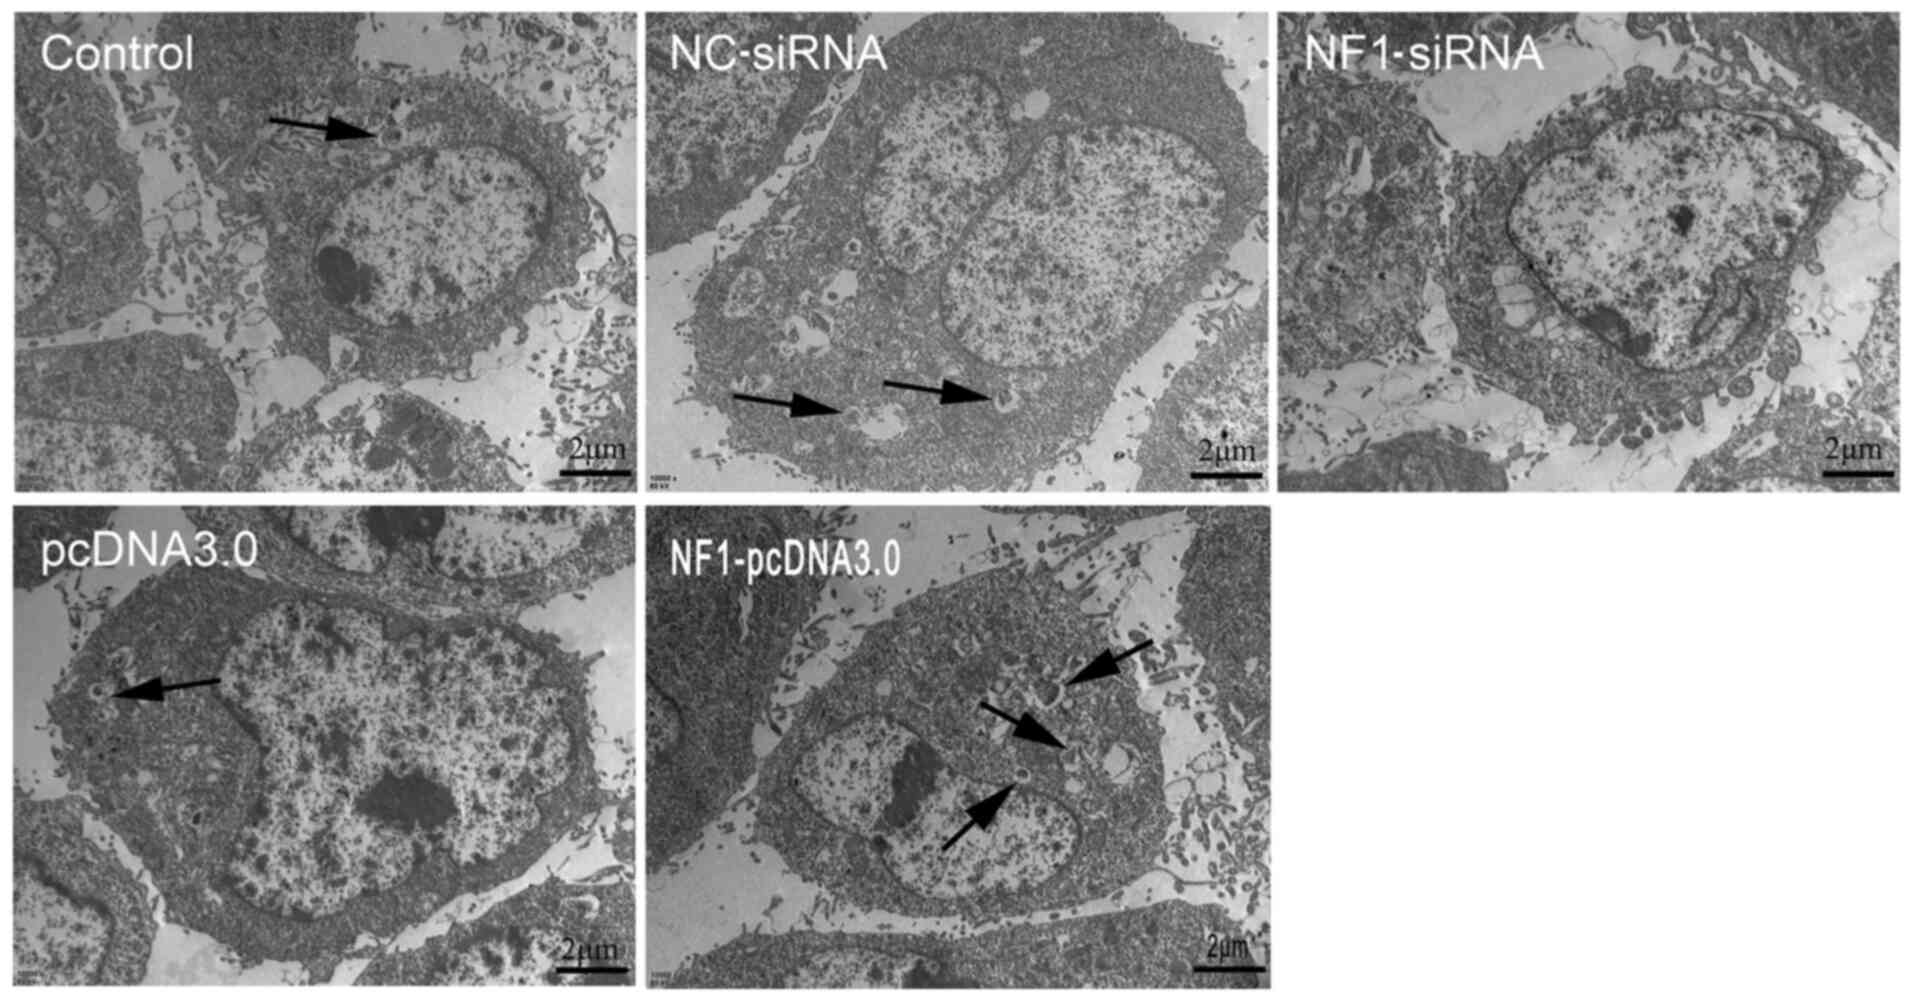
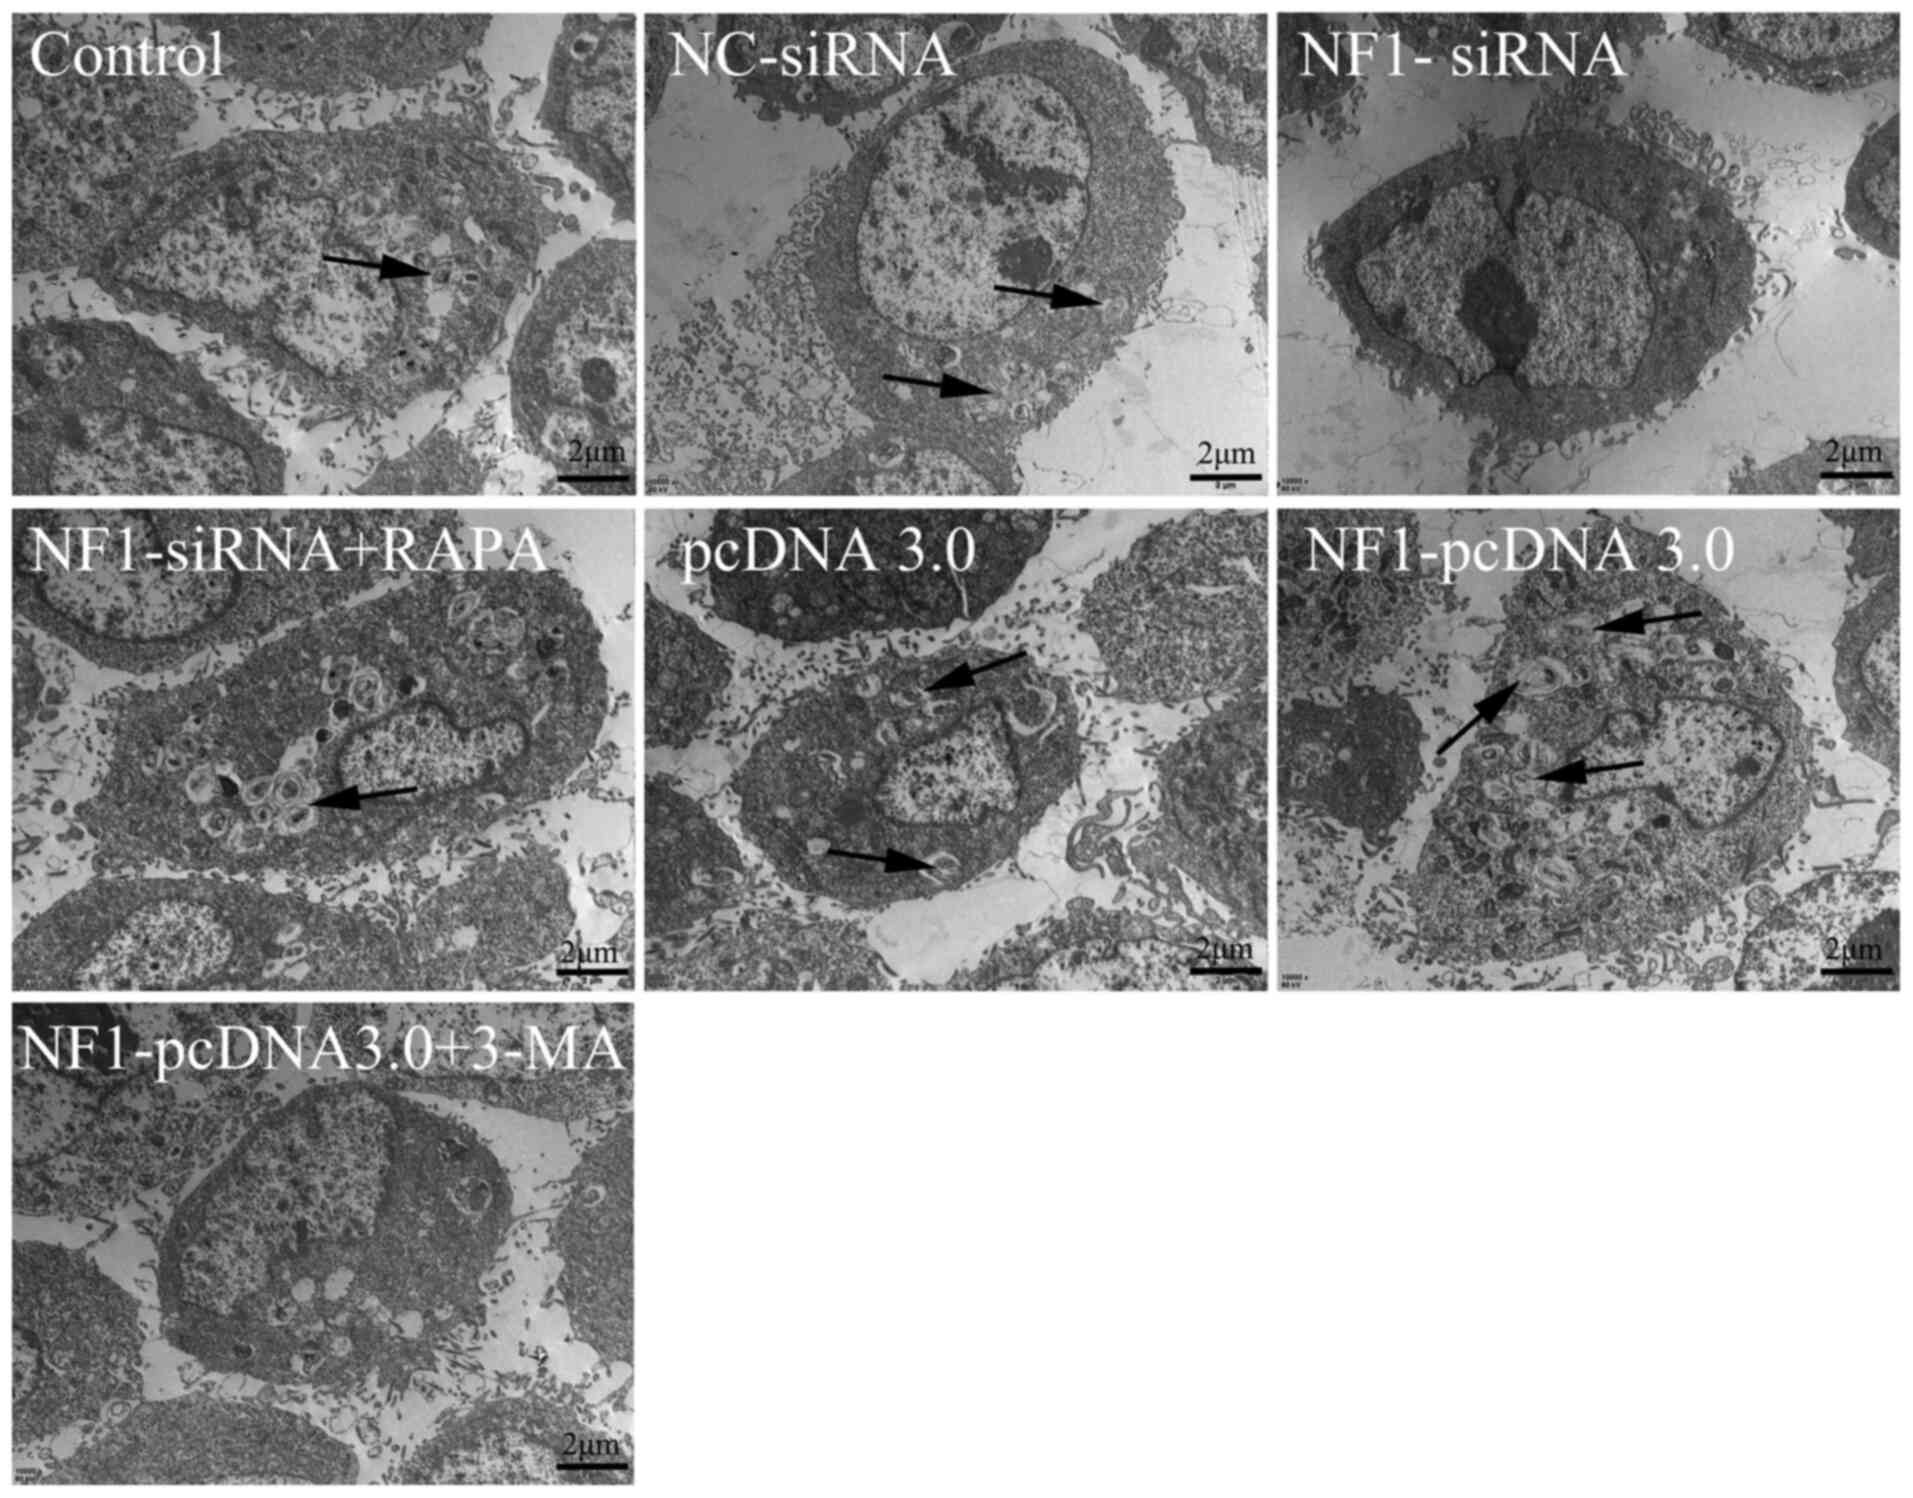
Furthermore, autophagic activity was detected using
transmission electron microscopy. The results revealed that
overexpression of NF1(NF1-pcDNA3.0) increased the
formation of autophagosomes, whilst inhibiting the expression of
NF1(NF1-siRNA) significantly reduced the formation of
autophagosomes when compared with groups pcDNA3.0 and NC-siRNA,
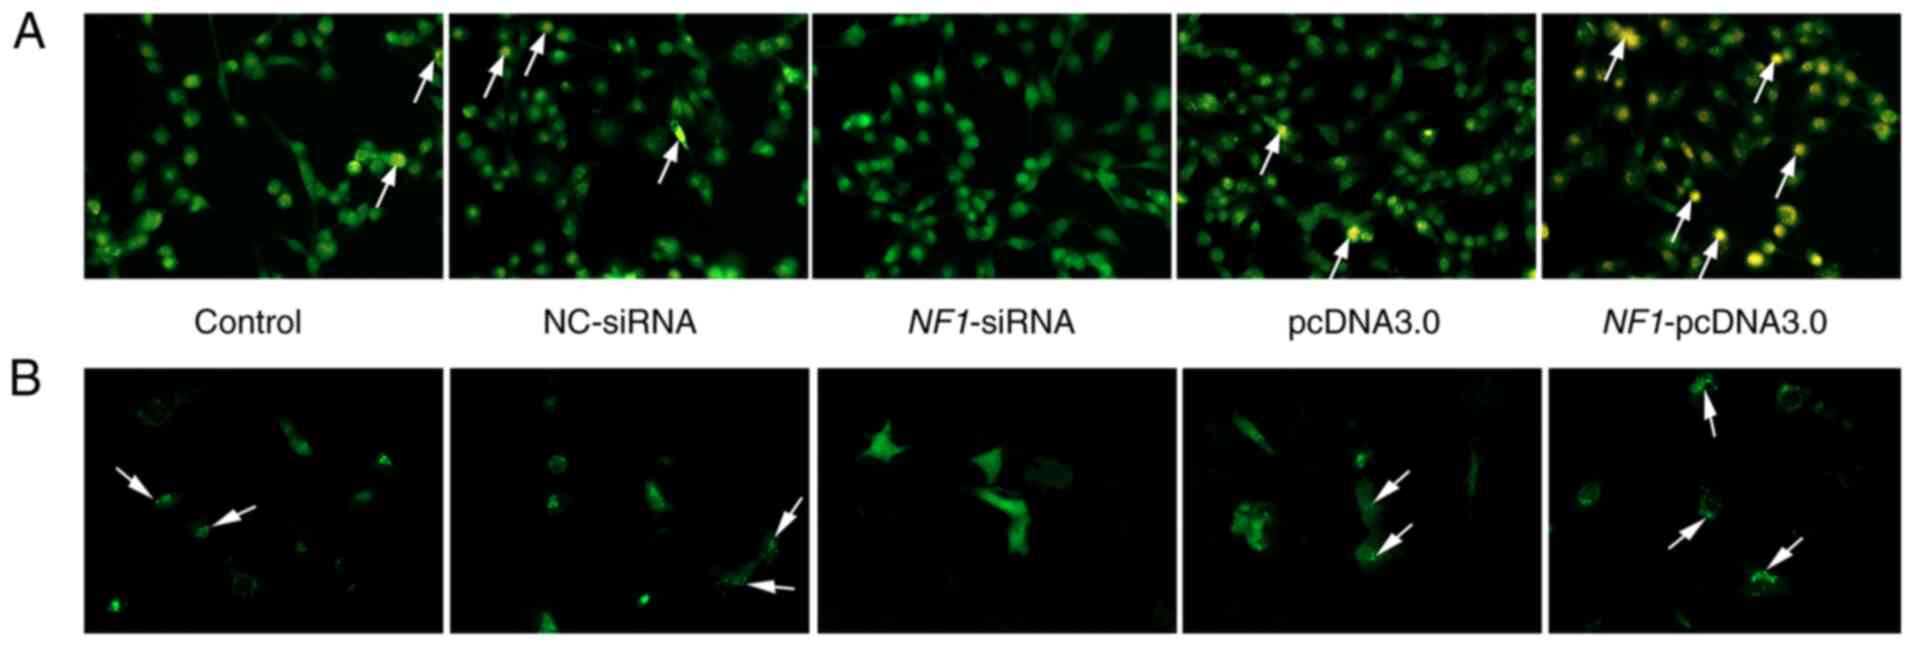
respectively (Fig. 2). Furthermore,
AO staining and autophagic flux/lysosomal detection were performed
(Fig. 3A). AO staining demonstrated
that the formation of autophagolysosomes (indicated by yellow-red
or orange fluorescence in Fig. 3A)
was increased in the NF1-pcDNA3.0 group but decreased in the
NF1-siRNA group when compared with groups NC-siRNA and
pcDNA3.0. The autophagic flux/lysosomal detection assay also
revealed similar results (Fig. 3B).
During the formation of autophagosomes, GFP-LC3 protein transferred
to the membrane of autophagosomes, and the autophagosomes were
indicated by green puncta using fluorescence microscopy. The
results of the present study indicated that the autophagic
flux/lysosomal was significantly increased in the
NF1-pcDNA3.0 group but decreased in the NF1-siRNA
group when compared with the pcDNA3.0 and NC-siRNA groups,
respectively.
Collectively, these results suggest that
overexpression of NF1 promoted autophagic activity of BMSCs,
whilst knockdown of NF1 expression decreased the level of
autophagy in BMSCs.
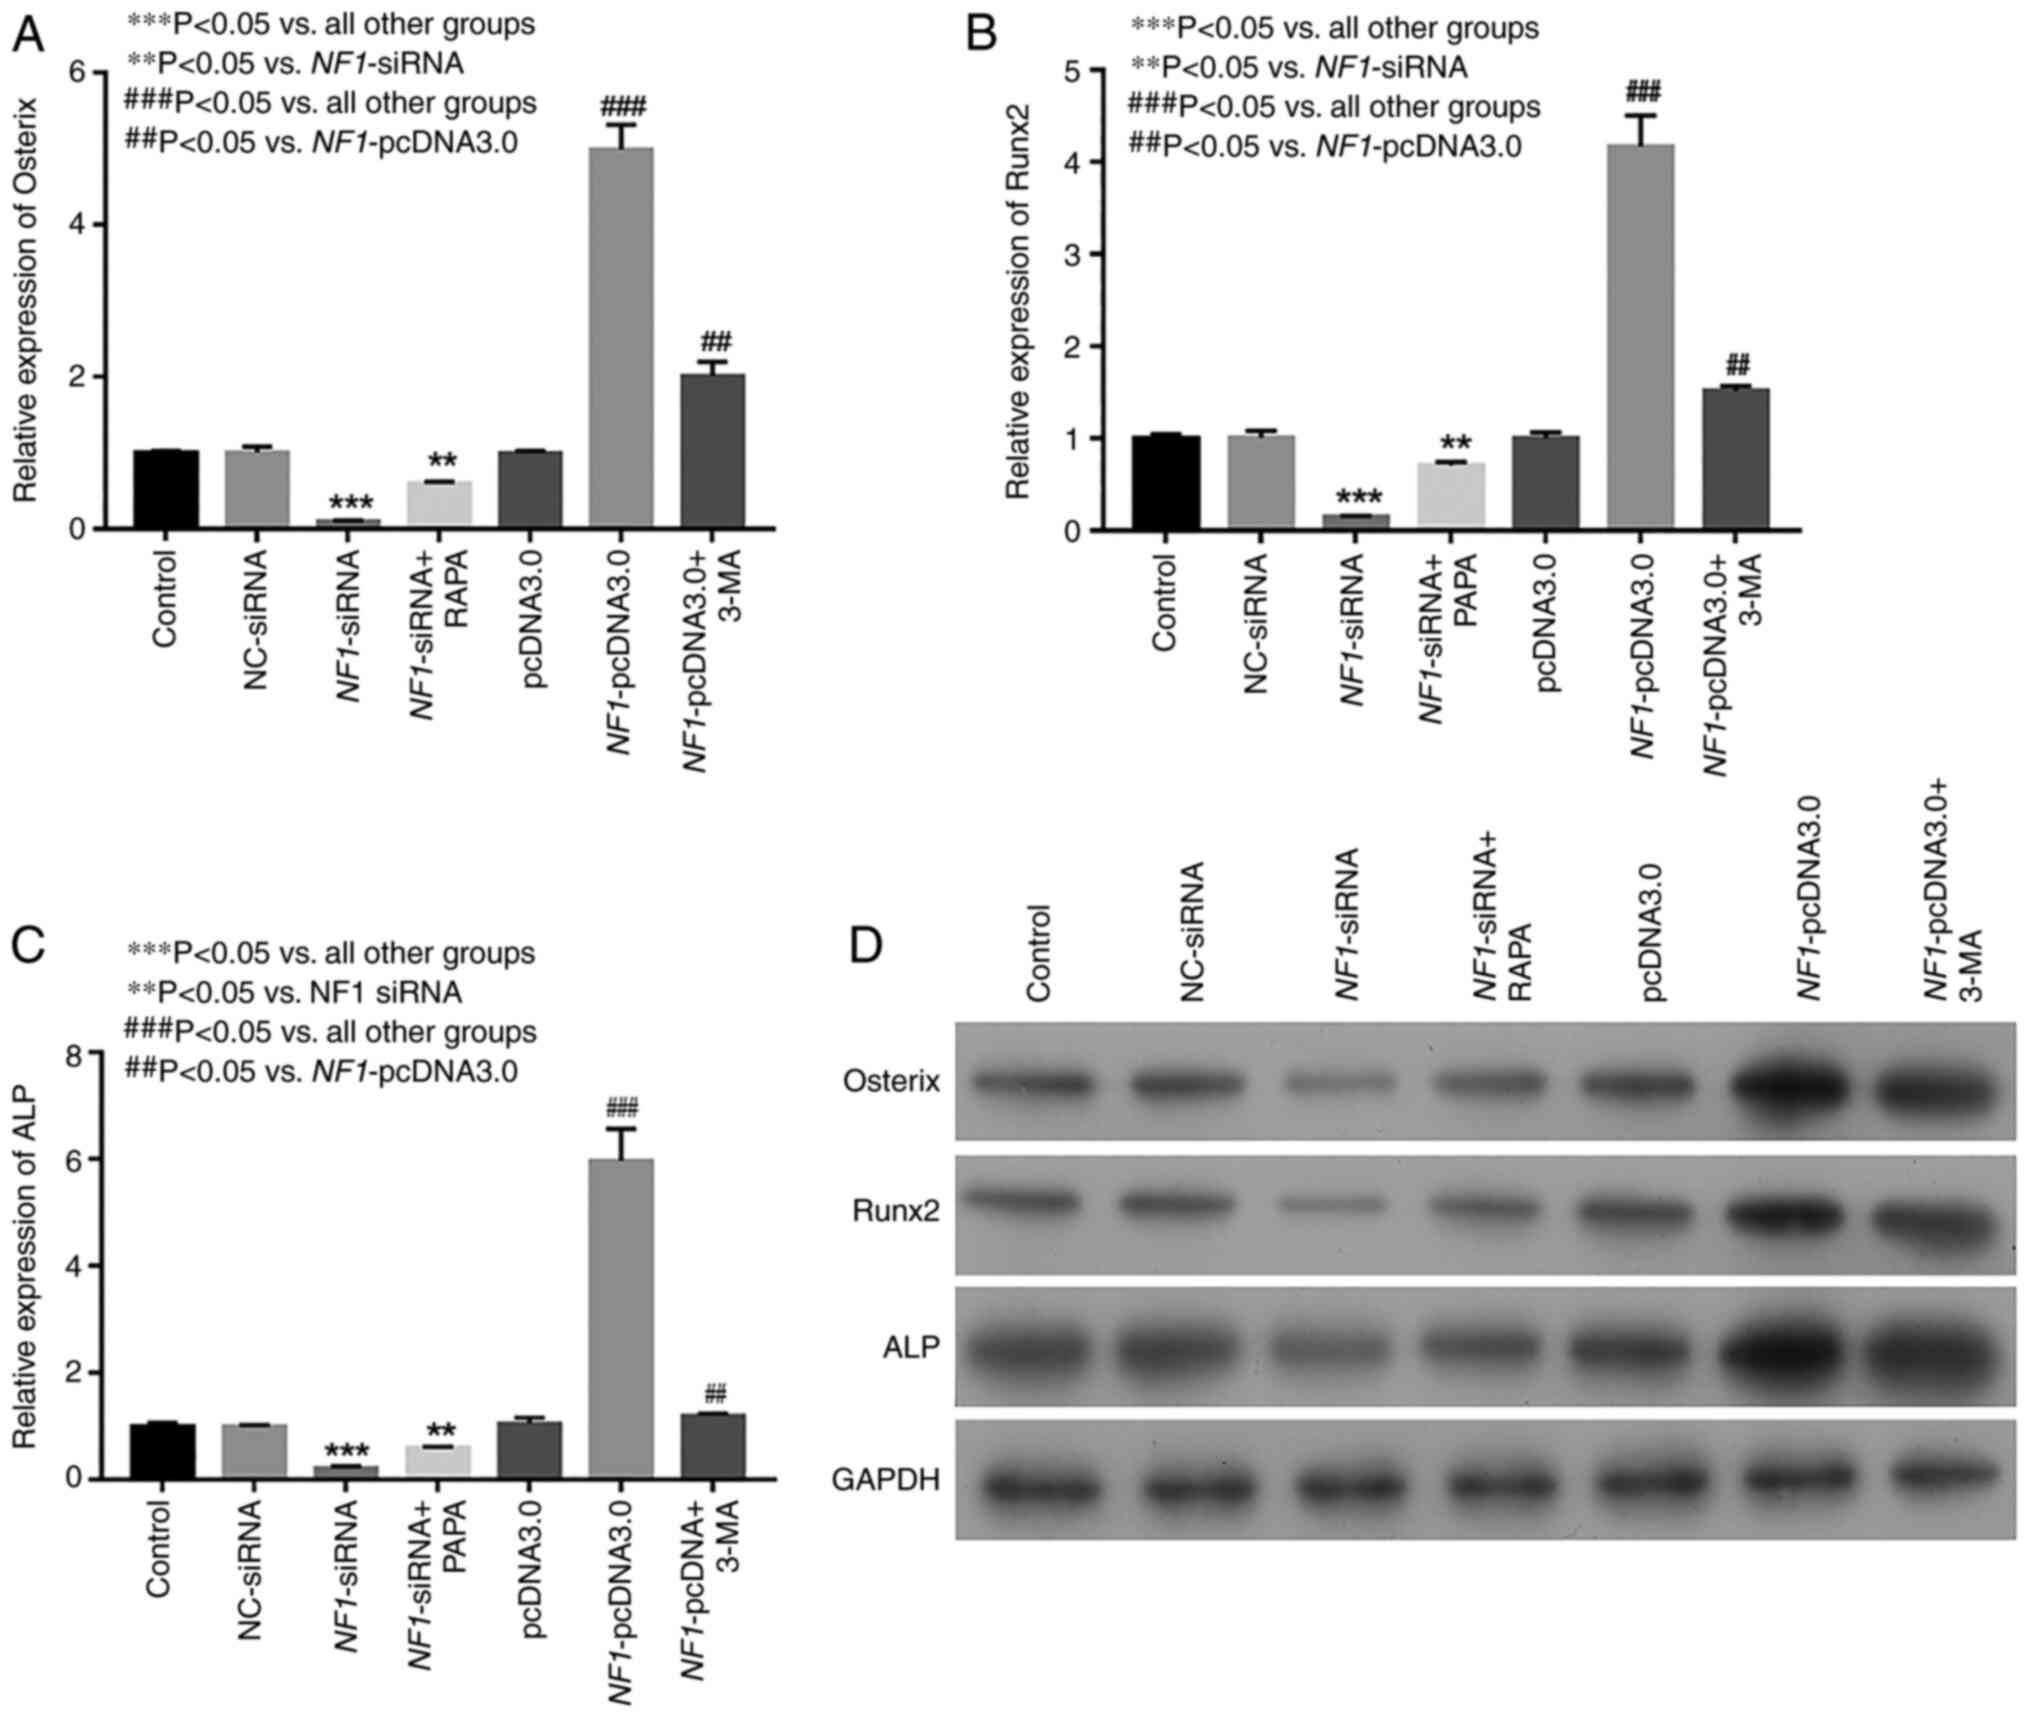
NF1 modulates osteogenic
differentiation by influencing the autophagic activity of
BMSCs
The results of RT-qPCR and western blotting
indicated that the expression levels of osteogenic differentiation
markers Osterix, Runx2 and ALP were markedly decreased in the
NF1-siRNA group, whereas they were increased in the
NF1-pcDNA3.0 group compared with those in the NC siRNA group
(Fig. 4A-D). To investigate the
effects of autophagy on osteogenic differentiation of BMSCs, an
activator (RAPA) and inhibitor (3-MA) of autophagy were added to
the NF1-siRNA and NF1-pcDNA3.0 groups, respectively.
As a result, the levels of the osteogenic differentiation markers
Osterix, Runx2 and ALP increased markedly in the RAPA-treated group
compared with that in the NF1-siRNA group alone. By
contrast, the expression levels decreased markedly in the
3-MA-treated group compared with those in NF1-pcDNA3.0 group
alone (Fig. 4A-D).
ALP staining indicated that ALP activity was
decreased by knocking down NF1 expression (NF1-siRNA)
and increased by NF1 overexpression (NF1-pcDNA3.0)
when compared with NC-siRNA and pcDNA3.0 groups, respectively. In
addition, RAPA and 3-MA treatment reversed the changes in ALP
activity in the NF1-siRNA and NF1-pcDNA3.0 groups,
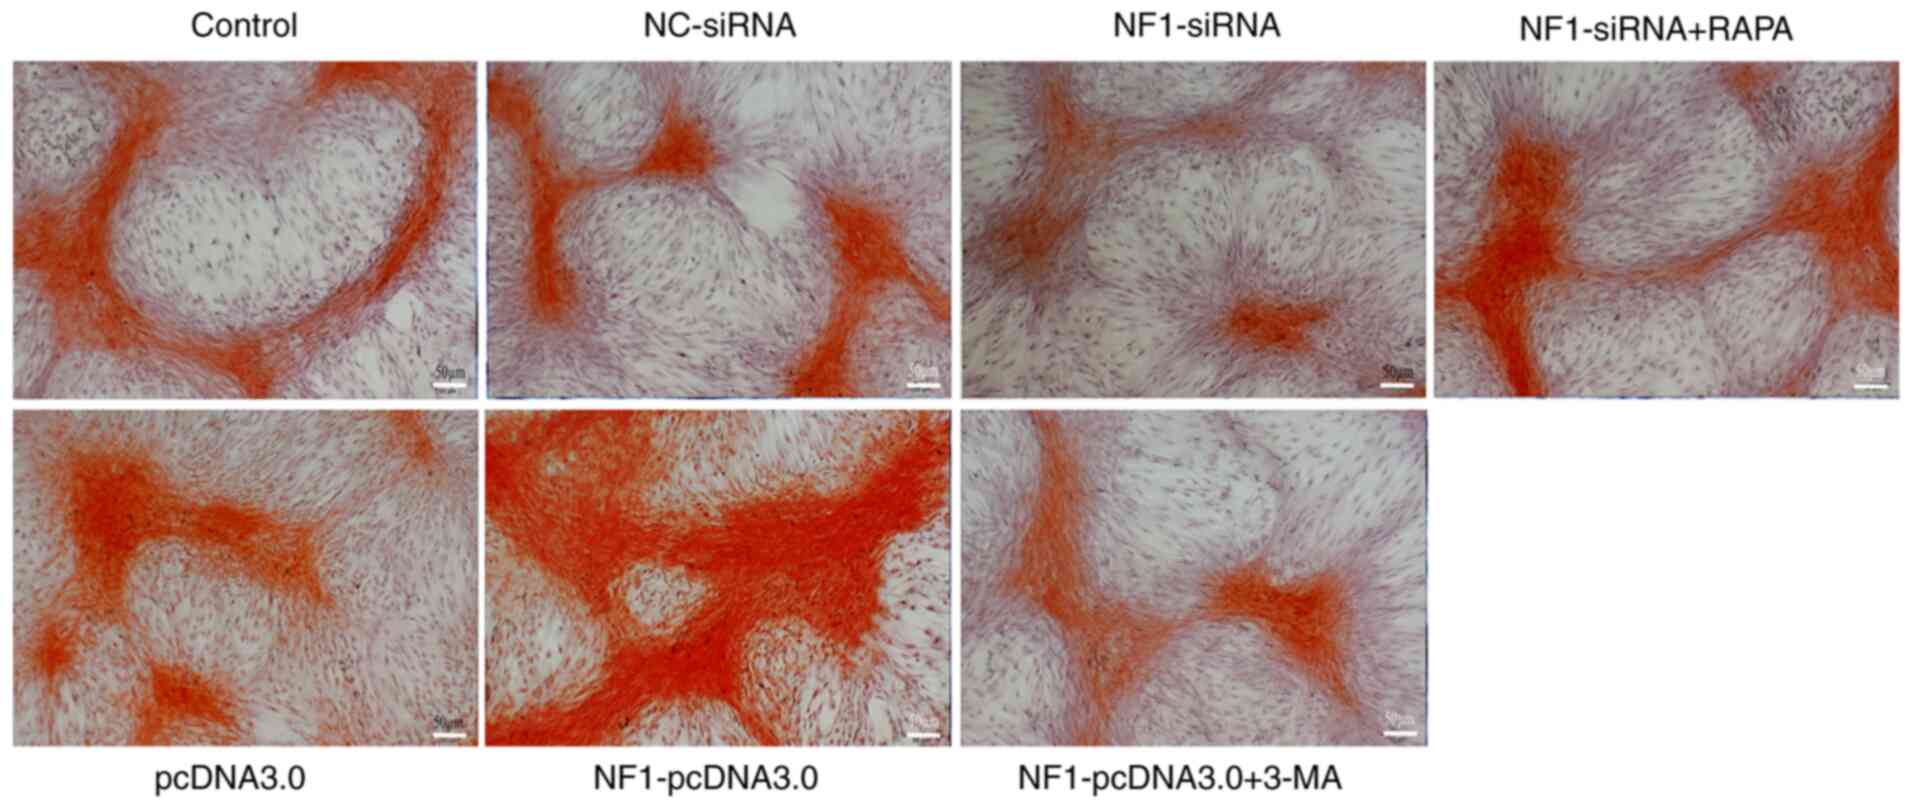
respectively (Fig. 5). Alizarin red
staining, representing calcium deposition, also revealed similar
results (Fig. 6). After application
of RAPA and 3-MA, the decreased and increased calcium deposition in
the NF1-siRNA and NF1-pcDNA3.0 groups, respectively,
were restored to the levels in the control groups (Fig. 6). These results suggest that
NF1 could modulate the osteogenic differentiation of BMSCs
by regulating the autophagic activity of BMSCs.
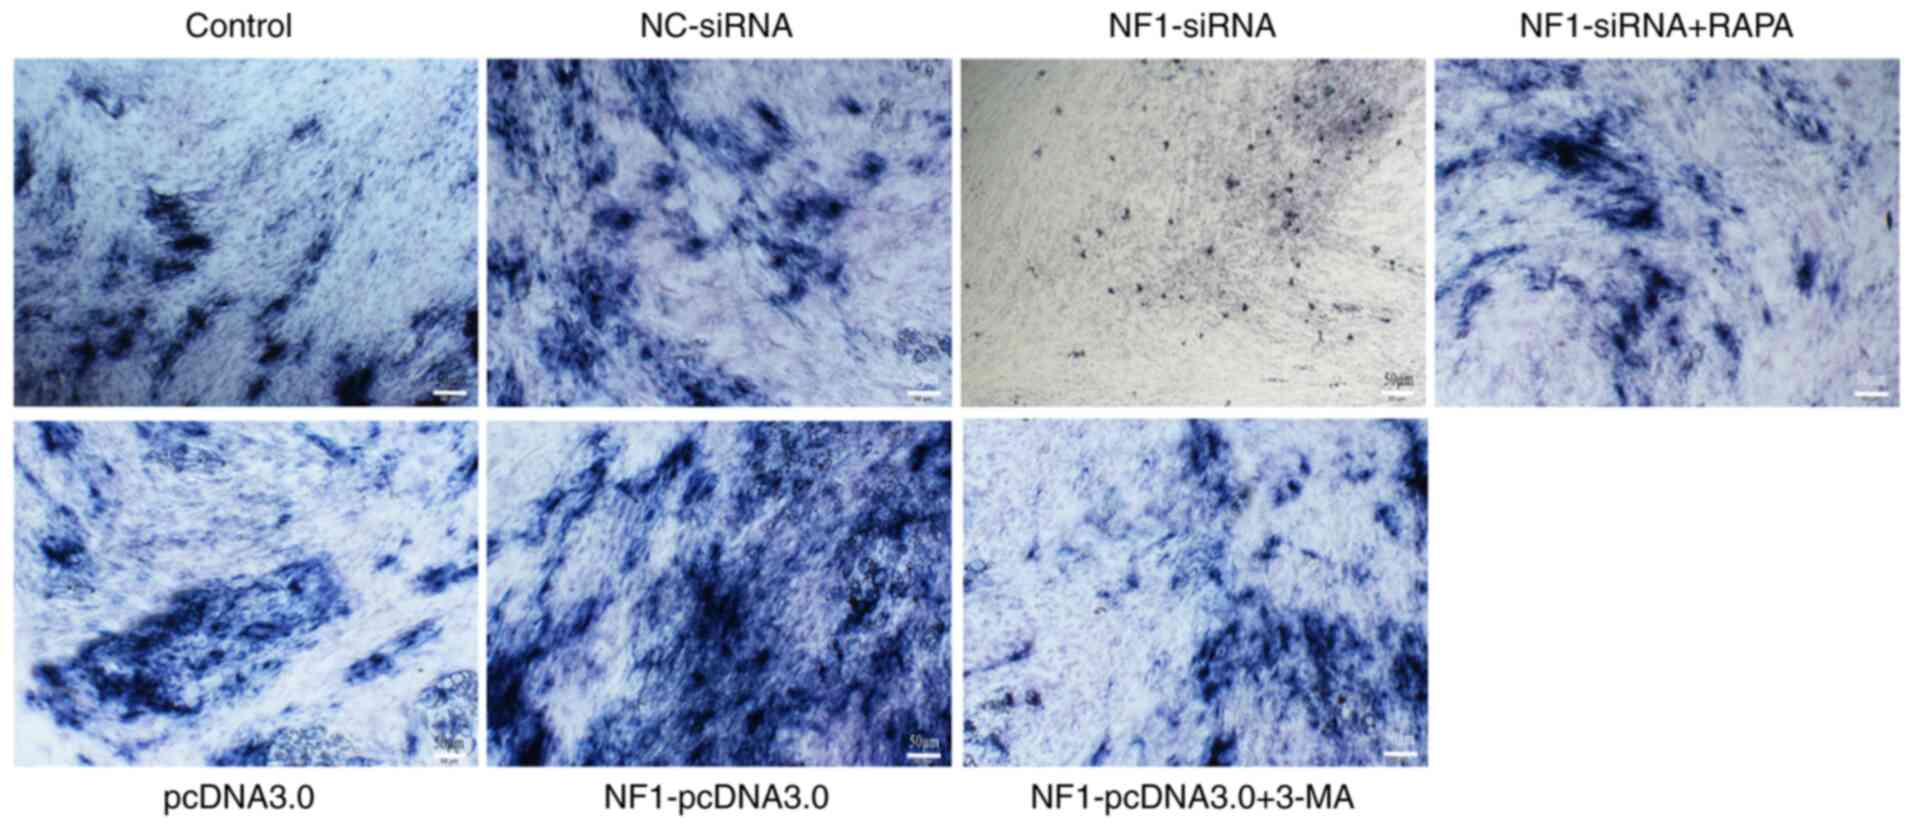 | Figure 5Results of ALP staining. Activity of
ALP was markedly decreased in the NF1-siRNA group and
increased in the NF1-pcDNA3.0 group when compared with
NC-siRNA and pcDNA3.0 groups, respectively. However, treatment with
RAPA and 3-MA reversed the effects of NF1-siRNA and
NF1-pcDNA3.0 transfection, respectively. Scale bars, 50 µm.
NF1, neurofibromin-1; si-, small interfering; NC, negative
control; ALP, alkaline phosphatase; RAPA, rapamycin; 3-MA,
3-methyladenine. |
NF1 partially regulates the autophagic
activity of BMSCs via the PI3K/AKT/mTOR pathway
The present study verified whether NF1 could
regulate autophagy in BMSCs through the PI3K/AKT/mTOR pathway.
Western blotting results demonstrated that the PI3K/AKT/mTOR
pathway was significantly activated in the NF1-siRNA group,
as indicated by increased levels of p-PI3K, p-AKT, p-mTOR and
p-p70S6K compared with those in the NC-siRNA group (Fig. 7A-C). By contrast, the PI3K/AKT/mTOR
pathway was significantly inhibited in the NF1-pcDNA3.0
group, as indicated by decreased levels of p-PI3K, p-AKT, p-mTOR
and p-p70S6K compared with those in the pcDNA3.0 group (Fig. 7A-C). RAPA was used to activate
whereas 3-MA was used to inhibit the autophagy of BMSCs in the
NF1-siRNA and NF1-pcDNA3.0 groups, respectively. The
results of western blot analysis indicated that the autophagic
activity was significantly increased in group NF1-siRNA+RAPA
and decreased in group NF1-pcDNA3.0+3-MA, compared with the
NF1-siRNA and group NF1-pcDNA3.0, respectively
(Fig. 7D-F). Transmission electron
microscopy, AO staining and autophagic flux/lysosomal detection
indicated that the formation of autophagosomes were significantly
increased in the NF1-siRNA + RAPA group compared with the
NF1-siRNA, whilst it was significantly decreased in the
NF1-pcDNA3.0 + 3-MA group compared with that in the
NF1-pcDNA3.0 group (Figs. 8
and 9). The levels of p-mTOR,
p-p70S6K, p-PI3K, and p-AKT were significantly decreased in the
NF1-siRNA + RAPA group compared with those in the
NF1-siRNA group (Fig. 7A-C).
Additionally, the levels of p-PI3K, p-AKT, p-mTOR and p-p70S6K were
all significantly decreased in the NF1-pcDNA3.0 + 3-MA group
compared with those in the NF1-pcDNA3.0 group (Fig. 7A-C). These results indicated that
NF1 could partially regulate the autophagic activity of
BMSCs via the PI3K/AKT/mTOR signaling pathway.
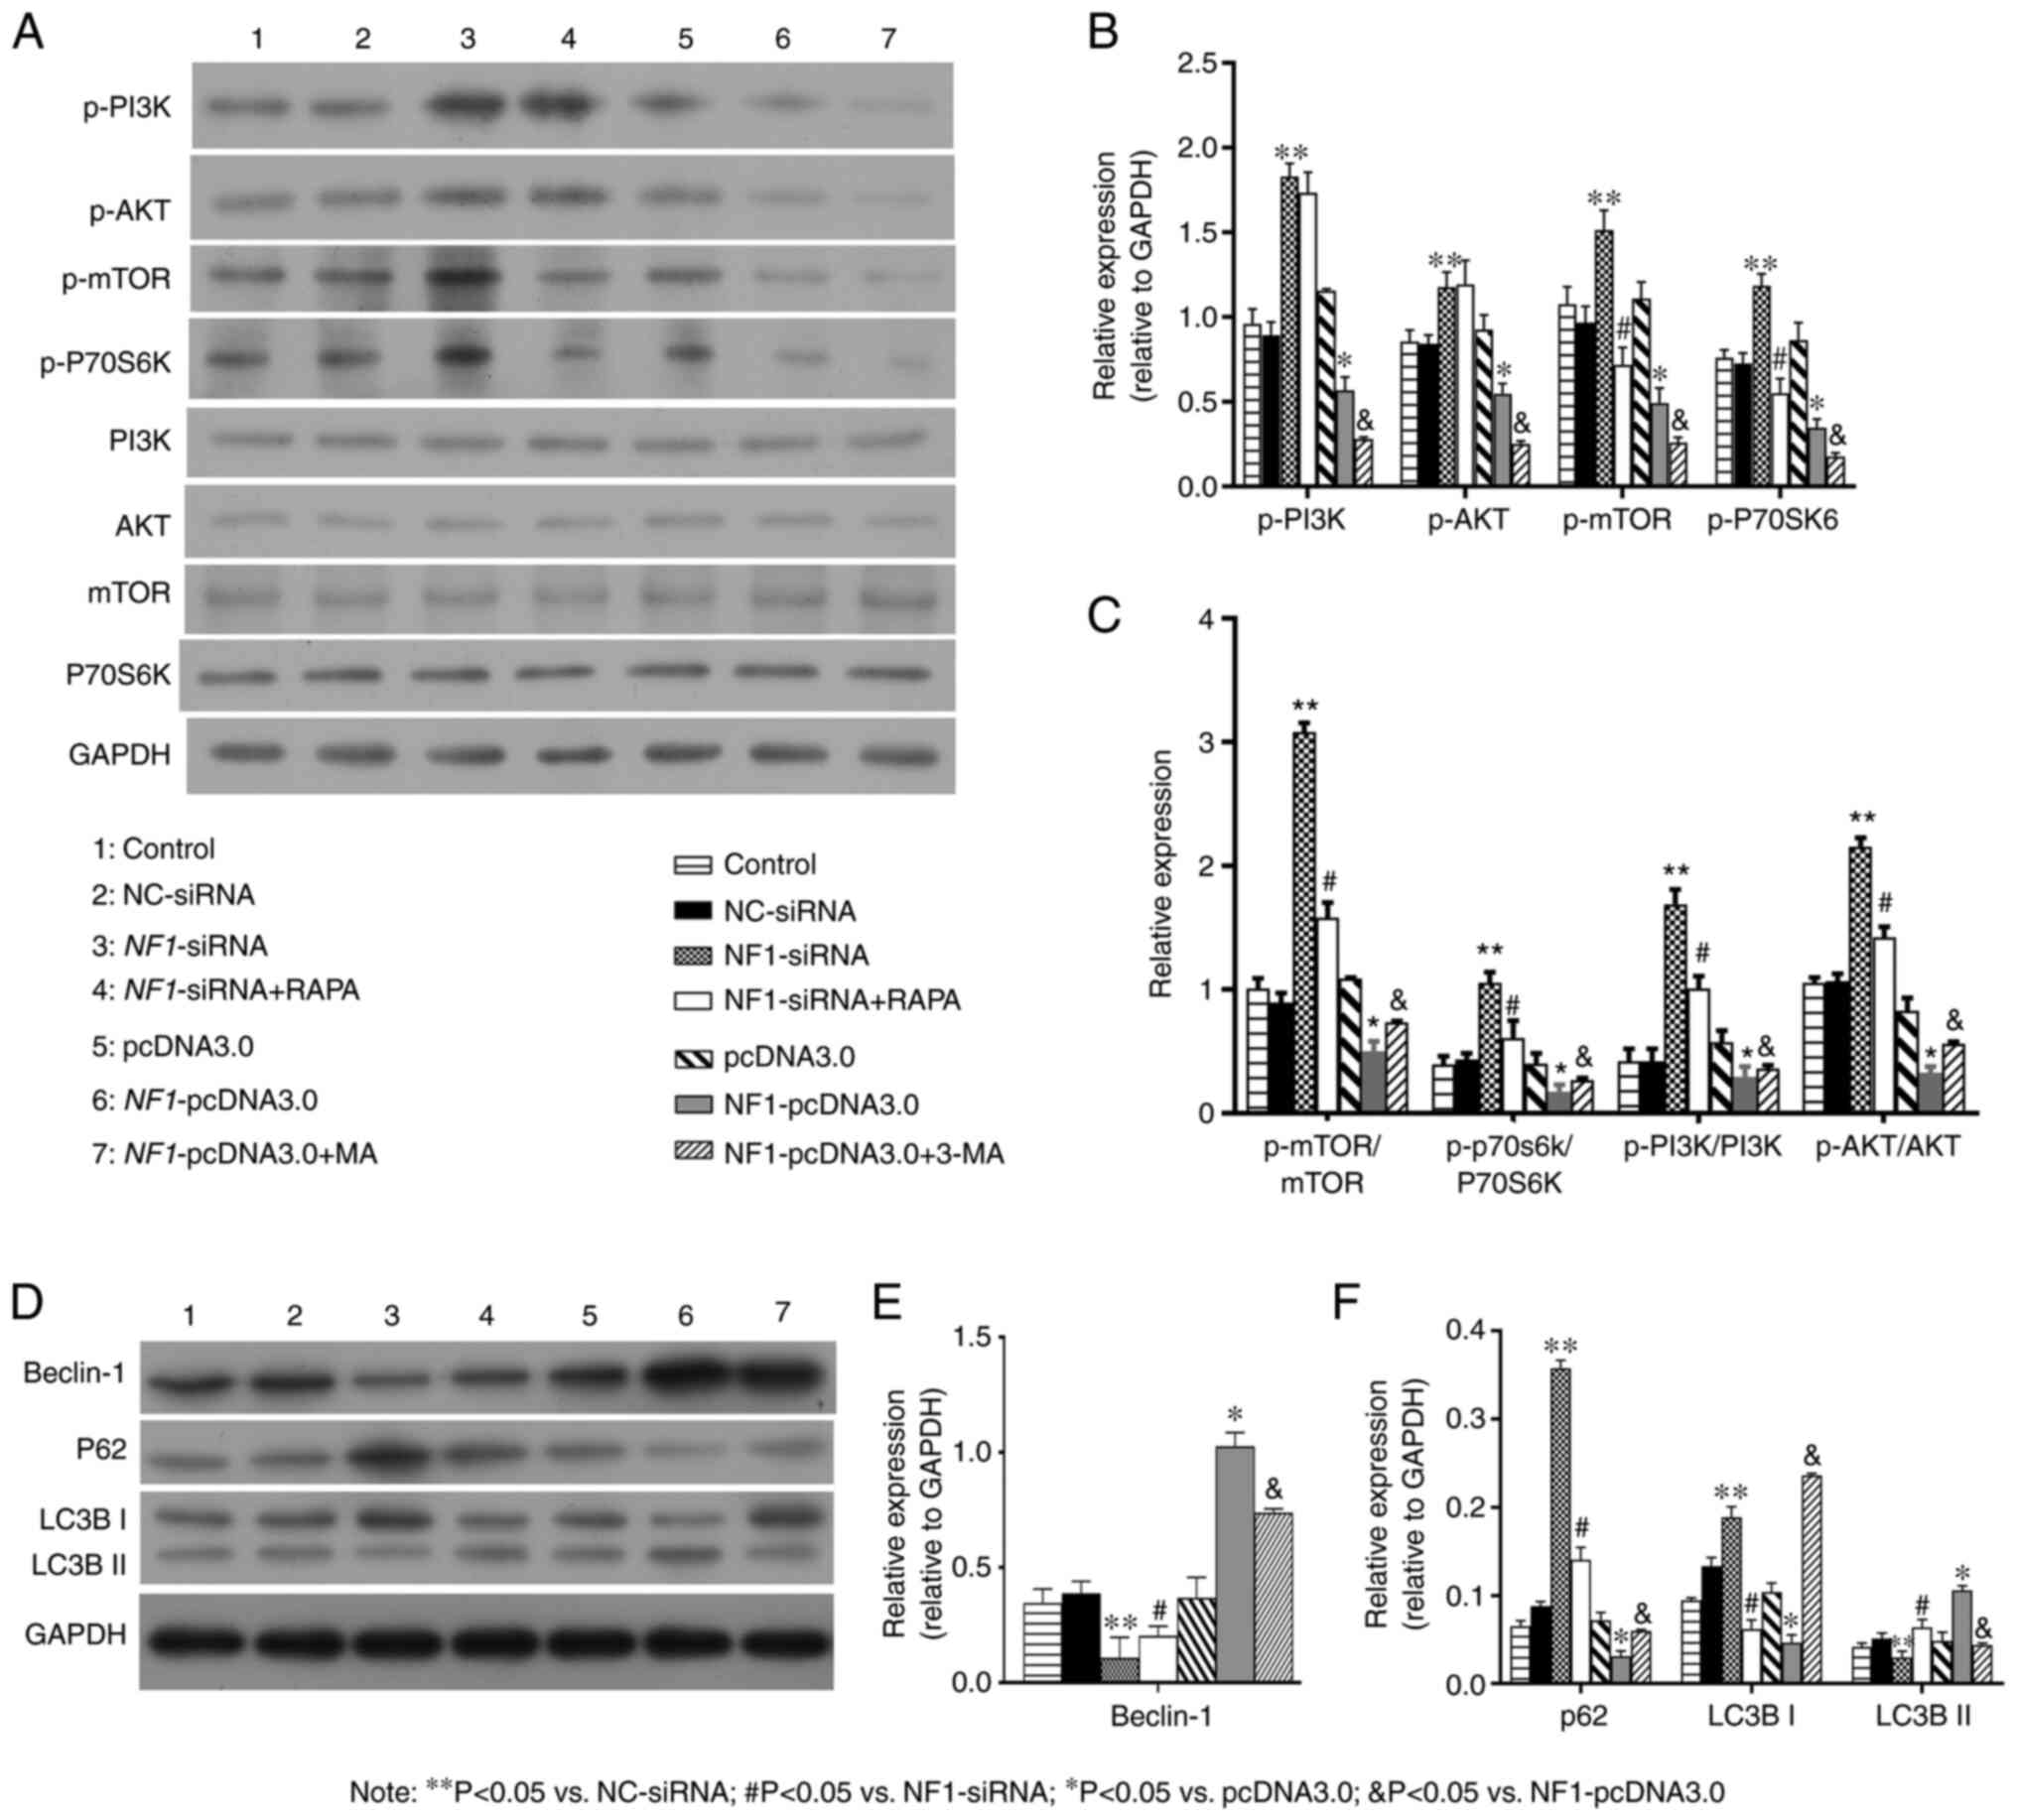 | Figure 7NF1 regulates autophagy in
bone mesenchymal stem cells by inhibiting the PI3K/AKT/mTOR
pathway. (A-C) Western blotting demonstrated that NF1-siRNA
significantly decreased the expression of Beclin-1 and LC3B-II and
increased the expression of P62 and LC3B-I, while RAPA reversed the
effects of NF1-siRNA. NF1-pcDNA3.0 significantly
increased the expression of Beclin-1 and LC3B-II while decreased
the expression of P62 and LC3B-I, while 3-MA reversed the effects
of NF1-pcDNA3.0. (D-F) Western blotting indicated that the
levels of proteins in the PI3K/AKT/mTOR pathway (p-PI3K, p-AKT,
p-mTOR and p-P70S6K) were upregulated in the NF1-siRNA group
and downregulated in the NF1-pcDNA3.0 group when compared
with groups NC-siRNA and pcDNA3.0, respectively. RAPA downregulated
PI3K/AKT/mTOR pathway in BMSCs with NF1-siRNA, while 3-MA
upregulated PI3K/AKT/mTOR pathway in BMSCs with
NF1-pcDNA3.0. Quantified levels of (B) Beclin-1, (C) p62,
LC3B-I, LC3B-II, (E, F) p-PI3K, p-AKT, p-mTOR and p-P70S6K.
*P<0.05 vs. pcDNA3.0; **P<0.05 vs
NC-siRNA; #P<0.05 vs. NF1-siRNA;
&P<0.05 vs. NF1-pcDNA3.0. NF1,
neurofibromatosis type 1; si-, small interfering; NC, negative
control; RAPA, rapamycin; 3-MA, 3-methyladenine; p-,
phosphorylated; P70S6K, p70S6 kinase. |
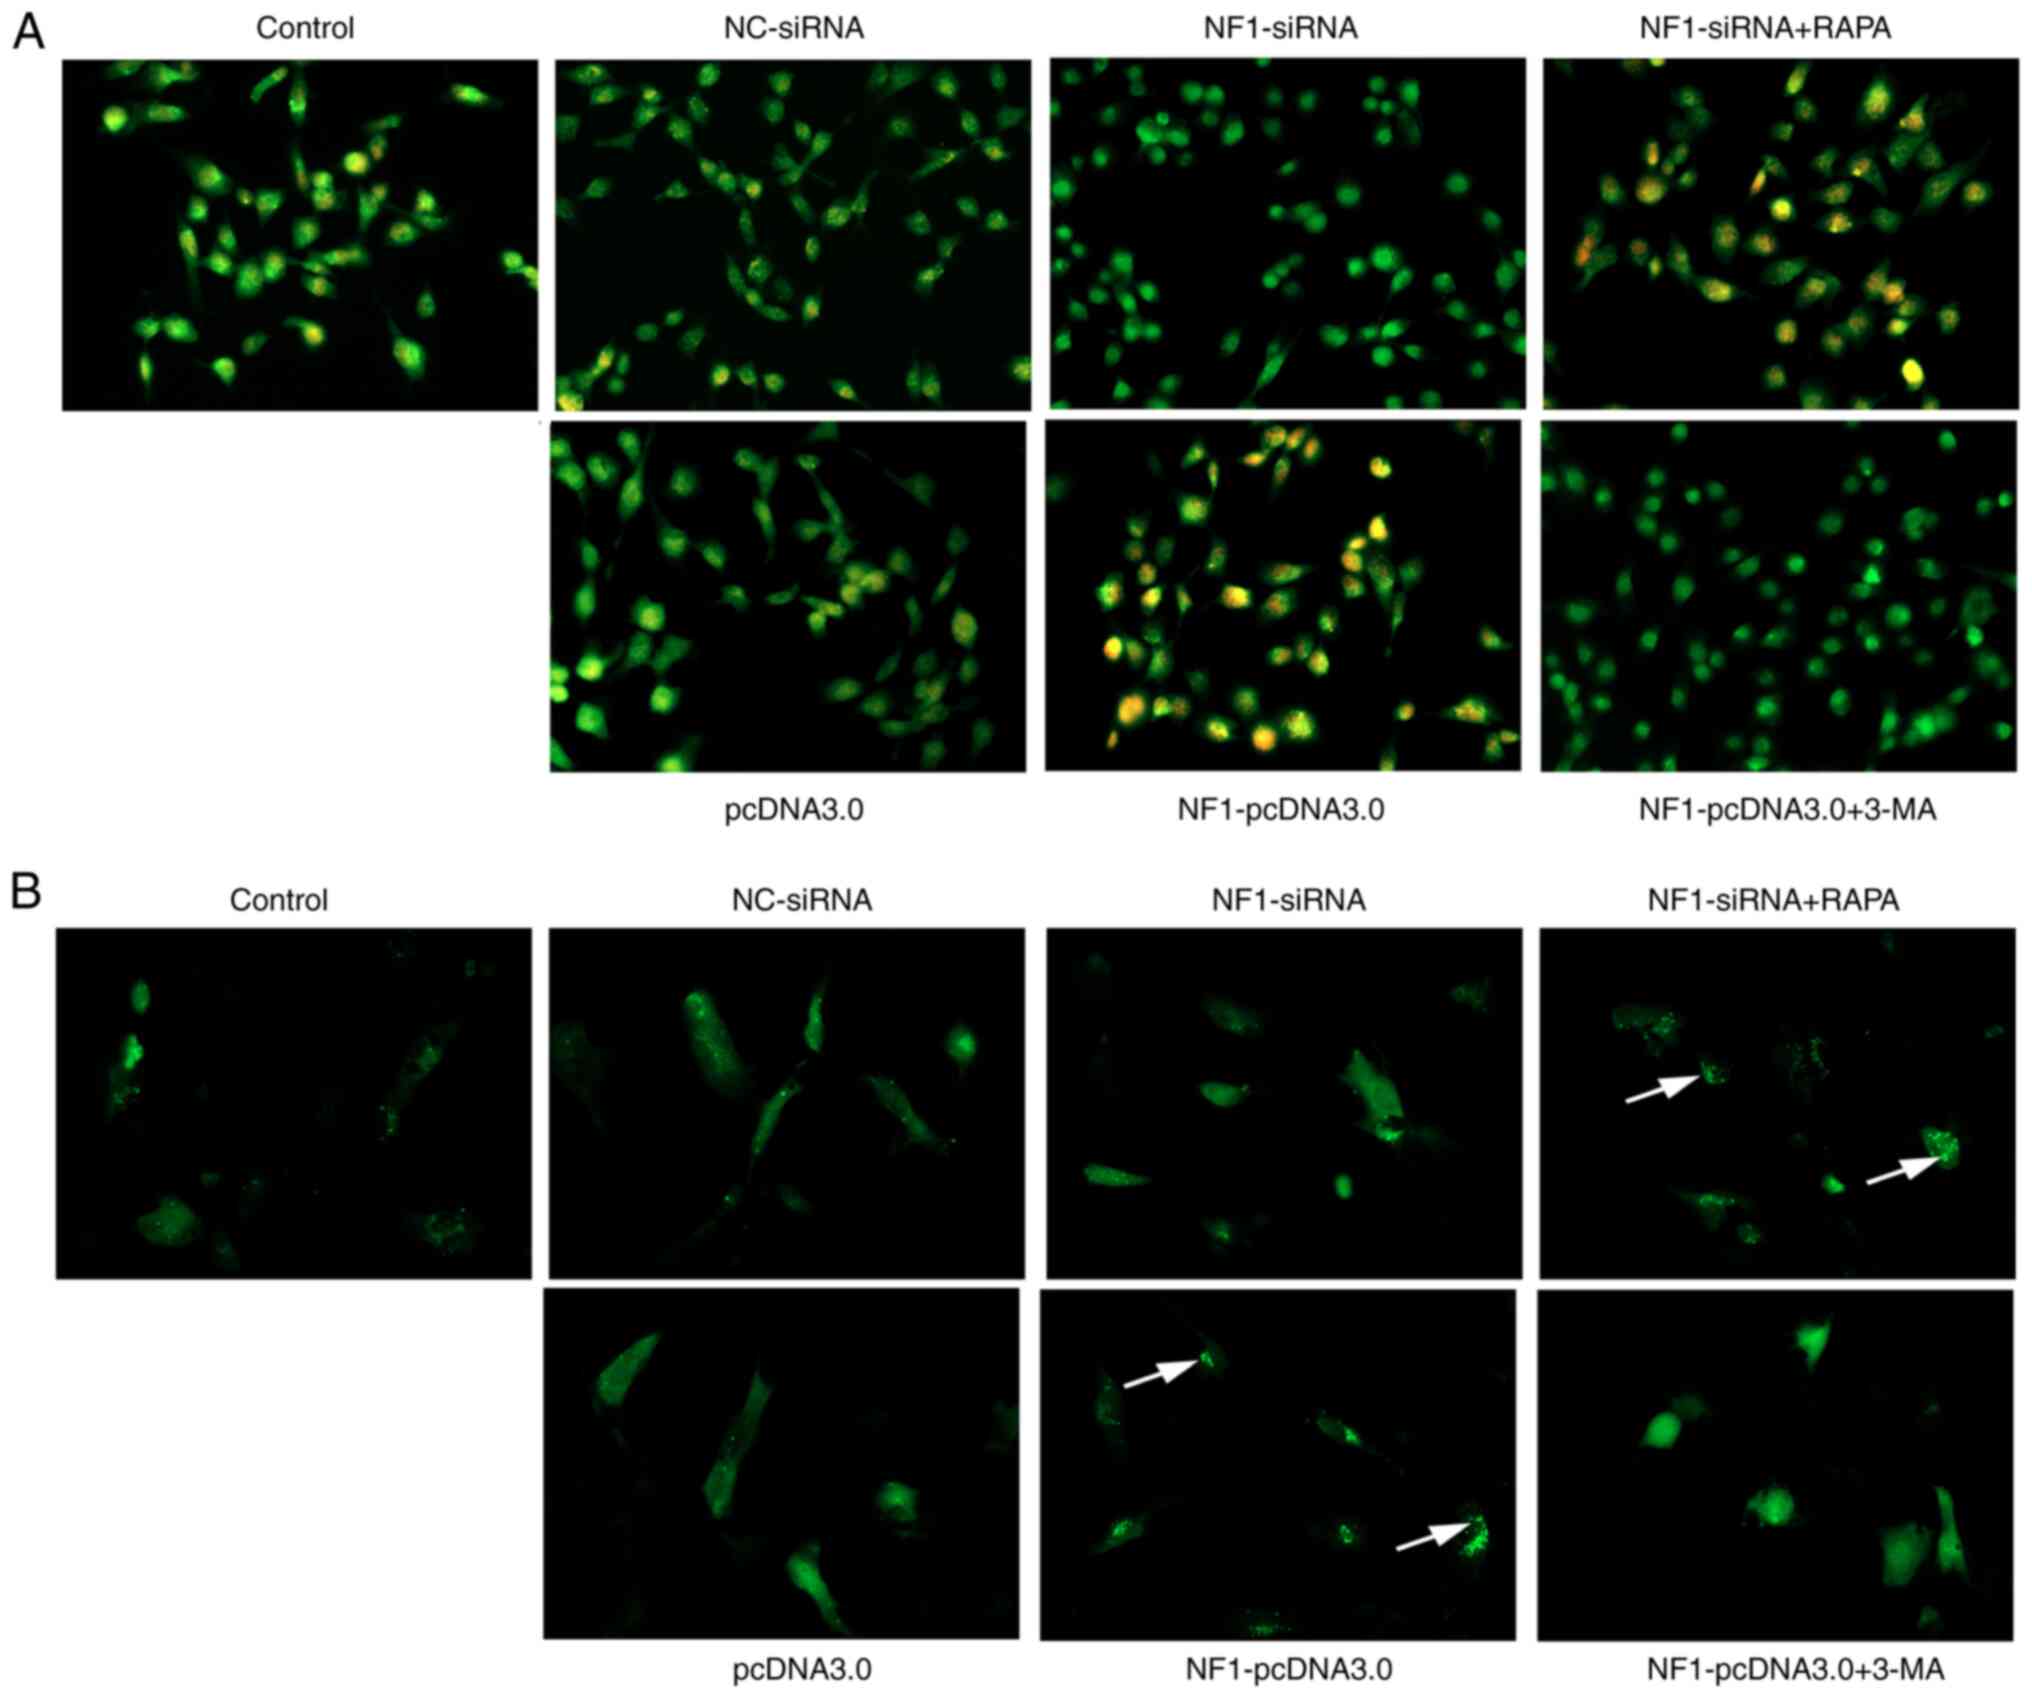 | Figure 9AO staining and autophagic flux
detection visualized under a fluorescence microscope.
Magnification, x200. AO staining and autophagic flux detection
visualized under a fluorescence microscope. In AO staining (A),
autophagolysosomes were stained orange (indicated by the white
arrows). The formation of autophagosomes were significantly
increased in the NF1-siRNA + RAPA group compared with the
NF1-siRNA, whilst it was significantly decreased in the
NF1-pcDNA3.0 + 3-MA group compared with that in the
NF1-pcDNA3.0 group. In autophagic flux detection (B), the
GFP-LC3 combined autophagosomes were indicated by granular green
fluorescence (indicated by the white arrows). Autophagic flux was
significantly increased in the NF1-siRNA + RAPA group
compared with the NF1-siRNA group, while it was
significantly decreased in the NF1-pcDNA3.0 + 3-MA group
compared with that in the NF1-pcDNA3.0 group. Results
indicated that treatment with RAPA and 3-MA reversed the effects of
NF1-siRNA and NF1-pcDNA3.0 transfection, respectively
(indicated by the arrows). AO, acridine orange; NF1,
neurofibromin 1; si-, small interfering; NC, negative control;
RAPA, rapamycin; 3-MA, 3-methyladenine. |
Discussion
Data from the present study indicate that NF1
regulated the autophagy of BMSCs. Overexpression of NF1
promoted the autophagic activity of BMSCs, whilst autophagic
activity was inhibited by the downregulation of NF1. Several
studies have reported the effect of autophagy on
NF1-deficient malignant peripheral nerve sheath tumors
(MPNSTs) (26,27). In particular, Yang et al
(26) found that
NF1-deficient MPNST samples exhibit high mobility group
protein A2 (HMGA2) expression levels and that HMGA2 knockdown
inhibited autophagy, which subsequently promotes MPNST cell death.
However, to the best of our knowledge, few studies have reported
the effects of NF1 on autophagy in BMSCs. Tan et al
(20) revealed that autophagic
activity and osteogenic differentiation were significantly enhanced
in NF1-overexpressing BMSCs, consistent with the results of
the present study. However, Tan et al (20) only established
NF1-overexpression BMSC models, which are different from the
clinical situation in patients with NF1 mutations, where the
function of NF1 is insufficient (8). Therefore, a cell model with inhibited
expression of NF1 can simulate the pathological conditions
of NF1 more closely compared with one with overexpression of
NF1. The present study established cell models of BMSCs with
the inhibition or overexpression of NF1, which is more
translational for investigating the effects of NF1 on the
autophagy of BMSCs (26,27).
The present study also demonstrated that autophagy
served a notable role in NF1-modulated osteogenic
differentiation of BMSCs. Knockdown of NF1 inhibited the
autophagic activity of BMSCs and decreased the osteogenic
differentiation of BMSCs whilst overexpression of NF1
resulted in the opposite effects. In addition, an autophagy
activator (RAPA) and an autophagy inhibitor (3-MA) reversed the
effects of NF1-knockdown and overexpression, respectively,
on the osteogenic differentiation of BMSCs. A number of studies
have demonstrated the involvement of NF1 in osteogenic
differentiation of BMSCs (8,10,11,28).
In particular, a previous study demonstrated that downregulation
and upregulation of NF1 respectively inhibited and promoted
osteogenic differentiation of BMSCs, respectively (13). Leskelä et al (8) cultured mesenchymal stem cells of
patients with NF1 and revealed impaired osteoblast differentiation.
Conversely, loss of NF1 resulted in increased osteoblast
proliferation (10,11). Kolanczyk et al (10) established a mouse model with
conditional inactivation of NF1 in the limb skeleton and
tested the effect of NF1 on osteoblast proliferation. They
revealed that the osteoblast cell division rate was significantly
increased in inactivated NF1 mutant cells when compared with
that in controls. Additionally, other studies have demonstrated
that autophagy can serve an important role in the osteogenic
differentiation process (15,16,29-32).
Wan et al (15) investigated
the lumbar BMSCs of patients with osteoporosis and determined that
the autophagy level in these BMSCs was significantly decreased,
which was accompanied by inhibited osteogenic differentiation.
Furthermore, it was identified that an autophagy activator (RAPA)
significantly increased the osteogenic differentiation of BMSCs
(15). Ma et al (29) also determined that the autophagy
levels in young male mice were higher compared with those in aged
male mice. In addition, treatment with an autophagy inhibitor
significantly suppressed the osteogenic differentiation of BMSCs
(29). Nuschke et al
(30) found that autophagy levels
in BMSCs were significantly increased during the early stages of
osteogenic differentiation, whilst it was significantly decreased
after differentiation into mature osteocytes. In addition, Liu
et al (31), Gómez-Puerto
et al (32) and Zhou et
al (16) reported that
autophagy served an important role in osteogenic differentiation of
BMSCs. In brief, the majority of previous studies aforementioned
reported that an increase in autophagic activity promotes
osteogenic differentiation of BMSCs. However, the BMSCs used in
these previous studies were purchased from patients without
NF1 mutation and with a native levels of NF1
expression. The present study used NF1-knockdown and
NF1-overexpressing BMSCs and confirmed the involvement of autophagy
in NF1-modulated osteogenic differentiation of BMSCs.
The present study also indicated that the
autophagic activity of BMSCs was partially regulated by NF1
via the PI3K/AKT/mTOR signaling pathway. The PI3K/AKT/mTOR pathway
was activated in NF1-knockdown BMSCs, whilst it was
inhibited in NF1-overexpressing BMSCs. It has been
previously reported that the PI3K/AKT/mTOR pathway serves a notable
role in regulating autophagy (18,33,34).
It is a classical signaling pathway for autophagy activation and
the main gateway to autophagy (18,19).
In particular, various studies have reported activation of the
PI3K/AKT/mTOR signaling pathway in NF1-related MPNSTs
(35,36). Previous studies by Tan et al
(20) and Li et al (13), combined with the present study,
demonstrate that regulation of autophagy facilitates
NF1-mediated modulation of osteogenic differentiation of
BMSCs via the PI3K/AKT/mTOR signaling pathway.
The mTORC1 signaling pathway has been reported to
be an important regulator of autophagy (19). Unc-51-like autophagy activating
kinase (ULK) is a key initiator of autophagy (37,38).
Furthermore, mTORC1 inhibits the ULK complex by phosphorylating its
components, including autophagy-related gene 13 and ULK1/2
(37,38). Additionally, mTORC1 regulates the
Vps34 class III PI3K complex, which is needed for autophagosome
formation (37,38). In the present study, the autophagic
activity in the NF1-pcDNA3.0 group was significantly
decreased after an autophagy inhibitor (3-MA) was applied. It is
known that 3-MA is an inhibitor of PI3K (39) and that it suppresses autophagy by
inhibiting the class III PI3K (40). Additionally, 3-MA inhibits AKT by
inhibiting the class I PI3K (40,41)
and subsequently leads to mTORC1 inactivation (18). As aforementioned, mTORC1 signaling
inhibits autophagosome formation (37,38).
The inhibition of autophagy and osteogenic differentiation of BMSCs
in the NF1-pcDNA3.0 + 3-MA group in the present study
suggests that autophagy may partially regulate osteogenic
differentiation of BMSCs through other mechanisms that are
independent of mTOR signaling. It has been reported that
AMP-activated protein kinase and the Wnt//β-catenin signaling
pathway may also mediate important roles in regulating autophagy in
BMSCs (42,43). Therefore, further study is required
to investigate the mechanism by which NF1 modulates
osteogenic differentiation of BMSCs through autophagy.
There are still some limitations in the present
study. Firstly, our study only established BMSCs models with
knockdown or overexpression of NF1 by siRNA or pcDNA3.0,
which is different from clinical condition (NF1 mutation).
Secondly, the present study is a cell experiment, further animal
studies are required to confirm the role of autophagy on
NF1-modulated growth of bone.
In conclusion, the present study demonstrated that
autophagy played a significant role in NF1-mediated osteogenic
differentiation of BMSCs. Downregulation of NF1 inhibited
autophagy to decrease osteogenic differentiation of BMSCs, whereas
upregulation of NF1 activated autophagy to increase
osteogenic differentiation. NF1 may partially regulate the
autophagic activity of BMSCs via the PI3K/AKT/mTOR signaling
pathway. The present study could guide a new direction for
elucidating the etiology of NF1-associated skeletal
abnormalities and provide a novel theoretical basis for the
treatment of NF1.
Acknowledgements
Not applicable.
Funding
Funding: The present study was supported by funding from
Guangzhou Women and Children's Medical Center/Guangzhou Institute
of Pediatrics (grant no. IP-2019-001) and The National Nature
Science Foundation of China (grant no. 81702116).
Availability of data and materials
The datasets used and/or analyzed during the
current study are available from the corresponding author on
reasonable request.
Authors' contributions
Conceptualization, methodology, supervision and
writing (review and editing) were performed by YQL, HWX and XML.
Original draft and funding acquisition were performed by YQL. HWX
and YQL provided resources. XML, MWZ, JCL, ZY and YHL performed the
experiments. YQL and MWZ analyzed the data. YQL and HWX confirm the
authenticity of all the raw data. All authors have read and
approved the final manuscript.
Ethics approval and consent to
participate
Not applicable.
Patient consent for publication
Not applicable.
Competing interests
The authors declare that they have no competing
interests.
References
|
1
|
Anderson JL and Gutmann DH:
Neurofibromatosis type 1. Handb Clin Neurol. 132:75–86.
2015.PubMed/NCBI View Article : Google Scholar
|
|
2
|
Ferner RE and Gutmann DH:
Neurofibromatosis type 1 (NF1): Diagnosis and management. Handb
Clin Neurol. 115:939–955. 2013.PubMed/NCBI View Article : Google Scholar
|
|
3
|
Gutmann DH, Ferner RE, Listernick RH, Korf
BR, Wolters PL and Johnson KJ: Neurofibromatosis type 1. Nat Rev
Dis Primers. 3(17004)2017.PubMed/NCBI View Article : Google Scholar
|
|
4
|
Ferner RE, Huson SM, Thomas N, Moss C,
Willshaw H, Evans DG, Upadhyaya M, Towers R, Gleeson M, Steiger C
and Kirby A: Guidelines for the diagnosis and management of
individuals with neurofibromatosis 1. J Med Genet. 44:81–88.
2007.PubMed/NCBI View Article : Google Scholar
|
|
5
|
Feldman DS, Jordan C and Fonseca L:
Orthopaedic manifestations of neurofibromatosis type 1. J Am Acad
Orthop Surg. 18:346–357. 2010.PubMed/NCBI View Article : Google Scholar
|
|
6
|
Vitale MG, Guha A and Skaggs DL:
Orthopaedic manifestations of neurofibromatosis in children: An
update. Clin Orthop Relat Res. 107–118. 2002.PubMed/NCBI View Article : Google Scholar
|
|
7
|
Shen MH, Harper PS and Upadhyaya M:
Molecular genetics of neurofibromatosis type 1 (NF1). J Med Genet.
33:2–17. 1996.PubMed/NCBI View Article : Google Scholar
|
|
8
|
Leskelä HV, Kuorilehto T, Risteli J,
Koivunen J, Nissinen M, Peltonen S, Kinnunen P, Messiaen L,
Lehenkari P and Peltonen J: Congenital pseudarthrosis of
neurofibromatosis type 1: Impaired osteoblast differentiation and
function and altered NF1 gene expression. Bone. 44:243–250.
2009.PubMed/NCBI View Article : Google Scholar
|
|
9
|
Sharma R, Wu X, Rhodes SD, Chen S, He Y,
Yuan J, Li J, Yang X, Li X, Jiang L, et al: Hyperactive Ras/MAPK
signaling is critical for tibial nonunion fracture in
neurofibromin-deficient mice. Hum Mol Genet. 22:4818–4828.
2013.PubMed/NCBI View Article : Google Scholar
|
|
10
|
Kolanczyk M, Kossler N, Kuhnisch J,
Lavitas L, Stricker S, Wilkening U, Manjubala I, Fratzl P, Sporle
R, Herrmann BG, et al: Multiple roles for neurofibromin in skeletal
development and growth. Hum Mol Genet. 16:874–886. 2007.PubMed/NCBI View Article : Google Scholar
|
|
11
|
Wu X, Estwick SA, Chen S, Yu M, Ming W,
Nebesio TD, Li Y, Yuan J, Kapur R, Ingram D, et al: Neurofibromin
plays a critical role in modulating osteoblast differentiation of
mesenchymal stem/progenitor cells. Hum Mol Genet. 15:2837–2845.
2006.PubMed/NCBI View Article : Google Scholar
|
|
12
|
Wang W, Nyman JS, Ono K, Stevenson DA,
Yang X and Elefteriou F: Mice lacking Nf1 in osteochondroprogenitor
cells display skeletal dysplasia similar to patients with
neurofibromatosis type I. Hum Mol Genet. 20:3910–3924.
2011.PubMed/NCBI View Article : Google Scholar
|
|
13
|
Li Y, Li J, Zhou Q, Liu Y, Chen W and Xu
H: mTORC1 signaling is essential for neurofibromatosis type I gene
modulated osteogenic differentiation of BMSCs. J Cell Biochem.
120:2886–2896. 2019.PubMed/NCBI View Article : Google Scholar
|
|
14
|
Reggiori F and Klionsky DJ: Autophagy in
the eukaryotic cell. Eukaryot Cell. 1:11–21. 2002.PubMed/NCBI View Article : Google Scholar
|
|
15
|
Wan Y, Zhuo N, Li Y, Zhao W and Jiang D:
Autophagy promotes osteogenic differentiation of human bone marrow
mesenchymal stem cell derived from osteoporotic vertebrae. Biochem
Biophys Res Commun. 488:46–52. 2017.PubMed/NCBI View Article : Google Scholar
|
|
16
|
Zhou Z, Shi G, Zheng X, Jiang S and Jiang
L: Autophagy activation facilitates mechanical stimulation-promoted
osteoblast differentiation and ameliorates hindlimb
unloading-induced bone loss. Biochem Biophys Res Commun.
498:667–673. 2018.PubMed/NCBI View Article : Google Scholar
|
|
17
|
Lim HJ, Crowe P and Yang JL: Current
clinical regulation of PI3K/PTEN/Akt/mTOR signalling in treatment
of human cancer. J Cancer Res Clin Oncol. 141:671–689.
2015.PubMed/NCBI View Article : Google Scholar
|
|
18
|
Heras-Sandoval D, Perez-Rojas JM,
Hernandez-Damian J and Pedraza-Chaverri J: The role of
PI3K/AKT/mTOR pathway in the modulation of autophagy and the
clearance of protein aggregates in neurodegeneration. Cell Signal.
26:2694–2701. 2014.PubMed/NCBI View Article : Google Scholar
|
|
19
|
Rabanal-Ruiz Y, Otten EG and Korolchuk VI:
mTORC1 as the main gateway to autophagy. Essays Biochem.
61:565–584. 2017.PubMed/NCBI View Article : Google Scholar
|
|
20
|
Tan Q, Wu JY, Liu YX, Liu K, Tang J, Ye
WH, Zhu GH, Mei HB and Yang G: The neurofibromatosis type I gene
promotes autophagy via mTORC1 signalling pathway to enhance new
bone formation after fracture. J Cell Mol Med. 24:11524–11534.
2020.PubMed/NCBI View Article : Google Scholar
|
|
21
|
Zhao F, Feng G, Zhu J, Su Z, Guo R, Liu J,
Zhang H and Zhai Y: 3-Methyladenine-enhanced susceptibility to
sorafenib in hepatocellular carcinoma cells by inhibiting
autophagy. Anticancer Drugs. 32:386–393. 2021.PubMed/NCBI View Article : Google Scholar
|
|
22
|
Song C, Song C and Tong F: Autophagy
induction is a survival response against oxidative stress in bone
marrow-derived mesenchymal stromal cells. Cytotherapy.
16:1361–1370. 2014.PubMed/NCBI View Article : Google Scholar
|
|
23
|
Livak KJ and Schmittgen TD: Analysis of
relative gene expression data using real-time quantitative PCR and
the 2(-Delta Delta C(T)) method. Methods. 25:402–408.
2001.PubMed/NCBI View Article : Google Scholar
|
|
24
|
Klionsky DJ, Abdelmohsen K, Abe A, Abedin
MJ, Abeliovich H, Acevedo Arozena A, Adachi H, Adams CM, Adams PD,
Adeli K, et al: Guidelines for the use and interpretation of assays
for monitoring autophagy (3rd edition). Autophagy. 12:1–222.
2016.PubMed/NCBI View Article : Google Scholar
|
|
25
|
Shibutani ST, Saitoh T, Nowag H, Münz C
and Yoshimori T: Autophagy and autophagy-related proteins in the
immune system. Nat Immunol. 16:1014–1024. 2015.PubMed/NCBI View Article : Google Scholar
|
|
26
|
Yang K, Guo W, Ren T, Huang Y, Han Y,
Zhang H and Zhang J: Knockdown of HMGA2 regulates the level of
autophagy via interactions between MSI2 and Beclin1 to inhibit
NF1-associated malignant peripheral nerve sheath tumour growth. J
Exp Clin Cancer Res. 38(185)2019.PubMed/NCBI View Article : Google Scholar
|
|
27
|
Lopez G, Torres K, Liu J, Hernandez B,
Young E, Belousov R, Bolshakov S, Lazar AJ, Slopis JM, McCutcheon
IE, et al: Autophagic survival in resistance to histone deacetylase
inhibitors: Novel strategies to treat malignant peripheral nerve
sheath tumors. Cancer Res. 71:185–196. 2011.PubMed/NCBI View Article : Google Scholar
|
|
28
|
de la Croix Ndong J, Stevens DM, Vignaux
G, Uppuganti S, Perrien DS, Yang X, Nyman JS, Harth E and
Elefteriou F: Combined MEK inhibition and BMP2 treatment promotes
osteoblast differentiation and bone healing in Nf1Osx-/-mice. J
Bone Miner Res. 30:55–63. 2015.PubMed/NCBI View Article : Google Scholar
|
|
29
|
Ma Y, Qi M, An Y, Zhang L, Yang R, Doro
DH, Liu W and Jin Y: Autophagy controls mesenchymal stem cell
properties and senescence during bone aging. Aging Cell.
17(e12709)2018.PubMed/NCBI View Article : Google Scholar
|
|
30
|
Nuschke A, Rodrigues M, Stolz DB, Chu CT,
Griffith L and Wells A: Human mesenchymal stem cells/multipotent
stromal cells consume accumulated autophagosomes early in
differentiation. Stem Cell Res Ther. 5(140)2014.PubMed/NCBI View Article : Google Scholar
|
|
31
|
Liu X, Wang Y, Cao Z, Dou C, Bai Y, Liu C,
Dong S and Fei J: Staphylococcal lipoteichoic acid promotes
osteogenic differentiation of mouse mesenchymal stem cells by
increasing autophagic activity. Biochem Biophys Res Commun.
485:421–426. 2017.PubMed/NCBI View Article : Google Scholar
|
|
32
|
Gomez-Puerto MC, Verhagen LP, Braat AK,
Lam EW, Coffer PJ and Lorenowicz MJ: Activation of autophagy by
FOXO3 regulates redox homeostasis during osteogenic
differentiation. Autophagy. 12:1804–1816. 2016.PubMed/NCBI View Article : Google Scholar
|
|
33
|
Chang H, Li X, Cai Q, Li C, Tian L, Chen
J, Xing X, Gan Y, Ouyang W and Yang Z: The PI3K/Akt/mTOR pathway is
involved in CVB3-induced autophagy of HeLa cells. Int J Mol Med.
40:182–192. 2017.PubMed/NCBI View Article : Google Scholar
|
|
34
|
Gao Y, Zhang Y and Fan Y: Eupafolin
ameliorates lipopolysaccharide-induced cardiomyocyte autophagy via
PI3K/AKT/mTOR signaling pathway. Iran J Basic Med Sci.
22:1340–1346. 2019.PubMed/NCBI View Article : Google Scholar
|
|
35
|
Schulte A, Ewald F, Spyra M, Smit DJ,
Jiang W, Salamon J, Jucker M and Mautner VF: Combined targeting of
AKT and mTOR inhibits proliferation of human NF1-associated
malignant peripheral nerve sheath tumour cells in vitro but not in
a xenograft mouse model in vivo. Int J Mol Sci.
21(1548)2020.PubMed/NCBI View Article : Google Scholar
|
|
36
|
Li XX, Zhang SJ, Chiu AP, Lo LH, Huang J,
Rowlands DK, Wang J and Keng VW: Targeting of AKT/ERK/CTNNB1 by
DAW22 as a potential therapeutic compound for malignant peripheral
nerve sheath tumor. Cancer Med. 7:4791–4800. 2018.PubMed/NCBI View Article : Google Scholar
|
|
37
|
Kim YC and Guan KL: mTOR: A pharmacologic
target for autophagy regulation. J Clin Invest. 125:25–32.
2015.PubMed/NCBI View Article : Google Scholar
|
|
38
|
Hosokawa N, Hara T, Kaizuka T, Kishi C,
Takamura A, Miura Y, Iemura S, Natsume T, Takehana K, Yamada N, et
al: Nutrient-dependent mTORC1 association with the
ULK1-Atg13-FIP200 complex required for autophagy. Mol Biol Cell.
20:1981–1991. 2009.PubMed/NCBI View Article : Google Scholar
|
|
39
|
Blommaart EF, Krause U, Schellens JP,
Vreeling-Sindelarova H and Meijer AJ: The phosphatidylinositol
3-kinase inhibitors wortmannin and LY294002 inhibit autophagy in
isolated rat hepatocytes. Eur J Biochem. 243:240–246.
1997.PubMed/NCBI View Article : Google Scholar
|
|
40
|
Petiot A, Ogier-Denis E, Blommaart EF,
Meijer AJ and Codogno P: Distinct classes of phosphatidylinositol
3'-kinases are involved in signaling pathways that control
macroautophagy in HT-29 cells. J Biol Chem. 275:992–998.
2000.PubMed/NCBI View Article : Google Scholar
|
|
41
|
Wu YT, Tan HL, Shui G, Bauvy C, Huang Q,
Wenk MR, Ong CN, Codogno P and Shen HM: Dual role of
3-methyladenine in modulation of autophagy via different temporal
patterns of inhibition on class I and III phosphoinositide
3-kinase. J Biol Chem. 285:10850–10861. 2010.PubMed/NCBI View Article : Google Scholar
|
|
42
|
Li Y, Su J, Sun W, Cai L and Deng Z:
AMP-activated protein kinase stimulates osteoblast differentiation
and mineralization through autophagy induction. Int J Mol Med.
41:2535–2544. 2018.PubMed/NCBI View Article : Google Scholar
|
|
43
|
Chen X, Sun K, Zhao S, Geng T, Fan X, Sun
S, Zheng M and Jin Q: Irisin promotes osteogenic differentiation of
bone marrow mesenchymal stem cells by activating autophagy via the
Wnt//β-catenin signal pathway. Cytokine. 136(155292)2020.PubMed/NCBI View Article : Google Scholar
|