Introduction
Multiple organ dysfunction induced by severe
infection, sepsis and septic shock is one of the main causes of
mortality in patients who are critically ill (1). Although treatment strategies have
been gradually improving over the past decades, there remain to be
obstacles regarding complications induced by pathophysiological
processes, including acute renal injury (AKI). AKI occurs in ~19%
patients with moderate sepsis, 23% of patients with severe sepsis
and 51% patients with septic shock when blood bacterial cultures
are positive (1). The hemodynamic
fluctuation during septic shock entails a phase of high cardiac
output (CO) with low peripheral vascular resistance, followed by
low CO with high peripheral resistance (2). The reaction to low CO in renal
perfusion is different from other organs, which makes a more severe
decrease in renal perfusion due to hypo-hemodynamic fluctuation
than other organs when the patients suffer with sepsis (2).
Color Doppler flow imaging (CDFI) is a rapid,
noninvasive and replicable technology for AKI detection, which has
been used to assess changes in renal perfusion in patients who are
critically ill (3,4). In addition, contrast-enhanced
ultrasound (CEUS) allows for a more accurate noninvasive estimation
of the renal blood flow and provides quantitative measurements of
local blood volume and velocity in selective regions of interest
(ROI). Ulinastatin (UTI) is a human protease inhibitor that can be
only isolated from the male urine because of the influence of
estrogen, and it represents a glycoprotein with a typical Kuniz
protease inhibitor structure (5,6). UTI
that has a broad spectrum of enzyme inhibitory activity (5,6).
Therefore, UTI has been used clinically for the prevention of
multiple organ dysfunction (7,8).
However, there are few studies regarding its effect on AKI
The aim of the present study was to assess the
potential effect of UTI on renal perfusion using Doppler
ultrasonography in a porcine model of septic shock.
Materials and methods
Animal preparation
A total of 32 healthy male Landrace pigs aged 8-10
weeks and weighing 30±2 kg, purchased from Lvyuanweiye Co. (license
no. SCXK 11-00-002), were housed in cages at 20-25˚C and humidity
of 30-60% maintained by air conditioner with free access to food
and water before the experiment. The room had a 12-h light/dark
cycle. The present study was performed with the approval of the
Ethics Committee of Beijing Chao-Yang Hospital, Capital Medical
University (Beijing, China). Animal experiments were performed in
accordance with the National Research Council's 1996 Guide for the
Care and Use of Laboratory Animals (9).
Anesthesia was induced by midazolam (0.2 mg/kg,
injected intramuscularly), followed by continuous intravenous
infusion of pentobarbital (8 mg/kg/h) and fentanyl (5 µg/kg/h) for
analgesia according to guidelines (9-12).
Ringer's solution was administered intravenously to maintain
sufficient preload. The right femoral artery and vein were
dissected to insert a 5-Fr PiCCO catheter (Pulsiocath PV2015L20;
Pulsion Medical Systems SE) into the descending aorta and to insert
a central venous catheter (cat. no. CV-17702-E; Arrow
International, Inc.) into the right atrium. The arterial and
central venous catheters were connected to a monitor (Philips
Medical Systems B.V.) to continuously monitor the hemodynamics and
blood temperature.
After anesthesia, all animals were intubated using a
cuffed 6.5-mm endotracheal tube. Mechanical ventilation was
provided by a ventilator (Evita 4; Dräger Medizintechnik) with a
tidal volume of 8 ml/kg, a respiratory frequency of 12 breaths/min
and a positive end-expiratory pressure of 5 cm H2O. The
arterial oxygen saturation (SaO2) and end tidal
concentration of CO2 (EtPCO2) were
continuously measured by the monitor. The respiratory frequency and
the fraction of inspired oxygen (FiO2) were adjusted to
maintain an EtPCO2 of 35-40 mmHg and an SaO2
of >90%.
Experimental protocols
Baseline data were obtained after 1 h of model
establishment. Animals were randomly assigned to the following four
groups: i) The sham group (SH; n=5); ii) the septic shock group
(SS; n=9); iii) the septic shock treated with vancomycin group
(VAN; 500 mg; Eli Lilly and Company; n=9); and iv) the septic shock
treated with UTI (50,000 U; Guangdong Techpool Bio-Pharma Co. Ltd.)
+ vancomycin group (UTI; n=9). The number of animals was confirmed
according to a previous investigation (12). No other procedures were performed
in the SH group apart from catheter insertion and mechanical
ventilation. All animals in the three experimental groups were
exposed to smoke from 50 g burning cotton using a bee smoker
according to previously described methods (13-15).
Arterial carboxyhemoglobin levels were measured using a portable
monitor (Rad-57; Masimo Corp.) to ensure that each animal had
received an equivalent dose of smoke. After 12 breaths of cotton
smoke were insufflated into the lungs, animals were allowed to
breathe normal air for 2 min. Four sets of smoke inhalations (12
breaths of smoke, 2 min rest, 12 breaths of smoke; total of 48
breaths) were performed.
Live methicillin-resistant Staphylococcus
aureus (MRSA), which was separated from the blood of a
middle-aged male patient with blood infection (12), was cultured at the bacterial
experimental lab of Chao-Yang Hospital (Beijing, China). Following
smoking injury, 3x10¹¹ cfu MRSA suspended in 30 ml
sterile saline were instilled into the lungs of animals except for
the sham group using a bronchoscope (12). Subsequently, 15 mg/kg vancomycin or
15 mg/kg of vancomycin + 50,000 U/kg UTI dissolved in 100 ml saline
were infused into the central venous catheter every 12 h in the VAN
and UTI group, respectively. Before the humane endpoints of the
study, 10 ml blood were sampled into an aerobic culture bottle
(BacT/ALERT FA; bioMérieux Inc.) for blood culture.
All animals were continuously monitored during the
entire protocol. The humane endpoints of the study were 24 h after
modeling or no pulse signal detected on the monitor. After that,
euthanasia was performed by the infusion of overdose pentobarbital
(40 mg/kg) followed by a lethal dose potassium chloride (15% KCl
500 mg/kg) in accordance with the AVMA guidelines for the
euthanasia of animals (16,17).
Death was confirmed by the cessation of vital signs, which were
shown as the single lines of pulse and electrocardiograph on the
monitor. The right kidney was then dissected for histopathology
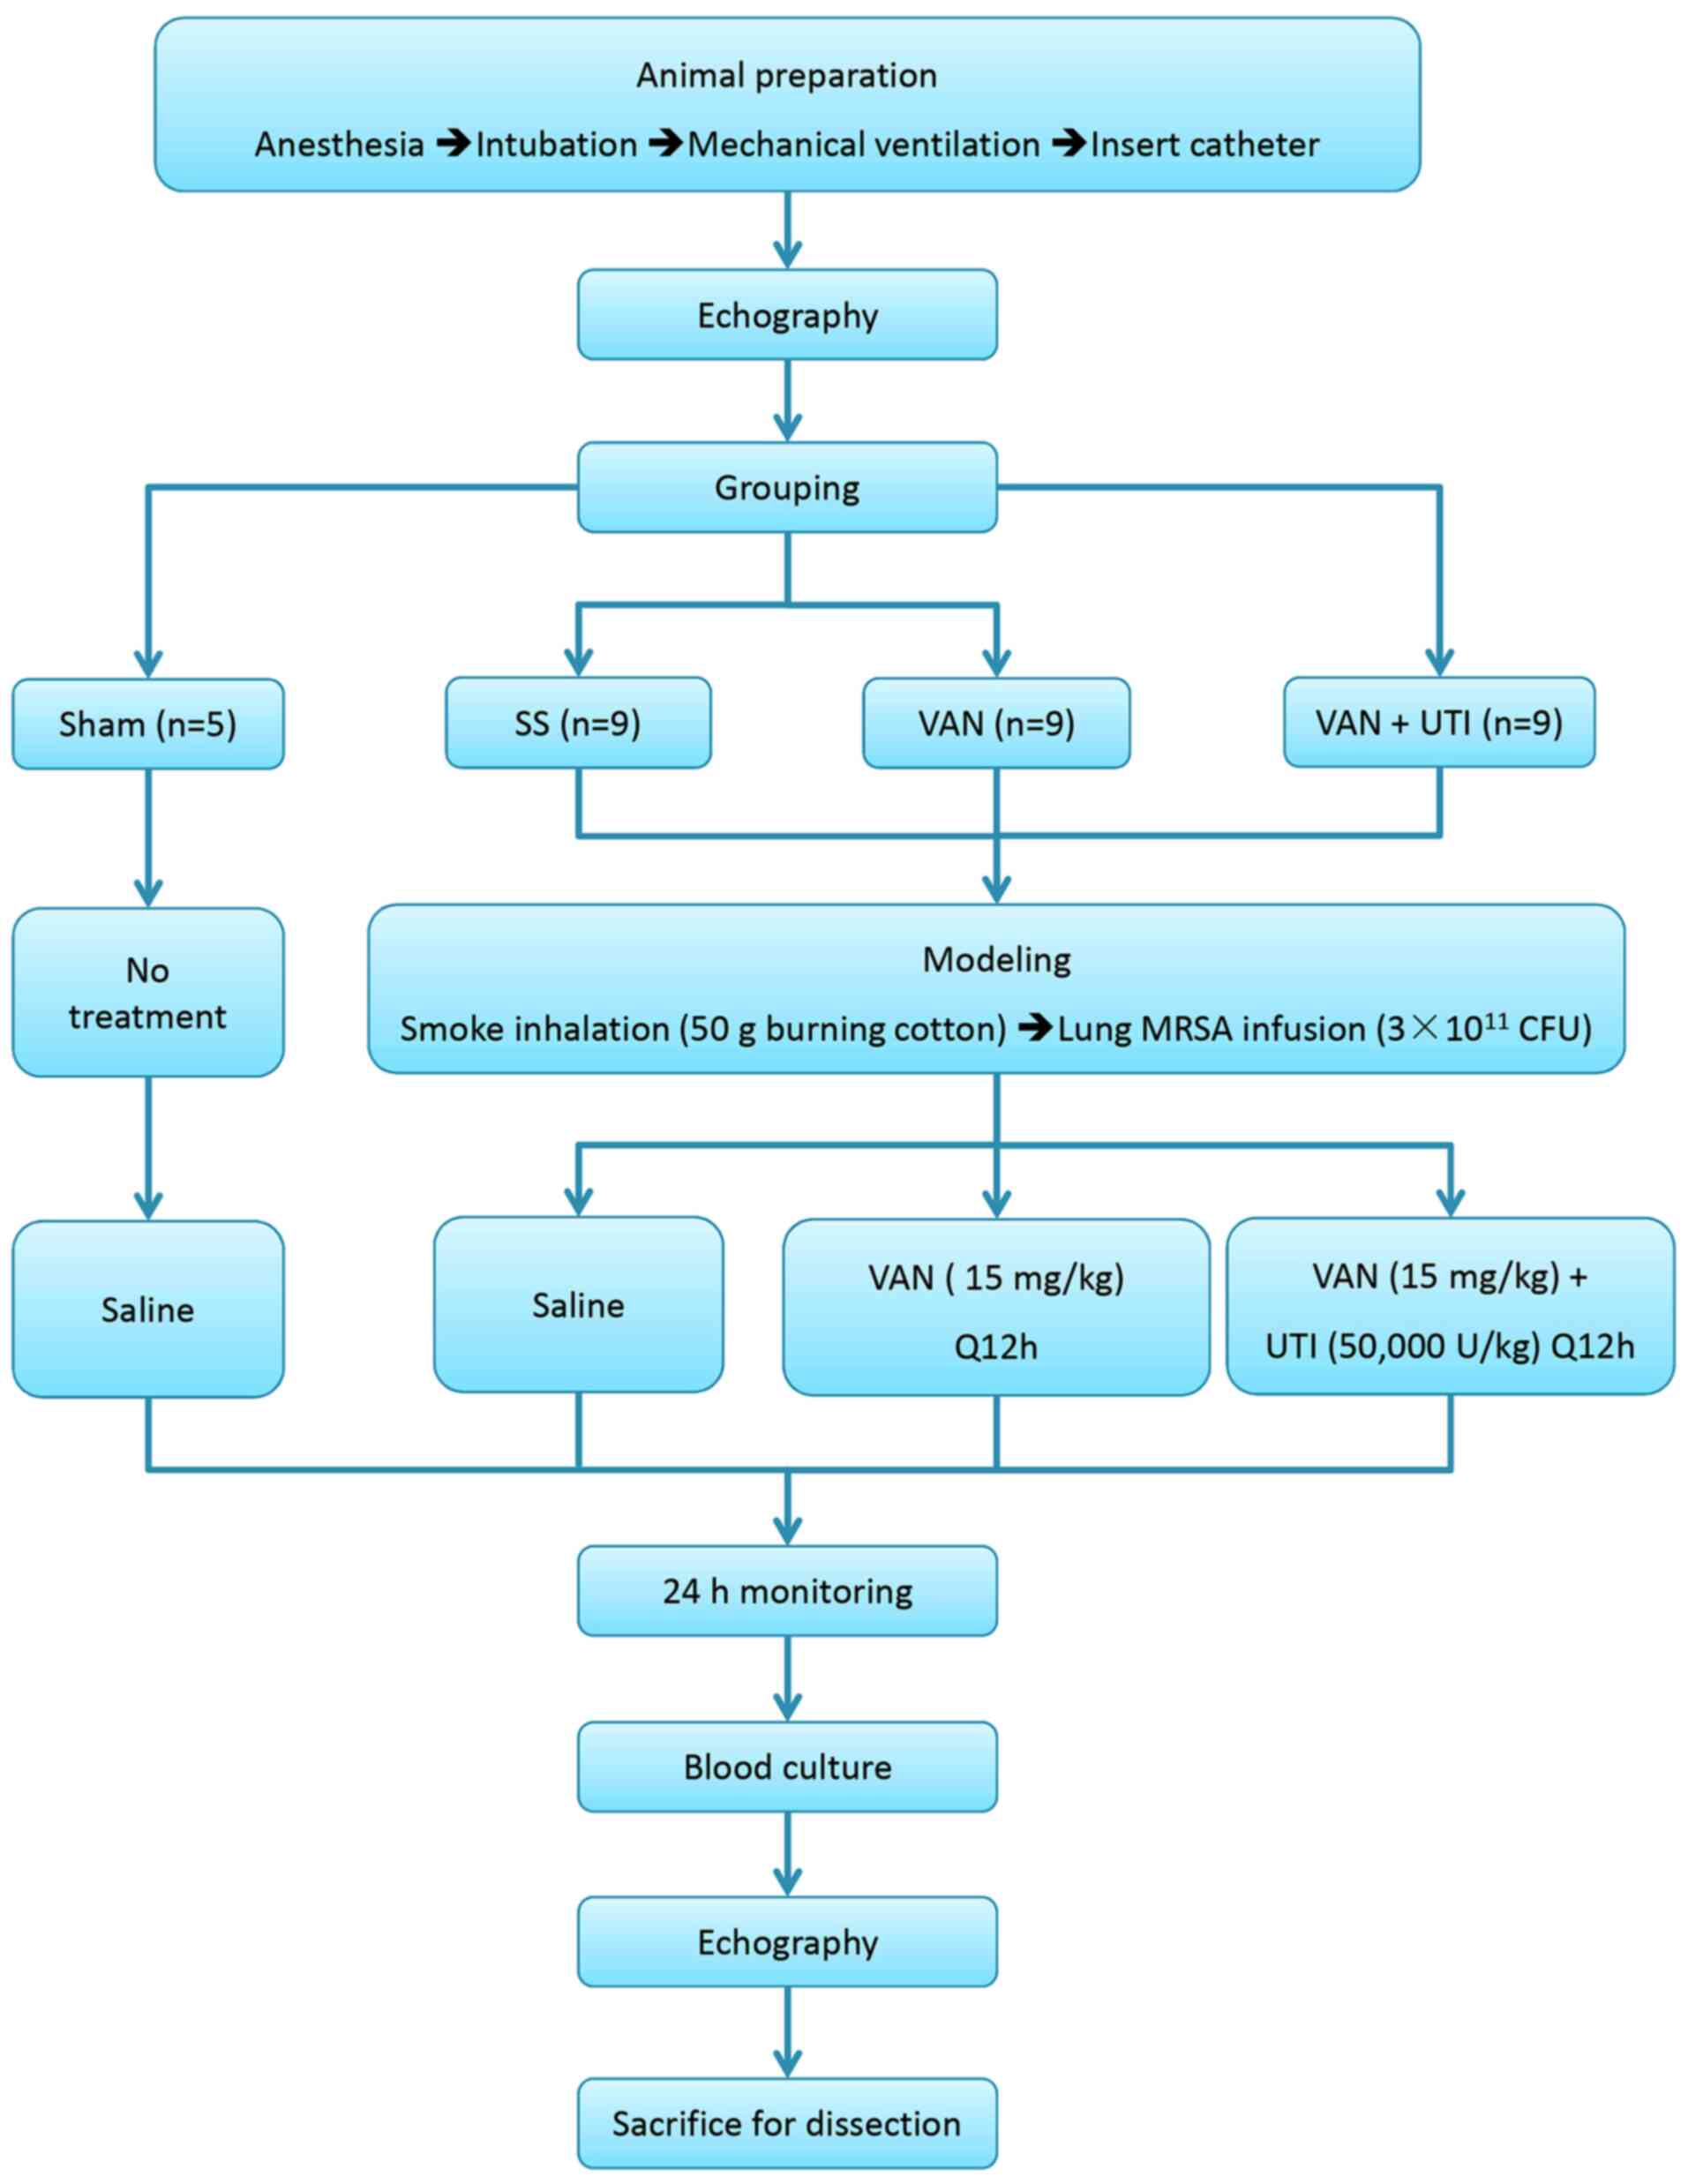
testing. The diagram of experimentation is presented in Fig. 1.
Hemodynamics
A total of 10 ml of 4˚C saline was injected into the
right atrium through the central venous catheter at 0 (baseline),
2, 6, 12 and 24 h to determine CO using the thermodilution method
(18). Systemic vascular
resistance (SVR) was calculated by the monitor. All animals were
anaesthetized continuously for 24 h. Heart rate (HR) and mean
arterial pressure (MAP) were recorded continuously.
A total of 1 ml arterial blood samples for blood gas
and lactic acid (Lac) analysis (GEM Premier 3000 Blood Gas
Analyzer; Instrumentation Laboratory) were collected from the PiCCO
catheter at the baseline and 24 h after injury.
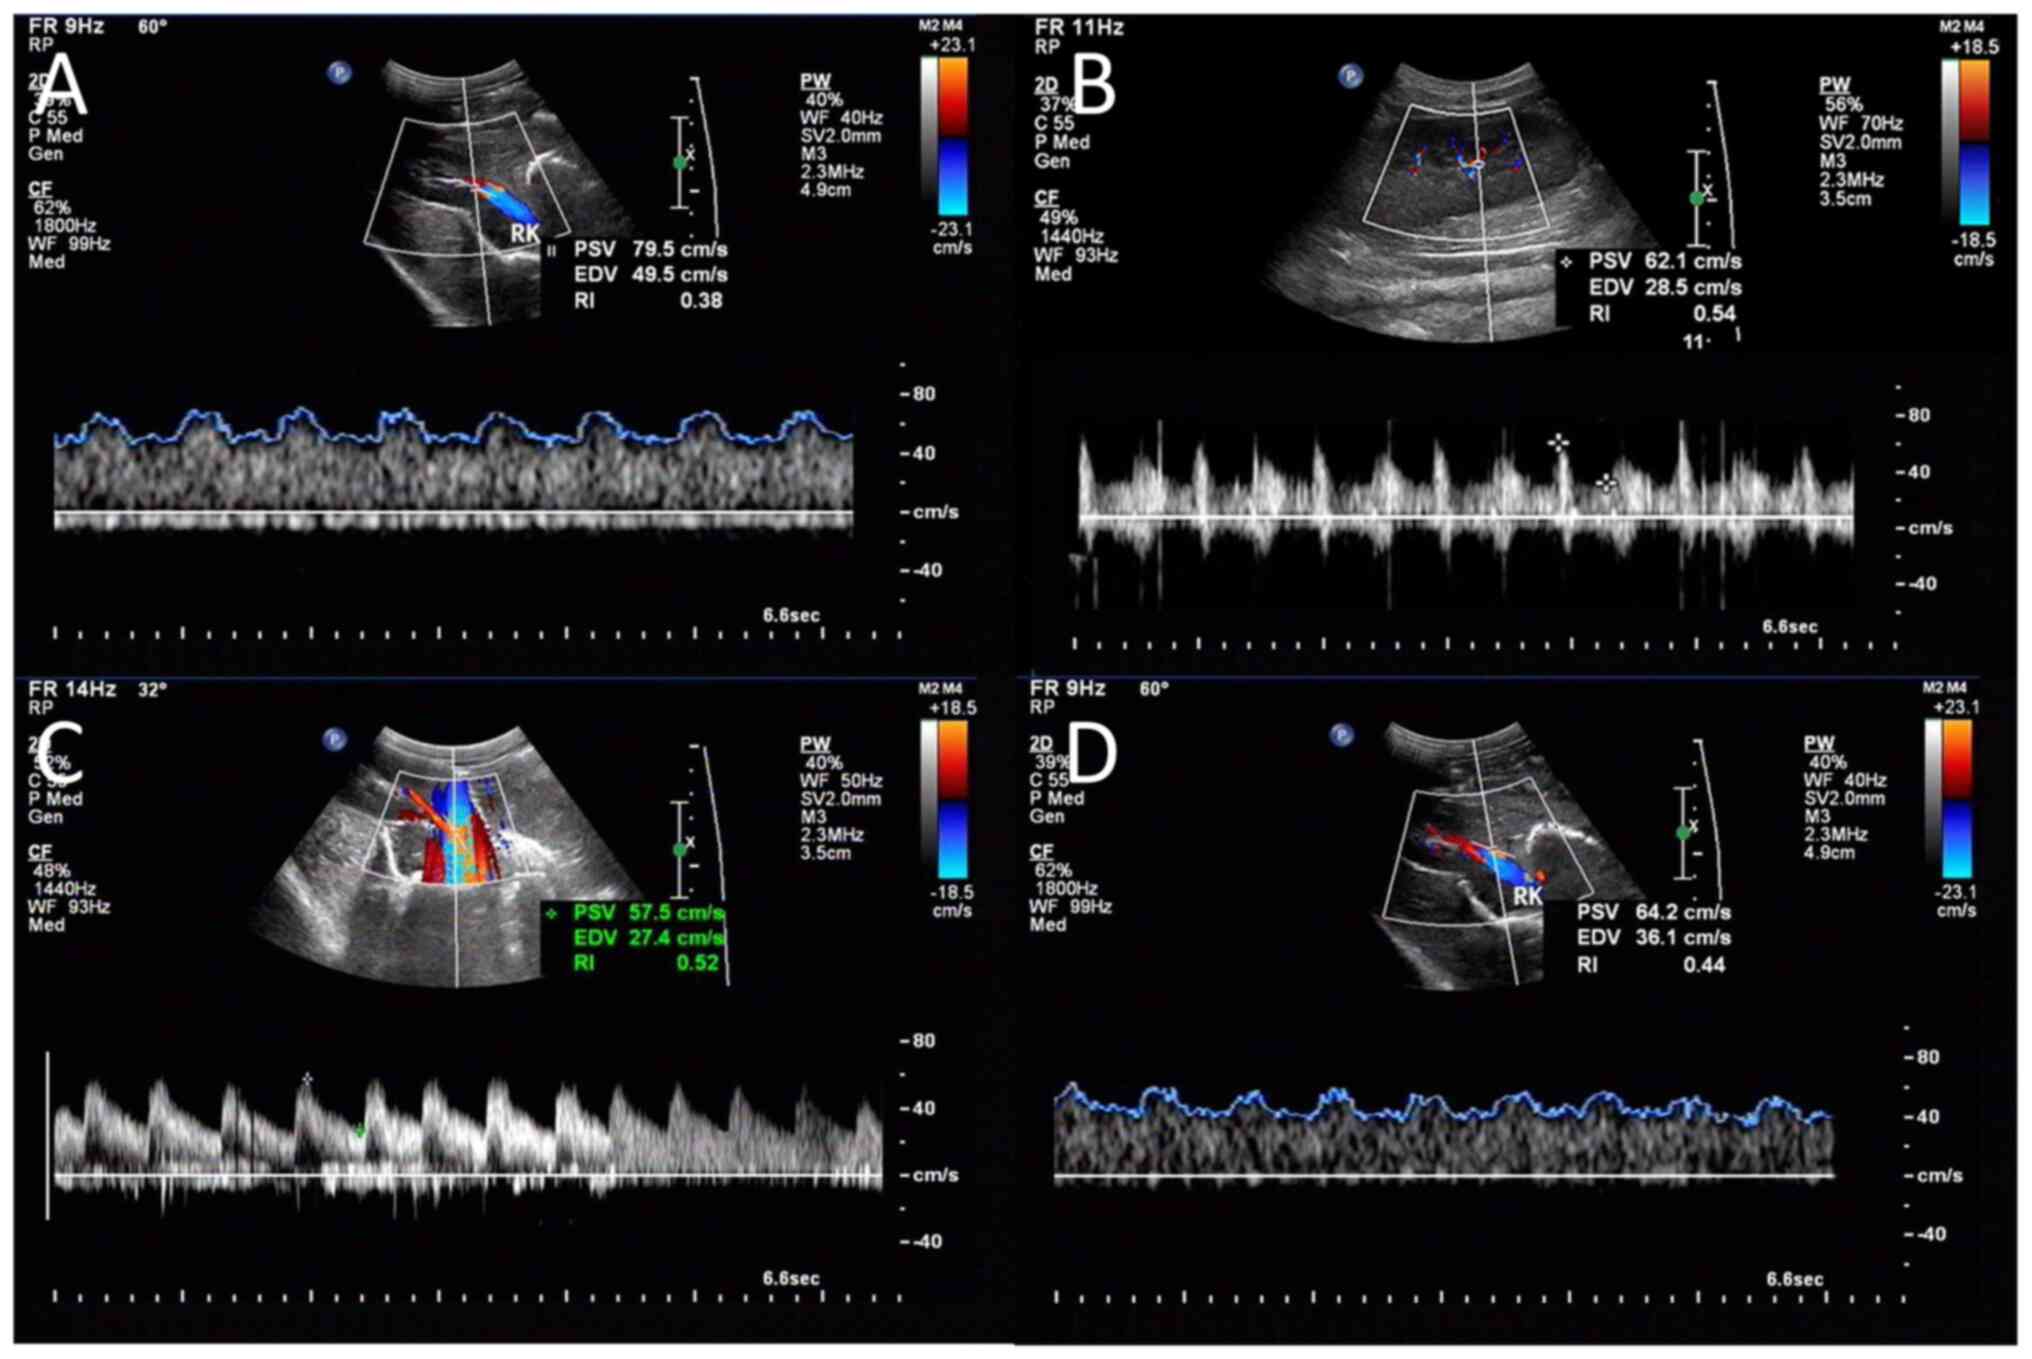
CDFI and CEUS
CDFI and CEUS were performed on the right kidney at
the baseline and the end of the protocol (24 h) by an experienced
ultrasound physician who was blinded to the study, using an
ultrasound system (Aplio 500 TUS-A500; Canon Medical Systems
Corporation). The probe was put on the right side of the animal's
abdomen to obtain a clear image of the right kidney. An interlobar
or arcuate artery was selected to obtain result from the
measurement. The spectrum was considered optimal when ≥ three
similar consecutive waveforms were visualized (Fig. 2A-D). The corrected resistive index
(cRI) was calculated using the following equations (3). Three measurements were performed and
averaged to obtain the mean cRI value. RI=(peak systolic
velocity-minimum diastolic velocity)/peak systolic velocity.
cRI=[observed RI -0.0026 x (80-observed HR)].
For CEUS, 2 ml sulphur hexafluoride (SF6)
microbubbles (8 µl SF6/ml; SonoVue®; Bracco
Suisse SA) were bolus injected via the central venous catheter. ROI
(26 mm2) was manually drawn within the renal cortex to
create a time-intensity curve (TIC) with the QLAB software (Philips
Healthcare). The peak intensity (Pi), area under the curve (AUC),
time from peak to one half (Th), time to peak (Tp) and wash-in
slope (Slope) were calculated by the QLAB software automatically
(Fig. 3A-D and Video S1, Video S2, Video S3 and Video S4). Three injections were done at
intervals of 5 min to obtain an average value. The same renal
cortex ROI was used to prevent the influence of the respiratory
motion for each bolus injection.
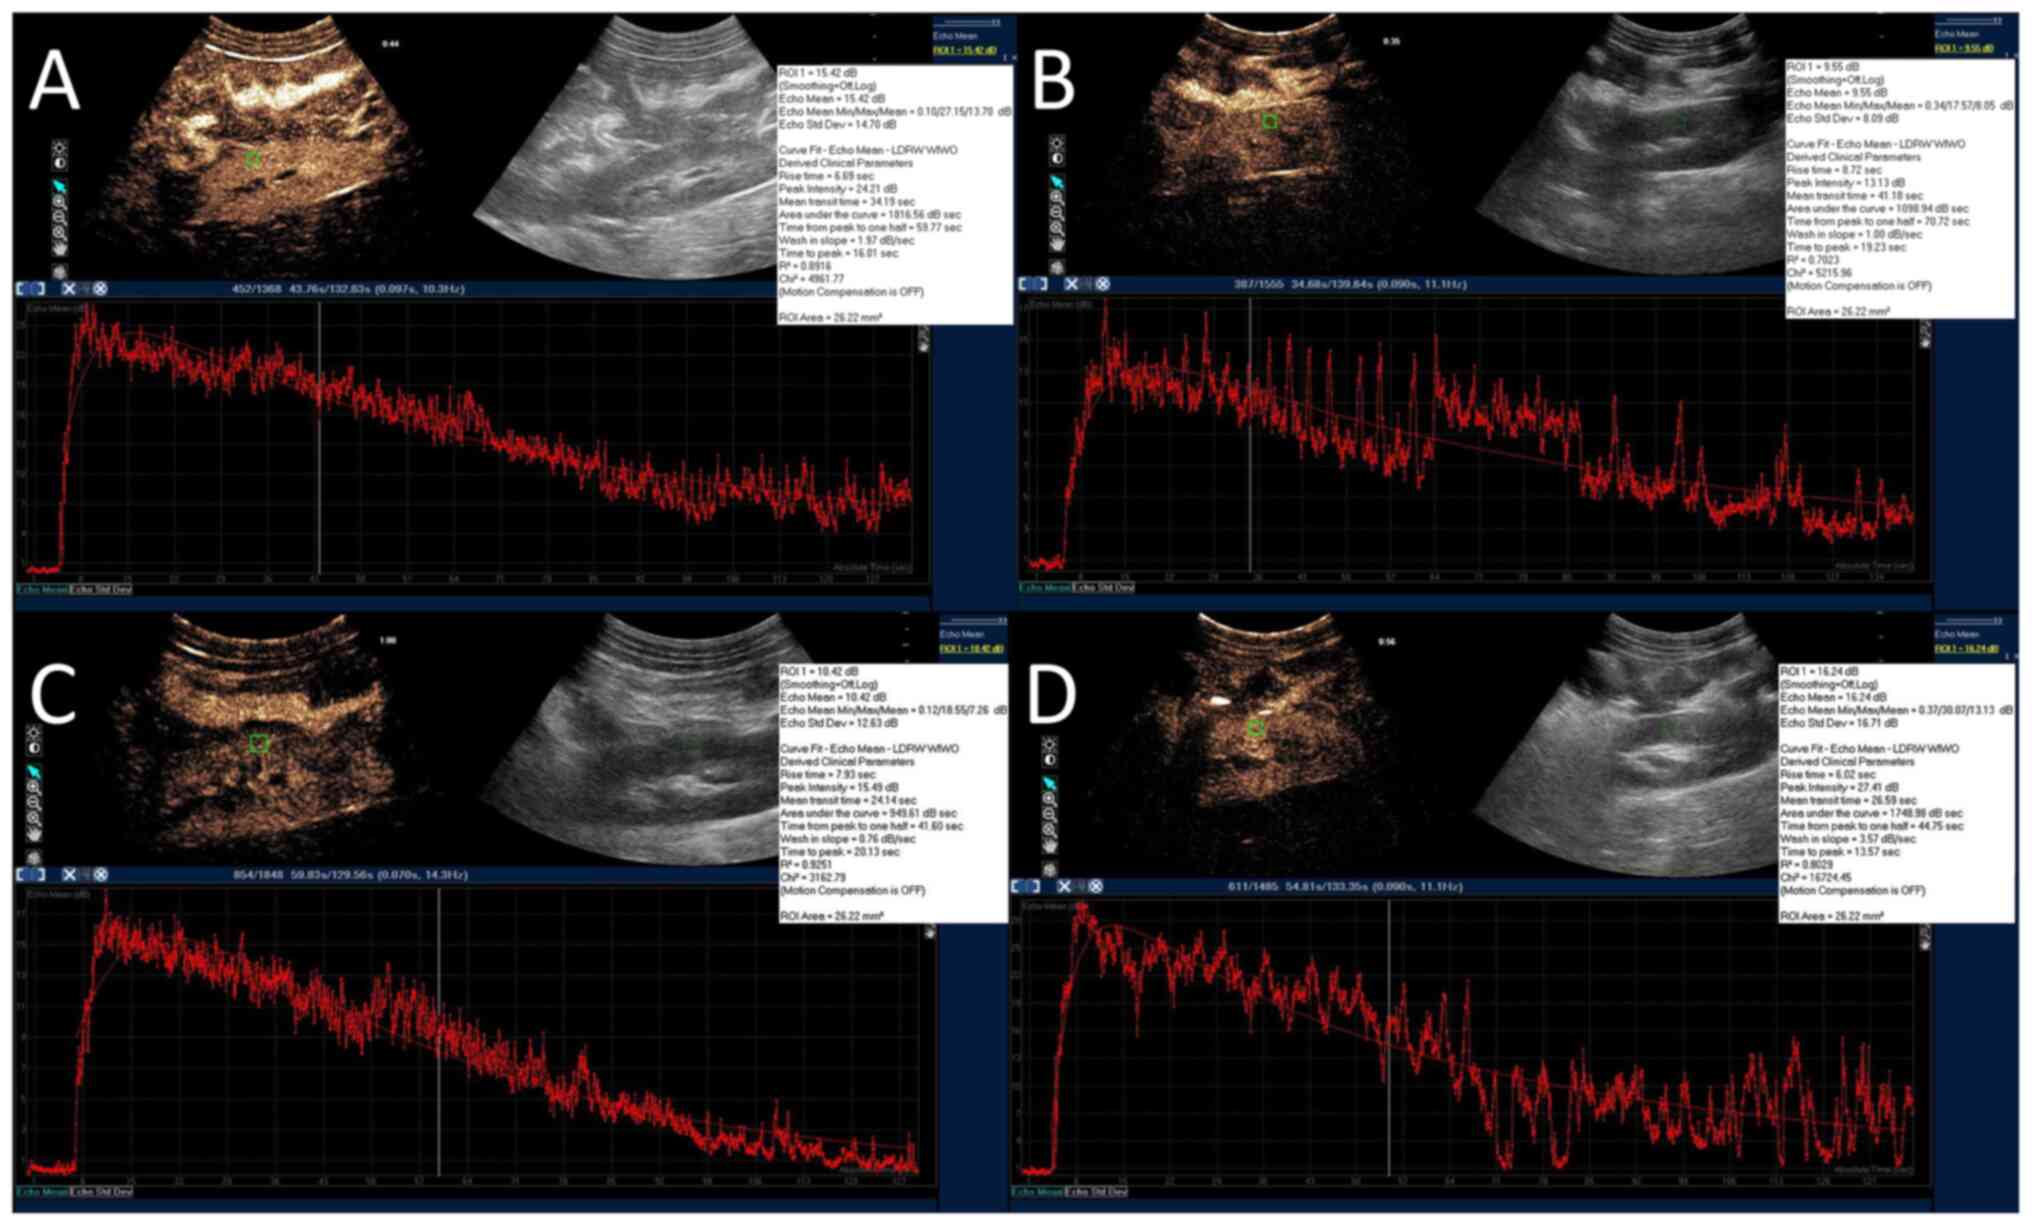 | Figure 3Representative CEUS images. For CEUS,
2 ml sulphur hexafluoride microbubbles were bolus injected via the
central venous catheter. A ROI (26 mm2; green square)
was manually drawn within the renal cortex to create a
time-intensity curve with the ultrasound system's QLAB software
(red curves). The peak intensity, area under the curve, time from
peak to 50% of maximum, time to peak and wash-in slope were
calculated by the software automatically. (A) SH group. (B) SS
group. (C) VAN group. (D) UTI group. CEUS, contrast enhanced
ultrasound; SH, sham group; SS, septic shock group; VAN, vancomycin
group; UTI, the ulinastatin group; ROI, region of interest. |
Pathology and apoptosis assay
After the animals were euthanized, the upper pole of
right renal cortex was surgically removed and preserved in 4%
paraformaldehyde >24 h at room temperature. For light microscope
(LM) observation, paraffin embedded tissues were cut as a 10 µm
thickness. After dewaxing and rehydration, H&E staining were
performed at room temperature for 10 min. Dehydrated slices were
sealed by neutral gum and covered with glass. Subsequently, a grade
of renal injury of semi-quantitative evaluation was performed in
each animal (Table I) under LM at
x400 magnification according to previous study (19). TUNEL assay was used to label cells
in tissues that suffered severe DNA damage/fragmentation induced by
apoptotic signaling cascade activation. The prepared 10 µm sections
were incubated for 60 min at 37˚C with TUNEL reagent according to
the manufacturer's protocol (cat. no. C1091; Beyotime Institute of
Biotechnology). After hematoxylin counterstain for 10 sec at room
temperature, TUNEL-positive cells, which were colored brown, were
counted to determine the apoptotic index (AI) under LM at x400
magnification. AI=apoptotic cells staining brown/total
TUNEL-positive cells x100%. The pathological evaluations were
performed by an independent pathologist who has >10 years of
experience and was blinded to the present study.
 | Table IPathologic change for a
semi-quantitative evaluation of kidney injury. |
Table I
Pathologic change for a
semi-quantitative evaluation of kidney injury.
| Grade | Pathological
changes under light microscope |
|---|
| 0, Normal | Normal renal
histopathology |
| 1, Mild | Mild interstitial
edema, renal tubular necrosis, slight glomerular capillary
angiectasis and inflammatory cell infiltration |
| 2, Moderate | Pathologic changes
of renal between mild and severe |
| 3, Severe | Severe interstitial
edema, renal tubular necrosis, severe glomerular capillary
angiectasis, mesangial proliferation and severe inflammatory cell
infiltration |
Another part of the specimens was double fixed in
2.5% glutaraldehyde solution at 4˚C for 4 h with Millonig's
phosphate buffer (pH=7.3). The samples were incubated for 1 h in 1%
osmium tetroxide, then placed into 1:1 mix of acetone and epoxy
resin for 12 h and 100% epoxy resin to polymerize overnight at
37˚C. For the solidifying process, the samples were left to
polymerize at 37˚C, 60˚C and 72˚C for 24 h respectively, then
50-100 nm ultrathin sections of the specimens were obtained. After
3% uranyl acetate and 3% lead nitrate double staining for 30 min,
the specimens were observed under a transmission electron
microscope (TEM; HT7700; Hitachi, Ltd.).
Statistical analysis
Statistical analysis was performed on SPSS 19.0
software (IBM Corp.). Continuous variables with normal distribution
were confirmed using Kolmogorov-Smirnov test, were presented as the
mean ± SD. The mixed two-way ANOVA was used to analyze the effect
of time as a repeated measure and treatment groups as a
between-subjects factor. Subsequent analyzes of specific
differences at individual time points were performed with
Bonferroni test. Ordinal data (grade of renal injury) were
presented as median (IQR) and compared with Kruskal-Wallis followed
by Dunn's test. Linear regression was performed to determine
associations between the parameters. P<0.05 was considered to
indicate a statistically significant difference.
Results
Outcomes
No significant differences in blood temperature at
baseline were found among the four groups (P=0.954). A rapid
increase in blood temperature to >40˚C was observed in the three
experimental groups within 2 h after injury, whilst it remained
normal in the SH group during the entire protocol. In total, one
animal in the SS and VAN groups died at 16 h and 20 h after injury,
respectively. All other animals remained alive until the end of
protocol. All blood cultures of the SH, VAN and UTI group were
tested negative, whereas six of the nine animals in the SS group
were tested positive for MRSA (data not shown).
Hemodynamics and oxygenation
All parameters, including HR, MAP, CO and SVR, in
the SH group stayed at a relatively normal level throughout the
entire protocol. HR increased significantly in the SS group
compared with the SH and UTI group, which was higher than 133±7
beats/min 2 h after injury. The changes in HR in the VAN group were
similar to those in the SS group. However, HR decreased slowly 12 h
after injury in the UTI group, with significant differences
compared with that in the SS and VAN groups (Fig. 4A).
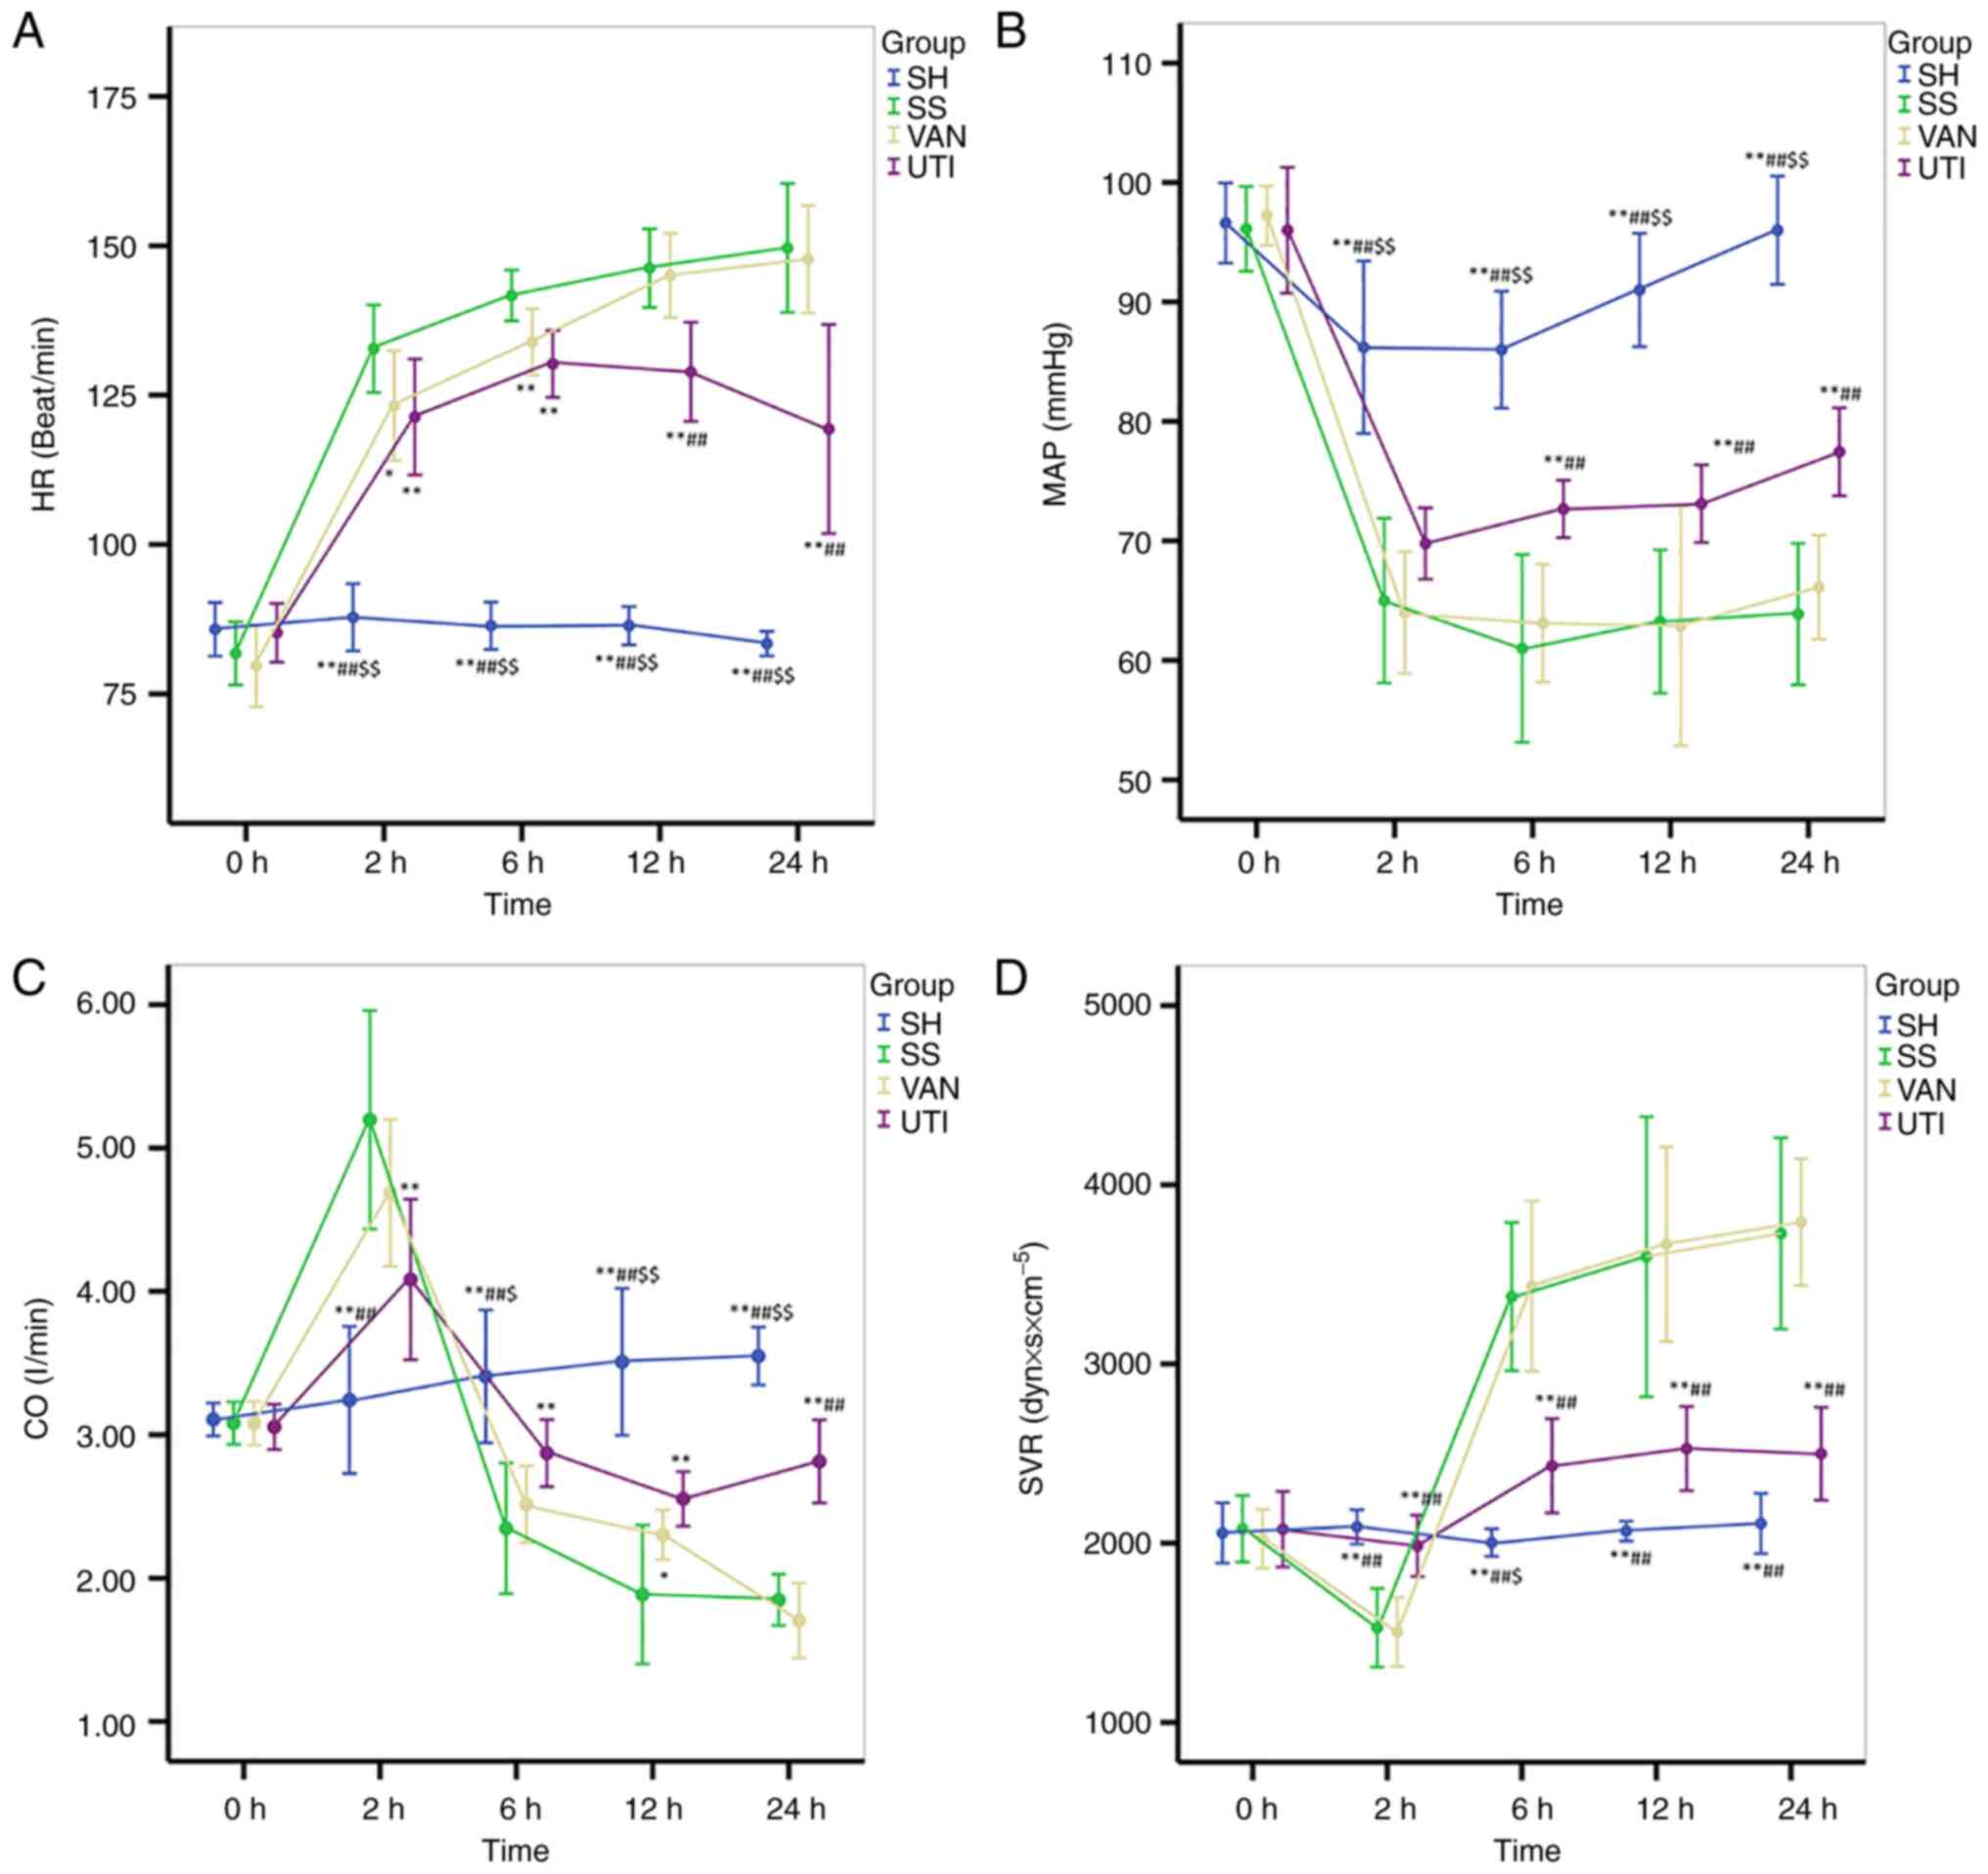 | Figure 4Hemodynamics. All parameters in the
SH group remained at a relatively normal level throughout the
entire protocol. The changes in the VAN group were similar to those
in the SS group. (A) In the UTI group, HR decreased slowly 12 h
after injury. (B) In the SS and VAN group, MAP decreased to 60-70
mmHg 2 h after injury, which remained at a low level. In the UTI
group, MAP was improved progressively 6 h after injury. Changes in
the (C) CO and (D) SVR in the SS and VAN groups were in the
opposite direction: CO increased 2 h after injury and then
decreased, whereas SVR decreased at the same time point then
increased. The fluctuations in CO and SVR in the UTI group were
ameliorated. *P<0.05, **P<0.01 vs. the
SS group; ##P<0.01 vs. the VAN group;
$P<0.05, $$P<0.01 vs. the UTI group.
HR, heart rate; MAP, mean arterial pressure; CO, cardiac output;
SVR, systemic vascular resistance. SH, sham group; SS, septic shock
group; VAN, vancomycin group; UTI, ulinastatin group. |
In the SS and VAN groups, MAP decreased to 60-70
mmHg 2 h after injury, which remained low thereafter. MAP in the
UTI group was also decreased 2 h after injury, but improved
progressively thereafter, with significantly higher values in
comparison with the SS or VAN groups at each time point from 6 h
after injury onwards (Fig. 4B).
Opposite trends in the changes in CO and SVR in both SS and VAN
groups were found. CO increased 2 h after injury and then decreased
(Fig. 4C). By contrast, the SVR
decreased at 2 h and then increased (Fig. 4D). The magnitude of the fluctuation
in CO in the UTI group were not as large as that in the SS and VAN
groups (Fig. 4C). In addition, at
24 h after injury, CO was significantly higher in the UTI group
compared with that in the SS or VAN group (Fig. 4C). SVR in the UTI group increased
slightly at 6 h after injury, then remained stable at the level of
slightly higher than that in the SH group thereafter (Fig. 4D). However, it was significantly
lower compared with that in the SS or VAN group (Fig. 4D).
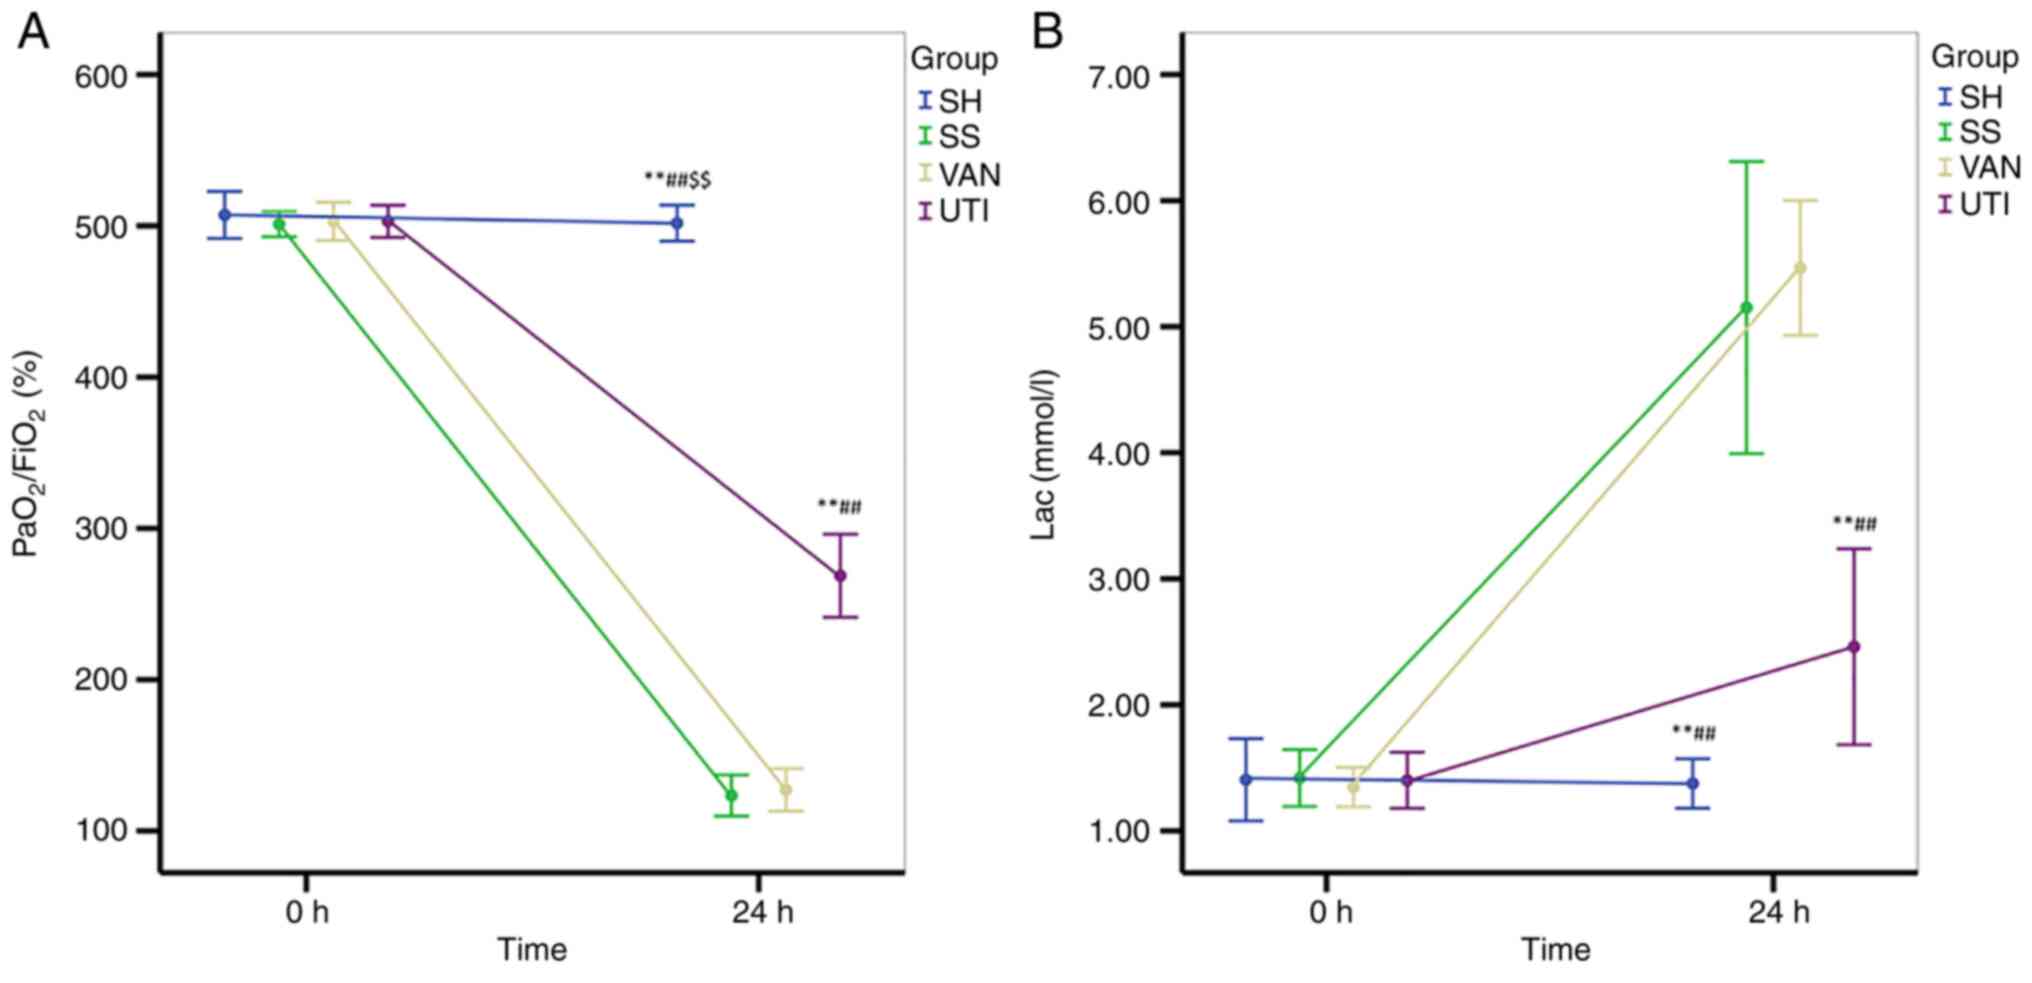
In the SS and VAN groups, the ratio of the partial
pressure of arterial oxygen (PaO2) to FiO2
was decreased after modeling, which remained at <200% (Fig. 5A). The
PaO2/FiO2 ratio in the UTI group was higher
compared with that in the SS and VAN groups, but lower than that in
the SH group (Fig. 5A). Lac levels
were significantly increased in all three of the experimental
groups compared with those in the SH group, but lac levels were
lower in the UTI group compared with those in the SS and VAN groups
(Fig. 5B).
CDFI and CEUS results
No significant difference of cRI was observed at the
baseline among all four groups, but cRi increased significantly at
24 h compared with the baseline except for that in the SH group
(Fig. 6A). However, a significant
difference of cRI was found between each experimental group and
that in the SH group (Fig.
6A).
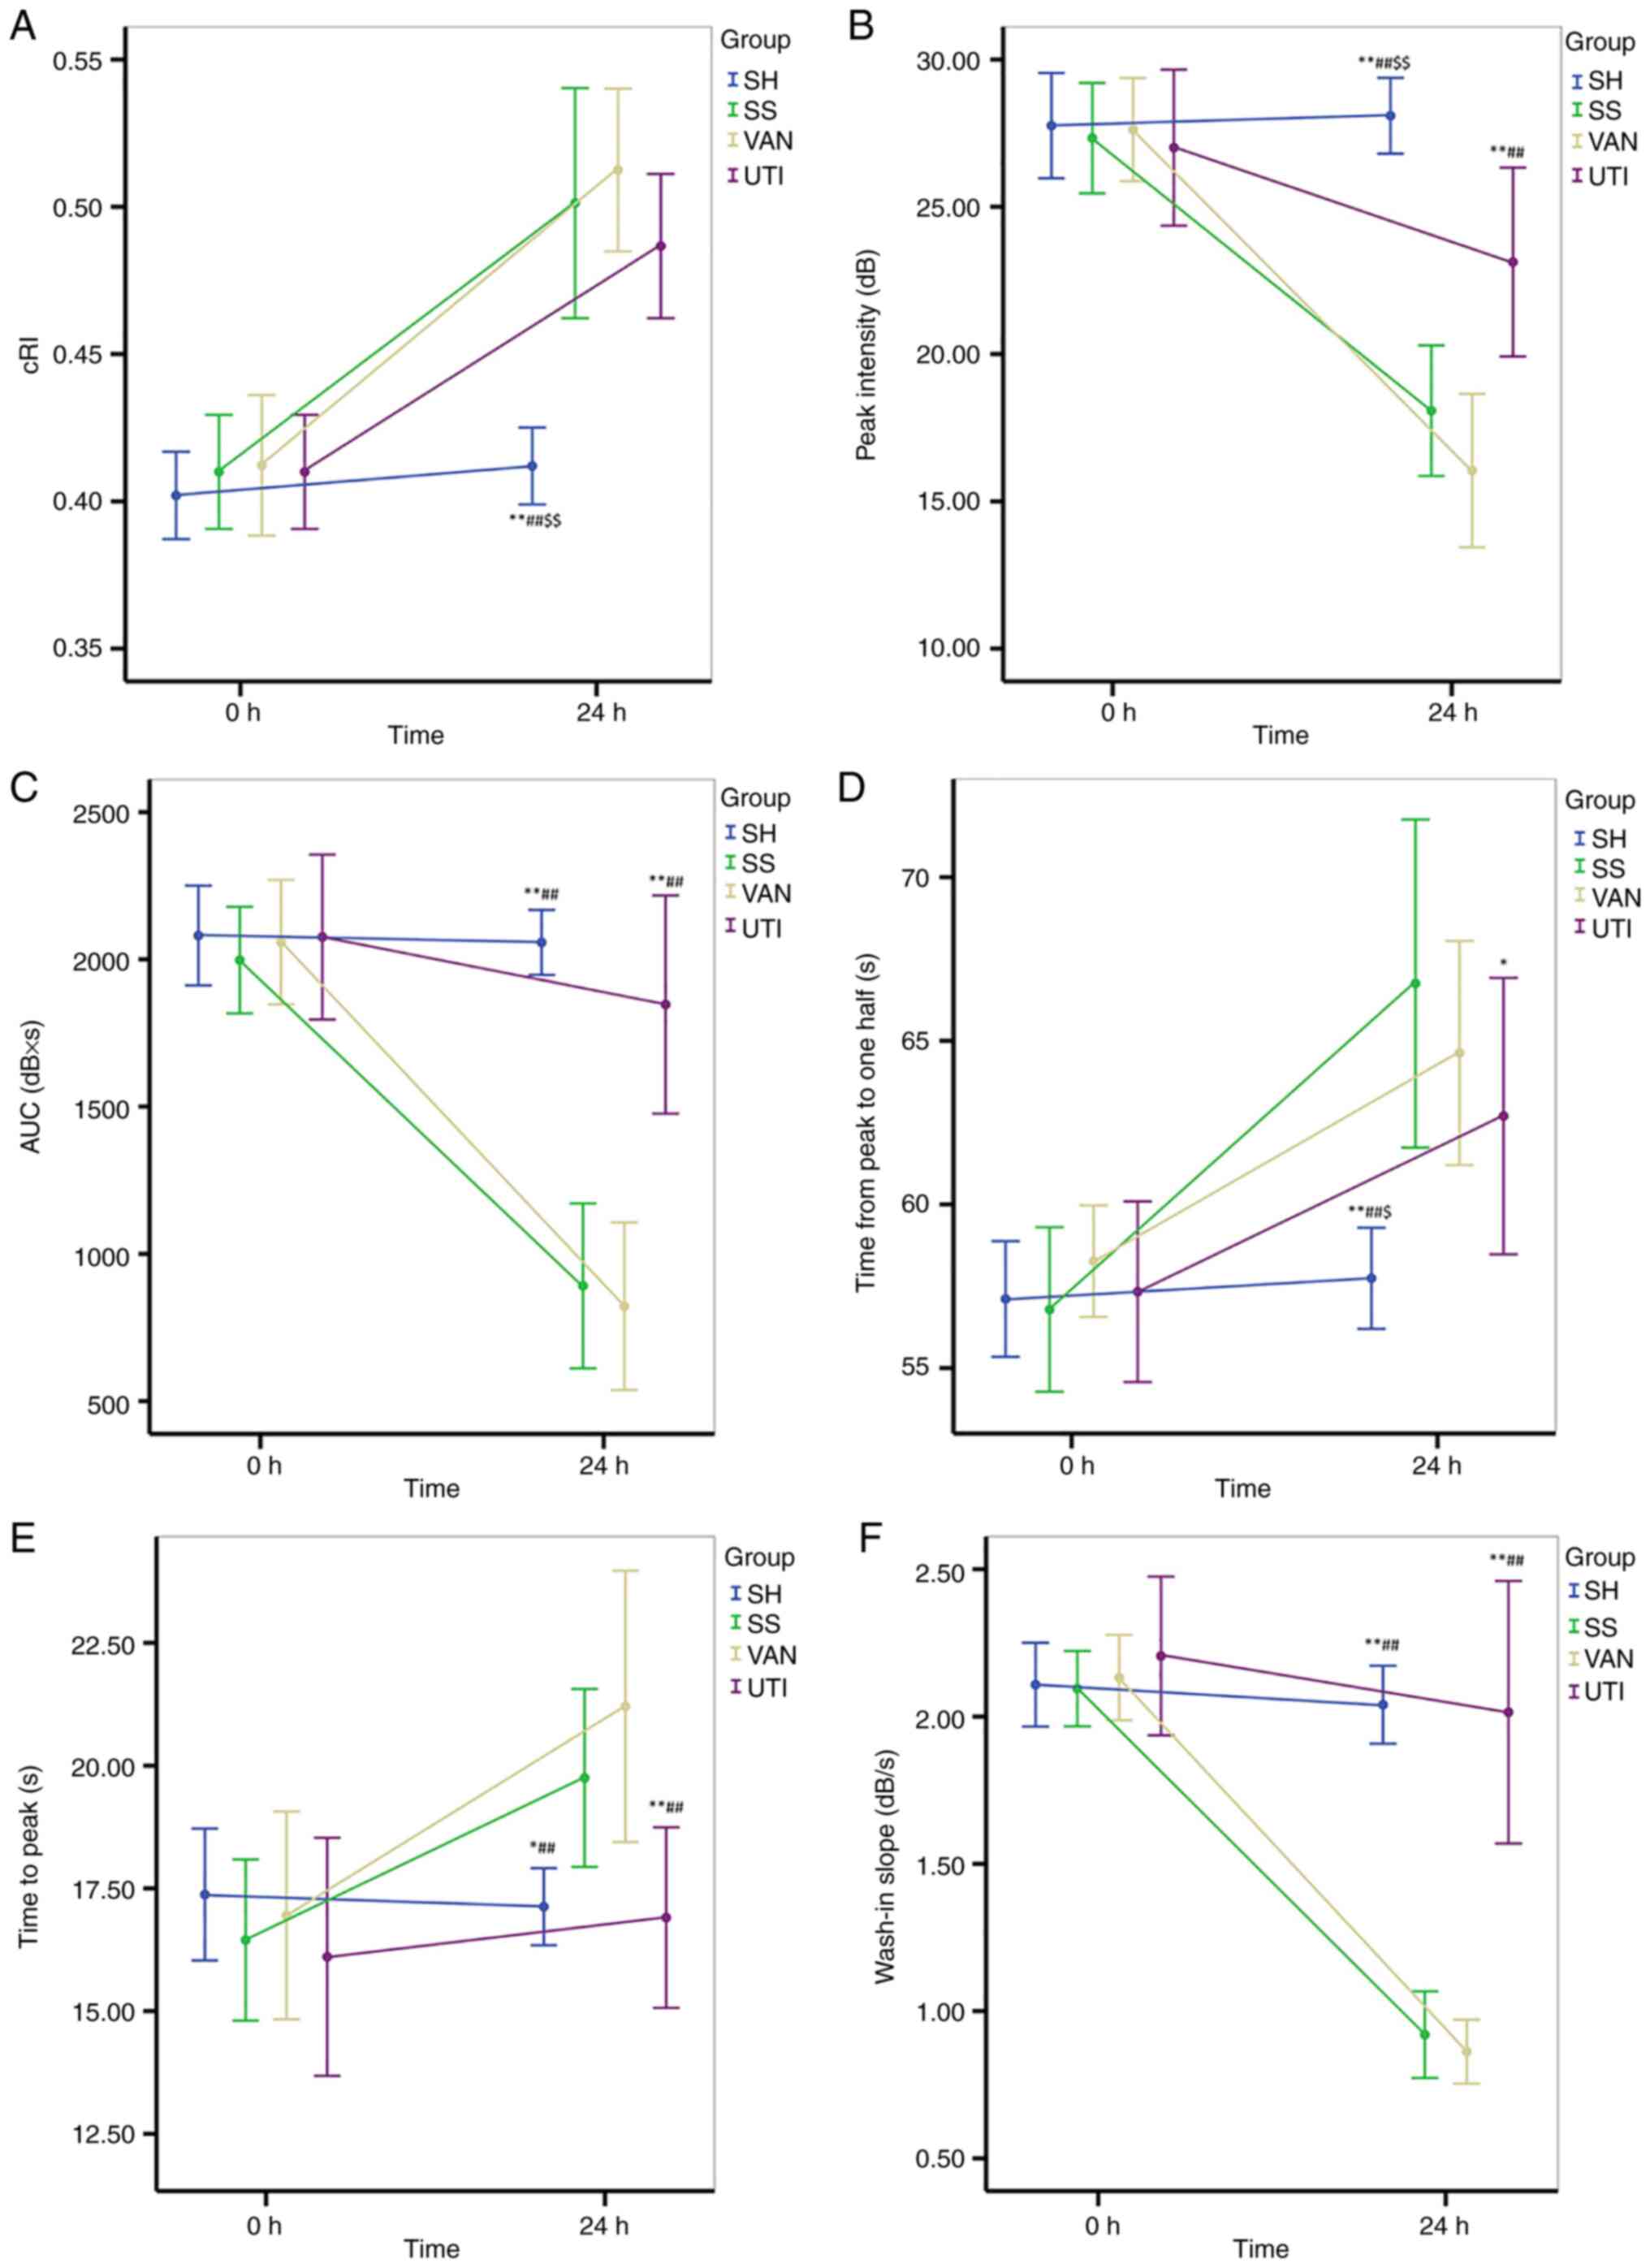 | Figure 6CDFI and CEUS. (A) cRI increased
significantly at the end of the protocol except for that in the SH
group. (B) Peak intensity decreased significantly after injury in
all experimental groups. The improvement was higher in the UTI
group than that in the SS and VAN groups. (C) AUC decreased after
injury in the SS and VAN groups, but was improved in the UTI group.
(D) Time from peak to 50% of maximum and (E) time to peak
significantly increased in the SS and VAN groups, but were improved
by UTI treatment. (F) Wash-in slope significantly decreased in the
SS and VAN groups, but was improved by UTI treatment.
*P<0.05, **P<0.01 vs. the SS group;
##P<0.01 vs. the VAN group; $P<0.05,
$$P<0.01 vs. the UTI group. CDFI, color doppler flow
imaging; CEUS, contrast enhanced ultrasound; cRI, corrected
resistive index; AUC, area under the curve. SH, sham group; SS,
septic shock group; VAN, vancomycin group; UTI, ulinastatin
group. |
The Pi decreased significantly after injury in all
experimental groups except the SH group, but was higher in the UTI
group compared with that in the SS and VAN groups (P<0.001;
Fig. 6B).
Similar to Pi, the AUC decreased after injury in the
SS and VAN groups, but was improved in the UTI group (Fig. 6C). Significant differences were
identified between the UTI and SS or VAN groups, but were not found
between the SH and UTI groups (Fig.
6C).
Compared with the baseline, the Th and Tp both
increased significantly in the SS and VAN groups (Fig. 6D and E), whereas the wash in slope decreased
significantly. All of the parameters aforementioned were improved
by the UTI treatment, where significant differences were found
between the UTI and SS or VAN groups (Fig. 6D-F).
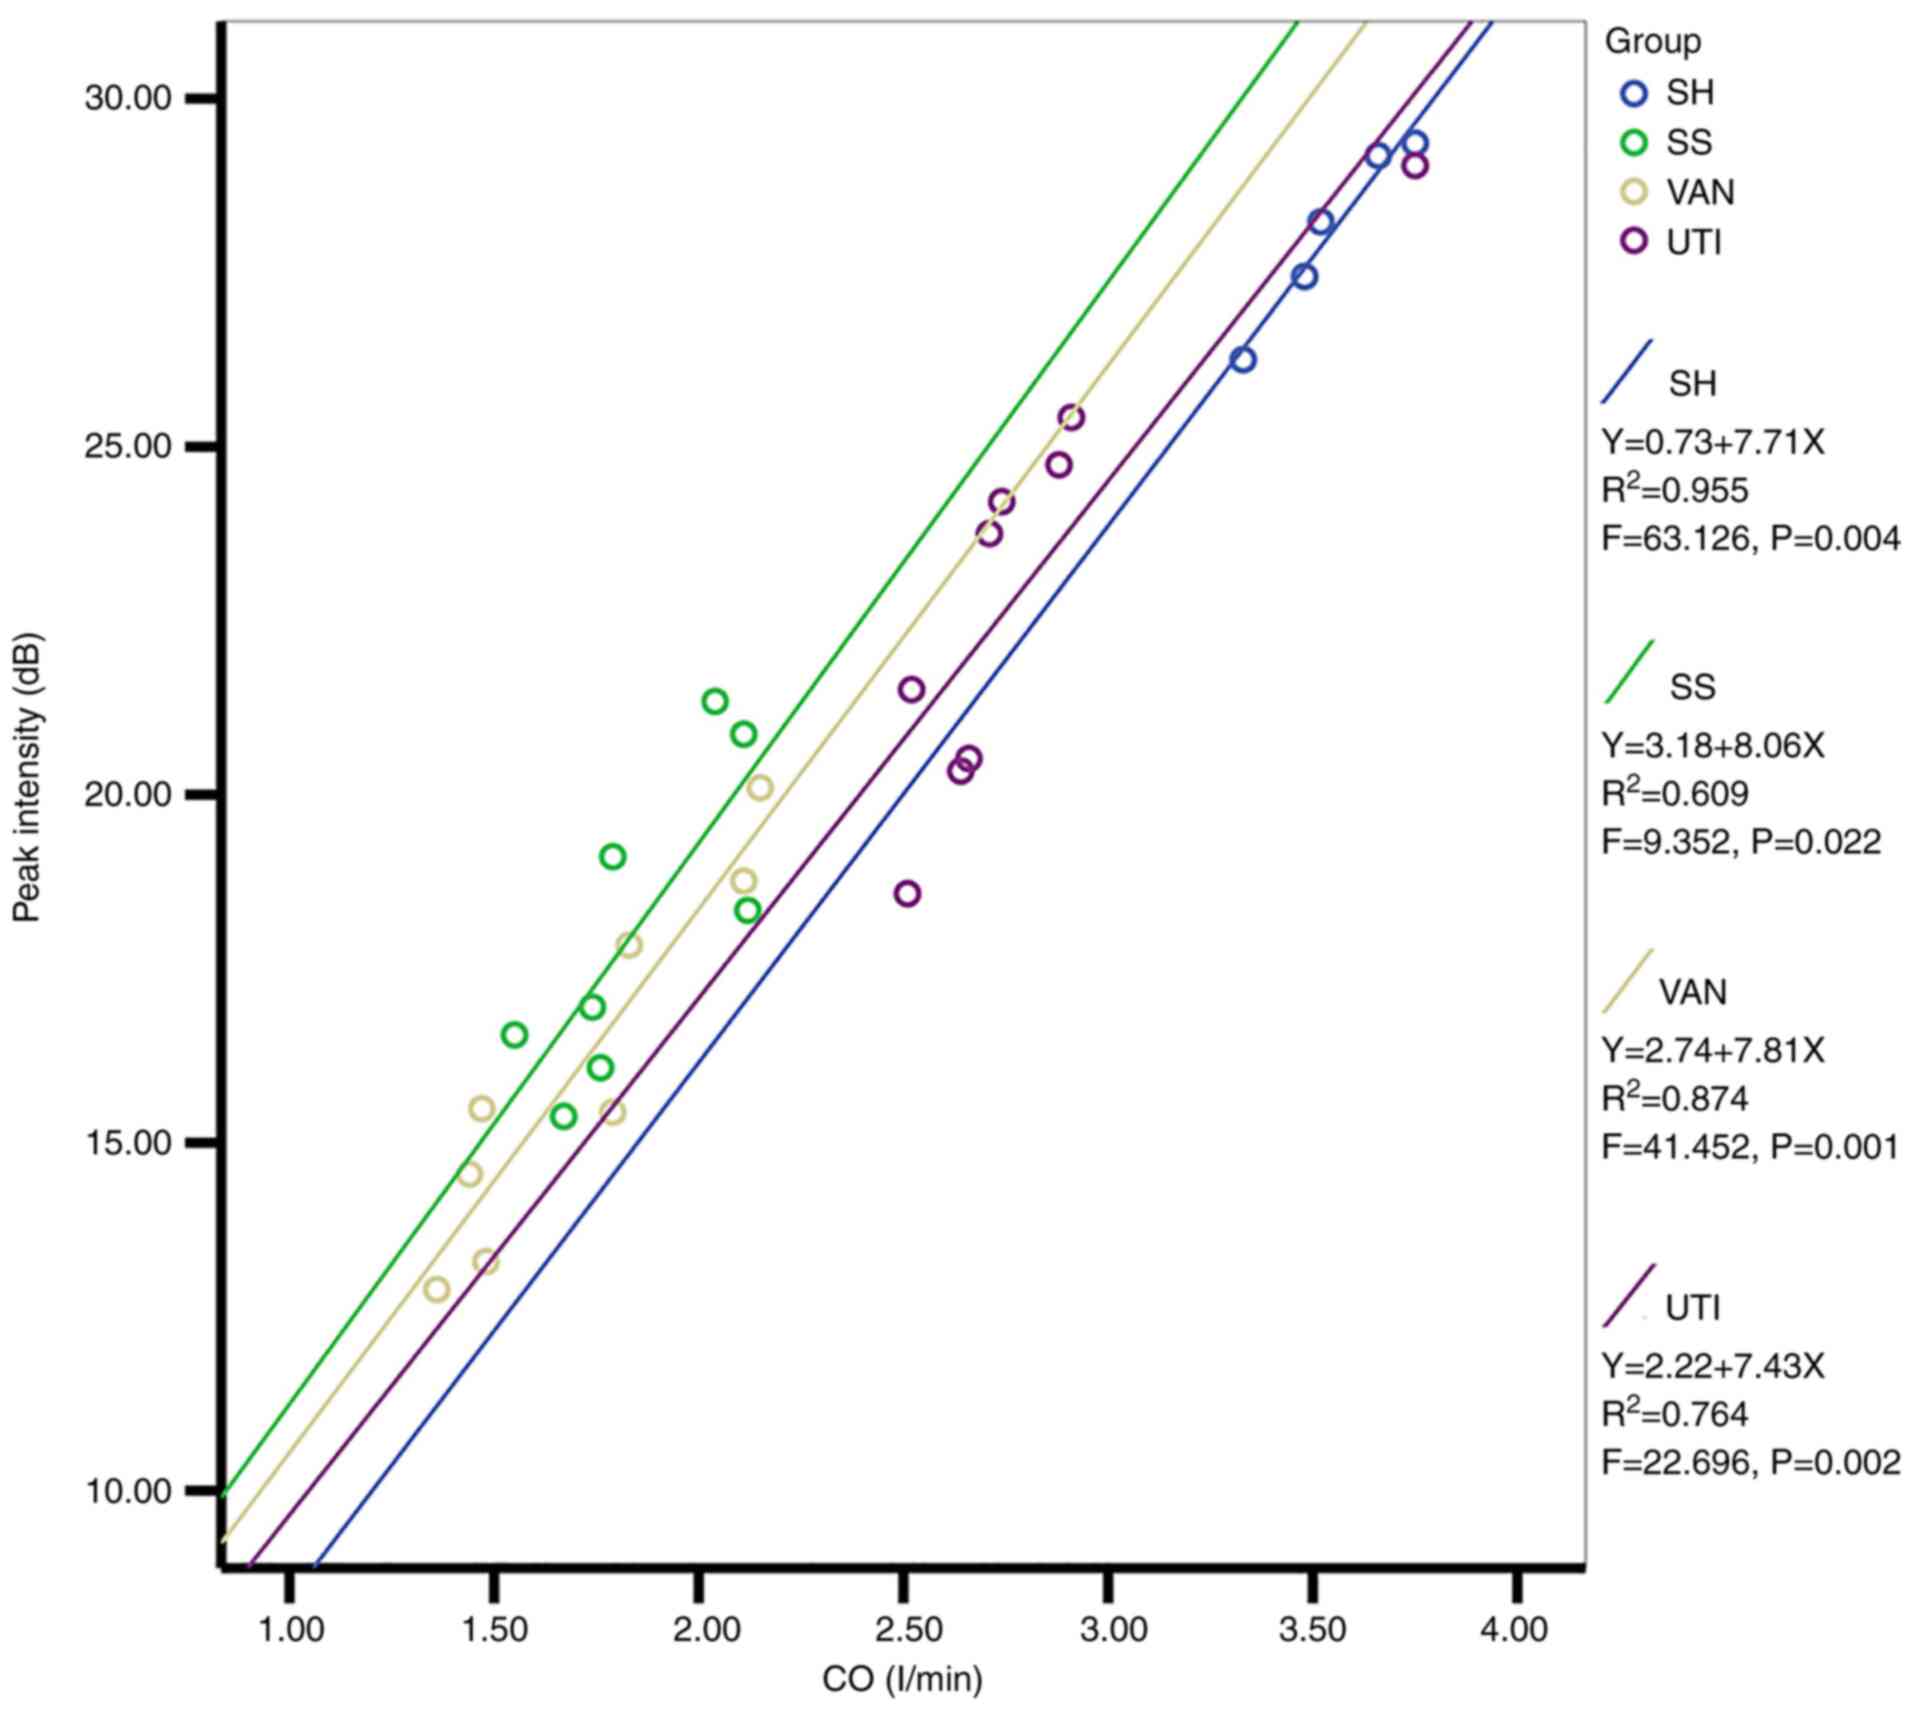
An association was identified by linear regression
analysis between the CO and Pi in all groups (Fig. 7). The regression coefficients of
the four equations were 7.71, 8.06, 7.81 and 7.43, respectively,
and since they were similar, CO could be used as a covariate to
perform the mixed two-way ANOVA again. Interestingly, the
significant differences of Pi among the groups disappeared, which
indicated that the decreased Pi in the SS, VAN and UTI group could
be attributed to the decreased CO.
Renal histopathology
Compared with that in the SH group, renal injury was
prominent in all experimental groups (Fig. 8A-D), especially in the mesenchyme.
Glomerular capillary hyperemia, fibroblast proliferation near the
glomerulus, micro-thrombus formation and diffusive inflammatory
cell infiltration in the mesenchyme were observed. Under the LM,
there was little to no injury in the SH group. The grade of renal
injury was higher in the three experimental groups compared with
that in the SH group, but it was lower in the UTI group compared
with that in the SS and VAN groups (Table II). TUNEL assay revealed that
there was higher AI in the SS and VAN groups than those in the SH
and UTI groups where a significant difference was found between the
UTI and SS or VAN groups (Fig.
8E-H; Table II).
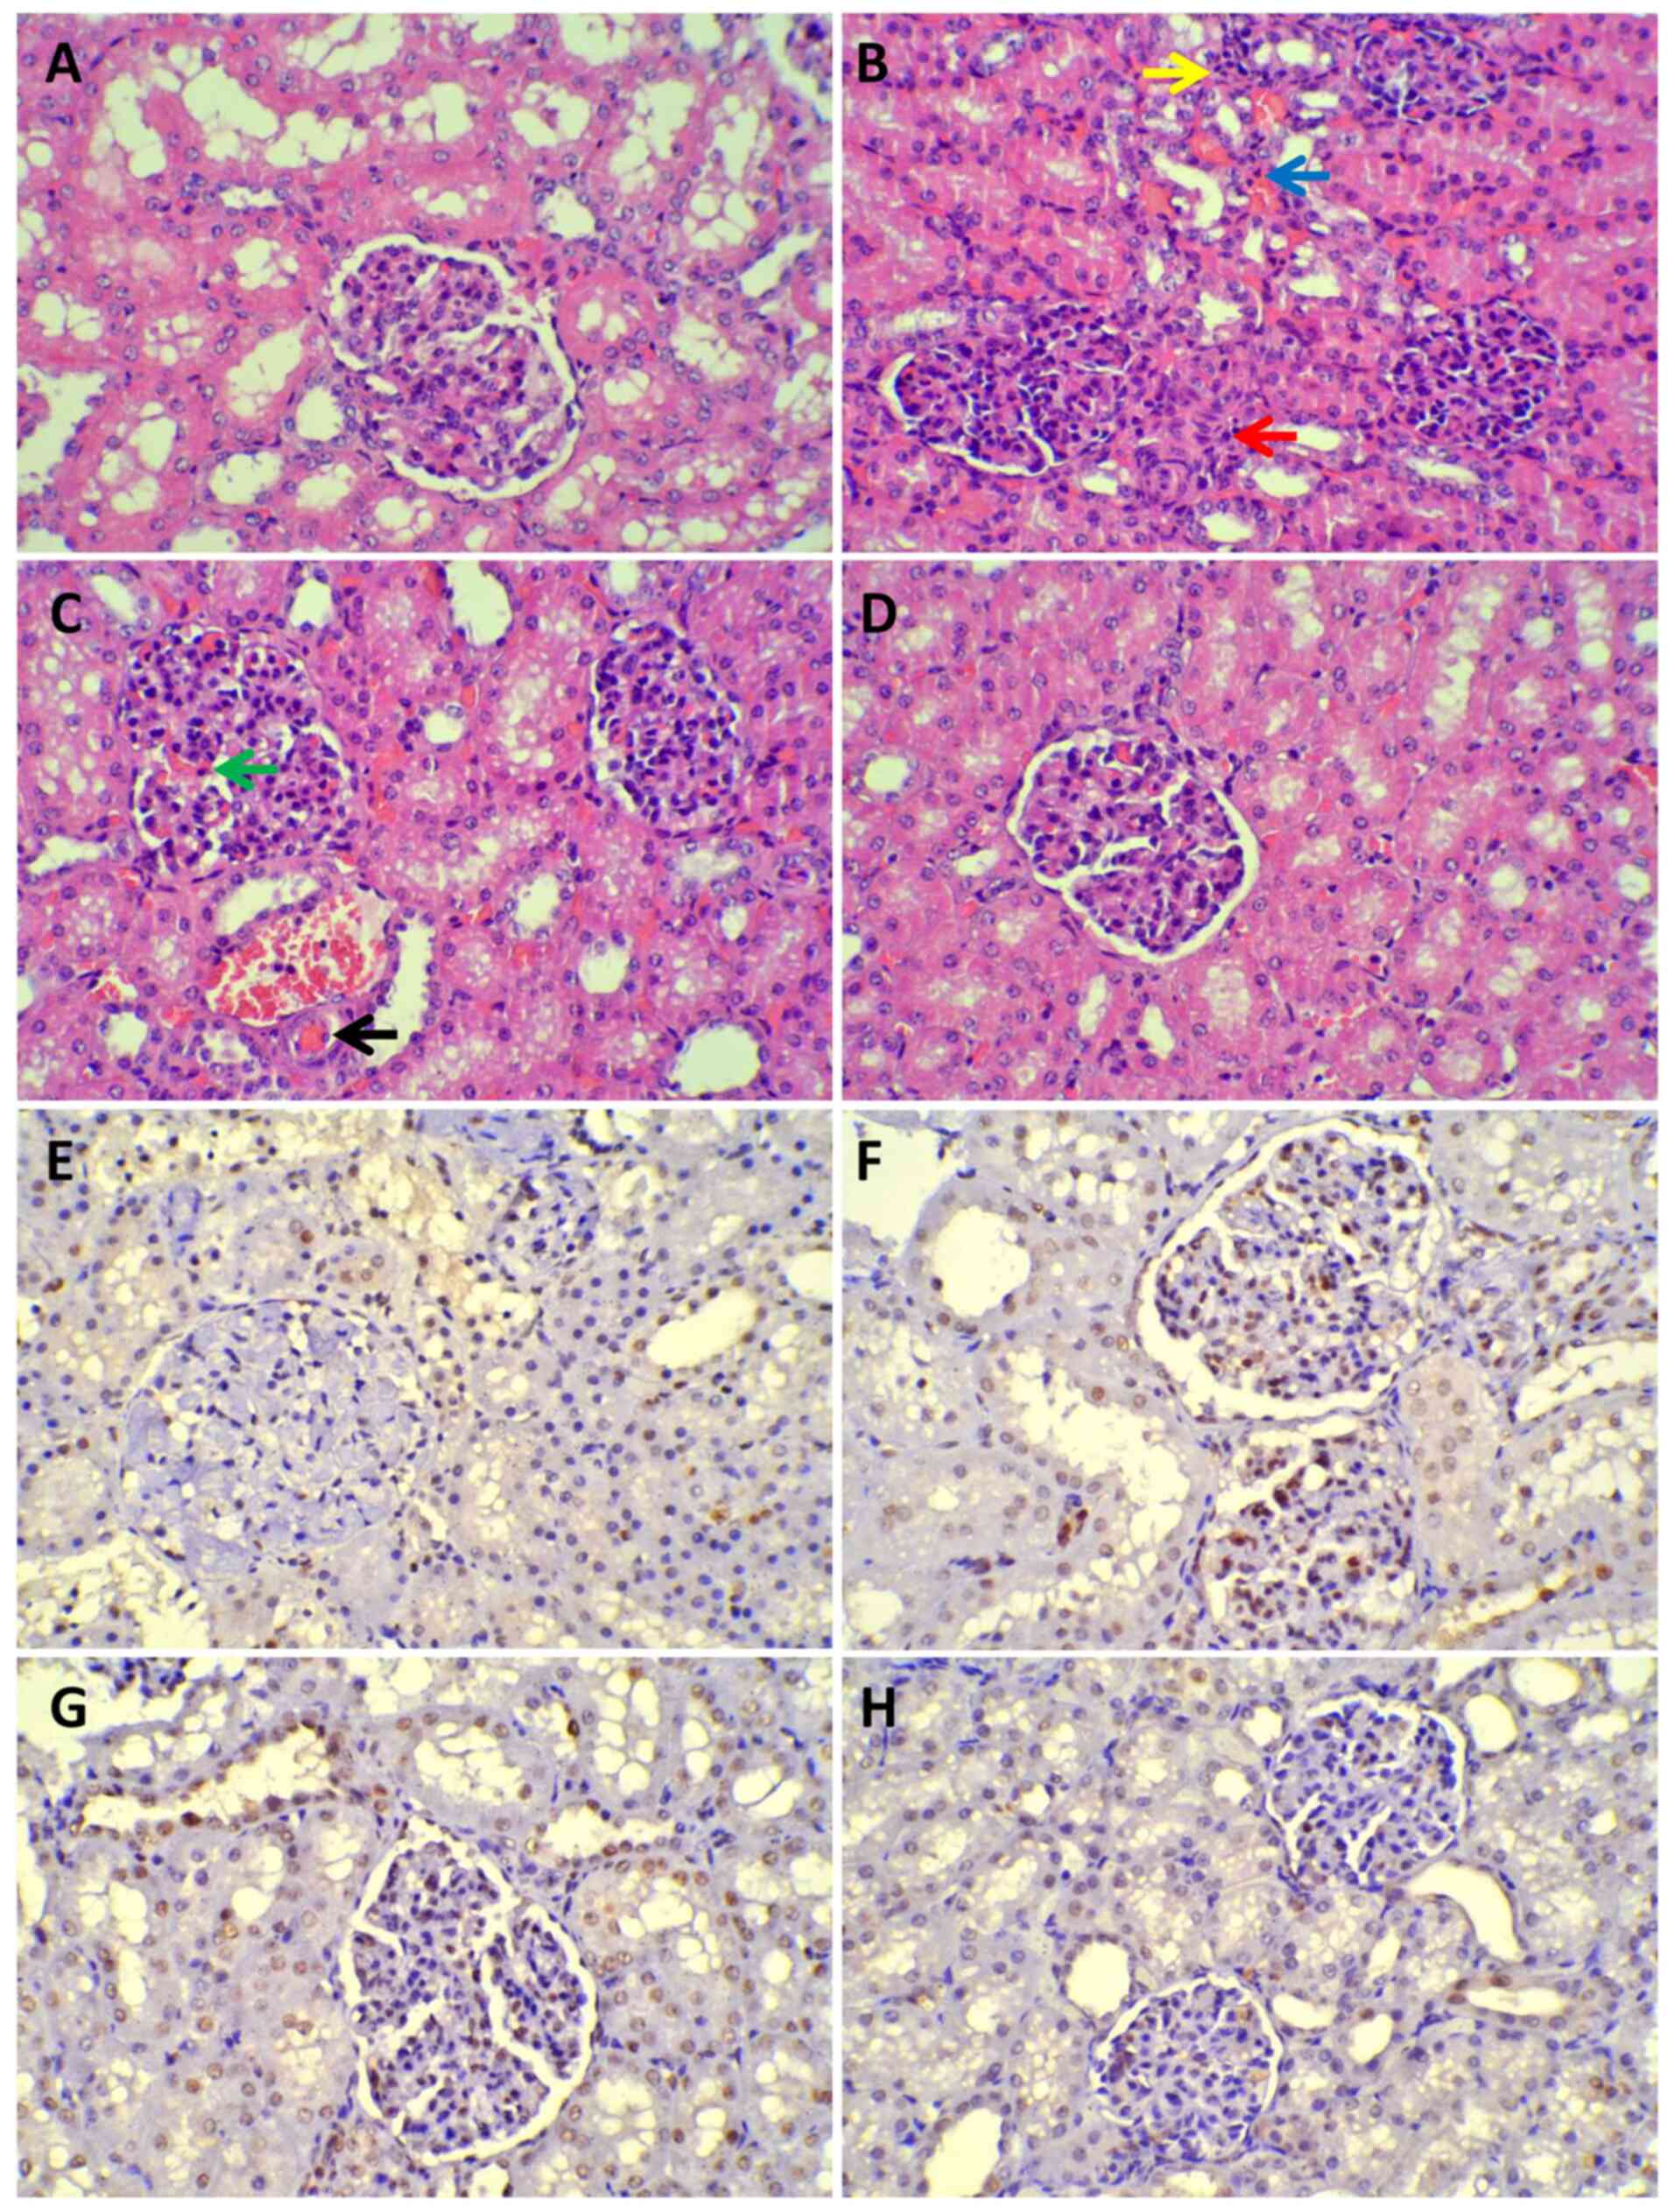 | Figure 8Histopathology of light microscope.
(A-D) Under a light microscope, renal injury was prominent in all
experimental groups except the sham group (magnification, x400).
Red arrow, Fibroblast proliferation in the renal mesenchyme beside
the glomerulus; yellow arrow, inflammatory cell infiltration; blue
arrow, renal interstitial hyperemia; green arrow, glomerular
capillaries angiectasis and hyperemia; black arrow, micro-thrombus
formation. (A) Sham group. (B) SS group. (C) VAN group. (D) UTI
group. (E-H) TUNEL assay revealed that there were greater numbers
of apoptotic cells in the SS and VAN groups than the sham and UTI
groups. Cells undergoing apoptotic signaling cascades were stained
brown. (E) Sham group. (F) SS group. (G) VAN group. (H) UTI group.
SS, septic shock group; VAN, vancomycin group; UTI, ulinastatin
group. |
| Table IIHistopathology outcomes. |
Table II
Histopathology outcomes.
| Parameter | SH | SS | VAN | UTI |
|---|
| Kidney injury
scores | 0.0
(0.5)a,b,c | 3.0 (0.0) | 3.0 (0.0) | 2.0
(1.0)d,e |
| AI, % |
1.50±0.23a,b,c | 32.22±1.71 | 30.11±2.67 |
13.78±2.91a,b |
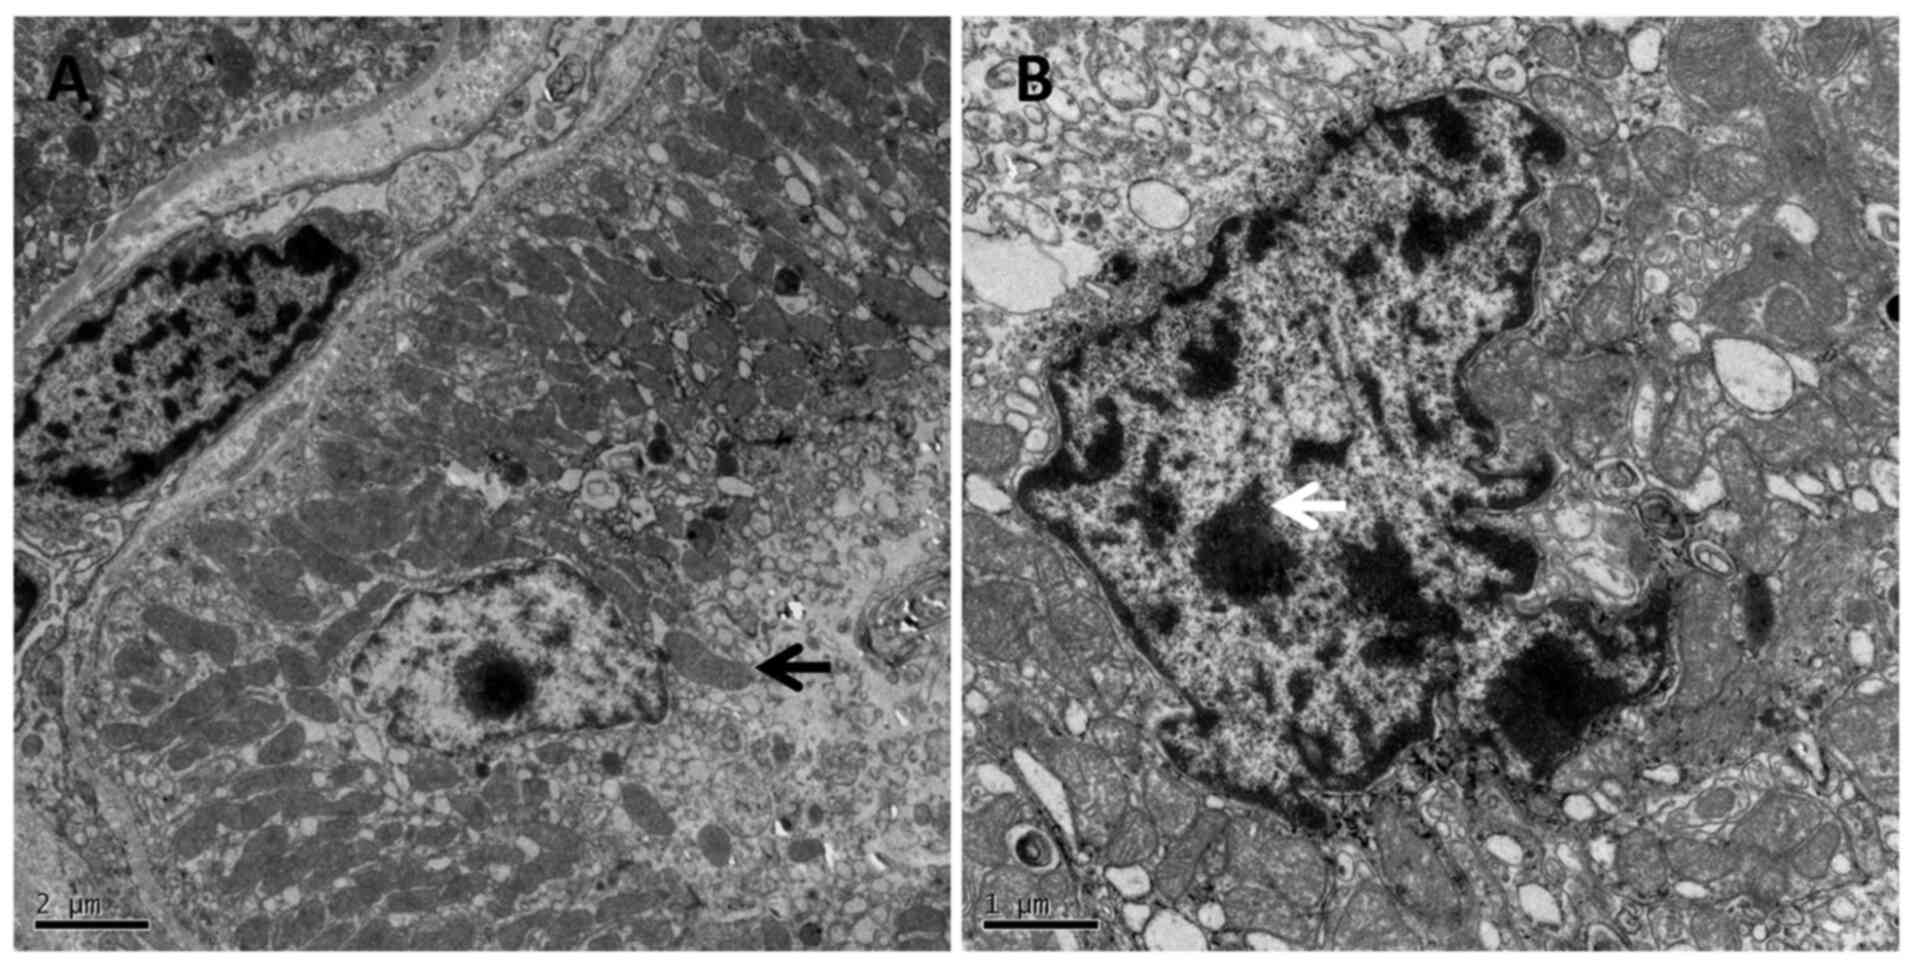
Under TEM in the SS group, the epithelial
degenerating chromatin was presented as nuclear cavitation, which
demonstrated the cell apoptosis, whilst the mitochondria swelled,
and the cristae disappeared (Fig.
9A and B).
Discussion
In total, 5-20% patients who are critically ill
experience an episode of AKI during the course of illness, which in
many cases are accompanied with multiple organ dysfunction
syndromes (20-22).
A recent analysis from the PICARD Study Group observed AKI in
patients who are critically ill, which is characterized by a large
burden of comorbidity and can result in chronic kidney disease and
extensive extra renal complications, necessitating dialysis
(23). In the 21st century, a
total of ~4.9% patients in two years admitted to 30 intensive care
units require renal replacement therapy in Austria (24). At the same time, a prospective
hospital-based study in the UK found that the incidence of renal
replacement therapy for AKI was 131 per million per year (25).
Renal perfusion can recover after sufficient fluid
infusion, but microcirculation in the renal cortex cannot recover
fully (26,27). A fall in systemic blood pressure
caused by hypovolemia activates the neurohumoral vasoconstrictive
system to maintain blood pressure and cerebral perfusion, but not
in the kidney (28). The
autoregulation of kidney and blood pressure makes its perfusion
stable within fairly narrow limits (29,30).
When MAP >80 mmHg, this autoregulation can make the glomerular
filtration rate (GFR) normal with perfusion; however, when the MAP
reaches <80 mmHg, the GFR decreases because of low perfusion
(29,30). In the present study model, MAP and
the opposite changes of CO and SVR followed the hemodynamic
features of septic shock. They changed in opposite directions: CO
rapidly increased, whereas MAP and SVR decreased to the lowest
point at 2 h after injury. From that time point, CO decreased
whilst the SVR increased gradually, whereas the MAP remained at a
relatively low level in the range of 60-70 mmHg. Since this model,
developed in a previous study (12), displayed the typical hemodynamic
features of septic shock, it was considered fit to be applied for
the further investigation of intervention effects. The MAP of all
modeling groups decreased <80 mmHg after injury, which could
certainly make the renal perfusion decrease, and was confirmed by
CEUS.
RI is a useful index for evaluating the renal
vascular resistance in CDFI, which holds promise in monitoring
renal function and in predicting AKI in patients who are critically
ill (31). In the present study,
cRI was calculated to correct for the influence of HR and was
increased in the present model, which indicated vasoconstriction in
the kidney. A significant difference of cRI was not observed
between the UTI group and SS or VAN group after UTI treatment,
which demonstrated that UTI could not change the tension in the
renal vascular system after septic shock. However, this did not
necessarily mean that UTI had no involvement in regulating the
renal microcirculation.
Dynamic contrast enhanced magnetic resonance imaging
and isotopic renography are methods used to evaluate renal
perfusion (32). However, the
absolute quantification of renal perfusion using contrast enhanced
magnetic resonance imaging is not reliable because of the poor
association between signal intensity and concentration of the
contrast medium (32). Isotopic
renography can be used evaluate split renal function, but is
limited by radiation exposure and high cost (33). CEUS had been previously proposed to
be able to quantify renal cortical perfusion at bedside in the
transplanted kidney. Microbubbles used in CEUS remain strictly
intravascular, with little interstitial diffusion or urine
excretion. They tend to produce more harmonic signals compared with
surrounding tissues and are sensitive to the echo sound probe
(34,35). Due to the increased sensitivity of
harmonic imaging, tissue perfusion on a capillary level can be
detected using these media, that can be viewed as blood pool
markers enabling functional vascular imaging (36). A good correlation has been
demonstrated between CEUS measurements of renal perfusion and
para-aminohippurate clearance, which is currently the gold standard
for renal blood flow measurements (35). Previous data on animals also
revealed that renal cortical CEUS can differentiate between macro-
and microcirculation (37,38). This technology has also been used
in ICU for evaluating renal perfusion in two pilot studies
(39,40).
In the present study, TIC derived from CEUS was used
to detect blood perfusion after septic shock, where the results
indicated that the AUC was decreased significantly. AUC is a
parameter related with the blood volume of the kidney (34). In the UTI group, it was
significantly increased by the drug treatment compared with the SS
and VAN group. No significant difference was observed between the
SH and UTI group.
Pi is another parameter that is related to renal
perfusion. In theory, if the same dose of microbubbles were bolus
infused into the circulation and detected by the prober in the
kidney, there should be the same Pi in each group (34). However, if CO decreased, only the
time of reaching Pi would be delayed because of the low perfusion,
but without the reduction in strength i.e. there would be an
increased Tp with normal Pi (34).
By contrast, if the CO was too low, before the whole dose of
microbubbles filled the kidney, the washing out process would begin
prematurely and the flow may decrease the Pi (34). In the present study, the Tp was
significantly increased whereas the Pi was significantly decreased
in the SS and VAN groups. Regression analysis between the CO and Pi
indicated that there were similar regression coefficients in the
four groups. Since CO was lower in the SS and VAN groups, it may
decrease Pi. Therefore, when CO was put into the ANOVA model as a
covariate, the difference among the groups disappeared, which
suggests that a lower CO cannot drive enough microbubbles into the
renal cortex, thereby decreasing Pi. In the UTI group, both the Pi
and Tp were significantly improved compared with that in the SS and
VAN group.
The Th and slope are parameters related to the
wash-in speed of microbubbles (34). During septic shock, both are
deteriorated with poor perfusion. In the present study, the Th
increased whereas the slope decreased, both of which were improved
by UTI treatment. Unlike cRI, which is a parameter related to
vascular tension, AUC, Pi, Th and Slope, parameters of perfusion,
were improved by UTI treatment, which demonstrated that the
protective effect of UTI was not through a change in vascular
resistance, but by the improvement of bloodflow. Oxygenation
(PaO2/FiO2) was also improved by UTI
treatment together with the improved renal perfusion. In addition,
the global aerobic metabolism was improved by UTI, as suggested by
the observation of decreasing Lac levels.
Histopathological analysis confirmed the extent of
kidney injury caused by septic shock and the subsequent improvement
mediated by UTI treatment. Previous investigations indicated that
35-50% cases of acute tubular necrosis could be attributed to
sepsis (41,42). In the present model, tubular
necrosis was not observed, which was likely to be due to the
relatively short duration of the protocol. However, significant
injury in the interstitium was found in the SS and VAN groups under
LM. These injuries may progress to tubular necrosis after several
weeks of sepsis (41,42). Under EM, the cell injury observed
were mitochondria swelling and chromatin degeneration, possibly
contributing to apoptosis. Mitochondrial dysfunction has been
previously described in organs with high metabolism, such as the
kidney (43). TUNEL analysis also
confirmed apoptosis in the renal cells. This histopathologic injury
was ameliorated by UTI treatment, which may be due to improvements
in renal perfusion and global aerobic metabolism.
In the present study, a phenomenon of improved renal
perfusion by UTI was observed. Its macro-mechanism was confirmed by
hemodynamic studies, though an animal model may not be the same as
that in the clinical setting in humans. As a limitation of the
present study, the micro-mechanism was not explored. Blood flow to
the kidney is pronounced as the kidneys receive ~25% of the total
abdominal aortic blood flow and filter 120-150 ml plasma per min,
rendering it susceptible to the first attack by cytokines during
inflammation. As a typical Kuniz protease inhibitor, UTI was
previously demonstrated to regulate the expression of IL-6, IL-1β
and TNF-α through the NF-κB pathway (44). Further studies should be performed
surrounding the changes in level of cytokines regulated by the
NF-κB protein pathway.
In conclusion, AKI, which occasionally occurs during
septic shock, is accompanied with a significantly reduced perfusion
in the renal microcirculation. However, UTI can significantly
improve renal perfusion, which can be reliably evaluated using
CEUS.
Supplementary Material
Video of contrast-enhanced ultrasound
from the sham group.
Video of contrast-enhanced ultrasound
from the septic shock group.
Video of contrast-enhanced ultrasound
from the vancomycin group.
Video of contrast-enhanced ultrasound
from the ulinastatin group.
Supplementary Data
Supplementary Data
Supplementary Data
Supplementary Data
Acknowledgements
Not applicable.
Funding
Funding: The present study was funded by The Planning Project of
Beijing Municipal Administration of Traditional Chinese Medicine
(grant no. JJ2018-52).
Availability of data and materials
The datasets used and/or analyzed during the current
study are available from the corresponding author on reasonable
request.
Authors' contributions
CCH performed the experiments and drafted the
manuscript. YHG acquired and analyzed data. CSL participated in the
conception of the study and approved the final manuscript. SW
designed the study and interpreted the results. YHG and SW confirm
the authenticity of all the raw data. All authors have read and
approved the final manuscript.
Ethics approval and consent to
participate
The present study was approved by the Animal Care
and Use Committee of Beijing Chao-Yang Hospital, Capital Medical
University (Beijing, China), and the use of all animals that
received treatment was in compliance with the National Research
Council's 1996 Guide for the Care and Use of Laboratory
Animals.
Patient consent for publication
Not applicable.
Competing interests
The authors declare that they have no competing
interests.
References
|
1
|
Schrier RW and Wang W: Acute renal failure
and sepsis. N Engl J Med. 351:159–169. 2004.PubMed/NCBI View Article : Google Scholar
|
|
2
|
Boffa JJ and Trendshorst WJ: Maintenance
of renal vascular reactivity contributes to acute renal failure
during endotoxemic shock. J Am Soc Nephrol. 16:117–124.
2005.PubMed/NCBI View Article : Google Scholar
|
|
3
|
Schnell D and Darmon M: Renal Doppler to
assess renal perfusion in the critically ill: A reappraisal.
Intensive Care Med. 38:1751–1760. 2012.PubMed/NCBI View Article : Google Scholar
|
|
4
|
Schnell D, Camous L, Guyomarc'h S,
Duranteau J, Canet E, Gery P, Dumenil AS, Zeni F, Azoulay E and
Darmon M: Renal perfusion assessment by renal Doppler during fluid
challenge in sepsis. Crit Care Med. 41:1214–1220. 2013.PubMed/NCBI View Article : Google Scholar
|
|
5
|
Puqia MJ, Valdes R Jr and Jortani SA:
Bikunin (urinary trypsin inhibitor): Structure, biological
relevance, and measurement. Adv Clin Chem. 44:223–245.
2007.PubMed/NCBI View Article : Google Scholar
|
|
6
|
Inoue KI, Takano H, Yanagisawa R, Sakurai
M, Shimada A, Yoshino S, Sato H and Yoshikawa T: Protective role of
urinary trypsin inhibitor in acute lung injury induced by
lipopolysaccharide. Exp Biol Med (Maywood). 230:281–287.
2005.PubMed/NCBI View Article : Google Scholar
|
|
7
|
Yang Q, Liu X, Liu M, Zhang L and Guan Y:
Ulinastatin-mediated protection against zymosan-induced multiple
organ dysfunction in rats. Biologicals. 38:552–556. 2010.PubMed/NCBI View Article : Google Scholar
|
|
8
|
Ogawa M, Nishibe S, Mori T and Neumann S:
Effect of human urinary trypsin inhibitor on granulocyte elastase
activity. Res Commun Chem Pathol Pharmacol. 55:271–274.
1987.PubMed/NCBI
|
|
9
|
National Research Council (US) Institute
for Laboratory Animal Research: Guide for the care and use of
laboratory animals. Washington (DC): National Academies Press (US),
1996.
|
|
10
|
Committee for the Update of the Guide for
the Care and Use of Laboratory Animals. Guide for the care and use
of laboratory animals. Washington, DC: National Research Council,
National Academy Press, 2011.
|
|
11
|
Riebold TW, Geiser DR and Goble DO:
General principles. In General Principles in Large Animal
Anesthesia, Principles and Techniques, ed 2. Ames, lA, Iowa State
University Press, 1995.
|
|
12
|
Wang S, Wang JY, Wang T, Hang CC, Shao R
and Li CS: A novel porcine model of septic shock induced by acute
respiratory distress syndrome due to methicillin-resistant
staphylococcus aureus. Chin Med J (Engl). 130:1226–1235.
2017.PubMed/NCBI View Article : Google Scholar
|
|
13
|
Murakami K, Bjertnaes LJ, Schmalstieg FC,
McGuire R, Cox RA, Hawkins HK, Herndon DN, Traber LD and Traber DL:
A novel animal model of sepsis after acute lung injury in sheep.
Crit Care Med. 30:2083–2090. 2002.PubMed/NCBI View Article : Google Scholar
|
|
14
|
Enkhbaatar P, Joncam C, Traber L, Nakano
Y, Wang J, Lange M, Connelly R, Kulp G, Saunders F, Huda R, et al:
Novel ovine model of methicillin-resistant Staphylococcus
aureus-induced pneumonia and sepsis. Shock. 29:642–649.
2008.PubMed/NCBI View Article : Google Scholar
|
|
15
|
Jonkam CC, Bansal K, Traber DL, Hamahata
A, Maybauer MO, Maybauer DM, Cox RA, Lange M, Connelly RL, Traber
LD, et al: Pulmonary vascular permeability changes in an ovine
model of methicillin-resistant Staphylococcus aureus sepsis. Crit
Care. 13(R19)2009.PubMed/NCBI View
Article : Google Scholar
|
|
16
|
Leary S, Underwood W, Anthony R, Cartner
S, Corey D, Grandin T, Greenacre CB, Gwaltney-Bran S, McCrackin MA,
Meyer R, et al: AVMA guidelines for the euthanasia of animals: 2013
edition. American Veterinary Medical Association, Schaumberg, IL,
2013.
|
|
17
|
Von Spiegel T, Wietasch G, Bürsch J and
Hoeft A: Cardiac output determination with transpulmonary
thermodilution: An alternative to pulmonary artery catheterization?
Anaesthetist. 45:1045–1050. 1996.PubMed/NCBI View Article : Google Scholar : (In German).
|
|
18
|
Hershey BJ, Hagart JL and Havas KA:
Clinical indicators of moribundity in swine experimentally
inoculated with African swine fever virus. J Am Assoc Lab Anim Sci.
60:96–102. 2021.PubMed/NCBI View Article : Google Scholar
|
|
19
|
Komatsu K, Frohlich ED, Ono H, Ono Y,
Numabe A and Willis GW: Glomerular dynamics and morphology of aged
spontaneously hypertensive rats. Effects of angiotensin-converting
enzyme inhibition. Hypertension. 25:207–213. 1995.PubMed/NCBI View Article : Google Scholar
|
|
20
|
Brivet FG, Kleinknecht DJ, Loirat P and
Landais PJ: Acute renal failure in intensive care units: Causes,
outcome, and prognostic factors of hospital mortality: A
prospective, multicenter study. Crit Care Med. 24:192–198.
1996.PubMed/NCBI View Article : Google Scholar
|
|
21
|
de Mendonca A, Vincent JL, Suter PM,
Moreno R, Dearden NM, Antonelli M, Takala J, Sprung C and Cantraine
F: Acute renal failure in the ICU: Risk factors and outcome
evaluated by the SOFA score. Intensive Care Med. 26:915–921.
2000.PubMed/NCBI View Article : Google Scholar
|
|
22
|
Liano F, Junco E, Pascual J, Madero R and
Verde E: The spectrum of acute renal failure in the intensive care
unit compared with that seen in other settings. Kidney Int Suppl.
66:S16–S24. 1998.PubMed/NCBI
|
|
23
|
Mehta RL, Pascual MT, Soroko S, Savage BR,
Himmelfarb J, Ikizler TA, Paganini EP and Chertow GM: Program to
Improve Care in Acute Renal Disease. Spectrum of acute renal
failure in the intensive care unit: The PICARD experience. Kidney
Int. 66:1613–1621. 2004.PubMed/NCBI View Article : Google Scholar
|
|
24
|
Metnitz PG, Krenn CG, Steltzer H, Lang T,
Ploder J, Lenz K, Le Gall JR and Druml W: Effect of acute renal
failure requiring renal replacement therapy on outcome in
critically ill patients. Crit Care Med. 30:2051–2058.
2002.PubMed/NCBI View Article : Google Scholar
|
|
25
|
Metcalfe W, Simpson M, Khan IH, Prescott
GJ, Simpson K, Smith WC and MacLeod AM: Scottish Renal Registry.
Acute renal failure requiring renal replacement therapy: Incidence
and outcome. QJM. 95:579–583. 2002.PubMed/NCBI View Article : Google Scholar
|
|
26
|
Legrand M, Bezemer R, Kandil A, Demirci C,
Payen D and Ince C: The role of renal hypoperfusion in development
of renal microcirculatory dysfunction in endotoxemic rats.
Intensive Care Med. 37:1534–1542. 2011.PubMed/NCBI View Article : Google Scholar
|
|
27
|
Evans RG, Ince C, Joles JA, Smith DW, May
CN, O'Connor PM and Gardiner BS: Haemodynamic influences on kidney
oxygenation: Clinical implications of integrative physiology. Clin
Exp Pharmacol Physiol. 40:106–122. 2013.PubMed/NCBI View Article : Google Scholar
|
|
28
|
Badr KF and Ichikawa I: Prerenal failure:
A deleterious shift from renal compensation to decompensation. N
Engl J Med. 319:623–629. 1988.PubMed/NCBI View Article : Google Scholar
|
|
29
|
Legrand M and Payen D: Understanding urine
output in critically ill patients. Ann Intensiva Care.
1(13)2011.PubMed/NCBI View Article : Google Scholar
|
|
30
|
A Mitrou NG and Gupples WA: Renal blood
flow dynamics in inbred rat strains provides insight into
autoregulation. Curr Vasc Pharmacl. 12:801–809. 2014.PubMed/NCBI View Article : Google Scholar
|
|
31
|
Lerolle N, Guérot E, Faisy C, Bornstain C,
Diehl JL and Fagon JY: Renal failure in septic shock: Predictive
value of doppler-based renal arterial resistive index. Intensive
Care Med. 32:1553–1559. 2006.PubMed/NCBI View Article : Google Scholar
|
|
32
|
Bokacheva L, Rusinek H, Zhang JL and Lee
VS: Assessment of renal function with dynamic contrast-enhanced MR
imaging. Magn Reson Imaging Clin N Am. 16:597–611. 2008.PubMed/NCBI View Article : Google Scholar
|
|
33
|
El-Diasty MT, Gaballa G, Gad HM, Borg MA,
Abou-Elghar ME, Sheir KZ and El-Diasty TA: Evaluation of CT
perfusion parameters for assessment of split renal function in
healthy donors. Egypt J Radiol Nucl Med. 47:1681–1688. 2016.
|
|
34
|
Hosotani Y, Takahashi N, Kiyomoto H,
Ohmori K, Hitomi H, Fujioka H, Aki Y, Fukunaga M, Yuasa S,
Mizushige K and Kohno M: A new method for evaluation of split renal
cortical blood flow with contrast echography. Hypertens Res.
25:77–83. 2002.PubMed/NCBI View Article : Google Scholar
|
|
35
|
Schneider AG, Hofmann L, Wuerzner G, Glatz
N, Maillard M, Meuwly JY, Eggimann P, Burnier M and Vogt B: Renal
perfusion evaluation with contrast-enhanced ultrasonography.
Nephrol Dial Transplant. 27:674–681. 2012.PubMed/NCBI View Article : Google Scholar
|
|
36
|
Blomley MJ, Albrecht T, Cosgrove DO,
Jayaram V, Eckersley RJ, Patel N, Taylor-Robinson S, Bauer A and
Schlief R: Liver vascular transit time analyzed with dynamic
hepatic venography with bolus injections of an US contrast agent:
Early experience in seven patients with metastases. Radiology.
209:862–866. 1998.PubMed/NCBI View Article : Google Scholar
|
|
37
|
Schlosser T, Pohl C, Veltmann C, Lohmaier
S, Goenechea J, Ehlgen A, Köster J, Bimmel D, Kuntz-Hehner S,
Becher H and Tiemann K: Feasibility of the flash-replenishment
concept in renal tissue: Which parameters affect the assessment of
the contrast replenishment? Ultrasound Med Biol. 27:937–944.
2001.PubMed/NCBI View Article : Google Scholar
|
|
38
|
Wei K, Le E, Bin JP, Coggins M, Thorpe J
and Kaul S: Quantification of renal blood flow with
contrast-enhanced ultrasound. J Am Coll Cardiol. 37:1135–1140.
2001.PubMed/NCBI View Article : Google Scholar
|
|
39
|
Schneider AG, Goodwin MD, Schelleman A,
Bailey M, Johnson L and Bellomo R: Contrast-enhanced ultrasound to
evaluate changes in renal cortical perfusion around cardiac
surgery: A pilot study. Crit Care. 17(R138)2013.PubMed/NCBI View Article : Google Scholar
|
|
40
|
Schneider AG, Goodwin MD, Schelleman A,
Bailey M, Johnson L and Bellomo R: Contrast-enhanced
ultrasonography to evaluate changes in renal cortical
microcirculation induced by noradrenaline: A pilot study. Crit
Care. 18(653)2014.PubMed/NCBI View Article : Google Scholar
|
|
41
|
Cole L, Bellomo R, Silvester W and Reeves
JH: A prospective, multicenter study of the epidemiology,
management, and outcome of severe acute renal failure in ‘closed’
ICU system. Am J Respir Crit Care Med. 162:191–196. 2000.PubMed/NCBI View Article : Google Scholar
|
|
42
|
Hoste EA, Lameire NH, Vanholder RC, Benoit
DD, Decruyenaere JM and Colardyn FA: Acute renal failure in
patients with sepsis in a surgical ICU: Predictive factors,
incidence, comorbidity, and outcome. J Am Soc Nephrol.
14:1022–1030. 2003.PubMed/NCBI View Article : Google Scholar
|
|
43
|
Nourbakhsh N and Singh P: Role of renal
oxygenation and mitochondrial function in the pathophysiology of
acute kidney injury. Nephron Clin Pract. 127:149–152.
2014.PubMed/NCBI View Article : Google Scholar
|
|
44
|
Li W, Qiu X, Jiang H, Zhi Y, Fu J and Liu
J: Ulinastatin inhibits the inflammation of LPS-induced acute lung
injury in mice via regulation of AMPK/ NF-κB pathway. Int
Immunopharmacol. 29:560–567. 2015.PubMed/NCBI View Article : Google Scholar
|