Introduction
Osteoarthritis (OA) continues to increase in
prevalence, due to population aging, prolonged life expectancy and
obesity. Patients with OA suffer from low quality of life
associated with chronic pain and reduced joint function (1). Globally, musculoskeletal disorders
represent a high proportion of conditions associated with years
lived with disability, and a sharp increase in the incidence of
musculoskeletal disorders was observed between 1990 and
2015(2). OA is a representative
musculoskeletal disorder in which joint function becomes
irreversibly damaged due to aging, cartilage wear, trauma and
sustained joint inflammation (3).
Knee-joint OA can easily be diagnosed by X-ray radiography and is
characterized by the narrowing of the joint space, development of
osteophytes, sclerosis of the subchondral bone and cyst formation
(4). According to the
Kellgren-Lawrence (KL) scale, four grades of OA can be
distinguished by X-ray observation (5). Throughout the various stages of
osteoarthritis, exercise, medication and injection therapy have
been shown to be very effective for mitigating symptoms and have
been used successfully (6).
The rising prevalence of OA has resulted in a recent
increase in the incidence of osteoporosis (7). Osteoporosis is one of the most common
public health problems in modern society. Osteoporosis is
characterized as a chronic skeletal disorder that features the
whole-body loss of bone mineral density and micro-architectural
bone tissue deterioration (8,9).
Patients who suffer from osteoporosis and osteoporotic fractures
are vulnerable to high rates of postoperative morbidity and
mortality (10,11).
Patients who suffer from OA in an aging society are
eager to improve their quality of life. Thus, medical demand for OA
treatments is expected to grow rapidly. Prolonged life expectancy
requires appropriate treatments to ensure optimal conditions and
retained knee joint function (12,13).
An accurate understanding of the disease state is necessary to
obtain the best results when applying the various reported
treatments. The concepts of precision medicine and patient-specific
care are in line with expected medical trends. These approaches
achieve the best results for patient-specific care, by matching the
expression of specific proteins in OA cartilage and medical imaging
data at various stages of KL. Previous studies have been conducted
to determine the physiological and chemical properties of OA
tissues, and numerous factors have been identified as associated
with the status and severity of OA (14,15).
Most of the previous proteomic analyses have been
performed as comparative analyses of patient groups treated with
different pharmacological or surgical methods. In the present
study, the different stages of OA were divided according to the
International Cartilage Repair Society (ICRS) grades (16) and the proteins expressed at each
stage were compared. ICRS grade 1 is characterized by superficial
cartilage lesions, whereas grade 2 describes lesions extending to
<50% of cartilage depth. Cartilage defects extending to >50%
of cartilage depth but not through the subchondral bone are
categorized as ICRS grade 3, and cartilage that is severely damaged
to the subchondral bone layer is scored as ICRS grade 4. Grade 1 is
nearly normal, whereas grades 3 and 4 are severely abnormal, and
grade 4 can lead to the development of sclerosis or bony defects in
the subchondral bone layer. The present study aimed to determine
the proteomic differences in the OA knee between different ICRS
grades. The changes in various proteins according to the ICRS grade
were analyzed, which may highlight a novel way to develop
patient-specific care or treatment for patients with OA.
Materials and methods
Patients and ICRS collection
The present study received Research Ethics Board
approval from the International St. Mary's Hospital, Kwandong
University College of Medicine (CKU-020-6). Informed consent was
obtained from all patients. According to a report by the Health
Insurance Review and Assessment Service of South Korea in 2019, the
total number of knee arthroplasty surgeries among the ages of 70
and 79 was 58,788. Among them, the ratio males to females was
50,277:8,561. There are more however surgeries for OA in women than
men with a ratio of ~5.9:1 (Health Insurance Review and Assessment
Service. 2020, https://opendata.hira.or.kr/home.do). As a control
group, ICRS grade 1 was selected. In the late stages of
degenerative arthritis, cartilage loss progresses, and in grade 4
patients undergoing TKA, sclerosis progresses and the unique
characteristics of cartilage are lost. Therefore, grade 3, in which
the unique characteristics of subchondral bone are maintained to
some extent, was designated as the representative of the severe
group. In the case of severe ICRS3, distal condyle bone stalk
obtained during distal cutting of the femur was analyzed during
TKA. The size of the specimen is about 2x3 cm, and when diagnosing
the ICRS grade of the cartilage surface, the most characteristic
part was used in the present study. The samples for the present
study were obtained retrospectively from six patients with ICRS
grade 1 and 6 patients with ICRS grade 3. Patients were classified
according to the ICRS grade and had not received any treatment
prior to tissue collection (Table
I). Patients with rheumatoid arthritis (RA) and autoimmune
diseases were excluded from the study.
 | Table IClinicopathological characteristics
of patients with osteoarthritis included in the present study. |
Table I
Clinicopathological characteristics
of patients with osteoarthritis included in the present study.
| | ICRS grade | |
|---|
|
Characteristics | I | III | P-value |
|---|
| Age, years | 71.8±5.0 | 74.8±3 | 0.255 |
| Sex, W:M | 6:0 | 5:1 | 0.363 |
| BMI,
kg/m2 | 27.3±3.7 | 25.5±4.0 | 0.432 |
| K-L grade | 3.7±0.5 | 3.2±0.4 | 0.094 |
Sample preparation
ICRS1 and ICRS3 patient samples were obtained
through distal compartment pieces of medial and lateral femoral
condyles of the femur during total knee arthroplasty and kept on
ice. Samples were homogenized in TissueLyser Bead Homogenizer
(Qiagen GmbH) and transferred into a sterile 1.5 ml centrifuge tube
and centrifuged at 15,800 x g for 5 min at 4˚C and supernatant was
collected. Samples were immediately stored at -80˚C until further
processing. In the present study, samples were blinded, thawed on
ice and their total protein concentration was evaluated using a
Pierce Coomassie total protein assay (Thermo Fisher Scientific,
Inc.).
Sample preparation for proteomic
analysis
For proteomic investigations, ICRS samples were
first adjusted to 50 µg total protein in 50 mM ammonium bicarbonate
(ABC). Protein concentration was determined using
Amicon® Ultra-0.5 centrifugal filter devices (10 kDa
molecular weight cut-off; Merck KGaA) which were pre-equilibrated
with 400 µl of 50 mM ABC. Samples were loaded, centrifuged at
15,800 x g for 35 min at 4˚C and supernatant transferred into a new
tube. Concentrates were collected and adjusted to a total volume of
100 µl using 50 mM ABC. Proteins were denatured using powdered urea
to a final concentration of 8 M. Dithiothreitol was added to each
sample to the final concentration of 10 mM and samples were
incubated at 37˚C for 1 h. Subsequently, alkylation with 50 mM
iodoacetamide was performed at room temperature in the dark for 45
min. Samples were diluted fivefold with 50 mM ABC to prevent
inhibition of trypsin activity by high concentrations of urea.
Samples were digested with trypsin in a 1:40 ratio (trypsin to
total protein) overnight at 37˚C, followed by acidification using
dropwise addition of trifluoroacetic acid (pH 2) to inhibit trypsin
activity. Samples were decreased to 300 µl via speed vacuum
concentration and stored at -20˚C until capillary column liquid
chromatography-tandem mass spectrometry was performed.
Mass spectrometry (MS) analysis
MS experiments were performed using LTQ-Orbitrap
mass spectrometry system (Thermo Finnigan) equipped with nano-spray
ionization sources. Data were acquired in data-dependent mode to
simultaneously record full-scan mass and collision-induced
dissociation (CID) spectra with multistage activation. For peptide
mapping, the CID spectra were compared to the sequence of human KRS
using Sequest (Bioworks; Thermo Electron). The MS/MS spectra were
analyzed by Sorcerer 2 software v.4.0 (Sage-N Research Inc.) with
Scaffold 4 Q+S as the search program for peptide/protein. The
threshold was set to a minimum of one peptide identified with 90%
confidence and the false discovery rate was automatically
calculated based on default parameters from the software. The
relative abundance of each identified protein in different samples
was analyzed by QTools (Version 6.9.3; Nanoscience
Instruments).
Bioinformatics analyses
Pathway analysis of up-/down-regulated proteins
identified by LC-MS/MS was conducted using the Gene ontology (GO)
annotation. GO annotation data for a variety of information is
available from the UniProt-Human Protein Reference Database
(http://www.hprd.org) and the Gene Ontology
Consortium website. GO-based analysis was performed to classify
proteins based on their biological process, molecular function,
cell process and developmental process using Sorcerer 2.
Statistical analyses
Two tailed unpaired Student's t-test was used to
compare patients with ICRS1 grade and patients with ICRS3 grade.
P<0.05 was considered to indicate a statistically significant
difference.
Results
Holistic protein and peptide
mining
Only proteins showing at least one peptide with an
individual score confidence >20 PEAKS when the scaffold
parameter was set at a protein threshold of 90% were considered as
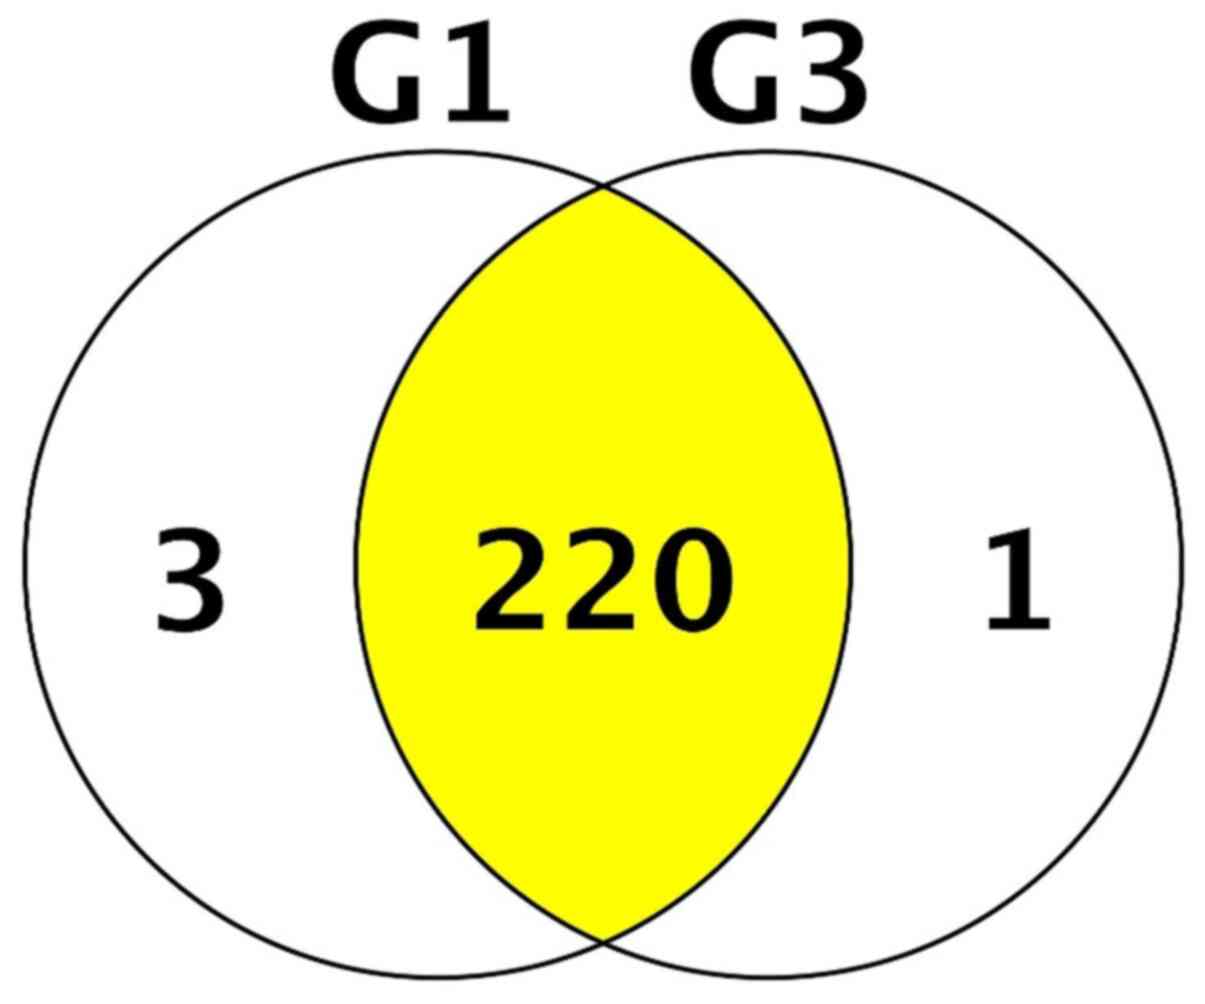
valid candidates. A total of 224 unique proteins were identified
across ICRS1 and ICRS3 patient proteomic samples. When assessing
each cohort individually, 198 unique proteins were identified in
ICRS1 patient samples and 162 unique proteins were identified in
ICRS3 patient samples. A review of the overlap between the
proteomes of each cohort revealed the 220 proteins that were common
to both patient groups (Fig.
1).
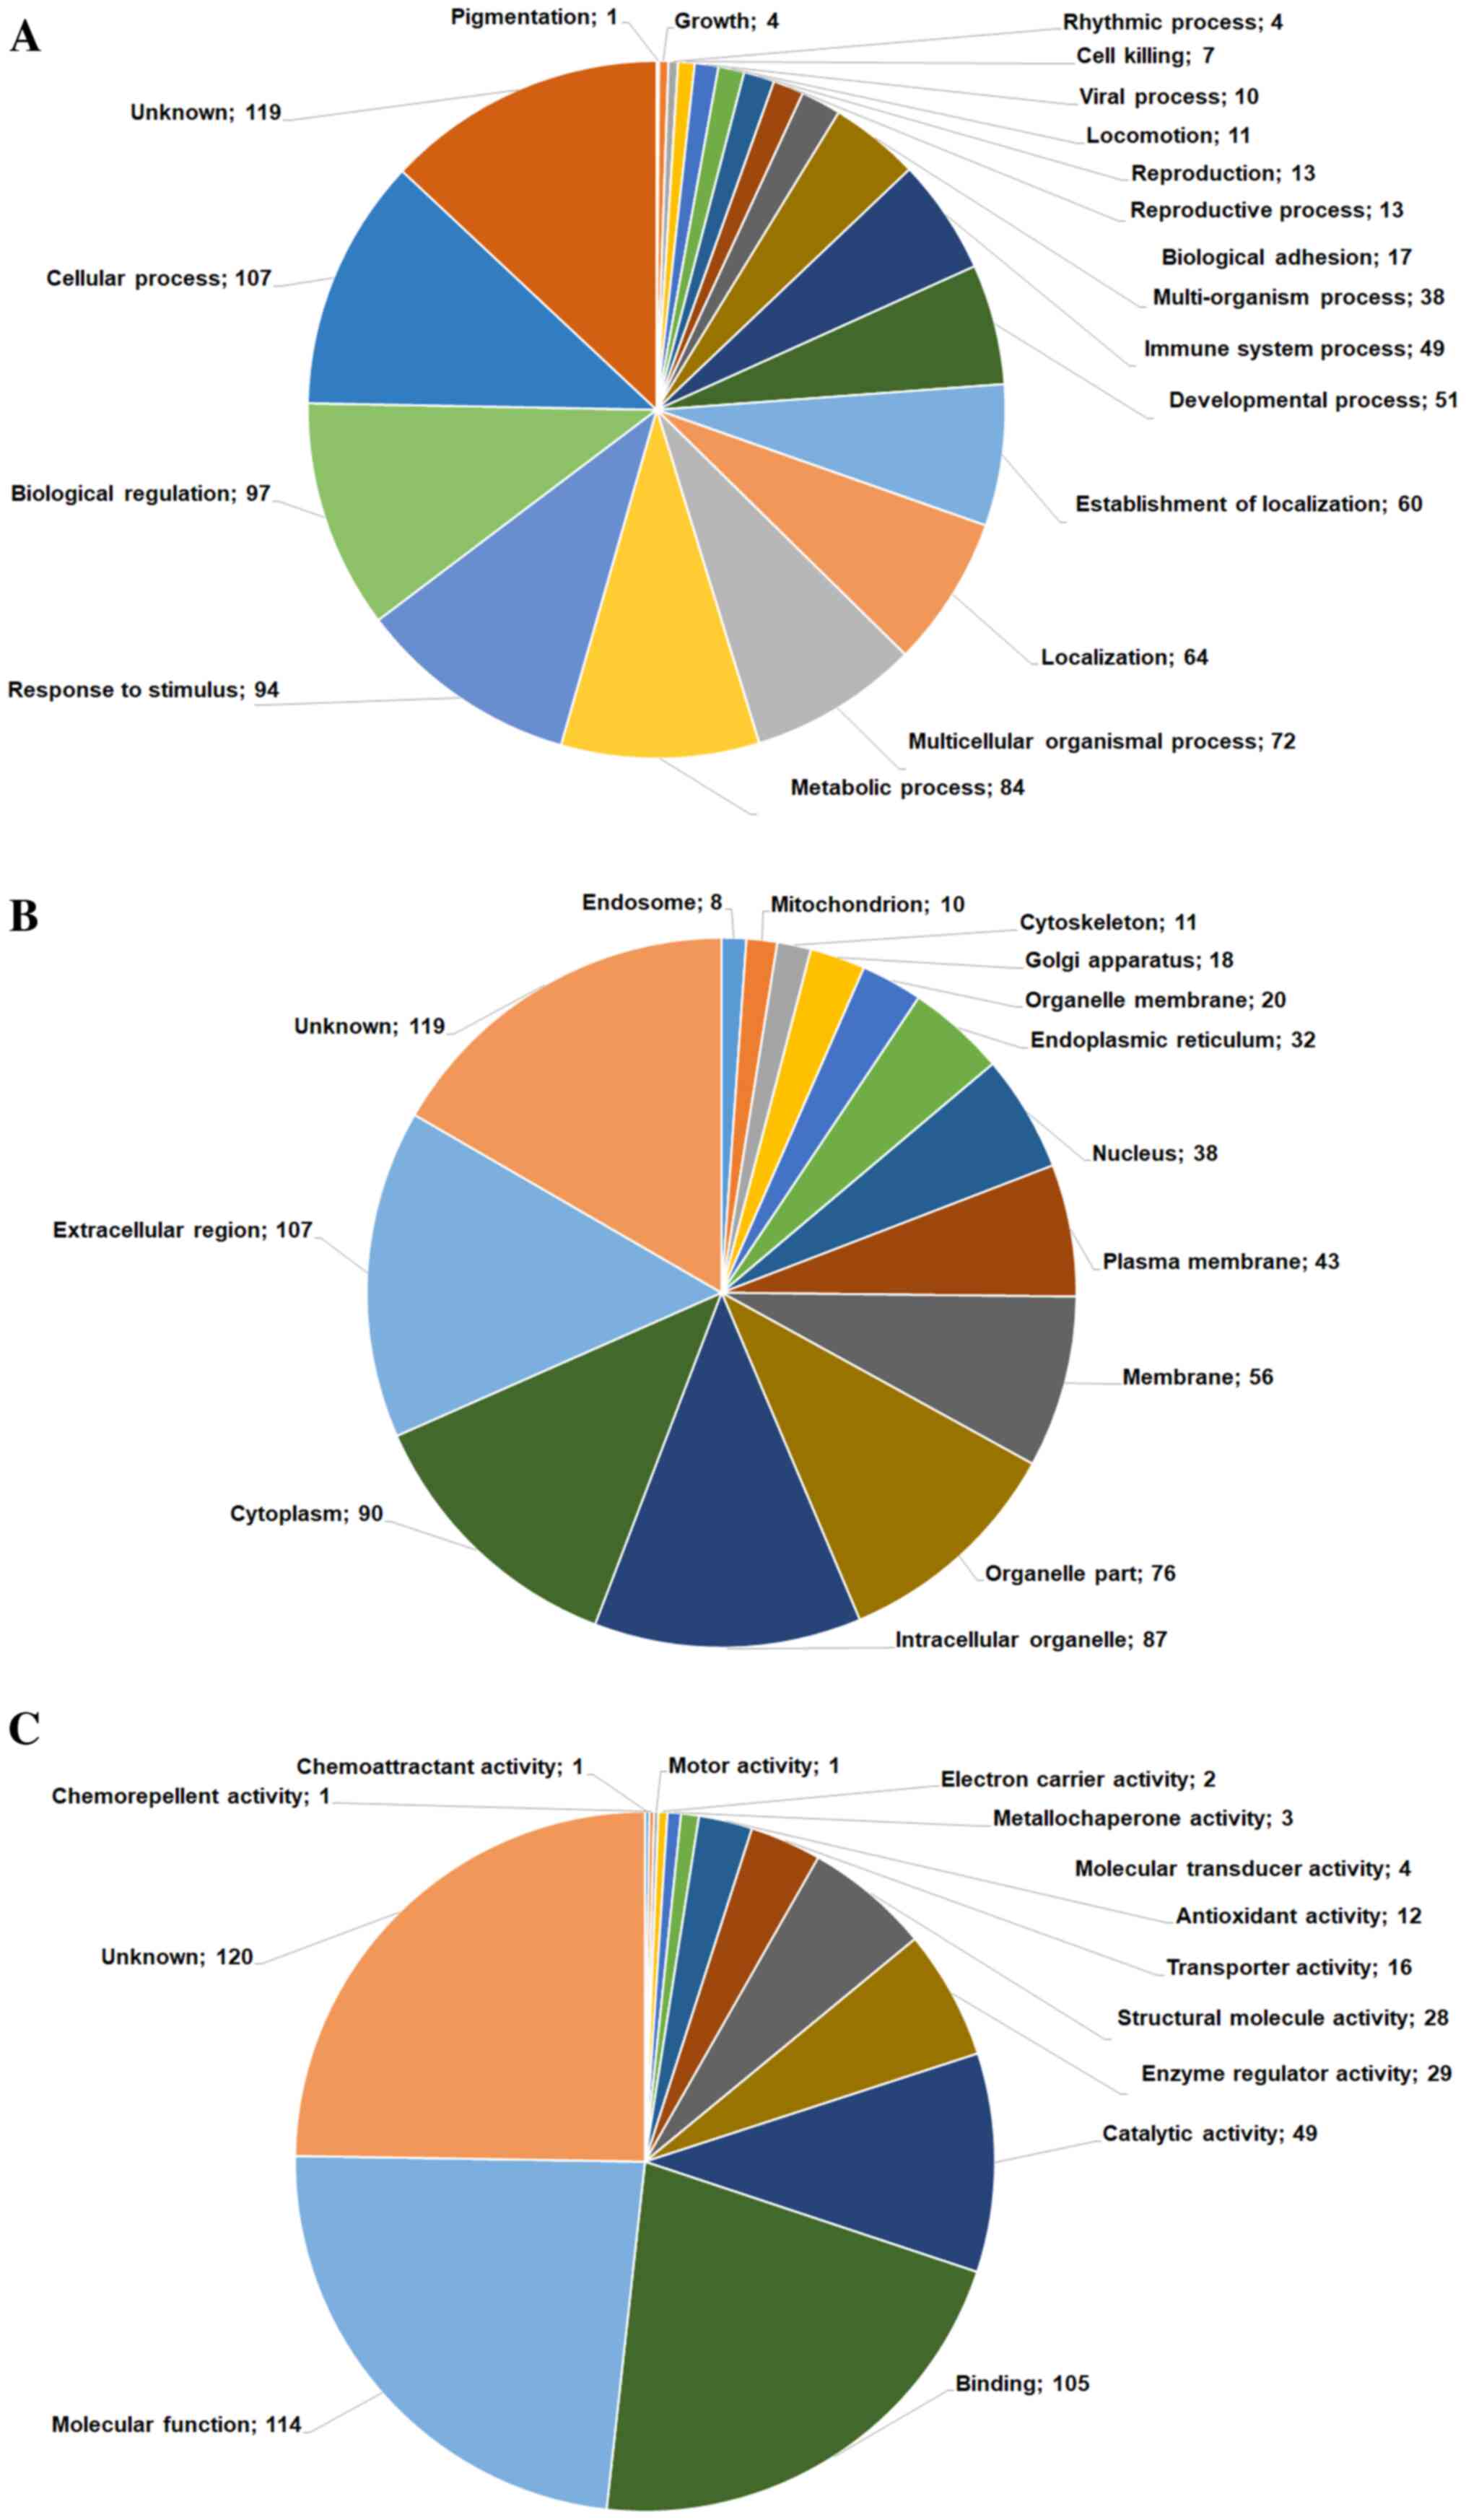
GO-based classification of
proteins
For the following analyses, we focused on a list of
reliable proteins classified into GO-based categories, including
biological process (Fig. 2A),
cellular component (Fig. 2B) and
molecular function (Fig. 2C),
according to the Human Protein Reference Database. To obtain deeper
biological insights into the proteins identified in the two grade
groups of OA tissues, we classified the identified proteins into
GO-based categories, including biological adhesion, cell killing,
cellular process, developmental process and molecular process
(Fig. 2A). Proteins were mostly
categorized as either involved in cellular processes (n=142) or
biological regulation (n=128) and were primarily involved in a
cascade of functions, including cell growth, cell killing,
adhesion, cellular process and development, and molecular
functions. From the category of proteins involved in biological
processes, we selected those that showed significant log-fold
differences in expression between the ICRS1 and ICRS3 groups.
Biological adhesion proteins
The first proteomic analysis was limited to the top
twenty identified adhesion-related proteins. Cell adhesion proteins
represent a subset of proteins that are located on the cell surface
and function in cell-cell adhesion and the adhesion of cells to
their surroundings, which are crucial for the maintenance of tissue
structure and function (17).
Cartilage oligomeric matrix protein (COMP), fibrinogen, actin,
thrombospondin-4, vitronectin and lactadherin were identified as
differentially expressed proteins in samples from patients with OA.
COMP has recently been suggested to act as a prognostic and
diagnostic marker for RA (18).
Although COMP appears to be upregulated in OA, no significant
difference was observed in COMP levels between ICRS1 and ICRS3 (log
0.38-fold) tissues (Table II).
Notably, a 21-fold increase in thrombospondin-1 levels was observed
in the ICRS3 group. Additional proteins that exhibited differential
expression included various collagen (COL) proteins, including
COL6A2, COL6A3 and COL14A1, showing slightly lower expression in
the ICRS3 group than in the ICRS1 group.
| Table IIFold change ratios of selected
upregulated or downregulated protein candidates for biological
adhesion proteins in ICRS1 and ICRS3 groups. |
Table II
Fold change ratios of selected
upregulated or downregulated protein candidates for biological
adhesion proteins in ICRS1 and ICRS3 groups.
| Regulation | Protein | Gene name | Fold change
(Log) | P-value |
|---|
| Up |
Thrombospondin-1 | THBS1 | 21.00 | 0.28 |
| | Hemoglobin subunit
β | HBB | 1.58 | 0.2 |
| | Isoform 2C2A of
collagen α-2 (VI) chain | COL6A2 | 1.38 | 0.15 |
| |
Thrombospondin-4 | THBS4 | 1.14 | 0.13 |
| | Isoform 2 of
cadherin-23 | CDH23 | 1.00 | 0.12 |
| | Cartilage
oligomeric matrix protein | COMP | 0.68 | 0.32 |
| | Transforming growth
factor-β-induced proteinig-h3 | TGFBI | 0.38 | 0.6 |
| | Apolipoprotein
A-IV | APOA4 | 0.14 | 0.89 |
| Down | Fibronectin | FN1 | -0.32 | 0.34 |
| | Isoform 2 of
collagen α-3 (VI) chain | COL6A3 | -0.51 | 0.69 |
| | Protein AMBP | AMBP | -0.51 | 0.69 |
| | Isoform 2 of
collagen α-1 (XIV) chain | COL14A1 | -0.51 | 0.75 |
| | Chloride
intracellular channel protein 1 | CLIC1 | -0.51 | 0.71 |
| | Isoform γ-A of
fibrinogen γ chain | FGG | -0.74 | 0.57 |
| | Vitronectin | VTN | -0.74 | 0.18 |
| | Lactadherin | MFGE8 | -0.74 | 0.49 |
| | Fibrinogen β
chain | FGB | -1.32 | 0.43 |
| | Actin, cytoplasmic
1 | ACTB | -1.32 | 0.13 |
| | Fibrinogen α
chain | FGA | -1.74 | 0.34 |
| | Isoform 2 of
EGF-like repeat and discoidin I-like domain-containing protein
3 | EDIL3 | -2.32 | 0.22 |
Cell death (cell killing
proteins)
Cell-killing mechanisms induce cell death, resulting
in the loss of biological cell functions (19,20).
Our proteomic analysis identified seven cell death-related proteins
that showed differential expression in the ICRS3 group compared
with the ICRS1 group. These proteins were the following: Lysozyme C
(LYZ; -0.74-fold), peroxiredoxin-1 (PRDX1; -0.32-fold), tubulin β
chain (TUBB; -log 0.74-fold), histidine-rich glycoprotein (HRG;
0.38-fold), histone H2B type 1-J (HIST1H2BJ; 1.77-fold) and serum
albumin (ALB; log 21-fold; Table
III). Although most of the identified proteins showed small
changes, HIST1H2BJ showed a significant increase in the ICRS3 group
compared with the ICRS1 group. Phosphorylated histone H2B is
thought to induce cell death in joints. Although ALB has been shown
to protect against cell death (21), the high ALB levels observed in the
ICRS3 group suggested that this protein may be involved in the
regulation of joint environment homeostasis.
| Table IIIFold-change ratios of selected
upregulated or downregulated protein candidates for cell killing
proteins in ICRS1 and ICRS3 groups. |
Table III
Fold-change ratios of selected
upregulated or downregulated protein candidates for cell killing
proteins in ICRS1 and ICRS3 groups.
| Regulation | Protein | Gene name | Fold change
(Log) | P-value |
|---|
| Up | Serum albumin | ALB | 21.00 | 0.88 |
| | Histone H2B type
1-J | HIST1H2BJ | 1.77 | 0.44 |
| |
Glyceraldehyde-3-phosphate
dehydrogenase | GAPDH | 0.38 | 0.23 |
| | Histidine-rich
glycoprotein | HRG | 0.38 | 0.8 |
| Down |
Peroxiredoxin-1 | PRDX1 | -0.32 | 0.77 |
| | Lysozyme C | LYZ | -0.74 | 0.66 |
| | Tubulin β
chain | TUBB | -0.74 | 0.42 |
Cellular process proteins
A total of 107 proteins were identified that were
classified as cellular process-related proteins. Cellular processes
are mediated through the complex actions of several biological
molecules that communicate via biophysical or biochemical
interactions (22). Proteins
associated with several cellular processes were identified, which
presented either increased or decreased expression levels in the
ICRS3 group, and changes in these protein levels can either
accelerate OA progression or alleviate OA symptoms. The results
from our analysis (Table IV)
demonstrated that the expression levels of
phosphatidylethanolamine-binding protein 1 (PEBP1; -log 1.32-fold),
pigment epithelium-derived factor (SERPINF1; log 1-fold),
tetranectin (CLEC3B; -log 2.32-fold), apolipoprotein E (APOE; -log
2.32-fold), procollagen C-endopeptidase enhancer 1 (PCOLCE; -log
2.32-fold), collagen type I α 1 chain (COL1A1; -log 4.64-fold),
cartilage intermediate layer protein (CILP; -log 18.35-fold),
cartilage acidic protein 1 (CRTAC1; -log 19.93-fold) and collagen
type I α 2 chain (COL1A2; -log 23.25-fold) were decreased in the
ICRS3 group compared with the ICRS1 group. Conversely, the
expression levels of apolipoprotein B-100 (APOB; log 2.04-fold),
isoform 2C2A of the collagen type VI α 2 chain (COL6A2; log
1.38-fold), antithrombin-III (SERPINC; log 1.2-fold) and
prelamin-A/C (LMNA; log 17.82-fold) were increased in the ICRS3
group compared with the ICRS1 group. The results confirmed that the
expression level of LMNA was remarkably high in the ICRS3 group,
and that LMNA high expression level and the presence of LMNA
mutations are known to be contributors of the apoptosis of OA
chondrocytes (23,24).
| Table IVFold-change ratios of selected
up-regulated or down-regulated protein candidates for cellular
process proteins in ICRS1 and ICRS3 groups. |
Table IV
Fold-change ratios of selected
up-regulated or down-regulated protein candidates for cellular
process proteins in ICRS1 and ICRS3 groups.
| Regulation | Protein | Gene name | Fold-change
(Log) | P-value |
|---|
| Up |
Thrombospondin-1 | THBS1 | 21.00 | 0.28 |
| | Prelamin-A/C | LMNA | 17.81 | 0.34 |
| | Apolipoprotein
B-100 | APOB | 2.04 | 0.14 |
| | Isoform 2C2A of
Collagen α-2 (VI) chain | COL6A2 | 1.38 | 0.15 |
| | Hemoglobin subunit
δ | HBD | 1.32 | 0.46 |
| | Fibulin-1 | FBLN1 | 1.20 | 0.32 |
| |
Antithrombin-III | SERPINC1 | 1.20 | 0.17 |
| |
Thrombospondin-4 | THBS4 | 1.14 | 0.13 |
| | Carbonic anhydrase
1 | CA1 | 1.14 | 0.36 |
| | Superoxide
dismutase [Cu-Zn] | SOD1 | 1.07 | 0.2 |
| | Isoform 2 of
cadherin-23 | CDH23 | 1.00 | 0.13 |
| | Retinol-binding
protein 4 | RBP4 | 1.00 | 0.017 |
| Down |
α-1-antitrypsin | SERPINA1 | -1.00 | 0.15 |
| | Lumican | LUM | -1.00 | 0.12 |
| | Pigment
epithelium-derived factor | SERPINF1 | -1.00 | 0.36 |
| | Fibrinogen β
chain | FGB | -1.32 | 0.43 |
| | Actin, cytoplasmic
1 | ACTB | -1.32 | 0.13 |
| | Biglycan | BGN | -1.32 | 0.023 |
| |
α-1-antichymotrypsin | SERPINA3 | -1.32 | 0.27 |
| |
Phosphatidylethanolamine-binding protein
1 | PEBP1 | -1.32 | 0.067 |
| | Argininosuccinate
synthase | ASS1 | -1.32 | 0.48 |
| | Fibrinogen α
chain | FGA | -1.74 | 0.34 |
| | Complement
component C8 α chain | C8A | -1.74 | 0.27 |
| | Apolipoprotein
E | APOE | -2.32 | 0.24 |
| | Procollagen
C-endopeptidase enhancer 1 | PCOLCE | -2.32 | 0.081 |
| | Tetranectin | CLEC3B | -2.32 | 0.073 |
| | Collagen α-1 (I)
chain | COL1A1 | -4.64 | 0.35 |
| | Cartilage
intermediate layer protein 1 | CILP | -18.35 | 0.59 |
| | Cartilage acidic
protein 1 | CRTAC1 | -19.93 | 0.15 |
| | Collagen α-2 (I)
chain | COL1A2 | -23.25 | 0.34 |
Developmental process proteins
The results from proteomic assay identified 51
developmental process-related proteins. Proteins involved in the
developmental process, which describe the processes through which
multicellular organisms develop from the early immature stage, are
responsible for the maturity and differentiation of various
organisms (25-27).
Of the 51 identified proteins, the following proteins showed
significantly decreased expression levels in the ICRS3 group
compared with the ICRS1 group: Glutathione 5-transferase P (G5TP1;
-log 1.00-fold), chondroadherin (CHAD; -log 1.32-fold), angiogenin
(ANG; -log 1.74-fold), procollagen C-endopeptidase enhancer 1
(PCOLCE; -log 2.32-fold), tetranectin (CLEC3B; -log 2.32-fold) and
collagen type I α 1 chain (COL1A1; -log 4.64-fold). Conversely, the
expression levels of apolipoprotein A-II (APOA2; log 1.32-fold) and
collagen type V α 2 chain (COL5A2; log 8.57-fold) were
significantly increased in the ICRS3 group compared with the ICRS1
group (Table V).
| Table VFold-change ratios of selected
up-regulated or down-regulated protein candidates for developmental
process proteins in ICRS1 and ICRS3 groups. |
Table V
Fold-change ratios of selected
up-regulated or down-regulated protein candidates for developmental
process proteins in ICRS1 and ICRS3 groups.
| Regulation | Protein | Gene name | Fold-change
(Log) | P-value |
|---|
| Up | Collagen α-2 (V)
chain | COL5A2 | 8.57 | 0.34 |
| | Apolipoprotein
A-II | APOA2 | 1.32 | 0.33 |
| | Fibulin-1 | FBLN1 | 1.20 | 0.32 |
| | Isoform 2 of
cadherin-23 | CDH23 | 1.00 | 0.10 |
| | Annexin A2 | ANXA2 | 1.00 | 0.48 |
| Down | Glutathione
S-transferase P | GSTP1 | -1.00 | 0.19 |
| | Actin, cytoplasmic
1 | ACTB | -1.32 | 0.13 |
| |
Phosphatidylethanolamine-binding protein
1 | PEBP1 | -1.32 | 0.067 |
| | Chondroadherin | CHAD | -1.32 | 0.42 |
| | Argininosuccinate
synthase | ASS1 | -1.32 | 0.48 |
| | Angiogenin | ANG | -1.74 | 0.21 |
| | Procollagen
C-endopeptidase enhancer 1 | PCOLCE | -2.32 | 0.081 |
| | Tetranectin | CLEC3B | -2.32 | 0.073 |
| | Collagen α-1 (I)
chain | COL1A1 | -4.64 | 0.35 |
Growth and molecular function
proteins
Growth and molecular function-related proteins not
only play important roles in cell and tissue growth but are also
important for cartilage regeneration related to OA (28,29)
In the present study, we identified 4 and 114 proteins related to
growth and molecular functions, respectively, and we confirmed that
their expression levels were increased or decreased in the ICRS3
group compared with the ICRS1 group. Metallothionein-2 (MT2A; -log
1.00-fold), metallothionein-1X (MT1X; -log 1.32-fold),
argininosuccinate synthase (ASS1; -log 1.32-fold), isoform 2 of
N-acetlymuramoyl-L-alanine amidase (PGLYRP2; -log 1.74-fold) and
CD59 glycoprotein (CD59; -log 1.74-fold) expression levels were
decreased in the ICRS3 group compared with the ICRS1 group.
Conversely, the expression levels of apolipoprotein B-100 (APOB;
log 2.04-fold), ryanodine receptor (RYR1; log 18.38-fold) and
complement C5 (C5; log 19.8-fold) were increased in the ICRS3 group
compared with the ICRS1 group. Interestingly, the expression level
of C5 has been reported to be increase in RA (30). In the present study, the
identification of upregulated C5 expression in OA suggested that
increased expression of C5 may serve as a major factor in OA
development (Table VI).
| Table VIFold-change ratios of selected
upregulated or downregulated protein candidates for growth and
molecular function process proteins in ICRS1 and ICRS3 groups. |
Table VI
Fold-change ratios of selected
upregulated or downregulated protein candidates for growth and
molecular function process proteins in ICRS1 and ICRS3 groups.
| Regulation | Protein | Gene name | Fold-change
(Log) | P-value |
|---|
| Up | Complement C5 | C5 | 19.8 | 0.13 |
| | Ryanodine receptor
1 | RYR1 | 18.38 | 0.34 |
| | Apolipoprotein
E | APOE | 2.32 | 0.24 |
| | Apolipoprotein
B-100 | APOB | 2.04 | 0.14 |
| |
Peroxiredoxin-2 | PRDX2 | 1.63 | 0.15 |
| | Carbonic anhydrase
1 | CA1 | 1.14 | 0.36 |
| |
Thrombospondin-4 | THBS4 | 1.14 | 0.13 |
| | Lumican | LUM | 1 | 0.12 |
| | Complement factor
H-related protein 1 | CFHR1 | 1.00 | 0.57 |
| | Profilin-1 | PFN1 | 0.32 | 0.76 |
| Down | Pigment
epithelium-derived factor | SERPINF1 | -1.00 | 0.36 |
| |
Metallothionein-2 | MT2A | -1.00 | 0.58 |
| |
α-1-antichymotrypsin | SERPINA3 | -1.32 | 0.27 |
| |
Phosphatidylethanolamine-binding protein
1 | PEBP1 | -1.32 | 0.067 |
| |
Metallothionein-1X | MT1X | -1.32 | 0.5 |
| | Argininosuccinate
synthase | ASS1 | -1.32 | 0.48 |
| | Isoform 2 of
N-acetylmuramoyl-L-alanine amidase | PGLYRP2 | -1.74 | 0.39 |
| | Annexin A1 | ANXA1 | -1.74 | 0.062 |
| | Complement
component C8 α chain | C8A | -1.74 | 0.27 |
| | CD59
glycoprotein | CD59 | -1.74 | 0.36 |
Discussion
In the present study, we determined the
differentially expressed proteins between ISCR 1 and ISCR 3 grade
OA patients and analyzed these proteins according to the GO-based
classification of protein function. Most previous reports have
conducted proteomic analyses of OA patients compared with control
groups, following pharmacological or surgical treatments (31,32).
In previous studies, many proteomic analyses for arthritis have
been reported. However, most studies did not accurately
differentiate between RA and degenerative arthritis. Furthermore, a
number of biomarkers for RA are involved in inflammatory diseases
and autoimmune diseases (33-36).
The present study aimed to determine biomarkers in OA, which
differs from rheumatism, and performed proteomic analysis according
to ICRS grade. The present study analyzed the differential
expression of proteins in tissue samples from OA patients with
early or late ICRS stages, in order to identify potential
OA-inducing factors. Our protein analysis identified numerous
proteins, some of which may be considered as potential parameters
associated with the progression of OA.
Following analysis of the proteins characterized as
biological adhesion proteins, COMP was found to be highly expressed
in OA patients; however, there was no significant difference in
COMP expression levels between the ICRS1 and ICRS3 grades. This
result suggested that COMP may act as an OA-inducing factor but may
not affect ICRS grade. Interestingly, thrombospondin-1 expression
was increased 21-fold in the ICRS3 group compared with the ICRS1
group. Thrombospondin-1 can bind to fibrinogen, fibronectin,
laminin and type V collagen (37)
and has been shown to play certain roles in platelet aggregation,
tumorigenesis and angiogenesis (38-42).
Both the procollagen domain and the type I repeats of
thrombospondin-1 have been reported to inhibit neovascularization
and endothelial cell migration. Thrombospondin-1 contains three
type I repeats, although only the last two have been found to
inhibit angiogenesis (43,44). Thrombospondin-1 has also been shown
to interact with matrix metalloproteinase 2(45). Thrombospondin-1 was found to be
highly expressed in OA and may regulate inflammation in the joint
area (46,47). Furthermore, the expression levels
of COL1A1 (-log 4.64-fold) and COL1A2 (-log 23.25-fold) were
significantly decreased in the ICRS3 group compared with the ICRS1
group in the present study. Increased COL1A1 and COL1A2 expression
levels have been reported to reduce OA progression (48). In the present study, the decreased
expression levels of COL1A1 and COL1A2 in the ICRS3 group compared
with the ICRS1 group suggested that changes in their expression may
be associated with OA progression.
Angiogenin levels in the synovial fluid have been
reported to be increased in patients with inflammatory diseases
compared with healthy individuals (49). Furthermore, highest angiogenin
levels in the synovial fluid have been reported for patients with
active RA or acute gout (49).
However, the present study demonstrated that angiogenin expression
was higher in the ICRS1 group than in the ICRS3 group. Tetranectin
is a phosphorylated glycoprotein that has been hypothesized to
regulate mineral deposition within the bone (50,51);
however, the role of tetranectin in the pathogenesis of OA is
currently unclear. Tetranectin has been implicated in the impaired
regulation of fibrinolysis and is associated with the inflammatory
process in RA (52,53). However, the present study
demonstrated that tetranectin expression was decreased in the ICRS3
group compared with the ICRS1 group.
The presents study demonstrated that the expression
levels of C5 and RYR1 were significantly increased in the ICRS3
group compared with the ICRS1 group. Interestingly, C5 expression
was upregulated 19.8-fold in the ICRS3 group compared with the
ICRS1 group. The cleavage of C5 into C5a and C5b results in the
formation of the C5b-9 complex through the recruitment of
downstream complement proteins. The C5a receptor is expressed in
the cartilage of both normal subjects and patients with OA and RA,
and C5 receptor expression is induced by interleukin-1β in
chondrocytes (54-56).
C5 activation in OA may affect the experience of pain, which is a
specific clinical feature of OA, as C5 plays a vital role in the
onset of pain via the activation and sensitization of nociceptors,
both in vitro and in vivo (57). In addition, antagonists or
inhibitors of C5a receptors might represent key candidates for pain
therapy in OA. As OA progresses and the ICRS grade increases, the
expression of C5 also appears to be increased, which may cause
patients to feel increasing pain. In addition, the membrane attack
complex (MAC) inhibitory protein CD59 is likely involved in the
protection against OA (57).
Consistent with this finding, the present study demonstrated that
CD59 expression was decreased in the ICRS3 group compared with the
ICRS1 group, suggesting that OA progression may be further
accelerated by MAC activity.
In summary, the present comprehensive analysis of
protein expression differences between ICRS grades demonstrated
that most OA-associated protein expression levels were increased
during the early ICRS stages and decreased as the ICRS grade
progresses. Furthermore, protein analysis on bone tissues samples
was performed according to ICRS grade. Comparative analysis of
proteins in bone tissues and blood will be performed in future
experiments. Collectively, the findings of the present study
suggested that the protein expression patterns associated with OA
onset and those associated with ICRS progression may differ.
Moreover, results of the present study suggested a potential novel
treatment option for the target of thrombospondin-1 and C5, which
were expressed in ICRS3 stage.
Acknowledgements
Not applicable.
Funding
This study was supported by the Ministry of Health & Welfare
(grant no. HI18C0661), Republic of Korea.
Availability of data and materials
The datasets used and/or analyzed during the current
study are available from the corresponding author on reasonable
request.
Authors' contributions
DSC, MEK, WSL and JSL conceived and designed the
experiments. MEK, DSC, KYK and NYL performed experiments and
analyzed the data. DSC and JSL wrote the paper. DSC and MEK confirm
the authenticity of all the raw data. All authors have read and
approved the final manuscript.
Ethics approval and consent to
participate
This study was approved by the Research Ethics Board
from the International St. Mary's Hospital, Kwandong University
College of Medicine (approval no. CKU-020-6). Written consent was
obtained from all patients.
Patient consent for publication
Not applicable.
Competing interests
A patent was submitted for the diagnostic prognosis
kit used in the present study (www.kipris.or.kr; title, Biomarkers for osteoarthritis
and osteoarthritis diagnostic or prognostic kit; registration no,
101848064; approval date, 04/05/2018; inventor, Jun Sik Lee).
References
|
1
|
Martel-Pelletier J, Barr AJ, Cicuttini FM,
Conaghan PG, Cooper C, Goldring MB, Goldring SR, Jones G, Teichtahl
AJ and Pelletier JP: Osteoarthritis. Nat Rev Dis Primers.
2(16072)2016.PubMed/NCBI View Article : Google Scholar
|
|
2
|
Disease GBD, Injury I and Prevalence C:
GBD 2015 Disease and Injury Incidence and Prevalence Collaborators.
Global, regional, and national incidence, prevalence, and years
lived with disability for 310 diseases and injuries, 1990-2015: A
systematic analysis for the Global Burden of Disease Study 2015.
Lancet. 388:1545–1602. 2016.PubMed/NCBI View Article : Google Scholar
|
|
3
|
Sokolove J and Lepus CM: Role of
inflammation in the pathogenesis of osteoarthritis: Latest findings
and interpretations. Ther Adv Musculoskelet Dis. 5:77–94.
2013.PubMed/NCBI View Article : Google Scholar
|
|
4
|
Swagerty DL Jr and Hellinger D:
Radiographic assessment of osteoarthritis. Am Fam Physician.
64:279–286. 2001.PubMed/NCBI
|
|
5
|
Kohn MD, Sassoon AA and Fernando ND:
Classifications in Brief: Kellgren-Lawrence classification of
osteoarthritis. Clin Orthop Relat Res. 474:1886–1893.
2016.PubMed/NCBI View Article : Google Scholar
|
|
6
|
Hurley M, Dickson K, Hallett R, Grant R,
Hauari H, Walsh N, Stansfield C and Oliver S: Exercise
interventions and patient beliefs for people with hip, knee or hip
and knee osteoarthritis: A mixed methods review. Cochrane Database
Syst Rev. 4(CD010842)2018.PubMed/NCBI View Article : Google Scholar
|
|
7
|
Bultink IE and Lems WF: Osteoarthritis and
osteoporosis: What is the overlap? Curr Rheumatol Rep.
15(328)2013.PubMed/NCBI View Article : Google Scholar
|
|
8
|
Pouresmaeili F, Kamalidehghan B, Kamarehei
M and Goh YM: A comprehensive overview on osteoporosis and its risk
factors. Ther Clin Risk Manag. 14:2029–2049. 2018.PubMed/NCBI View Article : Google Scholar
|
|
9
|
Sözen T, Özışık L and Başaran NC: An
overview and management of osteoporosis. Eur J Rheumatol. 4:46–56.
2017.PubMed/NCBI View Article : Google Scholar
|
|
10
|
Nazrun AS, Tzar MN, Mokhtar SA and Mohamed
IN: A systematic review of the outcomes of osteoporotic fracture
patients after hospital discharge: Morbidity, subsequent fractures,
and mortality. Ther Clin Risk Manag. 10:937–948. 2014.PubMed/NCBI View Article : Google Scholar
|
|
11
|
Dhital R, Lynn T, Tachamo N and Poudel DR:
The trend of osteoporosis and osteoporotic fragility fractures in
inpatients: Results from a national database. J Community Hosp
Intern Med Perspect. 9:211–214. 2019.PubMed/NCBI View Article : Google Scholar
|
|
12
|
Loeser RF: The role of aging in the
development of osteoarthritis. Trans Am Clin Climatol Assoc.
128:44–54. 2017.PubMed/NCBI
|
|
13
|
Palo N, Chandel SS, Dash SK, Arora G,
Kumar M and Biswal MR: Effects of osteoarthritis on quality of life
in elderly population of Bhubaneswar, India: A prospective
multicenter screening and therapeutic study of 2854 patients.
Geriatr Orthop Surg Rehabil. 6:269–275. 2015.PubMed/NCBI View Article : Google Scholar
|
|
14
|
Lorenzo P, Aspberg A, Saxne T and
Önnerfjord P: Quantification of cartilage oligomeric matrix protein
(COMP) and a COMP neoepitope in synovial fluid of patients with
different joint disorders by novel automated assays. Osteoarthritis
Cartilage. 25:1436–1442. 2017.PubMed/NCBI View Article : Google Scholar
|
|
15
|
Fernández-Puente P, Calamia V,
González-Rodríguez L, Lourido L, Camacho-Encina M, Oreiro N,
Ruiz-Romero C and Blanco FJ: Multiplexed mass spectrometry
monitoring of biomarker candidates for osteoarthritis. J
Proteomics. 152:216–225. 2017.PubMed/NCBI View Article : Google Scholar
|
|
16
|
van der Meijden OA, Gaskill TR and Millett
PJ: Glenohumeral joint preservation: A review of management options
for young, active patients with osteoarthritis. Adv Orthop.
2012(160923)2012.PubMed/NCBI View Article : Google Scholar
|
|
17
|
Sergé A: The molecular architecture of
cell adhesion: Dynamic remodeling revealed by videonanoscopy. Front
Cell Dev Biol. 4(36)2016.PubMed/NCBI View Article : Google Scholar
|
|
18
|
Liu F, Wang X, Zhang X, Ren C and Xin J:
Role of serum cartilage oligomeric matrix protein (COMP) in the
diagnosis of rheumatoid arthritis (RA): A case-control study. J Int
Med Res. 44:940–949. 2016.PubMed/NCBI View Article : Google Scholar
|
|
19
|
Samali A, Fulda S, Gorman AM, Hori O and
Srinivasula SM: Cell stress and cell death. Int J Cell Biol.
2010(245803)2010.PubMed/NCBI View Article : Google Scholar
|
|
20
|
Green DR and Llambi F: Cell death
signaling. Cold Spring Harb Perspect Biol.
7(a006080)2015.PubMed/NCBI View Article : Google Scholar
|
|
21
|
Kim YL, Im YJ, Ha NC and Im DS: Albumin
inhibits cytotoxic activity of lysophosphatidylcholine by direct
binding. Prostaglandins Other Lipid Mediat. 83:130–138.
2007.PubMed/NCBI View Article : Google Scholar
|
|
22
|
Kothari P, Johnson C, Sandone C, Iglesias
PA and Robinson DN: How the mechanobiome drives cell behavior,
viewed through the lens of control theory. J Cell Sci.
132(jcs234476)2019.PubMed/NCBI View Article : Google Scholar
|
|
23
|
Mateos J, De la Fuente A,
Lesende-Rodriguez I, Fernández-Pernas P, Arufe MC and Blanco FJ:
Lamin A deregulation in human mesenchymal stem cells promotes an
impairment in their chondrogenic potential and imbalance in their
response to oxidative stress. Stem Cell Res (Amst). 11:1137–1148.
2013.PubMed/NCBI View Article : Google Scholar
|
|
24
|
Attur M, Ben-Artzi A, Yang Q, Al-Mussawir
HE, Worman HJ, Palmer G and Abramson SB: Perturbation of nuclear
lamin A causes cell death in chondrocytes. Arthritis Rheum.
64:1940–1949. 2012.PubMed/NCBI View Article : Google Scholar
|
|
25
|
Stephan JP, Roberts PE, Bald L, Lee J, Gu
Q, Devaux B and Mather JP: Selective cloning of cell surface
proteins involved in organ development: Epithelial glycoprotein is
involved in normal epithelial differentiation. Endocrinology.
140:5841–5854. 1999.PubMed/NCBI View Article : Google Scholar
|
|
26
|
Huang Z, Wang X and Chen D: Signal
proteins involved in myogenic stem cells differentiation. Curr
Protein Pept Sci. 18:571–578. 2017.PubMed/NCBI View Article : Google Scholar
|
|
27
|
Oh JE, Freilinger A, Gelpi E, Pollak A,
Hengstschläger M and Lubec G: Proteins involved in neuronal
differentiation of neuroblastoma cell line N1E-115.
Electrophoresis. 28:2009–2017. 2007.PubMed/NCBI View Article : Google Scholar
|
|
28
|
Grassel S and Aszodi A: Osteoarthritis and
cartilage regeneration: Focus on pathophysiology and molecular
mechanisms. Int J Mol Sci. 20(6156)2019.PubMed/NCBI View Article : Google Scholar
|
|
29
|
Akkiraju H and Nohe A: Role of
chondrocytes in cartilage formation, progression of osteoarthritis
and cartilage regeneration. J Dev Biol. 3:177–192. 2015.PubMed/NCBI View Article : Google Scholar
|
|
30
|
Hornum L, Hansen AJ, Tornehave D, Fjording
MS, Colmenero P, Wätjen IF, Søe Nielsen NH, Bliddal H and Bartels
EM: C5a and C5aR are elevated in joints of rheumatoid and psoriatic
arthritis patients, and C5aR blockade attenuates leukocyte
migration to synovial fluid. PLoS One. 12(e0189017)2017.PubMed/NCBI View Article : Google Scholar
|
|
31
|
Xiang Y, Sekine T, Nakamura H, Imajoh-Ohmi
S, Fukuda H, Nishioka K and Kato T: Proteomic surveillance of
autoimmunity in osteoarthritis: Identification of triosephosphate
isomerase as an autoantigen in patients with osteoarthritis.
Arthritis Rheum. 50:1511–1521. 2004.PubMed/NCBI View Article : Google Scholar
|
|
32
|
Takinami Y, Yoshimatsu S, Uchiumi T,
Toyosaki-Maeda T, Morita A, Ishihara T, Yamane S, Fukuda I, Okamoto
H, Numata Y, et al: Identification of potential prognostic markers
for knee osteoarthritis by serum proteomic analysis. Biomark
Insights. 8:85–95. 2013.PubMed/NCBI View Article : Google Scholar
|
|
33
|
Park YJ, Chung MK, Hwang D and Kim WU:
Proteomics in Rheumatoid Arthritis Research. Immune Netw.
15:177–185. 2015.PubMed/NCBI View Article : Google Scholar
|
|
34
|
Camafeita E, Lamas JR, Calvo E, López JA
and Fernández-Gutiérrez B: Proteomics: New insights into rheumatic
diseases. Proteomics Clin Appl. 3:226–241. 2009.PubMed/NCBI View Article : Google Scholar
|
|
35
|
Mun S, Lee J, Lim MK, Lee YR, Ihm C, Lee
SH and Kang HG: Development of a novel diagnostic biomarker set for
rheumatoid arthritis using a proteomics approach. BioMed Res Int.
2018(7490723)2018.PubMed/NCBI View Article : Google Scholar
|
|
36
|
Lee J, Mun S, Kim D, Lee YR, Sheen DH, Ihm
C, Lee SH and Kang HG: Proteomics Analysis for Verification of
Rheumatoid Arthritis Biomarker Candidates Using Multiple Reaction
Monitoring. Proteomics Clin Appl. 13(e1800011)2019.PubMed/NCBI View Article : Google Scholar
|
|
37
|
Tan K and Lawler J: The interaction of
Thrombospondins with extracellular matrix proteins. J Cell Commun
Signal. 3:177–187. 2009.PubMed/NCBI View Article : Google Scholar
|
|
38
|
Isenberg JS, Romeo MJ, Yu C, Yu CK, Nghiem
K, Monsale J, Rick ME, Wink DA, Frazier WA and Roberts DD:
Thrombospondin-1 stimulates platelet aggregation by blocking the
antithrombotic activity of nitric oxide/cGMP signaling. Blood.
111:613–623. 2008.PubMed/NCBI View Article : Google Scholar
|
|
39
|
Rouanne M, Adam J, Goubar A, Robin A,
Ohana C, Louvet E, Cormier J, Mercier O, Dorfmüller P, Fattal S, et
al: Osteopontin and thrombospondin-1 play opposite roles in
promoting tumor aggressiveness of primary resected non-small cell
lung cancer. BMC Cancer. 16(483)2016.PubMed/NCBI View Article : Google Scholar
|
|
40
|
Pinessi D, Ostano P, Borsotti P, Bello E,
Guffanti F, Bizzaro F, Frapolli R, Bani MR, Chiorino G, Taraboletti
G, et al: Expression of thrombospondin-1 by tumor cells in
patient-derived ovarian carcinoma xenografts. Connect Tissue Res.
56:355–363. 2015.PubMed/NCBI View Article : Google Scholar
|
|
41
|
Bender HR, Campbell GE, Aytoda P,
Mathiesen AH and Duffy DM: Thrombospondin 1 (THBS1) promotes
follicular angiogenesis, luteinization, and ovulation in primates.
Front Endocrinol (Lausanne). 10(727)2019.PubMed/NCBI View Article : Google Scholar
|
|
42
|
Ernens I, Bousquenaud M, Lenoir B, Devaux
Y and Wagner DR: Adenosine stimulates angiogenesis by up-regulating
production of thrombospondin-1 by macrophages. J Leukoc Biol.
97:9–18. 2015.PubMed/NCBI View Article : Google Scholar
|
|
43
|
Tolsma SS, Volpert OV, Good DJ, Frazier
WA, Polverini PJ and Bouck N: Peptides derived from two separate
domains of the matrix protein thrombospondin-1 have anti-angiogenic
activity. J Cell Biol. 122:497–511. 1993.PubMed/NCBI View Article : Google Scholar
|
|
44
|
Foulsham W, Dohlman TH, Mittal SK,
Taketani Y, Singh RB, Masli S and Dana R: Thrombospondin-1 in
ocular surface health and disease. Ocul Surf. 17:374–383.
2019.PubMed/NCBI View Article : Google Scholar
|
|
45
|
Lee T, Esemuede N, Sumpio BE and Gahtan V:
Thrombospondin-1 induces matrix metalloproteinase-2 activation in
vascular smooth muscle cells. J Vasc Surg. 38:147–154.
2003.PubMed/NCBI View Article : Google Scholar
|
|
46
|
Maumus M, Manferdini C, Toupet K, Chuchana
P, Casteilla L, Gachet M, Jorgensen C, Lisignoli G and Noël D:
Thrombospondin-1 partly mediates the cartilage protective effect of
adipose-derived mesenchymal stem cells in osteoarthritis. Front
Immunol. 8(1638)2017.PubMed/NCBI View Article : Google Scholar
|
|
47
|
McMorrow JP, Crean D, Gogarty M, Smyth A,
Connolly M, Cummins E, Veale D, Fearon U, Tak PP, Fitzgerald O, et
al: Tumor necrosis factor inhibition modulates thrombospondin-1
expression in human inflammatory joint disease through altered
NR4A2 activity. Am J Pathol. 183:1243–1257. 2013.PubMed/NCBI View Article : Google Scholar
|
|
48
|
Luo S, Li W, Wu W and Shi Q: Elevated
expression of MMP8 and MMP9 contributes to diabetic osteoarthritis
progression in a rat model. J Orthop Surg Res.
16(64)2021.PubMed/NCBI View Article : Google Scholar
|
|
49
|
Lioté F, Champy R, Moenner M,
Boval-Boizard B and Badet J: Elevated angiogenin levels in synovial
fluid from patients with inflammatory arthritis and secretion of
angiogenin by cultured synovial fibroblasts. Clin Exp Immunol.
132:163–168. 2003.PubMed/NCBI View Article : Google Scholar
|
|
50
|
Iba K, Chiba H, Yamashita T, Ishii S and
Sawada N: Phase-independent inhibition by retinoic acid of
mineralization correlated with loss of tetranectin expression in a
human osteoblastic cell line. Cell Struct Funct. 26:227–233.
2001.PubMed/NCBI View Article : Google Scholar
|
|
51
|
Wewer UM, Ibaraki K, Schjørring P, Durkin
ME, Young MF and Albrechtsen R: A potential role for tetranectin in
mineralization during osteogenesis. J Cell Biol. 127:1767–1775.
1994.PubMed/NCBI View Article : Google Scholar
|
|
52
|
Kamper EF, Kopeikina LT, Koutsoukos V and
Stavridis J: Plasma tetranectin levels and disease activity in
patients with rheumatoid arthritis. J Rheumatol. 24:262–268.
1997.PubMed/NCBI
|
|
53
|
Kamper EF, Kopeikina LT, Trontzas P,
Kyriazis NC, Vaiopoulos G and Stavridis J: Comparative study of
tetranectin levels in serum and synovial fluid of patients with
rheumatoid arthritis, seronegative spondylarthritis and
osteoarthritis. Clin Rheumatol. 17:318–324. 1998.PubMed/NCBI View Article : Google Scholar
|
|
54
|
Vincenti MP and Brinckerhoff CE: Early
response genes induced in chondrocytes stimulated with the
inflammatory cytokine interleukin-1beta. Arthritis Res. 3:381–388.
2001.PubMed/NCBI View
Article : Google Scholar
|
|
55
|
Sommaggio R, Pérez-Cruz M, Brokaw JL,
Máñez R and Costa C: Inhibition of complement component C5 protects
porcine chondrocytes from xenogeneic rejection. Osteoarthritis
Cartilage. 21:1958–1967. 2013.PubMed/NCBI View Article : Google Scholar
|
|
56
|
Wang Q, Rozelle AL, Lepus CM, Scanzello
CR, Song JJ, Larsen DM, Crish JF, Bebek G, Ritter SY, Lindstrom TM,
et al: Identification of a central role for complement in
osteoarthritis. Nat Med. 17:1674–1679. 2011.PubMed/NCBI View Article : Google Scholar
|
|
57
|
Silawal S, Triebel J, Bertsch T and
Schulze-Tanzil G: Osteoarthritis and the complement cascade. Clin
Med Insights Arthritis Musculoskelet Disord: Jan 3, 2018 (Epub
ahead of print). doi: 10.1177/1179544117751430.
|