Introduction
Liver cancer was the sixth most commonly diagnosed
cancer type and the fourth leading cause of cancer-associated death
worldwide in 2018. Annually, ~841,000 new cases of liver cancer are
diagnosed and 782,000 deaths are recorded (1). In China, liver cancer is the most
commonly diagnosed cancer and the leading cause of
cancer-associated death in males below the age of 60 years
(2).
Hepatocellular carcinoma (HCC) accounts for 75-85%
of primary liver cancer cases. Despite enormous progress in medical
technologies such as surgical resection, liver transplantation,
radiation and chemotherapy in recent decades, the 5-year overall
survival rate for HCC remains <30% (3). Therefore, detailed mechanistic
information on the tumorigenesis and progression HCC is
increasingly required in order to develop more effective
therapeutic strategies.
The identification of abnormally expressed genes
between normal liver tissues and HCC tissues is a viable strategy
for investigating the mechanisms of HCC tumorigenesis and
progression. Furthermore, such differentially expressed genes
(DEGs) may serve as prognostic markers for HCC. The National Center
for Biotechnology Information (NCBI) Gene Expression Omnibus (GEO,
http://www.ncbi.nlm.gov/geo/) is a free
public repository for high-throughput gene expression data and
offers submission, storage and retrieval of microarray,
next-generation sequencing and other forms of functional genomic
datasets (4-6).
The Cancer Genome Atlas (TCGA; http://cancergenome.nih.gov/) provides both clinical
and molecular data on >11,000 samples across 33 different tumor
types (7). A particular advantage
of the GEO and TCGA is that the data therein are collected from
different independent researchers and may be integrated and
applied, allowing for highly robust analyses.
The most fundamental characteristic of cancer cells
is their sustained continuous proliferation, which is due to
dysregulation of the cell cycle. Normal cells carefully control the
release of growth-promoting signals and subtly regulate the
progression of the cell cycle. However, cancer cells exhibit
disrupted homeostasis, resulting in malignant proliferation, which
induces the loss of normal tissue architecture and function
(8).
RNA metabolism (including RNA maturation,
degradation and turnover and quality control), as a mediator of
regulation, is required for a wide variety of biological processes.
This notably includes cell proliferation, where actively
proliferating cells must double their macromolecular contents and
divide into two daughter cells, necessitating an increase in the
biosynthesis of RNA and other molecules. However, despite their
functional importance, the metabolism of RNA and the cell cycle
receive less research attention than genomics and functional
genomics (9). Therefore,
information on the genes involved in the metabolism of RNA and the
cell cycle, and specifically their involvement in HCC, is urgently
required.
In the present study, DEGs were initially screened
using multiple GEO microarrays and the TCGA dataset. Subsequently,
enrichment analysis and protein-protein interaction (PPI) network
analysis were performed. Accordingly, the amplification, increased
expression and prognostic value of several central node genes were
identified.
Materials and methods
Data sources
The data of the gene expression levels and DNA copy
numbers between HCC and control samples were obtained from the NCBI
GEO and TCGA datasets. The GEO microarray accession numbers were
GSE46408, GSE50579 and GSE74656. All included datasets met the
following criteria: i) They employed human liver tissue samples;
ii) they contained case-control groups; and iii) they contained at
least ten samples. The platform for GSE46408 was the Agilent-014850
Whole Human Genome Microarray 4x44K G4112F (Human 1A Oligo Chip
V2;Welgene Biotech Co, Ltd.) and the samples comprised six pairs of
HCC and their corresponding non-tumor liver parenchyma tissues. The
platform for GSE50579 was the Agilent-028004 SurePrint G3 Human GE
8x60K Microarray (Agilent Technologies 2100 Bioanalyzer; Agilent
Technologies Deutchland GmbH) and the samples comprised seven
normal liver tissues and 61 HCC tissues. The platform for GSE74656
was the GeneChip® PrimeView™ Human Gene
Expression Array (with External spike-in RNAs), which contained
five non-tumor HCC tissues. Furthermore, the data for 53 normal
liver tissues and 351 HCC tissues were obtained from TCGA for
analysis. Only upregulated genes at the RNA level with a
fold-change of >2 and P<0.05 were considered.
Dataset analysis
Functional enrichment analysis of common DEGs was
performed using the Metascape dataset (http://metascape.org/gp/index.html#/main/step1)
according to methods described previously (10). A PPI network was constructed using
the Search Tool for the Retrieval of Interacting Genes/proteins
(STRING) online database (http://string-bd.org). The prognostic value of mRNA
for HCC was assessed using the public online tool Kaplan-Meier
Plotter (www.kmplot.com) according to methods
described previously (11). The
gene mRNA heatmap and DNA amplification numbers for small nuclear
ribonucleoprotein polypeptide E (SNRPE), small nuclear
ribonucleoprotein polypeptide B and B1 (SNRPB), BOP1 ribosomal
biogenesis factor (BOP1), nucleoporin 37 (NUP37), Rac GTPase
activating protein 1 (RACGAP1), CAP-Gly domain containing linker
protein 1 (CLIP1), microtubule associated protein RP/EB family
member 1 (MAPRE1), kinesin family member 20A (KIF20A), kinesin
family member 2A (KIF2A), minichromosome maintenance 10 replication
initiation factor (MCM10), ubiquitin conjugating enzyme E2 C
(UBE2C) and hyaluronan mediated motility receptor (HMMR) were
obtained from cBioPortal (http://www.cbioportal.org/).
Overall survival and progression-free survival
curves were plotted by the Kaplan-Meier method with Kaplan-Meier
Plotter (www.kmplot.com) using a Cox regression
model and compared using the log-rank test, and the median
expression level was used as the cut-off to stratify the patients
into high and low expression groups.
Results
DEGs in the GSE50579, GSE74656,
GSE46408 and TCGA datasets
Venn diagram was used to analyze the upregulated
genes between HCC and normal controls from different studies. Since
somatic copy number alterations are associated with cancer and have
been suggested as a specific therapeutic target (12), upregulated genes whose DNA copy
numbers are increased in HCC were screened. The downregulated genes
were ignored, as our group intends to conduct further studies to
investigate whether targeting these upregulated genes may be
applied to HCC therapy. According to the above-mentioned
principles, a total of 2,553 upregulated genes were identified from
GSE50579, GSE74656, GSE46408 and TCGA along with amplified genes in
TCGA (Fig. 1A).
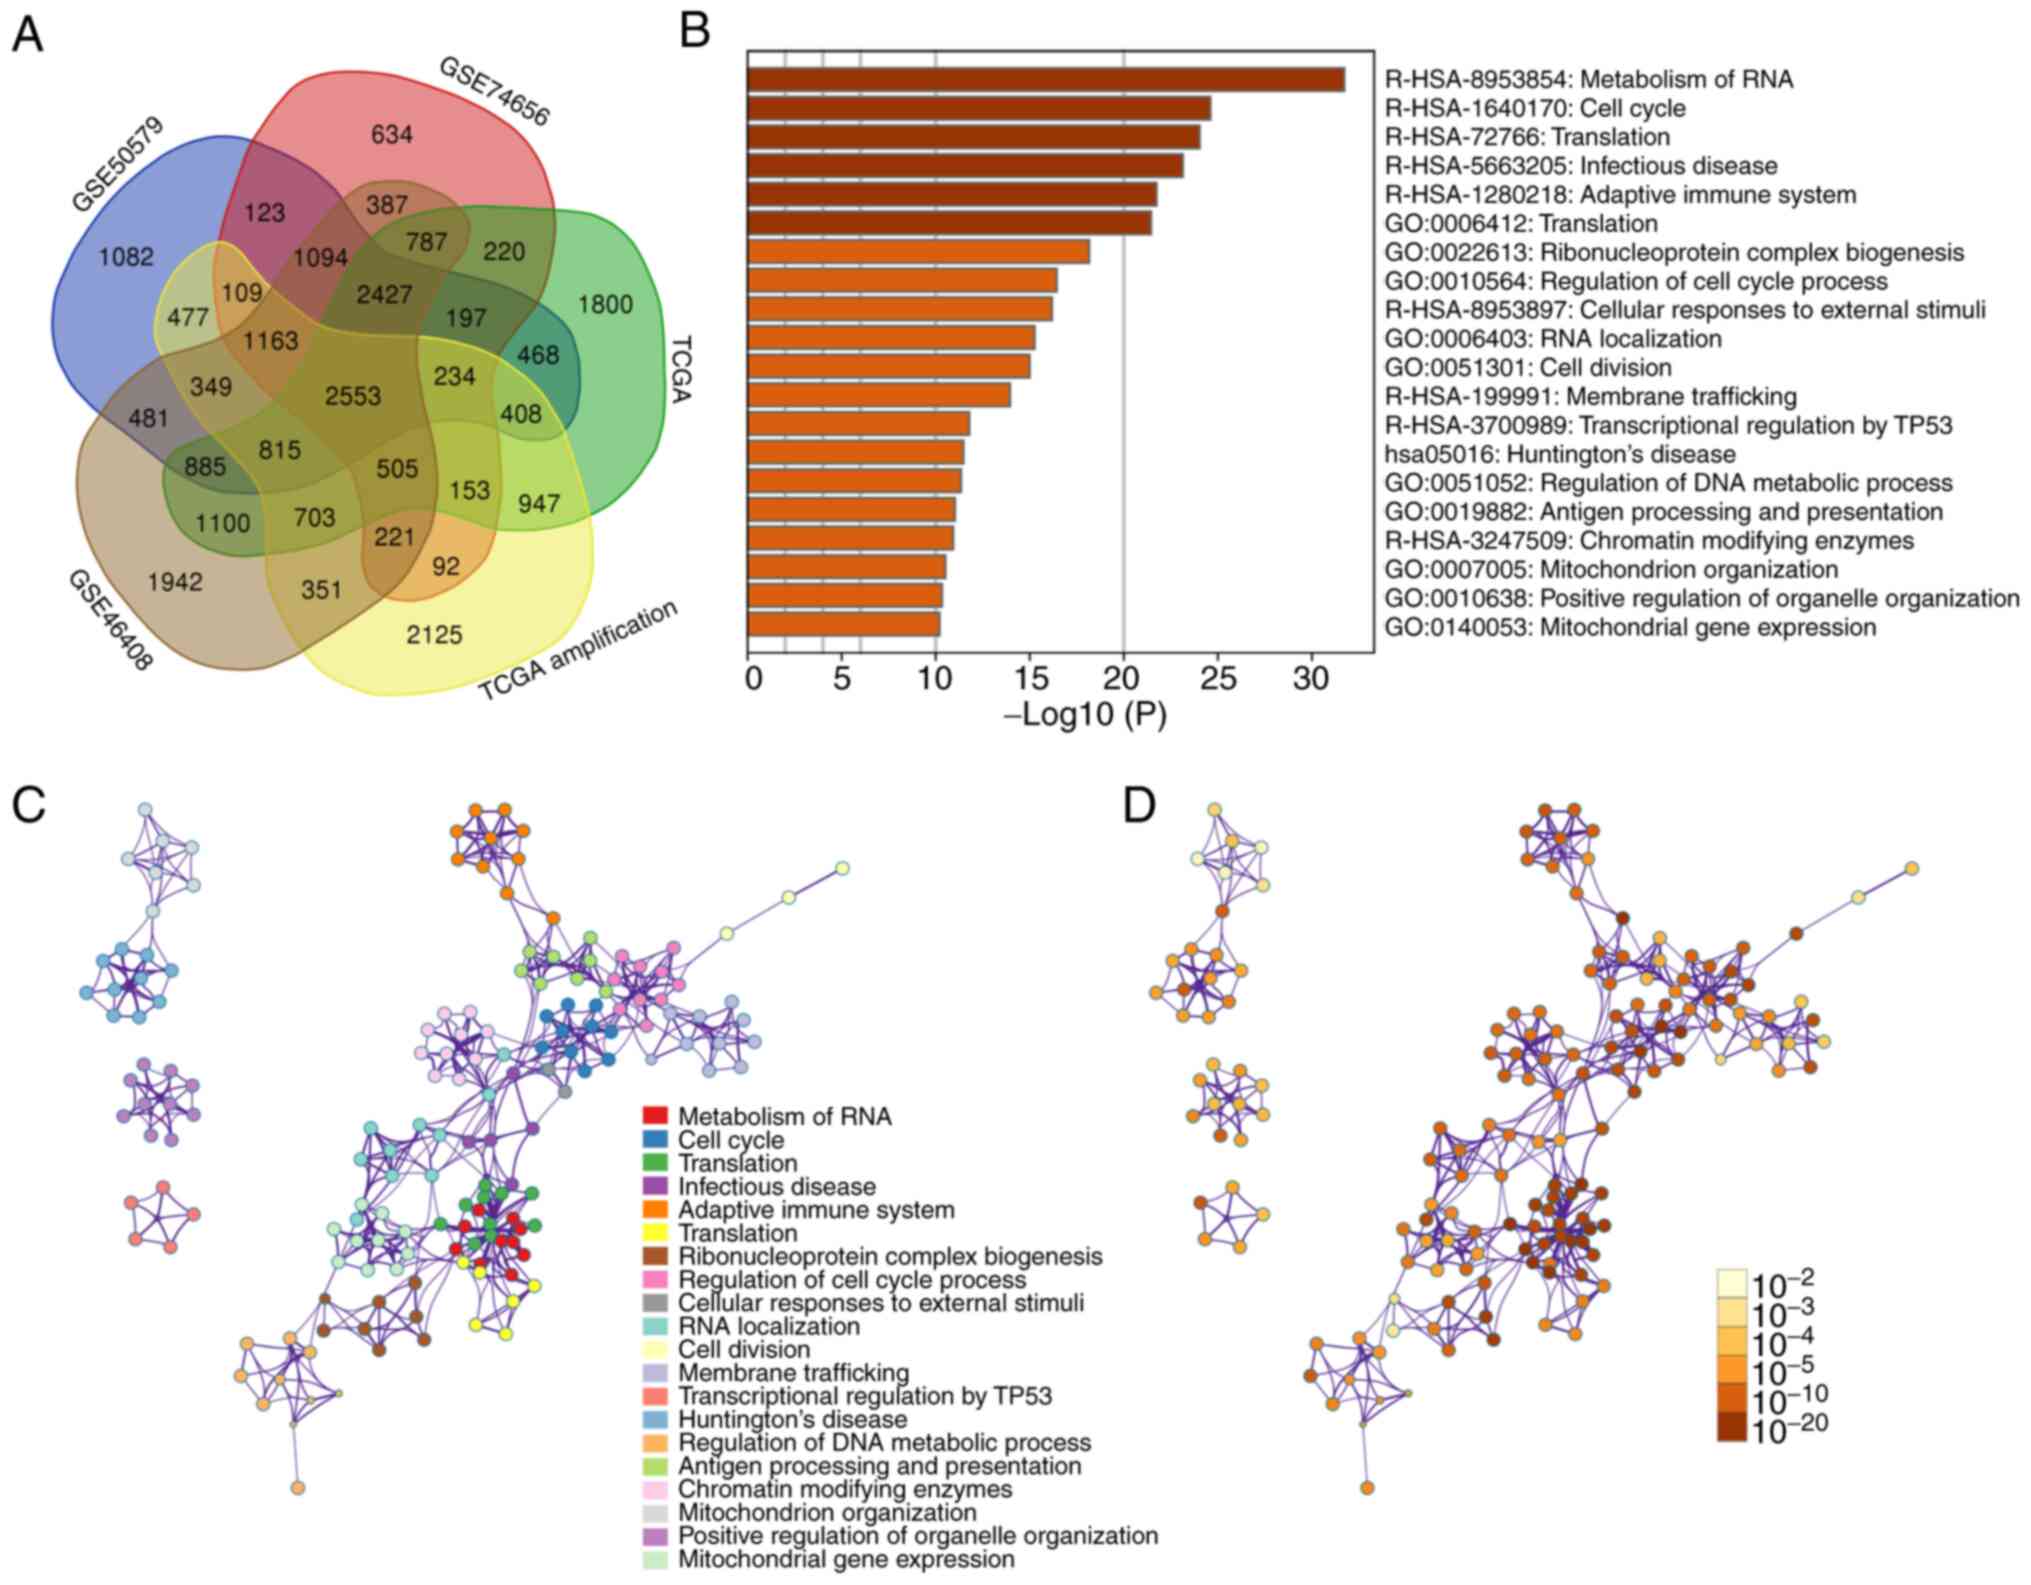 | Figure 1DEGs from the GSE50579, GSE74656,
GSE46408 and TCGA datasets. (A) Venn diagram presenting the
upregulated DEGs, 2,553 of which were shared between the different
datasets. (B) Metascape enrichment analysis for the DEGs. (C)
Enrichment networks of DEGs, represented by cluster memberships,
were obtained using the Metascape dataset; (D) enrichment networks
represented by statistical P-values obtained using the Metascape
dataset. TCGA, The Cancer Genome Atlas; GO, gene ontology; Hsa,
Homo sapiens; DEGs, differentially expressed genes. |
Subsequently, functional enrichment analysis of
these upregulated genes was performed using Metascape. As indicated
in Fig. 1B, metabolism of RNA and
the cell cycle were the most commonly enriched terms. Enrichment
networks were also established by representing each enriched term
as a node and a neighboring node with Kappa similarities of
>0.3. Nodes are colored to represent their cluster memberships
(Fig. 1C) or statistical P-values
(Fig. 1D).
Identification of key candidate genes
for diagnosis of HCC
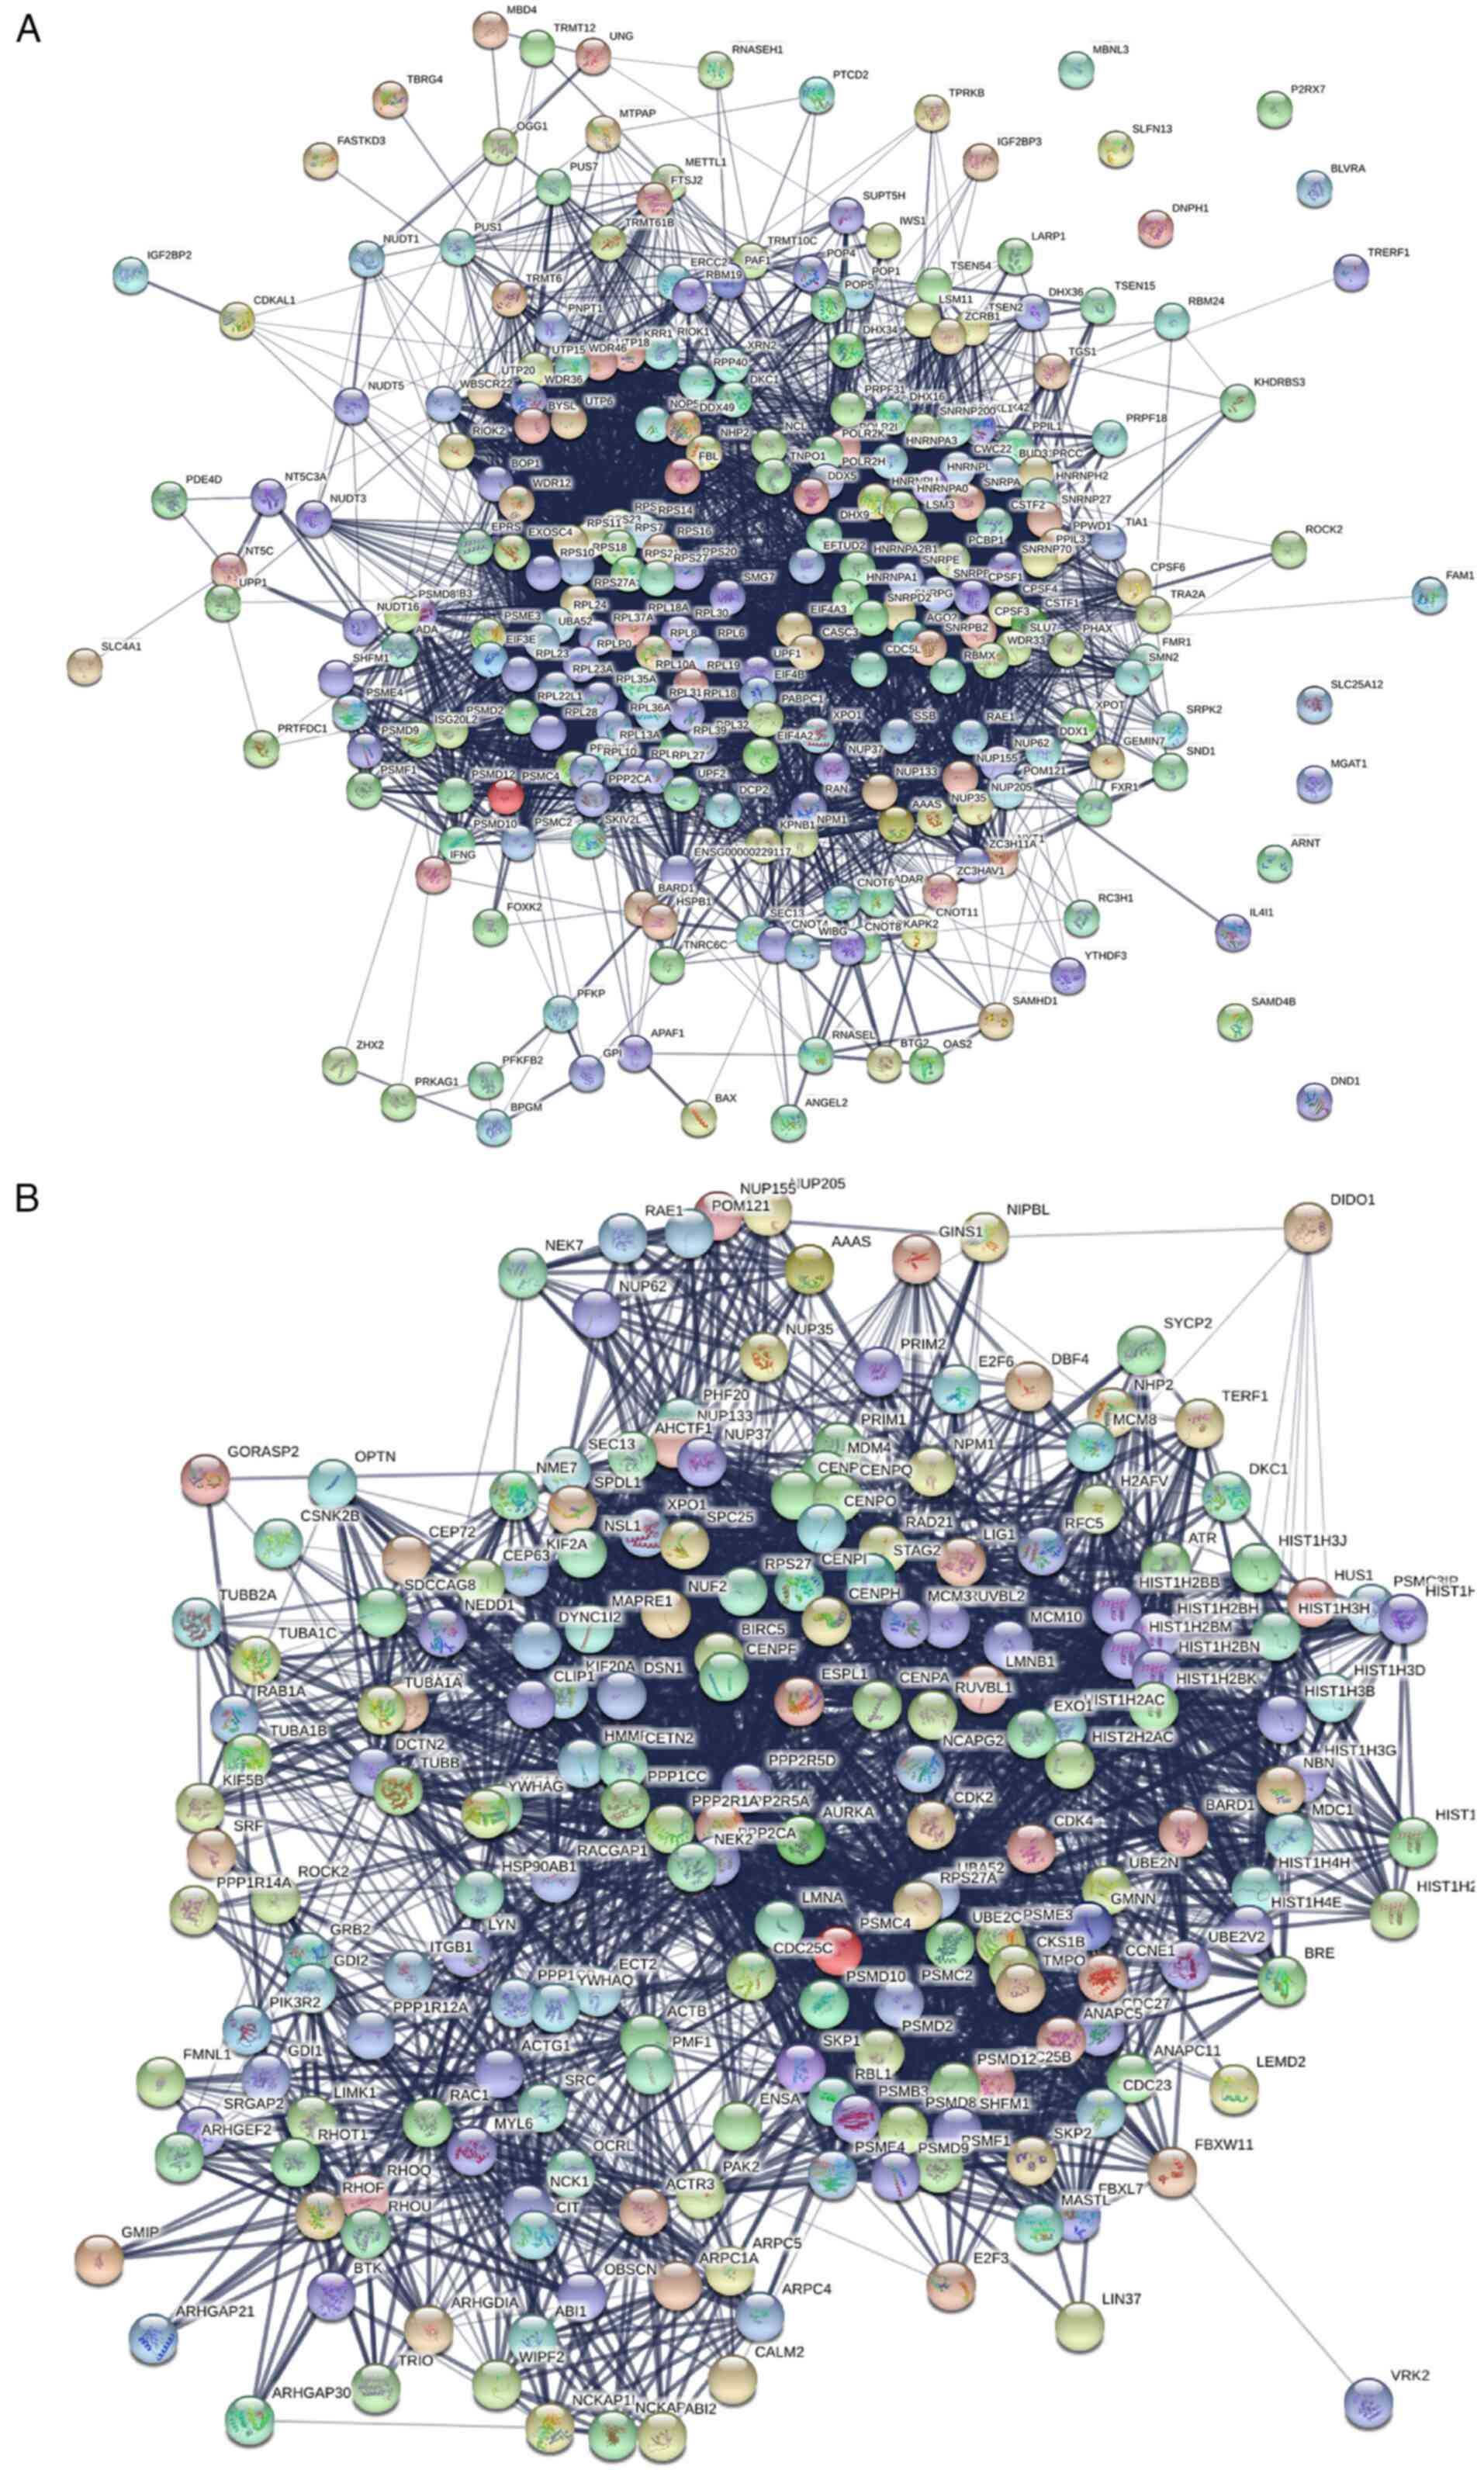
The genes enriched in the metabolism of RNA and the
cell cycle were used to perform a PPI network analysis using the
STRING database (Fig. 2). In
addition, the central node genes were identified. For the
metabolism of RNA, the genes with >50 connections/interactions
were further studied. The 22 most connected genes were ribosomal
protein S 5, RPS28, RPS19, RPS10, RPS13, RPS20, ribosomal protein
L27, UPF1 RNA helicase and ATPase, ribosomal protein lateral stalk
subunit P0, RPL28, cleavage and polyadenylation specific factor 1,
RPL18, SNRPE, SNRPB, ubiquitin A-52 residue ribosomal protein
fusion product 1 (UBA52), protein phosphatase 2 catalytic subunit
alpha (PPP2CA), RPL30, ribosomal protein L26 like 1, ribosomal
protein S18, BOP1, RPL23 and RNA polymerase II, I and III subunit H
(Table I). Furthermore, univariate
Cox regression was performed to establish whether the above genes
may serve as predictors for overall survival and progression-free
survival using data from the Kaplan-Meier Plotter dataset, and
sources for the database include GEO, EGA and TCGA. The median of
mRNA level in the tumor samples was used as a cut-off to stratify
the patients into high and low expression groups. As presented in
Table I, only SNRPE, SNRPB and BOP1
were associated with the overall survival of patients with HCC.
Specifically, patients with HCC and high mRNA levels for SNRPE,
SNRPB or BOP1 had poorer overall survival than those with low
levels of SNRPE or BOP1 (Table I;
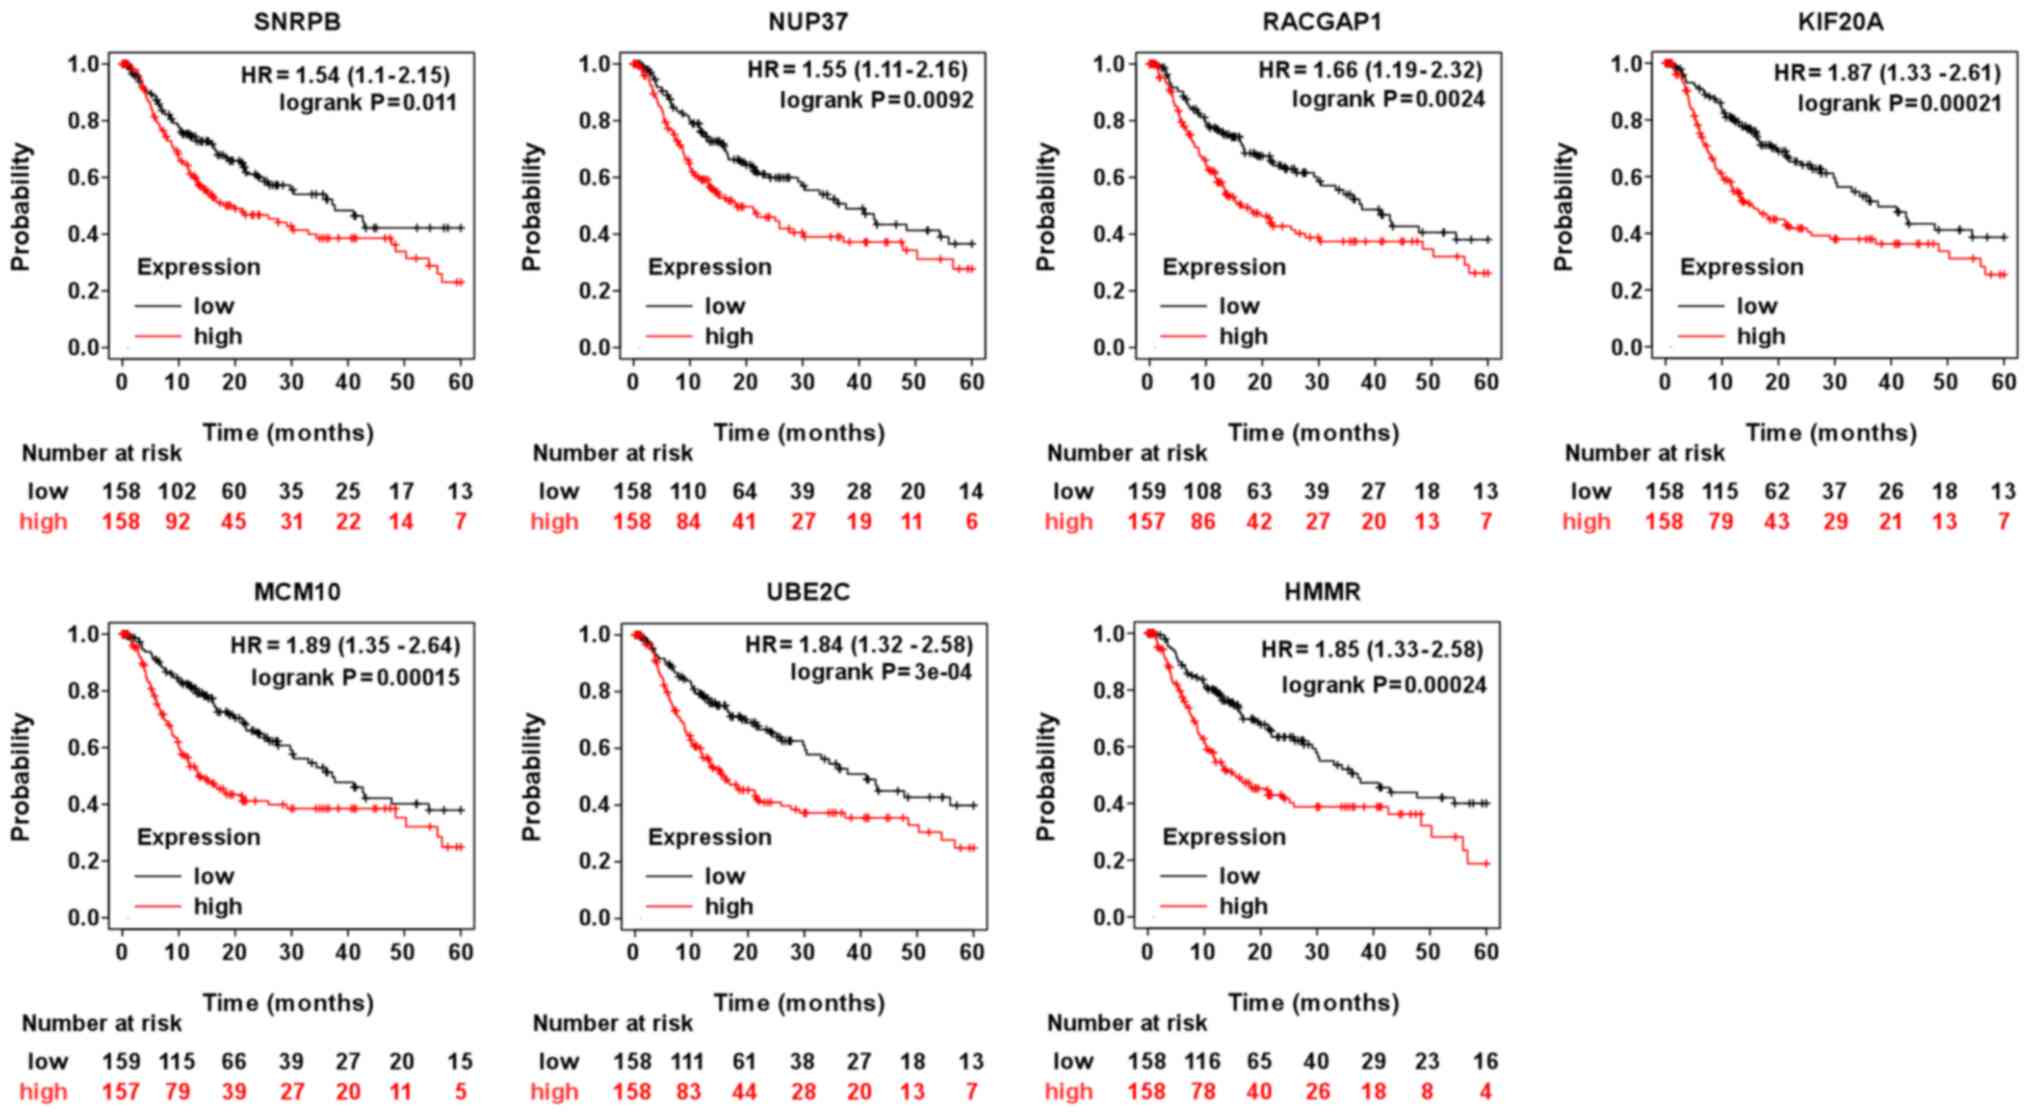
Fig. 3). However, only SNRPB
appeared to be associated with progression-free survival of
patients with HCC (Fig. 4).
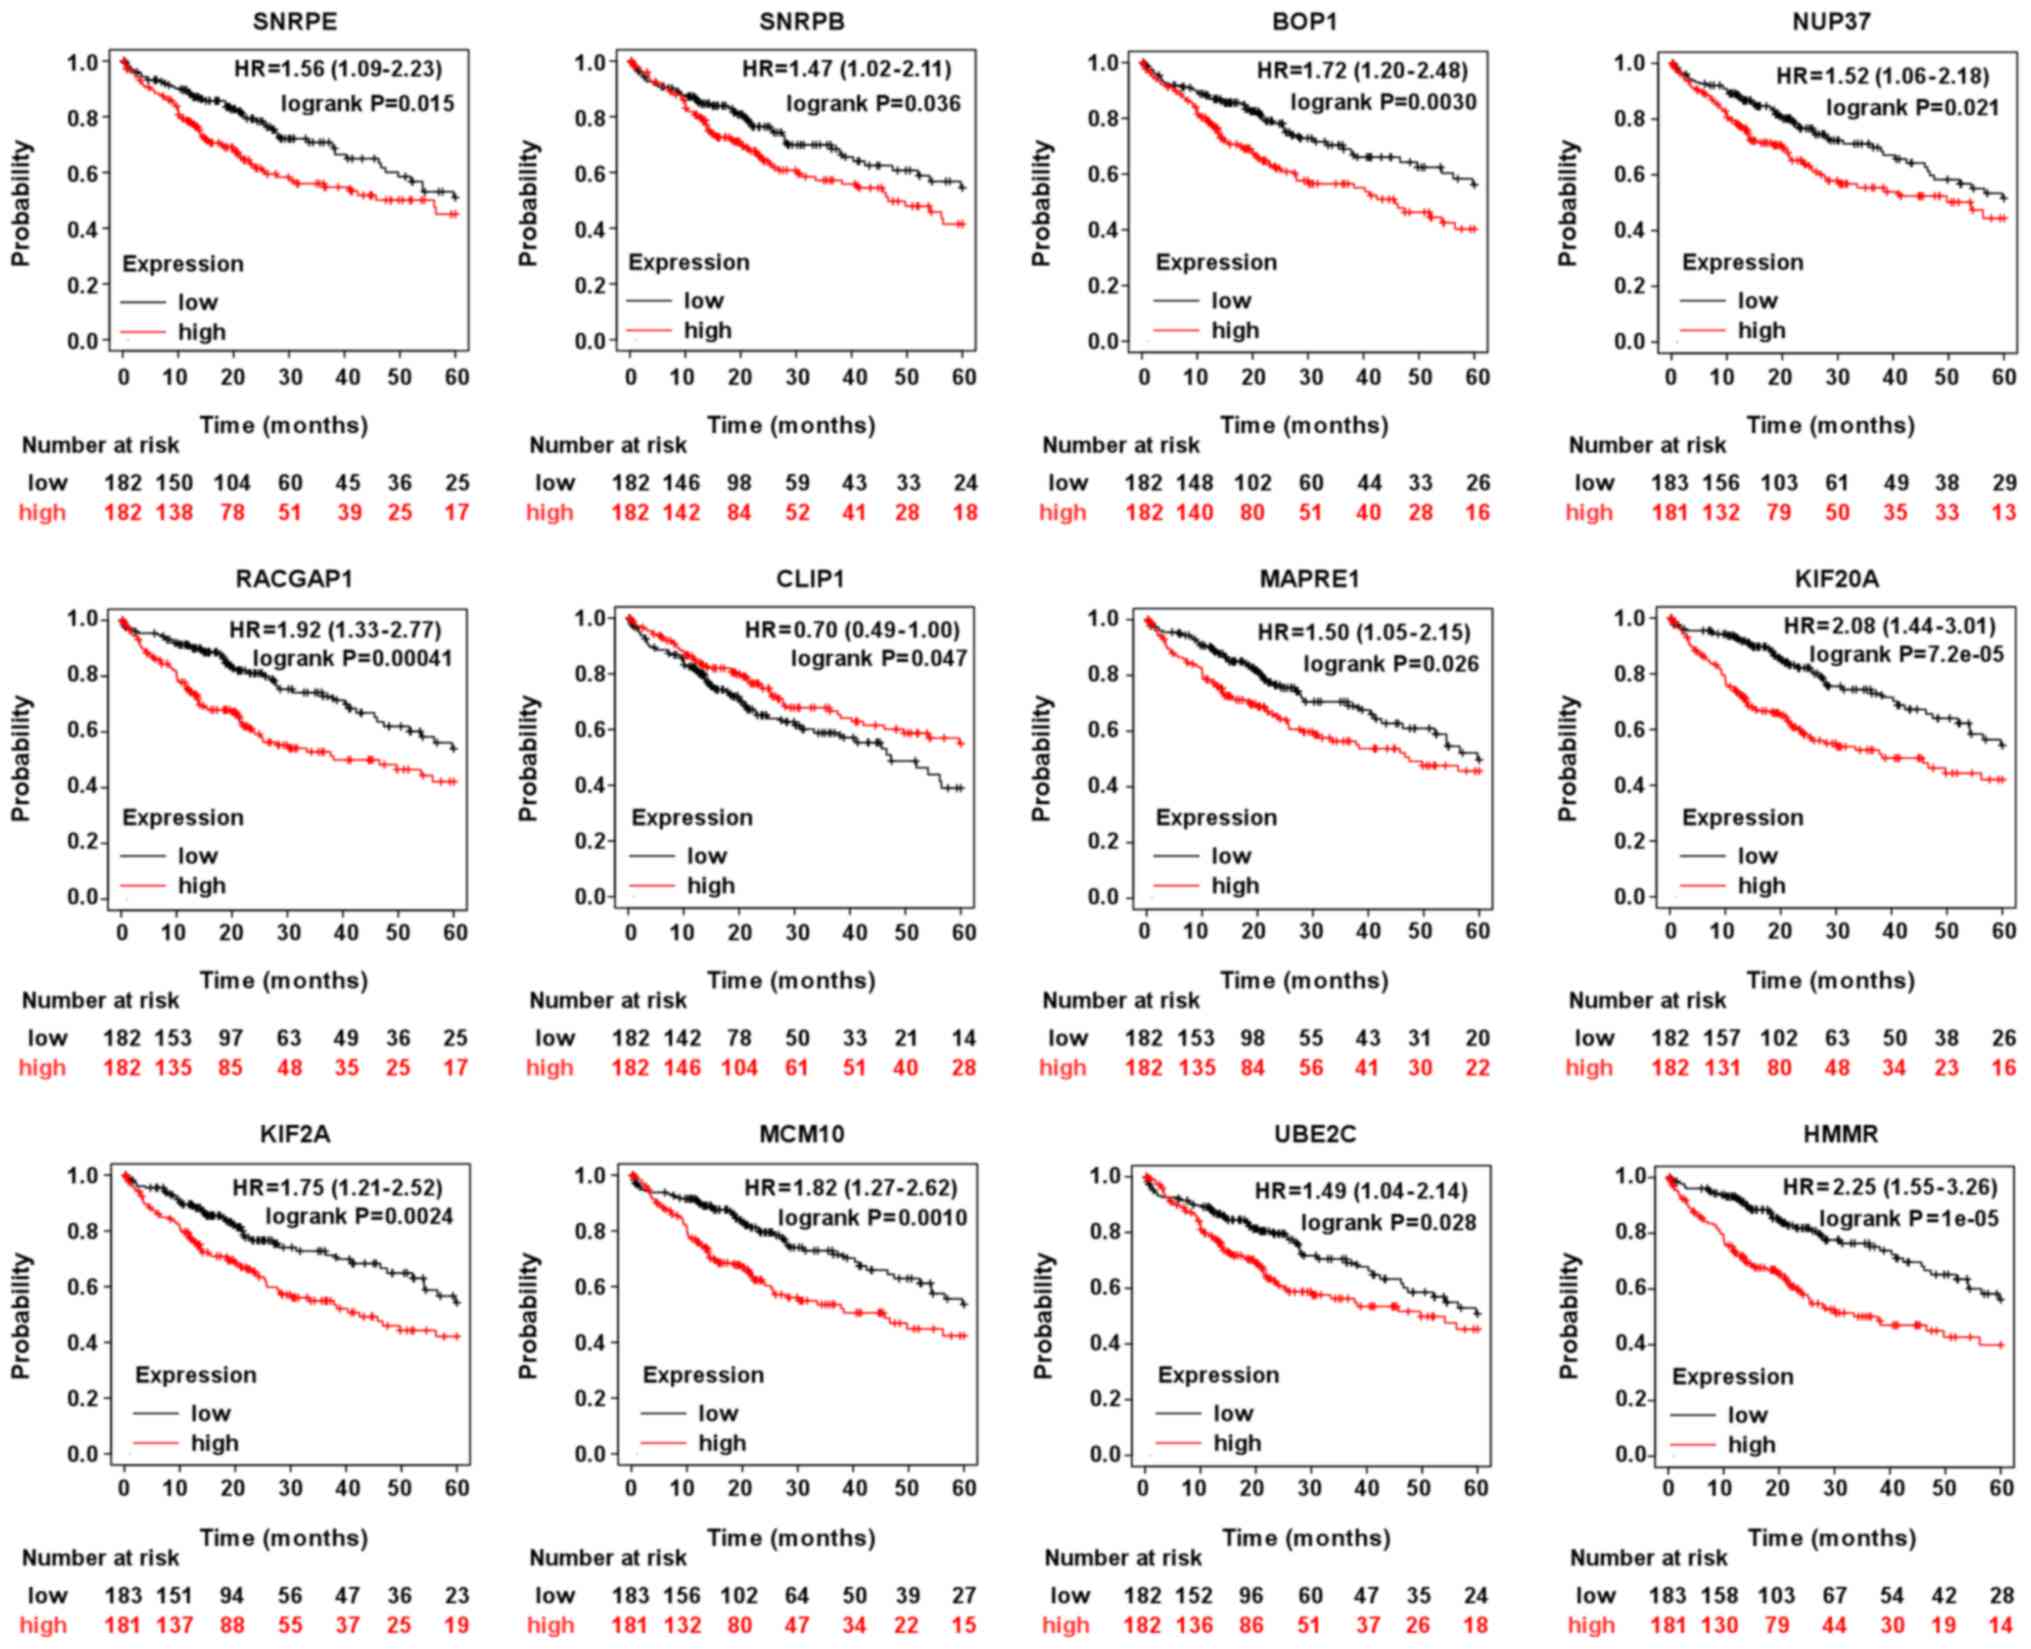 | Figure 3Prognostic value of the indicated mRNA
levels on the overall survival of patients with hepatocellular
carcinoma. HR, hazard ratio (provided with 95% CI). SNRPE, small
nuclear ribonucleoprotein polypeptide E; BOP1, BOP1 ribosomal
biogenesis factor; RACGAP1, Rac GTPase activating protein 1;
MAPRE1, microtubule associated protein RP/EB family member 1; KIF;
kinesin family member; MCM10, minichromosome maintenance 10
replication initiation factor; HMMR, hyaluronan mediated motility
receptor; UBE2C, ubiquitin conjugating enzyme E2 C; CLIP1, CAP-Gly
domain containing linker protein 1; SNRPB, small nuclear
ribonucleoprotein polypeptide B and B1; NUP37; nucleoporin 37. |
 | Table IPrognostic value of mRNA levels of the
key genes from PPI (enriched in metabolism of RNA) for overall
survival of patients with hepatocellular carcinoma using the
Kaplan-Meier Plotter dataset. |
Table I
Prognostic value of mRNA levels of the
key genes from PPI (enriched in metabolism of RNA) for overall
survival of patients with hepatocellular carcinoma using the
Kaplan-Meier Plotter dataset.
| Factor | Numbers of
international proteins | HR (95% CI) | P value |
|---|
| RPS5 | 77 | 1.28
(0.89-1.83) | 0.18 |
| RPS28 | 77 | 0.95
(0.66-1.36) | 0.77 |
| RPS19 | 76 | 1.02
(0.71-1.46) | 0.91 |
| RPS10 | 76 | 1.01
(0.71-1.44) | 0.96 |
| RPS13 | 67 | 1.30
(0.91-1.86) | 0.15 |
| RPS20 | 65 | 1.12
(0.78-1.60) | 0.54 |
| RPL27 | 60 | 1.20
(0.84-1.72) | 0.31 |
| UPF1 | 59 | 0.80
(0.56-1.14) | 0.21 |
| RPLP0 | 58 | 1.14
(0.79-1.62) | 0.49 |
| RPL28 | 58 | 0.88
(0.61-1.25) | 0.47 |
| CPSF1 | 58 | 1.26
(0.88-1.80) | 0.21 |
| RPL18 | 57 | 1.08
(0.76-1.54) | 0.67 |
| SNRPE | 54 | 1.56
(1.09-2.23) | 0.015 |
| SNRPB | 54 | 1.47
(1.02-2.11) | 0.036 |
| UBA52 | 53 | 1.05
(0.74-1.50) | 0.78 |
| PPP2CA | 53 | 0.99
(0.69-1.41) | 0.94 |
| RPL30 | 52 | 0.89
(0.62-1.27) | 0.53 |
| RPL26L1 | 52 | 1.12
(0.78-1.60) | 0.53 |
| RPS18 | 52 | 1.08
(0.75-1.54) | 0.68 |
| BOP1 | 52 | 1.72
(1.20-2.48) | 0.0030 |
| RPL23 | 51 | 0.84
(0.59-1.20) | 0.34 |
| POLR2H | 51 | 1.41
(0.98-2.02) | 0.06 |
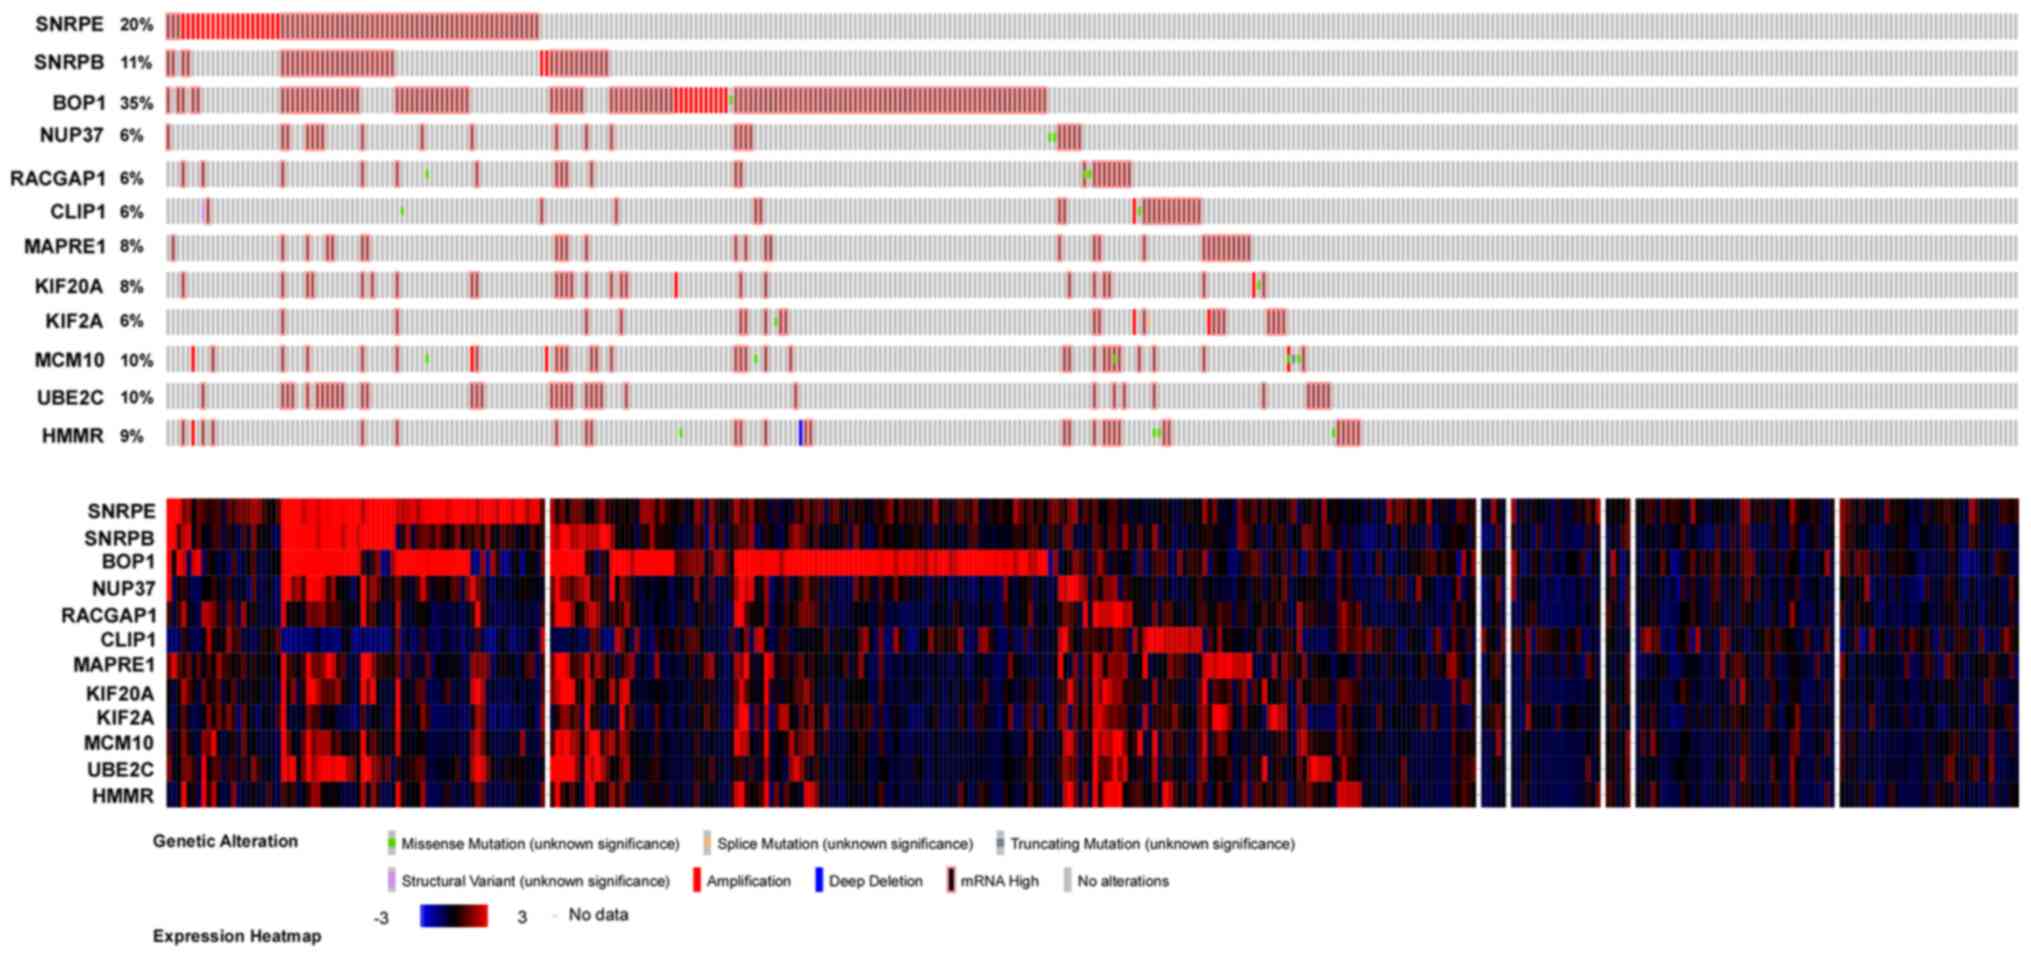
Next, the expression profiles of SNRPE, SNRPB or
BOP1 and their DNA alteration were analyzed using the cBioPortal
dataset (Fig. 5). The results
showed that their DNA are both amplified.
In terms of the cell cycle, the genes
with >50 connections/interactions were further studied, and the
top 23 central node genes were subjected to univariate Cox
regression analysis to determine their predictive value for overall
survival
These were PPP2CA, UBA52, MCM3, protein phosphatase
2 regulatory subunit B'delta, NUP37, dynein cytoplasmic 1
intermediate chain 2, RACGAP1, H2B clustered histone 15, cell
division cycle 27, CLIP1, H2B clustered histone 3, exportin 1,
actin gamma 1, histone cluster 1, H2bm, MAPRE1, proteasome 20S
subunit beta 3, KIF20A, KIF2A, MCM10, DSN1 component of MIS12
kinetochore complex, UBE2C and HMMR (Table II). The analysis indicated that
NUP37, RACGAP1, CLIP1, MAPRE1, KIF20A, KIF2A, MCM10, UBE2C and HMMR
might serve as the prognostic markers for overall survival
(Table II; Fig. 3). While, NUP37, RACGAP1, KIF20A,
MCM10, UBE2C and HMMR also were closely correlated with
progression-free survival for patients with HCC, suggesting these
genes might also serve as prognostic markers for progression-free
survival for patients with HCC (Fig.
4). As presented in Fig. 5, the
expression profile of MCM3, RACGAP1, MAPRE1, KIF20A, KIF2A, MCM10
and HMMR and DNA alteration of these genes were analyzed using the
cBioPortal dataset. The results showed that their DNA are all
amplified.
| Table IIPrognostic value of mRNA levels of
the key genes from the PPI (enriched in cell cycle) for overall
survival of patients with hepatocellular carcinoma using the
Kaplan-Meier Plotter dataset. |
Table II
Prognostic value of mRNA levels of
the key genes from the PPI (enriched in cell cycle) for overall
survival of patients with hepatocellular carcinoma using the
Kaplan-Meier Plotter dataset.
| Factor | Numbers of
international proteins | HR (95% CI) | P-value |
|---|
| PPP2CA | 60 | 0.99
(0.69-1.41) | 0.94 |
| UBA52 | 56 | 1.05
(0.74-1.50) | 0.78 |
| MCM3 | 46 | 1.58
(1.10-2.26) | 0.013 |
| PPP2R5D | 45 | 1.10
(0.77-1.57) | 0.60 |
| NUP37 | 43 | 1.52
(1.06-2.18) | 0.021 |
| DYNC1I2 | 43 | 1.12
(0.78-1.60) | 0.54 |
| RACGAP1 | 41 | 1.92
(1.33-2.77) | 0.00041 |
| HIST1H2BN | 39 | 1.08
(0.76-1.54) | 0.67 |
| CDC27 | 38 | 1.25
(0.88-1.80) | 0.22 |
| CLIP1 | 38 | 0.70
(0.49-1.00) | 0.047 |
| HIST1H2BB | 38 | 1.26
(0.77-2.06) | 0.35 |
| XPO1 | 38 | 1.29
(0.90-1.85) | 0.16 |
| HIST1H2BH | 37 | 1.40
(0.97-2.00) | 0.068 |
| ACTG1 | 37 | 1.40
(0.97-2.01) | 0.067 |
| HIST1H2BM | 36 | 0.86
(0.53-1.40) | 0.55 |
| MAPRE1 | 35 | 1.50
(1.05-2.15) | 0.026 |
| PSMB3 | 34 | 0.84
(0.59-1.21) | 0.35 |
| KIF20A | 34 | 2.08
(1.44-3.01) |
7.20x10⁻⁵ |
| KIF2A | 34 | 1.75
(1.21-2.52) | 0.0024 |
| MCM10 | 33 | 1.82
(1.27-2.62) | 0.0010 |
| DSN1 | 32 | 1.20
(0.84-1.71) | 0.32 |
| UBE2C | 32 | 1.49
(1.04-2.14) | 0.028 |
| HMMR | 32 | 2.25
(1.55-3.26) |
1.00x10⁻⁵ |
Discussion
The tumorigenesis and progression of HCC involve a
multistep process during which cells undergo complex changes,
including accumulating mutations, which lead to activation of
oncogenes and loss of tumor suppressor genes. These genes are
implicated in multiple pathways that may regulate different steps
of carcinogenesis. For instance, certain steps are essential for
driving cell transformation, while others have indispensable roles
in cancer progression or in the acquisition of characteristics
required for metastasis (13).
Therefore, identifying such genes is crucial for cancer therapy.
However, HCC cells are morphologically and genetically
heterogeneous. This heterogeneity partly accounts for the
complexity of HCC (14). Therefore,
in view of this complexity, it is important to integrate data from
different independent studies in order to perform robust
analyses.
Accordingly, in the present study, DEGs were
identified from GEO and TCGA datasets. Functional enrichment
analysis revealed that these genes were mainly associated with RNA
metabolism and the cell cycle.
A portion of the genome is known to be transcribed
into RNAs, whose biological functions are still being determined.
In view of the importance of RNAs, there is a significant turnover
of RNAs associated with cell maintenance, repair and modulation,
even in quiescent cells. Proliferating cells must upregulate the
biosynthesis of RNA and DNA to support cell division (9,15-18).
Sustained chronic proliferation is the most fundamental
characteristic of cancer cells (8).
The proliferation of cancer cells necessitates the upregulation of
RNA biosynthesis. In line with this, the present study demonstrated
that the DEGs were mainly involved in RNA metabolism. Furthermore,
it is widely accepted that the sustained proliferation of cancer
cells is realized through deregulation of the cell cycle (19). Accordingly, in the present study, it
was indicated that the upregulated genes were also implicated in
the cell cycle.
PPI network analysis offers more detailed
information on the connections among the upregulated genes in HCC
samples. Three genes associated with the overall survival of HCC
patients, i.e., SNRPE, SNRPB and BOP1, which are involved in the
metabolism of RNA, were screened. SNRPE and SNRPB are a central
component of U small nuclear ribonucleoproteins, which are the main
components of pre-mRNA processing spliceosomes. It has been
reported that SNRPE promotes the proliferation of HCC cells
(20). BOP1 is a nucleolar protein
that is involved in ribosomal RNA processing and ribosome assembly.
It has been reported that it promotes epithelial-to-mesenchymal
transition (21).
In a similar manner, seven genes, i.e., NUP37,
RACGAP1, CLIP1, MAPRE1, KIF20A, KIF2A, MCM10, UBE2C and HMMR, which
regulate the cell cycle in HCC, were screened. Their high
expression indicated poor prognosis for patients with HCC. MCM10
belongs to the MCM protein, which is involved in the initiation of
eukaryotic genome replication. Their deregulation is observed in
multiple cancer types, including prostate cancer (22), HCC (23-25)
and renal cell carcinoma (26).
RACGAP1 is a GTPase-activating protein that is a component of the
central spindlin complex. It is able to bind to activated forms of
Rho GTPases and stimulates GTP hydrolysis to induce negative
regulation of Rho-mediated signals. It has been reported that high
RACGAP1 is correlated with a high rate of post-resection recurrent
HCC and may be used as a potential molecular target in the design
of therapeutic methods for HCC (27). Furthermore, RACGAP1 participates in
the progression of multiple cancer types (28-31).
MAPRE1 belongs to the RP/EB family and was
organically identified by its binding with the APC protein. It is
involved in the modulation of microtubule structures and chromosome
stability. Its deregulation is associated with various cancer
types, including colorectal cancer (32), gastric cancer (33), acute lymphoblastic leukemia
(34) and HCC (35).
KIF2A and KIF20A belong to the kinesin family, which
is a plus end-directed motor required for normal mitotic
progression. Their deregulation is implicated in multiple cancer
types (36-40).
HMMR forms a complex with BRCA1 and BRCA2 to
regulate cell motility. It has been documented that HMMR maintains
the stemness and tumorigenicity of glioblastoma stem-like cells
(41). Another study has indicated
that HMMR may be used as a biomarker for neutropenia induced by
chemotherapy in patients with breast cancer (42).
All of these genes are highly interacting/connected
genes, suggesting that they may have important roles in HCC. Since
they regulate RNA metabolism and cell cycle, targeting them as a
cancer therapy would not be specific and would, therefore, be
expected to have severe side effects. However, they are
significantly associated with overall survival for patients with
HCC; therefore, they may serve as prognosis markers for patients
with HCC. As another limitation, only a univariate analysis was
performed to determine the association of these genes with
survival, while multivariate analysis of single genes, or of a
combined gene signature, may have provided an independent
prognostic marker, which might provide more valuable for prognosis
of HCC, and should be provided in a future study.
Acknowledgements
Not applicable.
Funding
Funding: This work was supported by grants from the Science and
Technology Projects Foundation of Guangzhou City (grant nos.
201804010416 and 201904010355) and the Guangzhou Zengcheng District
Science and Technology Innovation Project (grant no. 2021049).
Availability of data and materials
The datasets used and/or analyzed during the present
study are available from the corresponding author on reasonable
request.
Authors' contributions
XHL and ZPF designed the study. FQL, RY, LYY, HS and
HLL completed the data acquisition and analysis. ZPF wrote the
manuscript. All authors have read and approved the final version of
the manuscript. ZPF, XHL, FQL, RY, LYY, HS and HLL confirm the
authenticity of all the raw data.
Ethics approval and consent to
participate
Not applicable.
Patient consent for publication
Not applicable.
Competing interests
The authors declare that they have no competing
interests.
References
|
1
|
Bray F, Ferlay J, Soerjomataram I, Siegel
RL, Torre LA and Jemal A: Global cancer statistics 2018: GLOBOCAN
estimates of incidence and mortality worldwide for 36 cancers in
185 countries. CA Cancer J Clin. 68:394–424. 2018.PubMed/NCBI View Article : Google Scholar
|
|
2
|
Chen W, Zheng R, Baade PD, Zhang S, Zeng
H, Bray F, Jemal A, Yu XQ and He J: Cancer statistics in China,
2015. CA Cancer J Clin. 66:115–132. 2016.PubMed/NCBI View Article : Google Scholar
|
|
3
|
Han D, Li J, Wang H, Su X, Hou J, Gu Y,
Qian C, Lin Y, Liu X, Huang M, et al: Circular RNA circMTO1 acts as
the sponge of microRNA-9 to suppress hepatocellular carcinoma
progression. Hepatology. 66:1151–1164. 2017.PubMed/NCBI View Article : Google Scholar
|
|
4
|
Barrett T and Edgar R: Mining microarray
data at NCBI's Gene Expression Omnibus (GEO)*. Methods
Mol Biol. 338:175–190. 2006.PubMed/NCBI View Article : Google Scholar
|
|
5
|
Clough E and Barrett T: The Gene
Expression Omnibus Database. Methods Mol Biol. 1418:93–110.
2016.PubMed/NCBI View Article : Google Scholar
|
|
6
|
Edgar R, Domrachev M and Lash AE: Gene
Expression Omnibus: NCBI gene expression and hybridization array
data repository. Nucleic Acids Res. 30:207–210. 2002.PubMed/NCBI View Article : Google Scholar
|
|
7
|
Wei L, Jin Z, Yang S, Xu Y, Zhu Y and Ji
Y: TCGA-assembler 2: Software pipeline for retrieval and processing
of TCGA/CPTAC data. Bioinformatics. 34:1615–1617. 2018.PubMed/NCBI View Article : Google Scholar
|
|
8
|
Hanahan D and Weinberg RA: Hallmarks of
cancer: The next generation. Cell. 144:646–674. 2011.PubMed/NCBI View Article : Google Scholar
|
|
9
|
Lane AN and Fan TW: Regulation of
mammalian nucleotide metabolism and biosynthesis. Nucleic Acids
Res. 43:2466–2485. 2015.PubMed/NCBI View Article : Google Scholar
|
|
10
|
Zhou Y, Zhou B, Pache L, Chang M,
Khodabakhshi AH, Tanaseichuk O, Benner C and Chanda SK: Metascape
provides a biologist-oriented resource for the analysis of
systems-level datasets. Nat Commun. 10(1523)2019.PubMed/NCBI View Article : Google Scholar
|
|
11
|
Győrffy B, Surowiak P, Budczies J and
Lánczky A: Online survival analysis software to assess the
prognostic value of biomarkers using transcriptomic data in
non-small-cell lung cancer. PLoS One. 8(e82241)2013.PubMed/NCBI View Article : Google Scholar
|
|
12
|
Zhou CC, Yang F, Yuan SX, Ma JZ, Liu F,
Yuan JH, Bi FR, Lin KY, Yin JH, Cao GW, et al: Systemic genome
screening identifies the outcome associated focal loss of long
noncoding RNA PRAL in hepatocellular carcinoma. Hepatology.
63:850–863. 2016.PubMed/NCBI View Article : Google Scholar
|
|
13
|
Imbeaud S, Ladeiro Y and Zucman-Rossi J:
Identification of novel oncogenes and tumor suppressors in
hepatocellular carcinoma. Semin Liver Dis. 30:75–86.
2010.PubMed/NCBI View Article : Google Scholar
|
|
14
|
Spangenberg HC, Thimme R and Blum HE:
Targeted therapy for hepatocellular carcinoma. Nat Rev
Gastroenterol Hepatol. 6:423–432. 2009.PubMed/NCBI View Article : Google Scholar
|
|
15
|
Hangauer MJ, Vaughn IW and McManus MT:
Pervasive transcription of the human genome produces thousands of
previously unidentified long intergenic noncoding RNAs. PLoS Genet.
9(e1003569)2013.PubMed/NCBI View Article : Google Scholar
|
|
16
|
Djebali S, Davis CA, Merkel A, Dobin A,
Lassmann T, Mortazavi A, Tanzer A, Lagarde J, Lin W, Schlesinger F,
et al: Landscape of transcription in human cells. Nature.
489:101–108. 2012.PubMed/NCBI View Article : Google Scholar
|
|
17
|
Consortium EP: ENCODE Project Consortium.
An integrated encyclopedia of DNA elements in the human genome.
Nature. 489:57–74. 2012.PubMed/NCBI View Article : Google Scholar
|
|
18
|
Sigoillot FD, Berkowski JA, Sigoillot SM,
Kotsis DH and Guy HI: Cell cycle-dependent regulation of pyrimidine
biosynthesis. J Biol Chem. 278:3403–3409. 2003.PubMed/NCBI View Article : Google Scholar
|
|
19
|
Urrego D, Tomczak AP, Zahed F, Stühmer W
and Pardo LA: Potassium channels in cell cycle and cell
proliferation. Philos Trans R Soc Lond B Biol Sci.
369(20130094)2014.PubMed/NCBI View Article : Google Scholar
|
|
20
|
Jia D, Wei L, Guo W, Zha R, Bao M, Chen Z,
Zhao Y, Ge C, Zhao F, Chen T, et al: Genome-wide copy number
analyses identified novel cancer genes in hepatocellular carcinoma.
Hepatology. 54:1227–1236. 2011.PubMed/NCBI View Article : Google Scholar
|
|
21
|
Chung KY, Cheng IK, Ching AK, Chu JH, Lai
PB and Wong N: Block of proliferation 1 (BOP1) plays an oncogenic
role in hepatocellular carcinoma by promoting
epithelial-to-mesenchymal transition. Hepatology. 54:307–318.
2011.PubMed/NCBI View Article : Google Scholar
|
|
22
|
Cui F, Hu J, Ning S, Tan J and Tang H:
Overexpression of MCM10 promotes cell proliferation and predicts
poor prognosis in prostate cancer. Prostate. 78:1299–1310.
2018.PubMed/NCBI View Article : Google Scholar
|
|
23
|
Liu Z, Li J, Chen J, Shan Q, Dai H, Xie H,
Zhou L, Xu X and Zheng S: MCM family in HCC: MCM6 indicates adverse
tumor features and poor outcomes and promotes S/G2 cell cycle
progression. BMC Cancer. 18(200)2018.PubMed/NCBI View Article : Google Scholar
|
|
24
|
Zhuang L, Yang Z and Meng Z: Upregulation
of BUB1B, CCNB1, CDC7, CDC20, and MCM3 in tumor tissues predicted
worse overall survival and disease-free survival in hepatocellular
carcinoma patients. BioMed Res Int. 2018(7897346)2018.PubMed/NCBI View Article : Google Scholar
|
|
25
|
Yang Q, Xie B, Tang H, Meng W, Jia C,
Zhang X, Zhang Y, Zhang J, Li H and Fu B: Minichromosome
maintenance 3 promotes hepatocellular carcinoma radioresistance by
activating the NF-κB pathway. J Exp Clin Cancer Res.
38(263)2019.PubMed/NCBI View Article : Google Scholar
|
|
26
|
Gao Z, Man X, Li Z, Bi J, Liu X, Li Z, Li
J, Zhang Z and Kong C: PLK1 promotes proliferation and suppresses
apoptosis of renal cell carcinoma cells by phosphorylating MCM3.
Cancer Gene Ther. 27:412–423. 2020.PubMed/NCBI View Article : Google Scholar
|
|
27
|
Wang SM, Ooi LL and Hui KM: Upregulation
of Rac GTPase-activating protein 1 is significantly associated with
the early recurrence of human hepatocellular carcinoma. Clin Cancer
Res. 17:6040–6051. 2011.PubMed/NCBI View Article : Google Scholar
|
|
28
|
Wang C, Wang W, Liu Y, Yong M, Yang Y and
Zhou H: Rac GTPase activating protein 1 promotes oncogenic
progression of epithelial ovarian cancer. Cancer Sci. 109:84–93.
2018.PubMed/NCBI View Article : Google Scholar
|
|
29
|
Mi S, Lin M, Brouwer-Visser J, Heim J,
Smotkin D, Hebert T, Gunter MJ, Goldberg GL, Zheng D and Huang GS:
RNA-seq Identification of RACGAP1 as a Metastatic Driver in Uterine
Carcinosarcoma. Clin Cancer Res. 22:4676–4686. 2016.PubMed/NCBI View Article : Google Scholar
|
|
30
|
Imaoka H, Toiyama Y, Saigusa S, Kawamura
M, Kawamoto A, Okugawa Y, Hiro J, Tanaka K, Inoue Y, Mohri Y, et
al: RacGAP1 expression, increasing tumor malignant potential, as a
predictive biomarker for lymph node metastasis and poor prognosis
in colorectal cancer. Carcinogenesis. 36:346–354. 2015.PubMed/NCBI View Article : Google Scholar
|
|
31
|
Saigusa S, Tanaka K, Mohri Y, Ohi M,
Shimura T, Kitajima T, Kondo S, Okugawa Y, Toiyama Y, Inoue Y, et
al: Clinical significance of RacGAP1 expression at the invasive
front of gastric cancer. Gastric Cancer. 18:84–92. 2015.PubMed/NCBI View Article : Google Scholar
|
|
32
|
Taguchi A, Rho JH, Yan Q, Zhang Y, Zhao Y,
Xu H, Tripathi SC, Wang H, Brenner DE, Kucherlapati M, et al:
MAPRE1 as a plasma biomarker for early-stage colorectal cancer and
adenomas. Cancer Prev Res (Phila). 8:1112–1119. 2015.PubMed/NCBI View Article : Google Scholar
|
|
33
|
Kim K, Lee HC, Park JL, Kim M, Kim SY, Noh
SM, Song KS, Kim JC and Kim YS: Epigenetic regulation of
microRNA-10b and targeting of oncogenic MAPRE1 in gastric cancer.
Epigenetics. 6:740–751. 2011.PubMed/NCBI View Article : Google Scholar
|
|
34
|
Fu JF, Hsu HC and Shih LY: MLL is fused to
EB1 (MAPRE1), which encodes a microtubule-associated protein, in a
patient with acute lymphoblastic leukemia. Genes Chromosomes
Cancer. 43:206–210. 2005.PubMed/NCBI View Article : Google Scholar
|
|
35
|
Chen RX, Song HY, Dong YY, Hu C, Zheng QD,
Xue TC, Liu XH, Zhang Y, Chen J, Ren ZG, et al: Dynamic expression
patterns of differential proteins during early invasion of
hepatocellular carcinoma. PLoS One. 9(e88543)2014.PubMed/NCBI View Article : Google Scholar
|
|
36
|
Xie T, Li X, Ye F, Lu C, Huang H, Wang F,
Cao X and Zhong C: High KIF2A expression promotes proliferation,
migration and predicts poor prognosis in lung adenocarcinoma.
Biochem Biophys Res Commun. 497:65–72. 2018.PubMed/NCBI View Article : Google Scholar
|
|
37
|
Zhang X, Ma C, Wang Q, Liu J, Tian M, Yuan
Y, Li X and Qu X: Role of KIF2A in the progression and metastasis
of human glioma. Mol Med Rep. 13:1781–1787. 2016.PubMed/NCBI View Article : Google Scholar
|
|
38
|
Wang J, Ma S, Ma R, Qu X, Liu W, Lv C,
Zhao S and Gong Y: KIF2A silencing inhibits the proliferation and
migration of breast cancer cells and correlates with unfavorable
prognosis in breast cancer. BMC Cancer. 14(461)2014.PubMed/NCBI View Article : Google Scholar
|
|
39
|
Duan J, Huang W and Shi H: Positive
expression of KIF20A indicates poor prognosis of glioma patients.
OncoTargets Ther. 9:6741–6749. 2016.PubMed/NCBI View Article : Google Scholar
|
|
40
|
Stangel D, Erkan M, Buchholz M, Gress T,
Michalski C, Raulefs S, Friess H and Kleeff J: Kif20a inhibition
reduces migration and invasion of pancreatic cancer cells. J Surg
Res. 197:91–100. 2015.PubMed/NCBI View Article : Google Scholar
|
|
41
|
Tilghman J, Wu H, Sang Y, Shi X,
Guerrero-Cazares H, Quinones-Hinojosa A, Eberhart CG, Laterra J and
Ying M: HMMR maintains the stemness and tumorigenicity of
glioblastoma stem-like cells. Cancer Res. 74:3168–3179.
2014.PubMed/NCBI View Article : Google Scholar
|
|
42
|
Bidadi B, Liu D, Kalari KR, Rubner M, Hein
A, Beckmann MW, Rack B, Janni W, Fasching PA, Weinshilboum RM, et
al: Pathway-Based Analysis of Genome-Wide Association Data
Identified SNPs in HMMR as Biomarker for Chemotherapy- Induced
Neutropenia in Breast Cancer Patients. Front Pharmacol.
9(158)2018.PubMed/NCBI View Article : Google Scholar
|