Introduction
Pectus excavatum (PE) and pectus carinatum (PC) are
two of the most common malformations of the thoracic cage with an
incidence of 0.1-0.8/100 people (1). At present, the etiology of both PE
and PC remains poorly understood. A number of studies have
previously demonstrated that patients with PE or PC present with
various ultrastructural disorders of the costal cartilages
(1-3).
Among the several underlying causes that have been previously
proposed, overgrowth of the costal cartilages has been frequently
reported for the development of PE and PC (2). This proposal suggests that the
disproportionate growth of the costal cartilages forces the sternum
to either bend backwards (in PE) or forwards (in PC) (3,4).
Although this hypothesis was postulated ~100 years ago, to the best
of our knowledge, the exact cause of costal cartilage overgrowth
remains unknown (3). Previous
studies have also presented evidence contradicting this currently
accepted theory, by reporting no difference in the lengths of the
costal cartilages between patients with PE or PC and healthy
individuals (5,6).
Insulin-like growth factor 1 (IGF1) is one of the
main anabolic growth factors in human hyaline cartilages (7). Considering that cartilage is a
primary target tissue for proteins of the insulin growth factor
family (8), IGF1 is the optimal
choice to induce the overgrowth of the costal cartilages (8). IGF1 regulates articular cartilage
homeostasis and has been extensively used as a promoter of
chondrogenesis both in vitro and in vivo (7-10).
It has been documented that IGF1 treatment can increase cell
proliferation and stimulate chondrocyte synthesis of proteoglycans
and type II collagen (9,10).
The present study aimed to investigate if induced
overgrowth of the costal cartilages could lead to the deformation
of the anterior chest wall in a rat model. The present study aimed
to demonstrate the effectiveness of IGF1 in an animal model. So,
the methods used had two major targets: i) To induce the overgrowth
of the costal cartilages in a rat model; and ii) to evaluate if
this overgrowth could lead to modifications in the structure or
shape of the thoracic wall to mimic PE or PC deformities.
Therefore, IGF1 solution (in two different doses) was injected
directly under the perichondrium of the lower costal cartilages of
rat animal model. The effects of these injections were assessed on
macroscopic and microscopic levels.
Several factors have been considered in the design
of the present study. It was specifically performed on immature
2-week-old rats to assess the effects of IGF1 on costal cartilage
growth. The aim was to mimic the natural progression of the disease
and stimulate the overgrowth of the costal cartilage during the
growth phase of the animals. In the majority of patients with PE or
PC, the deformity in the chest wall has a dynamic, progressive and
uneven growth pattern throughout the childhood period (2-4).
In young children, deformities are frequently absent or mild and
become more evident before worsening during the pre-pubertal growth
spurt (2). After adolescence, this
deformation typically stabilizes (2). In addition, a similar pattern in the
serum levels of IGF1 can also be observed throughout childhood
(10).
The second factor considered while designing the
present study was the number of cartilages to be injected. In the
majority of the patients with PE or PC, the deformation is limited
to the lower 3-4 costal cartilages (2,3). The
upper costal cartilages and the upper part of the anterior thoracic
wall are rarely affected (3).
Therefore, the IGF1 solution was only injected into the lower
cartilages to closely replicate the natural progression of the
disease process.
Materials and methods
Animals
A total of 40 Sprague-Dawley rats (age, 2 weeks;
male, 21; female, 19; mean weight, 21.22±1.21 g) were randomly
selected for the present experiment. The rats were provided by the
Animal Facility of ‘Pius Branzeu’ Center for Laparoscopic Surgery
and Microsurgery (Timisoara, Romania). All rats were kept under the
same conditions: Constant humidity (50±5%) and temperature
(22±5˚C), a 12-h light/dark cycle, and food and water ad
libitum. The rats were divided into four groups (10
rats/group), with two control and two experimental groups. Ethics
approval was obtained from the Ethics Committee of ‘Victor Babes’
University of Medicine and Pharmacy (Timisoara, Romania) prior to
the beginning of the present study. All experiments were performed
in accordance with relevant guidelines and regulations. The entire
experiment was performed following the guidelines set forth by the
Animal Research: Reporting in Vivo Experiments guidelines
(11).
No interventions were performed on the rats from the
first control group (M0) and they were allowed to grow normally.
With the animals on general anesthesia (inhalation, 5% isoflurane
and O2 at 1l/min, for induction in the anesthesia
chamber, and then 2% isoflurane and O2 at 1l/min on
facemask), the following surgical interventions were performed on
rats in the Sham group (M1) and the two experimental groups: An
anterior thoracic midline incision was first made, exposing the
last three costal cartilages at the junction with the sternum.
Using a 2-ml insulin syringe, 0.02 ml of various solutions were
administered bilaterally and directly under the perichondrium of
each of the last three costal cartilages in accordance with each of
the experimental groups. In the M1 group, 0.02 ml PBS was injected.
For rats in the first experimental group (E50), 0.02 ml IGF1 (50
µg/ml; recombinant rat IGF1 protein; cat. no. ab52006; Abcam)
solution was injected. For rats in in the second experimental group
(E100), 0.02 ml IGF1 solution (100 µg/ml) was injected. The choice
of dosage was made based on previous studies involving the
intra-articular injection of IGF1 in mice animal models (due to
lack of studies using rat models) and IGF1 constructs for
osteoarthritic cartilage repair (8,12).
This procedure was repeated once a week for 5 consecutive weeks.
The weight and the length of the animals included in the present
study were measured weekly. Each animal was assessed weekly for PE-
or PC-like modifications, which could alter the shape of the
thoracic cage.
Measurements
The rats were euthanized by CO2 (30%; 7
l/min) inhalation 2 weeks after the last injection according to
American Veterinary Medical Association guidelines (13). For death confirmation, the
heartbeat, the spontaneous breathing and the grey discoloration of
the nostrils and perioral mucosa at 1, 3 and 5 min were assessed.
The rib cage, including the thoracic spine, was surgically
isolated, following which the soft tissues and intrathoracic organs
were removed. The rib cage was then inspected for pectus-like
modifications to the shape of the thorax, the sizes of which were
compared among the four groups to assess if PE- or PC-like
deformities occurred. Using a ruler, the height of the rib cage
(thoracic spine) was measured and recorded, as were the
anteroposterior and transverse diameters at the level of the lower
thoracic opening.
Sample preparation
Cartilage samples were collected from the last three
costal cartilages of each rat. The samples were fixed in 10%
buffered formalin at room temperature for 48 h and embedded in
paraffin. Sections of 3-µm thickness were cut from each cartilage
sample, dewaxed using xylene at 60˚C, 2x5 min rehydrated in
descending alcohol series, and then stained using H&E (14). The sections were examined using
light microscopy at x100 magnification using a Zeiss Scope A1 light
microscope (Carl Zeiss AG) equipped with an AxioCam ERc5s digital
camera, with one image obtained for each section. The images were
processed and analyzed using the NIS-Elements BR v2.30 imaging
software (Nikon Corporation). The following morphometric parameters
were assessed on each image: i) The density and area of the
chondrocytes, ii) the density of the isogenic groups of
chondrocytes; iii) the density and area of the chondroblasts; and
iv) the density of the isogenic groups of chondroblasts.
Statistical analysis
All statistical analyses were performed using SPSS
statistics software v23 (IBM Corp.). The normality of the data was
checked using the Shapiro-Wilk test. The original parametric data
presented deviation from normality; as a result, the Kruskal-Wallis
test was performed, followed by Dunn's post hoc test, to compare
the following variables: i) The weight of the animals; ii) the
density of the chondrocytes; iii) the area of the chondrocytes; iv)
the density of the isogenic groups of chondrocytes; and v) the
diameter of the thoracic cage. Numerical variables are presented as
the median + interquartile range. Pearson's correlation analysis
was used to calculate if there was a linear correlation between
results of the morphometrical analysis and the diameters of the
thoracic cage. P<0.05 was considered to indicate a statistically
significant difference.
Results
Rat model characteristics
The degree of weight gain was comparable during the
entire experimental period among the M0, M1 and E50 groups. By
contrast, the animals in the E100 group gained significantly more
weight compared with those in the other three groups in weeks 1 and
2 (P<0.01; Table I). There were
21 female and 19 male rats with equal distribution among the groups
(P>0.05; data not shown). Subsequently for weeks 3-5, the growth
rate was normal and was comparable among the four groups. At the
end of the experiment, no differences could be noted in terms of
weight and body length (data not presented) among the four
groups.
 | Table IWeight of the rats during the
experiment. |
Table I
Weight of the rats during the
experiment.
| | Timepoints |
|---|
| Groups | Baseline, g
(IQR) | Week 1, g (IQR) | Week 2, g (IQR) | Week 3, g (IQR) | Week 4, g (IQR) | Week 5 (End), g
(IQR) |
|---|
| M0 | 21.00 (19-21) | 30.60
(30-31)a | 58.00
(56-58)b | 109.60 (101-111) | 139.20 (125-146) | 212.60 (199-227) |
| M1 | 21.50 (20-23) | 30.20
(29-31)a | 58.50
(57-60)b | 112.70 (1-3-122) | 143.40 (126-156) | 250.30 (195-295) |
| E50 | 21.40 (21-22) | 29.40
(28-30)a | 57.20
(56-61)b | 111.40 (108-121) | 138.20 (133-152) | 227.50 (215-251) |
| E100 | 21.00 (19-21) | 44.80 (39-51) | 72.20 (65-78) | 105.60 (99-113) | 146.80 (135-163) | 236.00 (203-258) |
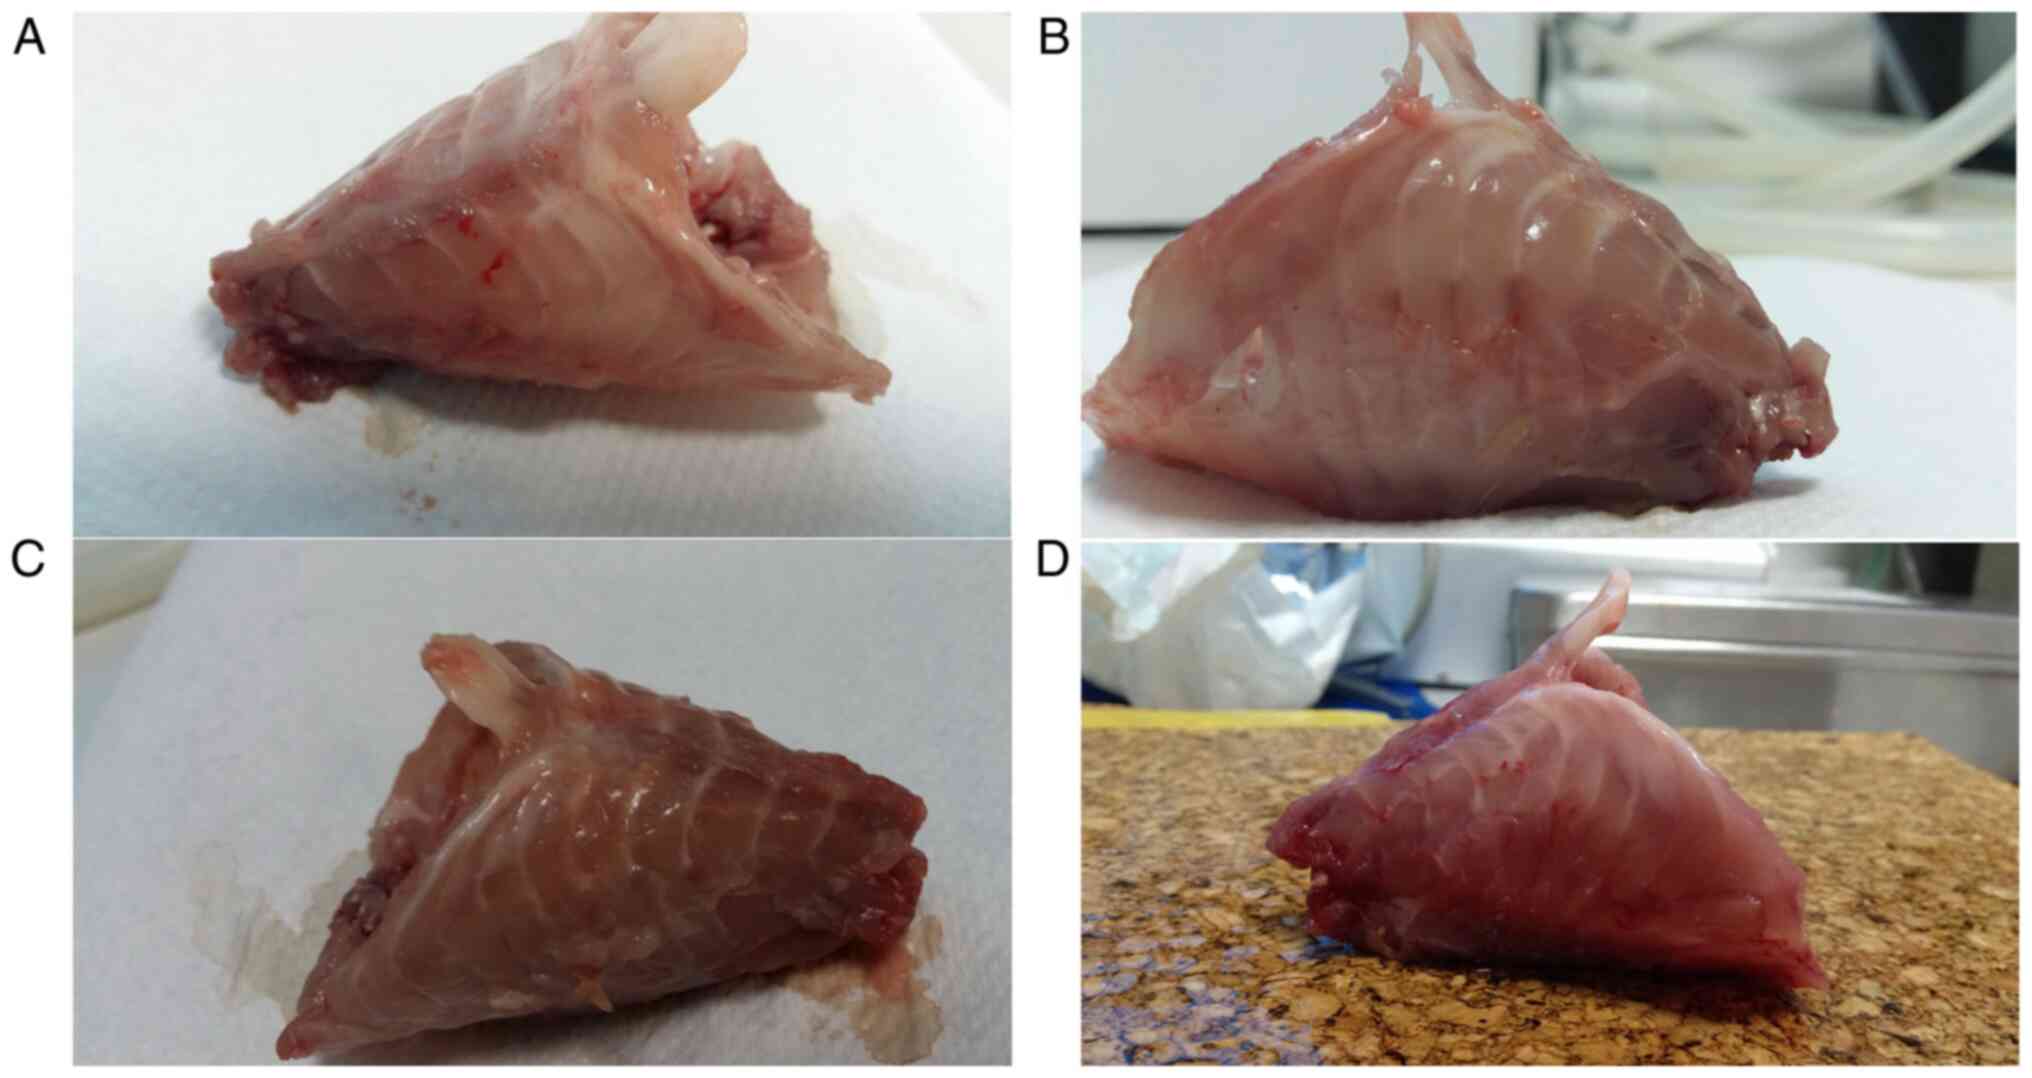
Macroscopic assessment of the animal
rib cage and measurements
Despite the visible micro-trauma induced by repeated
procedures at the site of surgery, none of the four groups
developed any deformities synonymous with PE or PC in the rib cage
(Fig. 1), meaning clear
modification of the shape of the chest wall as previously described
in animals or induced in animal models of PE (15,16).
All thoracic diameters were found to be similar among the rats in
the M0, M1 and E50 groups. However, rats in the E100 groups
exhibited significantly larger sagittal and transversal diameters
of the rib cage compared with those in the other three groups
(P<0.002; Table II).
| Table IIDiameters of the rib cage at the end
of the experiment. |
Table II
Diameters of the rib cage at the end
of the experiment.
| | Parameters |
|---|
| Groups | Axial diameter, mm
(IQR) | Sagittal diameter, mm
(IQR) | Transverse diameter,
mm (IQR) |
|---|
| M0 | 44.40 (41-45) | 31.20
(30-33)a | 46.80
(45-50)b |
| M1 | 45.70 (41-49) | 33.90
(28-37)a | 49.00
(49-50)b |
| E50 | 46.80 (44-49) | 31.60
(30-33)a | 49.30
(48-51)b |
| E100 | 45.60 (40-50) | 40.80 (40-41) | 59.00 (59-62) |
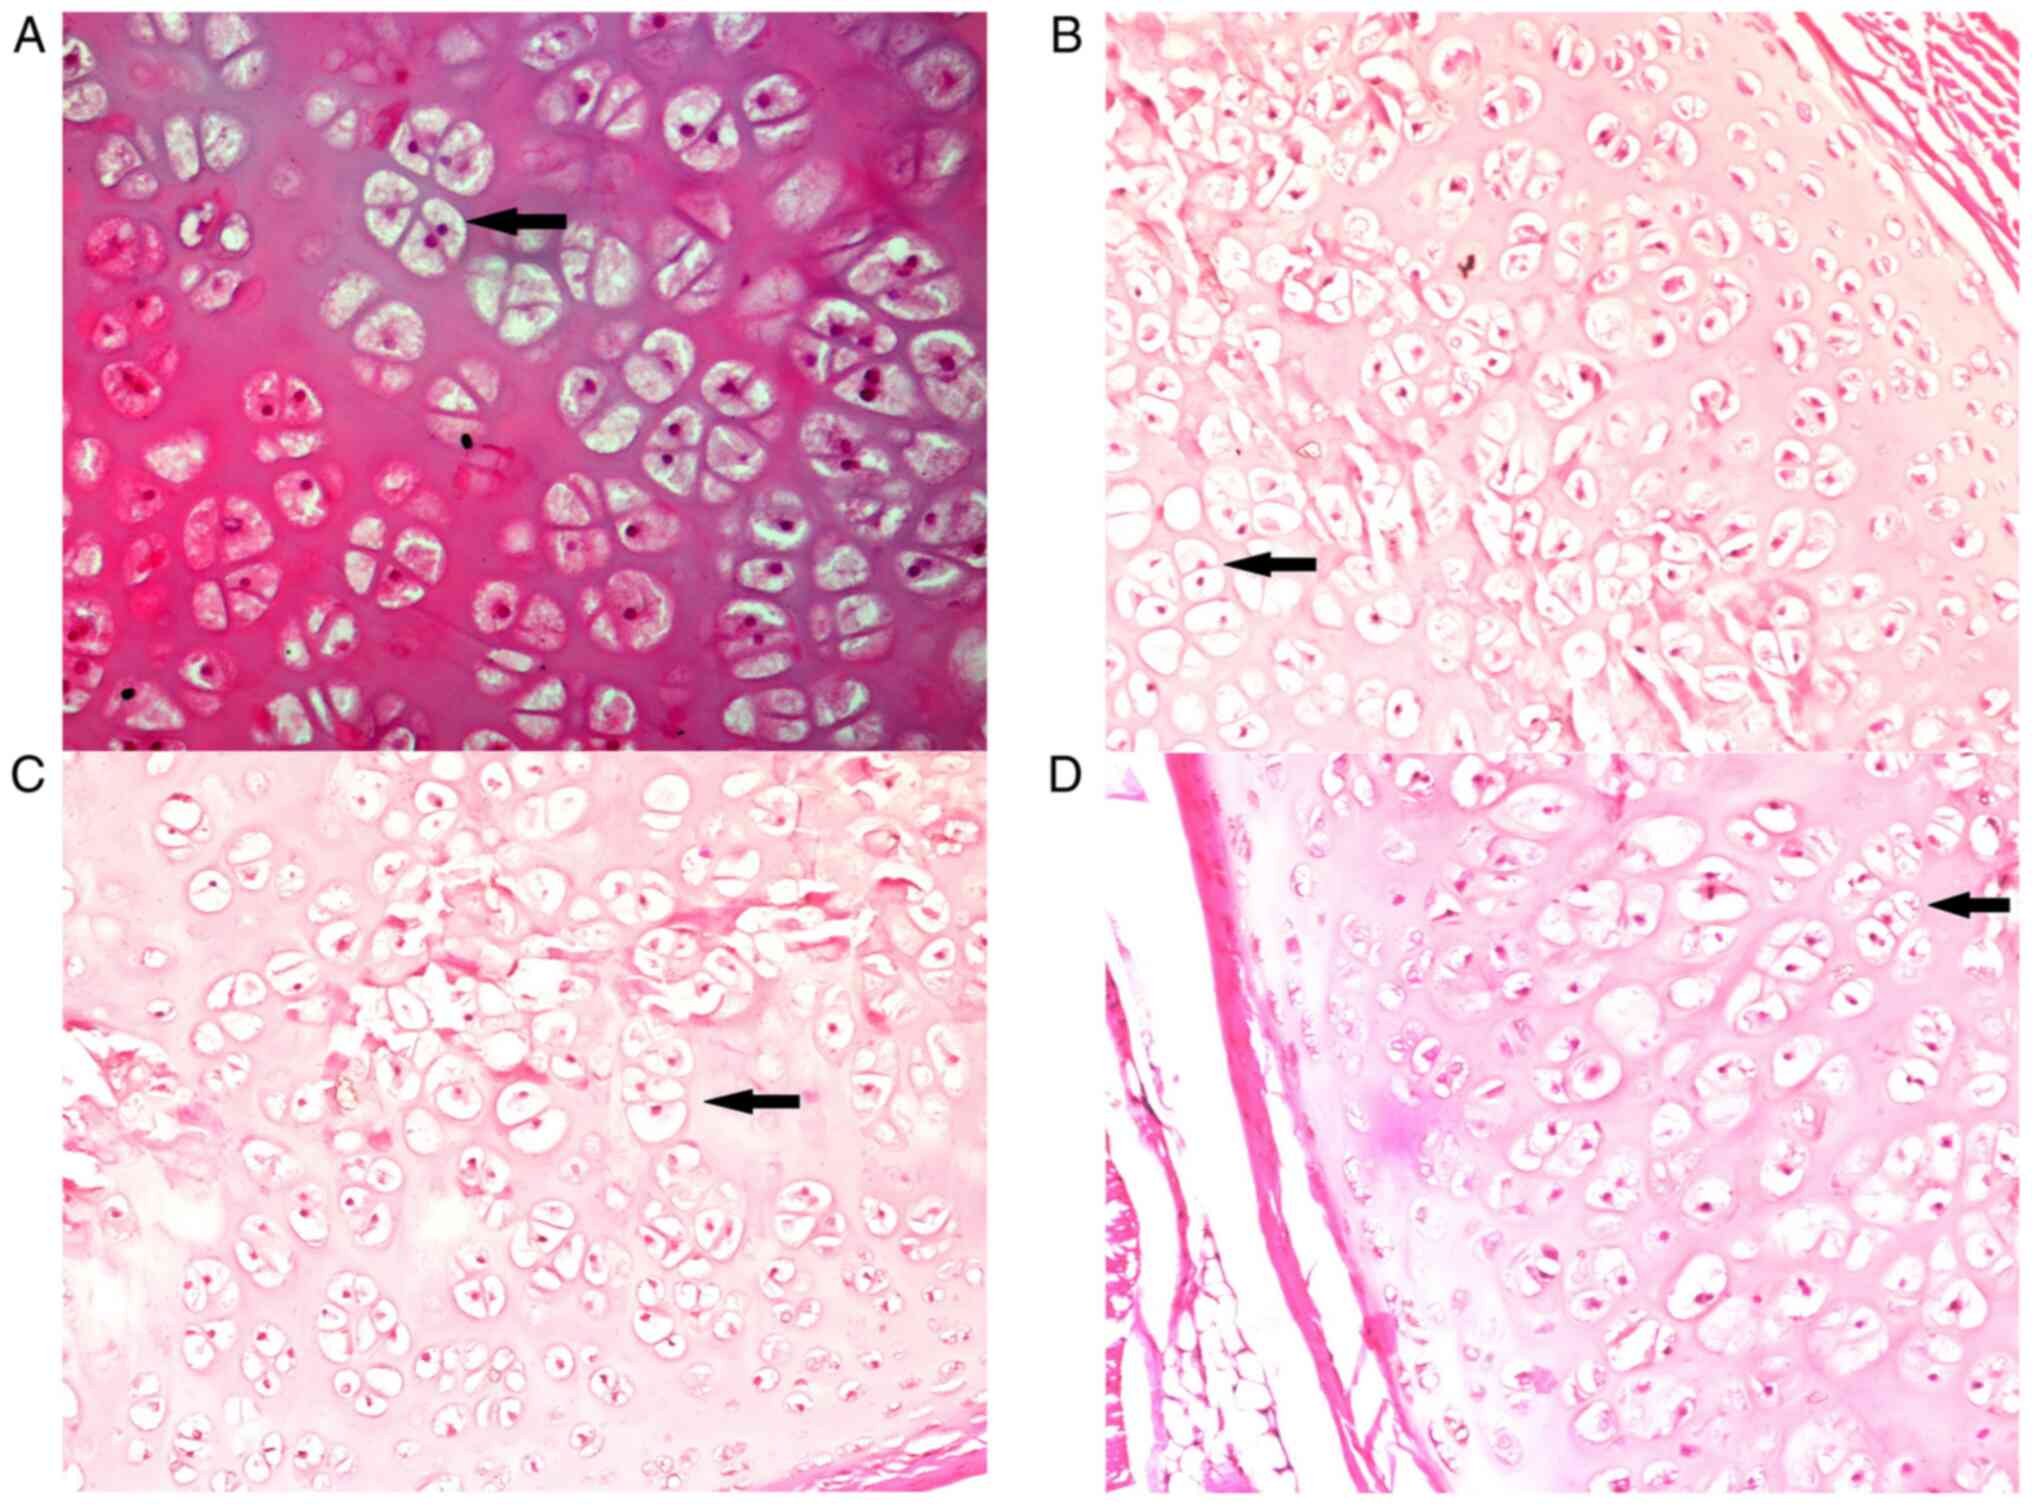
Light microscopy assessment of the rib
cartilages
The results of the morphometric analyses are
presented in Table III. A
difference was noted in the chondrocyte number between the E50 and
E100 groups and in the chondroblast number between the M1 and E100
groups. While there was no statistical difference found among the
first three groups, M0, M1 and E50 (P>0.05), the chondrocyte
area was larger in the M0, M1 and E50 groups compared with that in
the E100 group (P<0.05). In addition, the chondroblast area was
larger in the M0, M1 and E50 groups compared with the E100 group.
There were no significant statistical differences for chondroblast
area between the M0 and M1, M0 and E50, and M1 and E50 groups
(P>0.05). The number of isogenic groups of chondrocytes per
image was found to be significantly higher in the E100 group
compared with the M1 and M0 groups (Fig. 2; Table III). The number of isogenic
groups of chondrocytes per image was similar in the M0, M1 and E50
groups (P>0.05). Similarly, no significant differences were
observed regarding the number of isogenic groups of chondrocytes
per image between the E50 and E100 groups (P>0.05). Finally, the
number of isogenic groups of chondroblasts per image was similar
among the M0, M1 and E50 groups (P>0.05). In addition, none of
the rats from the E100 group presented isogenic groups of
chondroblasts. This was significantly different from the other
groups (P<0.001). Pearson correlation coefficient analysis
revealed a negative linear correlation in the E100 group between
the transverse diameter of the thorax and the number of
chondroblasts (r=-0.834; P=0.003; n=10) and the chondroblast area
(r=-0.892; P=0.001; n=10). No other significant correlations were
observed (Table IV).
| Table IIIResults of the morphometry
analysis. |
Table III
Results of the morphometry
analysis.
| | Groups |
|---|
| Variables | M0 | M1 | E50 | E100 |
|---|
| Chondrocytes, n/µm²
(IQR) | 25.60 (17-39) | 25.80 (22-30) | 21.20
(16-30)a | 28.80 (25-35) |
| Chondroblasts,
n/µm² (IQR) | 21.30 (16-34) | 21.60
(17-27)b | 22.40 (17-23) | 27.70 (20-35) |
| Chondrocyte area,
µm² (IQR) | 357741.80
(208477-444631)c | 396188.80
(328206-446234)d | 335276.60
(305280-412860)e | 130186.80
(25905-36044) |
| Chondroblast area,
µm² (IQR) | 194357.00
(112437-241008)f | 176457.80
(105118-196965)f | 159170.20
(144554-173732)f | 24172.60
(15366-26566) |
| Chondrocyte
isogenic groups, n/µm² (IQR) | 6
(4-8)g | 6.2
(5-8)h | 8.6 (5-12) | 12.40 (8-18) |
| Chondroblast
isogenic groups, n/µm² (IQR) | 6.6
(6-9)i | 6.4
(3-8)i | 5.8
(4-8)i | 0 |
| Table IVPearson correlation coefficient
analysis. |
Table IV
Pearson correlation coefficient
analysis.
| | M0 | M1 | E50 | E100 |
|---|
| Groups | AD | SD | TD | AD | SD | TD | AD | SD | TD | AD | SD | TD |
|---|
| Chondrocytes | | | | | | | | | | | | |
|
Pearson
correlation | 0.155 | -0.366 | -0.234 | -0.119 | -0.315 | -0.423 | 0.096 | -0.077 | -0.139 | -0.236 | -0.393 | -0.521 |
|
Sig.
(2-tailed) | 0.670 | 0.299 | 0.515 | 0.743 | 0.375 | 0.223 | 0.791 | 0.832 | 0.703 | 0.512 | 0.261 | 0.123 |
|
N | 10 | 10 | 10 | 10 | 10 | 10 | 10 | 10 | 10 | 10 | 10 | 10 |
| Chondroblasts | | | | | | | | | | | | |
|
Pearson
correlation | -0.690 | -0.798 | -0.925 | -0.379 | -0.291 | -0.264 | 0.006 | -0.010 | 0.180 | -0.011 | 0.365 | -0.834 |
|
Sig.
(2-tailed) | 0.187 | 0.106 | 0.200 | 0.279 | 0.414 | 0.461 | 0.987 | 0.979 | 0.618 | 0.977 | 0.300 | 0.003 |
|
N | 10 | 10 | 10 | 10 | 10 | 10 | 10 | 10 | 10 | 10 | 10 | 10 |
| Chondrocyte
area | | | | | | | | | | | | |
|
Pearson
correlation | 0.529 | -0.046 | 0.226 | -0.213 | -0.416 | -0.381 | 0.559 | -0.112 | 0.310 | 0.459 | -0.271 | 0.125 |
|
Sig.
(2-tailed) | 0.116 | 0.899 | 0.530 | 0.554 | 0.232 | 0.277 | 0.093 | 0.759 | 0.384 | 0.182 | 0.449 | 0.730 |
|
N | 10 | 10 | 10 | 10 | 10 | 10 | 10 | 10 | 10 | 10 | 10 | 10 |
| Chondroblast
area | | | | | | | | | | | | |
|
Pearson
correlation | -0.736 | -0.546 | -0.852 | -0.381 | -0.280 | . | 0.249 | 0.068 | -0.053 | -0.472 | 0.101 | -0.892 |
|
Sig.
(2-tailed) | 0.115 | 0.102 | 0.072 | 0.278 | 0.433 | . | 0.488 | 0.851 | 0.885 | 0.169 | 0.781 | 0.001 |
|
N | 10 | 10 | 10 | 10 | 10 | 10 | 10 | 10 | 10 | 10 | 10 | 10 |
| Chondrocyte
isogenic groups | | | | | | | | | | | | |
|
Pearson
correlation | 0.480 | 0.000 | 0.231 | -0.007 | -0.221 | . | 0.336 | 0.007 | 0.579 | 0.260 | -0.387 | -0.213 |
|
Sig.
(2-tailed) | 0.160 | >0.999 | 0.521 | 0.985 | 0.539 | . | 0.342 | 0.984 | 0.079 | 0.138 | 0.269 | 0.554 |
|
N | 10 | 10 | 10 | 10 | 10 | 10 | 10 | 10 | 10 | 10 | 10 | 10 |
| Chondroblast
isogenic groups | | | | | | | | | | | | |
|
Pearson
correlation | -0.582 | -0.124 | -0.293 | -0.378 | -0.278 | . | 0.252 | -0.022 | -0.306 | N/Aa | N/Aa | N/Aa |
|
Sig.
(2-tailed) | 0.077 | 0.732 | 0.411 | 0.281 | 0.437 | . | 0.482 | 0.951 | 0.390 | N/Aa | N/Aa | N/Aa |
|
N | 10 | 10 | 10 | 10 | 10 | 10 | 10 | 10 | 10 | N/Aa | N/Aa | N/Aa |
Discussion
In the present study, the transverse and sagittal
diameters of the rib cages, which are directly influenced by the
growth pattern of the costal cartilages and of the adjacent ribs,
were found to be greater in rats in the E100 group. This suggested
that in these animals, the locally distributed IGF1 interfered with
the normal growth pattern of the cartilage by potentiating
proliferation further. However, this effect appeared to be
dose-dependent, because the diameters of the rib cage in rats in
the E50 group were comparable to those in the M0 and M1 groups. In
addition, the route of IGF1 administration was considered in the
present study, since the aim was to elicit a local response with
minimal systemic involvement. The intravenous route was not
appropriate, since it could have induced undesirable outcomes
through various feedback mechanisms (7). The amplitude of the effects mediated
by IGF1 is mainly dependent on two factors: i) Bioavailability of
IGF1 in the different biological fluids; and ii) the quantity of
viable receptors on the cell surface (8). IGF1 bioavailability is regulated
through its binding proteins, especially IGF binding protein
3(9). However, on a cellular
level, the regulatory mechanism remains to be fully elucidated. The
main obstacle limiting an effective response to IGF1 is the poor
expression of viable receptors on the cell surface, which is
genetically determined (8). This
hypothesis is supported by reports from various studies performed
on different types of cancer, such as ovarian malignant tumors or
squamous non-small cell lung carcinoma, which demonstrated that
overexpression of IGF1 receptor is key to tumorigenesis and cell
proliferation (9,10). The binding of IGF1 to its receptors
leads to the activation of an intracellular cascade of signaling
and inhibition of further IGF1 and growth hormone (GH) secretion by
the cells (9). This serves as a
negative feedback mechanism for the GH-IGF1 axis (9). Therefore, the IGF1 solution was
administered by direct sub-perichondrium injections. Since no
significant differences could be observed in weight and body length
among the four groups at the end of the experiment (when the
animals exhibit full growth), the systemic effects of IGF1 were
concluded to be either minimal or absent.
The present study demonstrated that IGF1 could exert
a dose-dependent in vivo chondrogenic effect on the costal
cartilages of rats. The direct stimulation of the costal cartilage
was found to induce modifications in both the structure and growth
pattern of the costal cartilage in the immature rats. The structure
of the costal cartilages was under the influence of IGF1, as
demonstrated by increased cellularity, area occupied by the cells
and isogenic groups of chondrocytes. The anabolic effect of IGF1 on
the hyaline cartilage has been reported in several studies
(9,12,17).
In the present study, the number of chondrocytes and chondroblasts
and the area occupied by these cells were higher in the E100 group
compared with the control and E50 groups. Additionally, a
particular pattern in the isogenic groups was observed, where the
number of isogenic groups of chondrocytes were increased in the
E100 group compared with the control and E50 groups, while isogenic
groups of chondroblasts were entirely absent in the E100 group.
This is an indicator that IGF1 can also exert an effect on the
differentiation and maturation of the cartilage cells in a
dose-dependent manner. The present study demonstrated that the
locally distributed IGF1 interfered with the normal growth pattern
of the cartilage to stimulate growth. This effect was largely
dose-dependent, as the diameters of the rib cage among the E50, M0
and M1 groups were similar and shorter compared with those in the
rats in the E100 group. In particular, only the transverse and
sagittal diameters of the thorax were longer, suggesting that only
the ribs and costal cartilages exposed to high doses IGF1 exhibited
rapid growth.
The main purpose of the present experimental study
was to identify if induced overgrowth of the costal cartilages led
to a pectus-like deformity of the chest wall in experimental
animals. Several abnormalities of the physical and structural
features of the costal cartilages were previously demonstrated in
patients with PE and PC, including alteration of the collagen
network, disturbances in endochondral ossification and costal
cartilage growth, low number of cartilage lacunae and cartilage
channels, diminished structural strength and decreased water
content (1,18-20).
These facts led to the conclusion that the deformation of the chest
wall in PE or PC was caused by the abnormal growth of the costal
cartilages (1,2). However, to this date, to the best of
our knowledge, there was no clear explanation as to how these
costal cartilage modifications lead to the deformation of the chest
wall. The findings of the present study suggested that the
pectus-like deformation of the chest wall is independent from the
overgrowth of the costal cartilages and adjacent ribs. Though
overgrowth of the costal cartilages was observed in E100 animals,
neither the retraction nor protraction of the anterior chest wall
was observed. Therefore, overgrowth is not the only factor
responsible for causing PE or PC. This is contrary to the currently
accepted hypothesis concerning PE and PC etiology. The majority of
publications in this scientific field, especially previous book
chapters or reviews, maintain that the overgrowth of costal
cartilages is the definitive cause of PE and PC (2,3,18).
However, to the best of our knowledge, no direct scientific
evidence could unequivocally prove this hypothesis or definitively
show how overgrowth causes deformation in the chest wall. This
hypothesis was made based on a number of clinical observation
studies and personal opinions dating from >50 years ago
(21,22). In studies in the last 20 years,
overgrowth could not be found in patients with PE or PC (19,20,23,24).
In addition, a number of reports demonstrated that the cartilages
in patients with PE or PC were not different in length compared
with those in healthy individuals, suggesting the lack of excessive
growth of the costal cartilages in patients with PE or PC (5,6).
Studies assessing the microscopic structure and the physiology of
the costal cartilages from patients with PE or PC have also been
conducted (21-24).
Although alterations in the normal structure and function of the
costal cartilages were observed, none of these studies were able to
demonstrate signs of excessive or greater growth rates in the
costal cartilages in patients with PE or PC (19,20,23,24).
The results of the present study are consistent with these previous
findings (19,20,23,24)
and indicate that, although there is evidence of structural and
functional abnormalities in the costal cartilages in PE and PC,
cartilage overgrowth is unlikely to be the direct cause of these
types of chest wall deformities.
In conclusion, the findings of the present study
suggested that locally administered IGF1 could stimulate cellular
proliferation and multiplication in the costal cartilages of
immature rats in vivo. This effect was dose dependent, since
for high doses (100 µg/ml), the results were observed at both
microscopic (increased number of cells in E100 group) and
macroscopic levels (increased sagittal and transverse diameters in
E100 group). However, the induced overgrowth of the costal
cartilages did not lead to deformations of the anterior chest wall
observed in PE or PC in these rats.
Acknowledgements
Not applicable.
Funding
Funding: No funding was received.
Availability of data and materials
The datasets used and/or analyzed during the current
study are available from the corresponding author on reasonable
request.
Authors' contributions
VLD was responsible for conceptualization,
methodology and experiments. MCS, MCP, RFS, FGH, BC, NRK, AS and
ESB carried out the experiments. FGH, RFS and NRK were also
responsible for formal analysis. AS and NRK carried out reviewing
and editing. BC was responsible for data analysis and
visualization. All authors reviewed the manuscript. VLD and BC
confirm the authenticity of all the raw data. All authors have read
and approved the final manuscript.
Ethics approval and consent to
participate
Approval was obtained from the Ethics Committee of
‘Victor Babes’ University of Medicine and Pharmacy (Timisoara,
Romania) prior to the commencement (approval no. 14/22.02.2018).
All experiments were performed in accordance with relevant
guidelines and regulations. The entire experiment was performed in
accordance with the guidelines set by the Animal Research:
Reporting in Vivo Experiments guidelines.
Patient consent for publication
Not applicable.
Competing interests
The authors declare that they have no competing
interests.
References
|
1
|
Kurkov AV, Shekhter AB and Paukov VS:
Costal cartilage structural and functional changes in children with
a funnel or keeled chest. Arkh Patol. 79:57–62. 2017.PubMed/NCBI View Article : Google Scholar : (In Russian).
|
|
2
|
Nuss D, Obermeyer RJ and Kelly RE Jr:
Pectus excavatum from a pediatric surgeon's perspective. Ann
Cardiothorac Surg. 5:493–500. 2016.PubMed/NCBI View Article : Google Scholar
|
|
3
|
Brochhausen C, Turial S, Müller FK,
Schmitt VH, Coerdt W, Wihlm JM, Schier F and Kirkpatrick CJ: Pectus
excavatum: History, hypotheses and treatment options. Interact
Cardiovasc Thorac Surg. 14:801–806. 2012.PubMed/NCBI View Article : Google Scholar
|
|
4
|
Nicodin A, Boia ES, Popoiu MC, Cozma G,
Nicodin G, Badeti R, Trailescu M, Adam O and David VL: Preliminary
results after Nuss procedure. Chirurgia (Bucur). 105:203–210.
2010.PubMed/NCBI
|
|
5
|
David VL, Cerbu S, Haragus H, Popoiu MC,
Stanciulescu CM, Cozma G, Burlacu O and Boia ES: Costal cartilages
do not overgrow in patients with pectus excavatum. Med Princ Pract.
25:533–538. 2016.PubMed/NCBI View Article : Google Scholar
|
|
6
|
Nakaoka T, Uemura S, Yoshida T, Tanimoto T
and Miyake H: Overgrowth of costal cartilage is not the etiology of
pectus excavatum. J Pediatr Surg. 45:2015–2018. 2010.PubMed/NCBI View Article : Google Scholar
|
|
7
|
Dupont J and Holzenberger M: Biology of
insulin-like growth factors in development. Birth Defects Res C
Embryo Today. 69:257–271. 2003.PubMed/NCBI View Article : Google Scholar
|
|
8
|
Johns DE and Athanasiou KA: Growth factor
effects on costal chondrocytes for tissue engineering
fibrocartilage. Cell Tissue Res. 333:439–447. 2008.PubMed/NCBI View Article : Google Scholar
|
|
9
|
Jones JI and Clemmons DR: Insulin-like
growth factors and their binding proteins: Biological actions.
Endocr Rev. 16:3–34. 1995.PubMed/NCBI View Article : Google Scholar
|
|
10
|
Chitnis MM, Yuen JS, Protheroe AS, Pollak
M and Macaulay VM: The type 1 insulin-like growth factor receptor
pathway. Clin Cancer Res. 14:6364–6370. 2008.PubMed/NCBI View Article : Google Scholar
|
|
11
|
Kilkenny C, Browne W, Cuthill IC, Emerson
M and Altman DG: NC3Rs Reporting Guidelines Working Group. Animal
research: Reporting in vivo experiments: The ARRIVE guidelines. Br
J Pharmacol. 160:1577–1579. 2010.PubMed/NCBI View Article : Google Scholar
|
|
12
|
Schmidt MB, Chen EH and Lynch SE: A review
of the effects of insulin-like growth factor and platelet derived
growth factor on in vivo cartilage healing and repair.
Osteoarthritis Cartilage. 14:403–412. 2006.PubMed/NCBI View Article : Google Scholar
|
|
13
|
American Veterinary Medical Association
(AVMA): AVMA guidelines for the euthanasia of animals. 2020
Edition. AVMA, Schaumburg, IL, 2020. https://www.avma.org/sites/default/files/2020-01/2020-Euthanasia-Final-1-17-20.pdf.
Accessed November 10, 2021.
|
|
14
|
Hackam Lab for Pediatric Surgical,
Translational and Regenerative Medicine: Hackam Lab, H&E
staining (regressive method). Johns Hopkins Medicine, Baltimore,
MD, 2021. https://www.hopkinsmedicine.org/pediatricsurgery/research/hackam_lab/documents/hopkins_hackam_lab_protocols_h_e_regressive_method_staining.pdf.
Accessed December 2, 2021.
|
|
15
|
David VL, Ciornei B, Horhat FG, Amaricai
E, Horhat DI, Hoinoiu T and Boia ES: Rat Animal Model of Pectus
Excavatum. Life-Basel. 10(96)2020.PubMed/NCBI View Article : Google Scholar
|
|
16
|
Rahal SC, Morishin Filho MM, Hatschbach E,
Machado VM, Aptekmann KP and Corrêa TP: Pectus excavatum in two
littermate dogs. Can Vet J. 49:880–884. 2008.PubMed/NCBI
|
|
17
|
Darling EM and Athanasiou KA: Growth
factor impact on articular cartilage subpopulations. Cell Tissue
Res. 322:463–473. 2005.PubMed/NCBI View Article : Google Scholar
|
|
18
|
Goretsky MJ, Kelly RE Jr, Croitoru D and
Nuss D: Chest wall anomalies: Pectus excavatum and pectus
carinatum. Adolesc Med Clin. 15:455–471. 2004.PubMed/NCBI View Article : Google Scholar
|
|
19
|
Feng J, Hu T, Liu W, Zhang S, Tang Y, Chen
R, Jiang X and Wei F: The biomechanical, morphologic, and
histochemical properties of the costal cartilages in children with
pectus excavatum. J Pediatr Surg. 36:1770–1776. 2001.PubMed/NCBI View Article : Google Scholar
|
|
20
|
David VL, Izvernariu DA, Popoiu CM, Puiu M
and Boia ES: Morphologic, morphometrical and histochemical
proprieties of the costal cartilage in children with pectus
excavatum. Rom J Morphol Embryol. 52:625–629. 2011.PubMed/NCBI
|
|
21
|
Giem RN, Paulsen GA and Dykes J: Pectus
deformities. Calif Med. 94:306–309. 1961.PubMed/NCBI
|
|
22
|
Lester CW: The etiology and pathogenesis
of funnel chest, pigeon breast, and related deformities of the
anterior chest wall. J Thorac Surg. 34:1–10. 1957.PubMed/NCBI
|
|
23
|
Kurkov AV, Paukov VS, Fayzullin AL and
Shekhter AB: Costal cartilage changes in children with pectus
excavatum and pectus carinatum. Arkh Patol. 80:8–15.
2018.PubMed/NCBI View Article : Google Scholar : (In Russian).
|
|
24
|
Tocchioni F, Ghionzoli M, Calosi L, Guasti
D, Romagnoli P and Messineo A: Rib cartilage characterization in
patients affected by pectus excavatum. Anat Rec (Hoboken).
296:1813–1820. 2013.PubMed/NCBI View
Article : Google Scholar
|