Introduction
Despite significant progress in vascular remodeling
strategies, drug therapy, cardiac rehabilitation algorithms and
organ transplantation, acute myocardial infarction (AMI), as a
cardiovascular disease, remains a major cause of morbidity and
mortality worldwide (1). There are
numerous risk factors for AMI, including smoking, obesity, high
serum cholesterol, hypertension and diabetes, which may partly
predict AMI, but they are not sufficient to provide an acute
diagnosis (2,3). Despite countless efforts, the
prevention and treatment of this disease remains a major challenge
for scientists. At present, this disease has become the major and
most common threat to human life (4,5).
Therefore, it is urgent to reveal the pathogenic mechanisms of AMI
and develop novel treatment strategies.
Early detection of AMI contributes to early
treatment interventions and may significantly reduce mortality
(6). Numerous studies have
investigated potential molecular biomarkers for AMI detection;
certain genes and proteins, such as monocyte-platelet aggregation,
cardiac fatty acid binding protein and troponin I, have been
established as effective markers for the diagnosis of AMI (6-8).
In addition, a large number of microRNAs (miRs) are considered to
be key markers for AMI, including circulating miR-26a-1(9), miR-17-5p (10) and miR-23a (11). However, interactions between these
molecules and altered pathways were rarely reported, and the
molecular pathogenesis of AMI has remained largely elusive. Suresh
et al (12) established
gene expression profiles through microarrays, and compared the
differentially expressed genes (DEGs) between AMI samples and
normal samples, as well as the dysregulated pathways involving
these DEGs. However, they only focused on pathways and recurring
events. The regulatory correlation between these genes was not
further investigated. Therefore, a study by Gao et al
(13) reanalyzed the GSE48060
microarray dataset from the above study and performed
protein-protein interaction (PPI) network analysis and
transcription factor network analysis after identifying DEGs in AMI
samples. Although they predicted several key genes in the
progression of AMI, such as C-C chemokine ligand 5, BCL3 and
nuclear receptor coactivator 7, subchannel analysis and
co-expression network analysis were not performed (13).
Co-expression network analysis is a useful method
that has been widely used for gene expression to identify key
disease-related modules (14,15).
For instance, using co-expression network analysis, Saris et
al (16) selected two large
co-expression modules related to amyotrophic lateral sclerosis. By
analyzing the gene expression pattern, Azuaje et al
(17) determined the weighted
correlation network analysis (WGCNA) in myocardial infarction to
determine the potential role of collagen 5 α2 and its transcription
pattern. Malki et al (18)
constructed a gene co-expression network to identify the expression
of nerve tumor abdominal wall antigen 1 and ubiquitin-specific
peptidase 9, X-linked, and indicated that the most significant
modules are related to depression and drug treatment response. A
co-expression network analysis identified spleen tyrosine kinase as
a candidate oncogene for small cell lung cancer (19). Zhao et al (20), through a co-expression network
analysis combined with methylation data analysis, determined that
dedicator of cytokinesis factor 2 (DOCK2), DOCK8 and IgG Fc
fragments, low-affinity IIa, receptor may represent potential
therapeutic targets. Therefore, co-expression network analysis may
be used for the analysis of AMI chip data.
In the present study, the gene chip dataset GSE48060
from Suresh et al (12) was
reanalyzed and co-expression network analysis, enrichment analysis
and PPI analysis were performed. In addition, in terms of DEG
screening, compared with Zhang et al (21), in addition to a co-expression
network and PPI analysis, Kyoto Encyclopedia of Genes and Genomes
(KEGG) Disease and BioCyc analyses were also performed on DEGs to
deeply investigate gene functions. The present study aimed to
reveal the molecular basis of the occurrence and development of
AMI, and provide novel and more accurate potential biomarkers for
the detection and treatment of AMI.
Materials and methods
Data resource and differential
expression analysis
The dataset GSE48060, consisting of 47 microarray
expression profiles, was downloaded from the Gene Expression
Omnibus (GEO) database (http://www.ncbi.nlm.nih.gov/geo). The sample data were
obtained from the peripheral blood of 26 patients without
recurrence (AMI samples) and 21 controls with normal heart function
(control samples). The platform of the dataset was GPL570
(HG-u133pulus2; Affymetrix human genome U133). The DEGs were
analyzed by the GEO2R tool (https://www.ncbi.nlm.nih.gov/geo/geo2r/) in the AMI
and control groups, which were selected according to a threshold of
|log2FC| ≥0.5.
AMI specimens
Between January 1, 2020 and May 30, 2020, 31 cases
and 31 controls of whole blood samples were collected from the
Cardiovascular Department of Internal Medicine of Central Hospital
of Karamay (Karamay, China). The blood samples were collected from
first-time AMI patients within 48 h post-MI and controls (with a
normal echocardiogram). Patients that had history of cardiovascular
disease, or had clinical or biochemical evidence of other
comorbidities were excluded. Data of the patients and controls are
provided in Table SI.
Co-expression analysis
To construct a co-expression network, the Pearson
correlation coefficient (PCC) values of all combinations of the
28,492 unique probes from the GSE48060 series substrate were
calculated. Gene pairs with P≤0.05 were selected and the PCC
threshold was set to 0.88, corresponding to the 99th percentile of
the random PCC distribution as described above (22). According to a previous study
(23), the mutual rank (MR) value
between gene pairs was also calculated as another value of
co-expression to further reduce the number of false positives. Only
gene pairs with an absolute MR <10 were considered to be
important connections for the co-expression network. The
calculation was performed by Bioconductor in R (R version 3.6.2,
https://cran.r-project.org/bin/windows/base/old/3.6.2/).
To extract the acute myocardial infarction subnet dataset, 2 steps
were taken from the guide gene to extract the vicinity of the
network, as previously described by Mutwil et al (24). Cystoscope software (https://cytoscape.org/) was used to illustrate the
network.
Gene Ontology (GO) analysis
GO functional enrichment analysis (25,26)
was performed to obtain the genes associated with AMI and to
determine their functional terms in the cellular component (CC),
biological process (BP) and molecular function (MF) categories. The
functional terms for the GO enrichment analysis and expression
coherence (EC) analysis were retrieved from the Database for
Annotation, Visualization and Integrated Discovery (http://david.abcc.ncifcrf.gov/). For the GO
enrichment analysis, the significant differences of GO enrichment
by DEGs and co-expressed network genes were evaluated against a
background set consisting of 52 genes and 256 genes, respectively.
With multiple test correlations, FDR <0.05 for BP, MF and CC
were set as significance thresholds.
KEGG Disease and BioCyc analysis
KEGG Disease and BioCyc analysis of DEGs and
co-expression network genes were performed through using the KEGG
Orthology-Based on KOBAS 2.0 (27-30),
the results of the enrichment were analyzed by Fisher's exact test,
using P≤0.05 as the significance threshold.
Reverse transcription-quantitative
(RT-q)PCR
Complete RNA was extracted from the whole blood with
TRIzol® reagent (Sangon Biotech Co., Ltd.) and all mRNA
was subjected to RT and qPCR using a PrimeScript® RT
Master Mix Perfect Real Time kit (Takara Bio Inc.) and SYBR Green
Master Mix (Applied Biosystems; Thermo Fisher Scientific, Inc.),
respectively, according to the manufacturers' protocol. qPCR was
performed on an Applied Biosystems 7900HT Real-Time System (Applied
Biosystems; Thermo Fisher Scientific, Inc.). The program was as
follows: 2 min at 95˚C followed by 40 cycles of 20 sec at 95˚C and
30 sec at 60˚C. The genes were amplified using the following
specific primers: i) aldo-keto reductase family 1 member C3
(AKR1C3) gene, 5'-GAGACAAACGATGGGTGGACC-3' and
5'-TGGAACTCAAAAACCTGCACG-3'; ii) purinergic receptor P2Y12 (P2RY12)
gene, 5'-CACTGCTCTACACTGTCCTGT-3' and 5'-AGTGGTCCTGTTCCCAGTTTG-3';
iii) ribosomal protein S24 (RPS24) gene,
5'-ATGAACGACACCGTAACTATCCG-3' and 5'-CCGAATTTCTGTCTTAGGCACTG-3';
iv) acyl-CoA synthetase long chain family member 1 (ACSL1) gene,
5'-CGACGAGCCCTTGGTGTATTT-3' and 5'-GGTTTCCGAGAGCCTAAACAA-3'; v)
UDP-GlcNAc:βGal β-1,3-N-acetylglucosaminyltransferase 5 (B3GNT5)
gene, 5'-TTCAAGACTTTTGGATTGGTCGT-3' and
5'-CGGCTGTGTAGTCAGGGTAAG-3'; vi) maltase-glucoamylase (MGAM) gene,
5'-GCTCAGTGTTCTTCTGCTTGT-3' and 5'-CGTTGTCCTAGCATGTGTGGTA-3'; vii)
glyceraldehyde-3-phosphate dehydrogenase (GAPDH) gene,
5'-GGGAAACTGTGGCGTGAT-3' and 5'-GAGTGGGTGTCGCTGTTGA-3'. The results
were analyzed using the 2-ΔΔCq method (31).
ELISA
The collected blood samples were centrifuged at 22˚C
and 3,000 x g for 10 min. The supernatants were collected into 1.5
ml tubes and preserved at -80˚C for subsequent analysis. The
concentrations of AKR1C3, P2RY12, RPS24, ACSL1, B3GNT5 and MGAM
were interpolated from a standard curve using linear regression
analysis, according to the instructions of the ELISA kits (AKR1C3,
cat. no. JM-1169H1; P2RY12, cat. no. JM-1165H1; RPS24, cat. no.
JM-1162H1; ACSL1, cat. no. JM-1172H1; B3GNT5, cat. no. JM-1159H1;
MGAM, cat. no. JM-1188H1; JingMei Biotechnology Co., Ltd.). The
absorbance was measured at a wavelength of 450 nm using an ELx800
microplate spectrophotometer (BioTek Instruments, Inc.).
Statistical analysis
ELISA and RT-qPCR experimental data were expressed
as the mean ± standard deviation. Statistical significance was
evaluated using Student's t-test using GraphPad Prism 6.0 (GraphPad
Software, Inc.). P<0.05 was considered to indicate a
statistically significant difference.
Results
Data preprocessing and DEG
screening
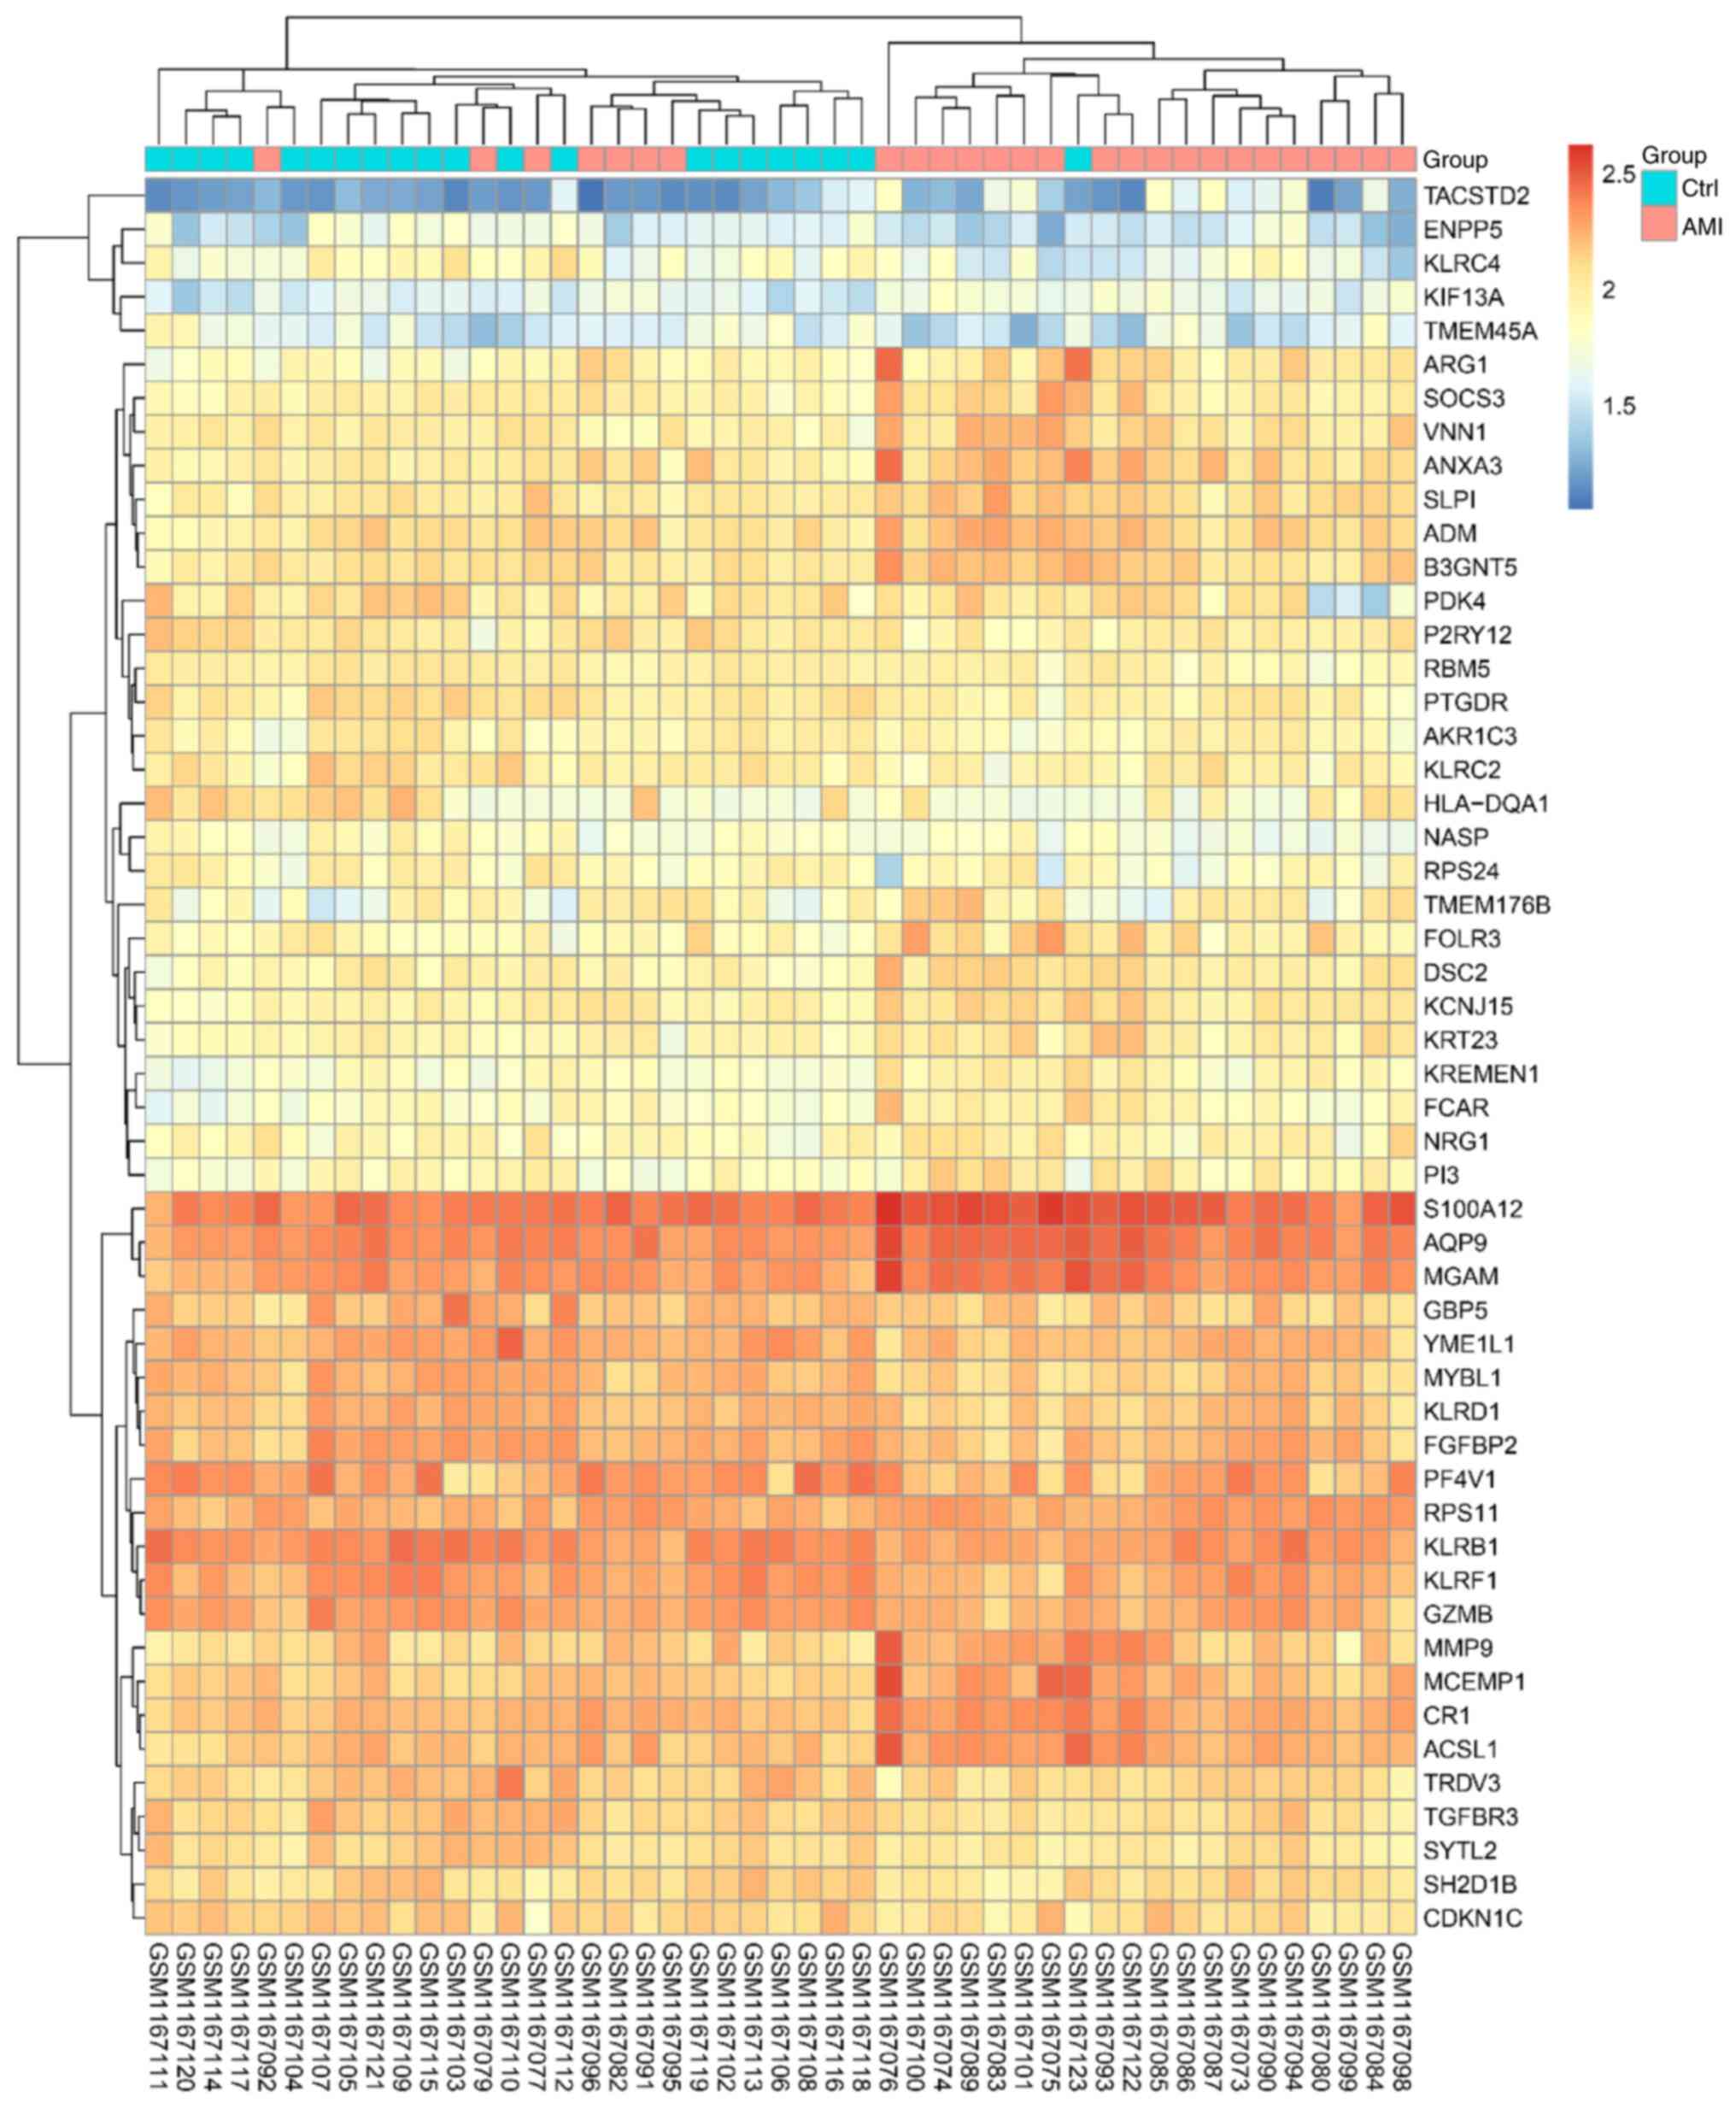
After data preprocessing, an expression matrix of
24,277 genes was obtained from 47 samples (Table SII). Under the threshold of
|log2FC| ≥0.5, a total of 52 DEGs were selected for subsequent
analysis, including 26 upregulated genes and 26 downregulated
genes. The heat map displaying the results of the gene expression
cluster analysis indicated that these DEGs were able to clearly
distinguish the two samples (Fig.
1 and Table SIII), indicating
that these DEGs were suitable for further use in the subsequent
analysis.
Functional enrichment of DEGs
GO analysis of 52 DEGs indicated that ‘MHC class I
protein complex binding’, ‘cellular response to prostaglandin D
stimulus’ and ‘natural killer cell-mediated immunity’ were
significantly enriched terms (Fig.
S1 and Table SIV).
Furthermore, KEGG Disease analysis was performed on the 52 obtained
DEGs and the results suggested that the DEGs were mainly involved
in cardiovascular diseases (Table
SV). In addition, BioCyc analysis revealed that these DEGs are
mainly related to cardenolide biosynthesis, glycosphingolipids
biosynthesis, fatty acid activation and glycogenolysis.
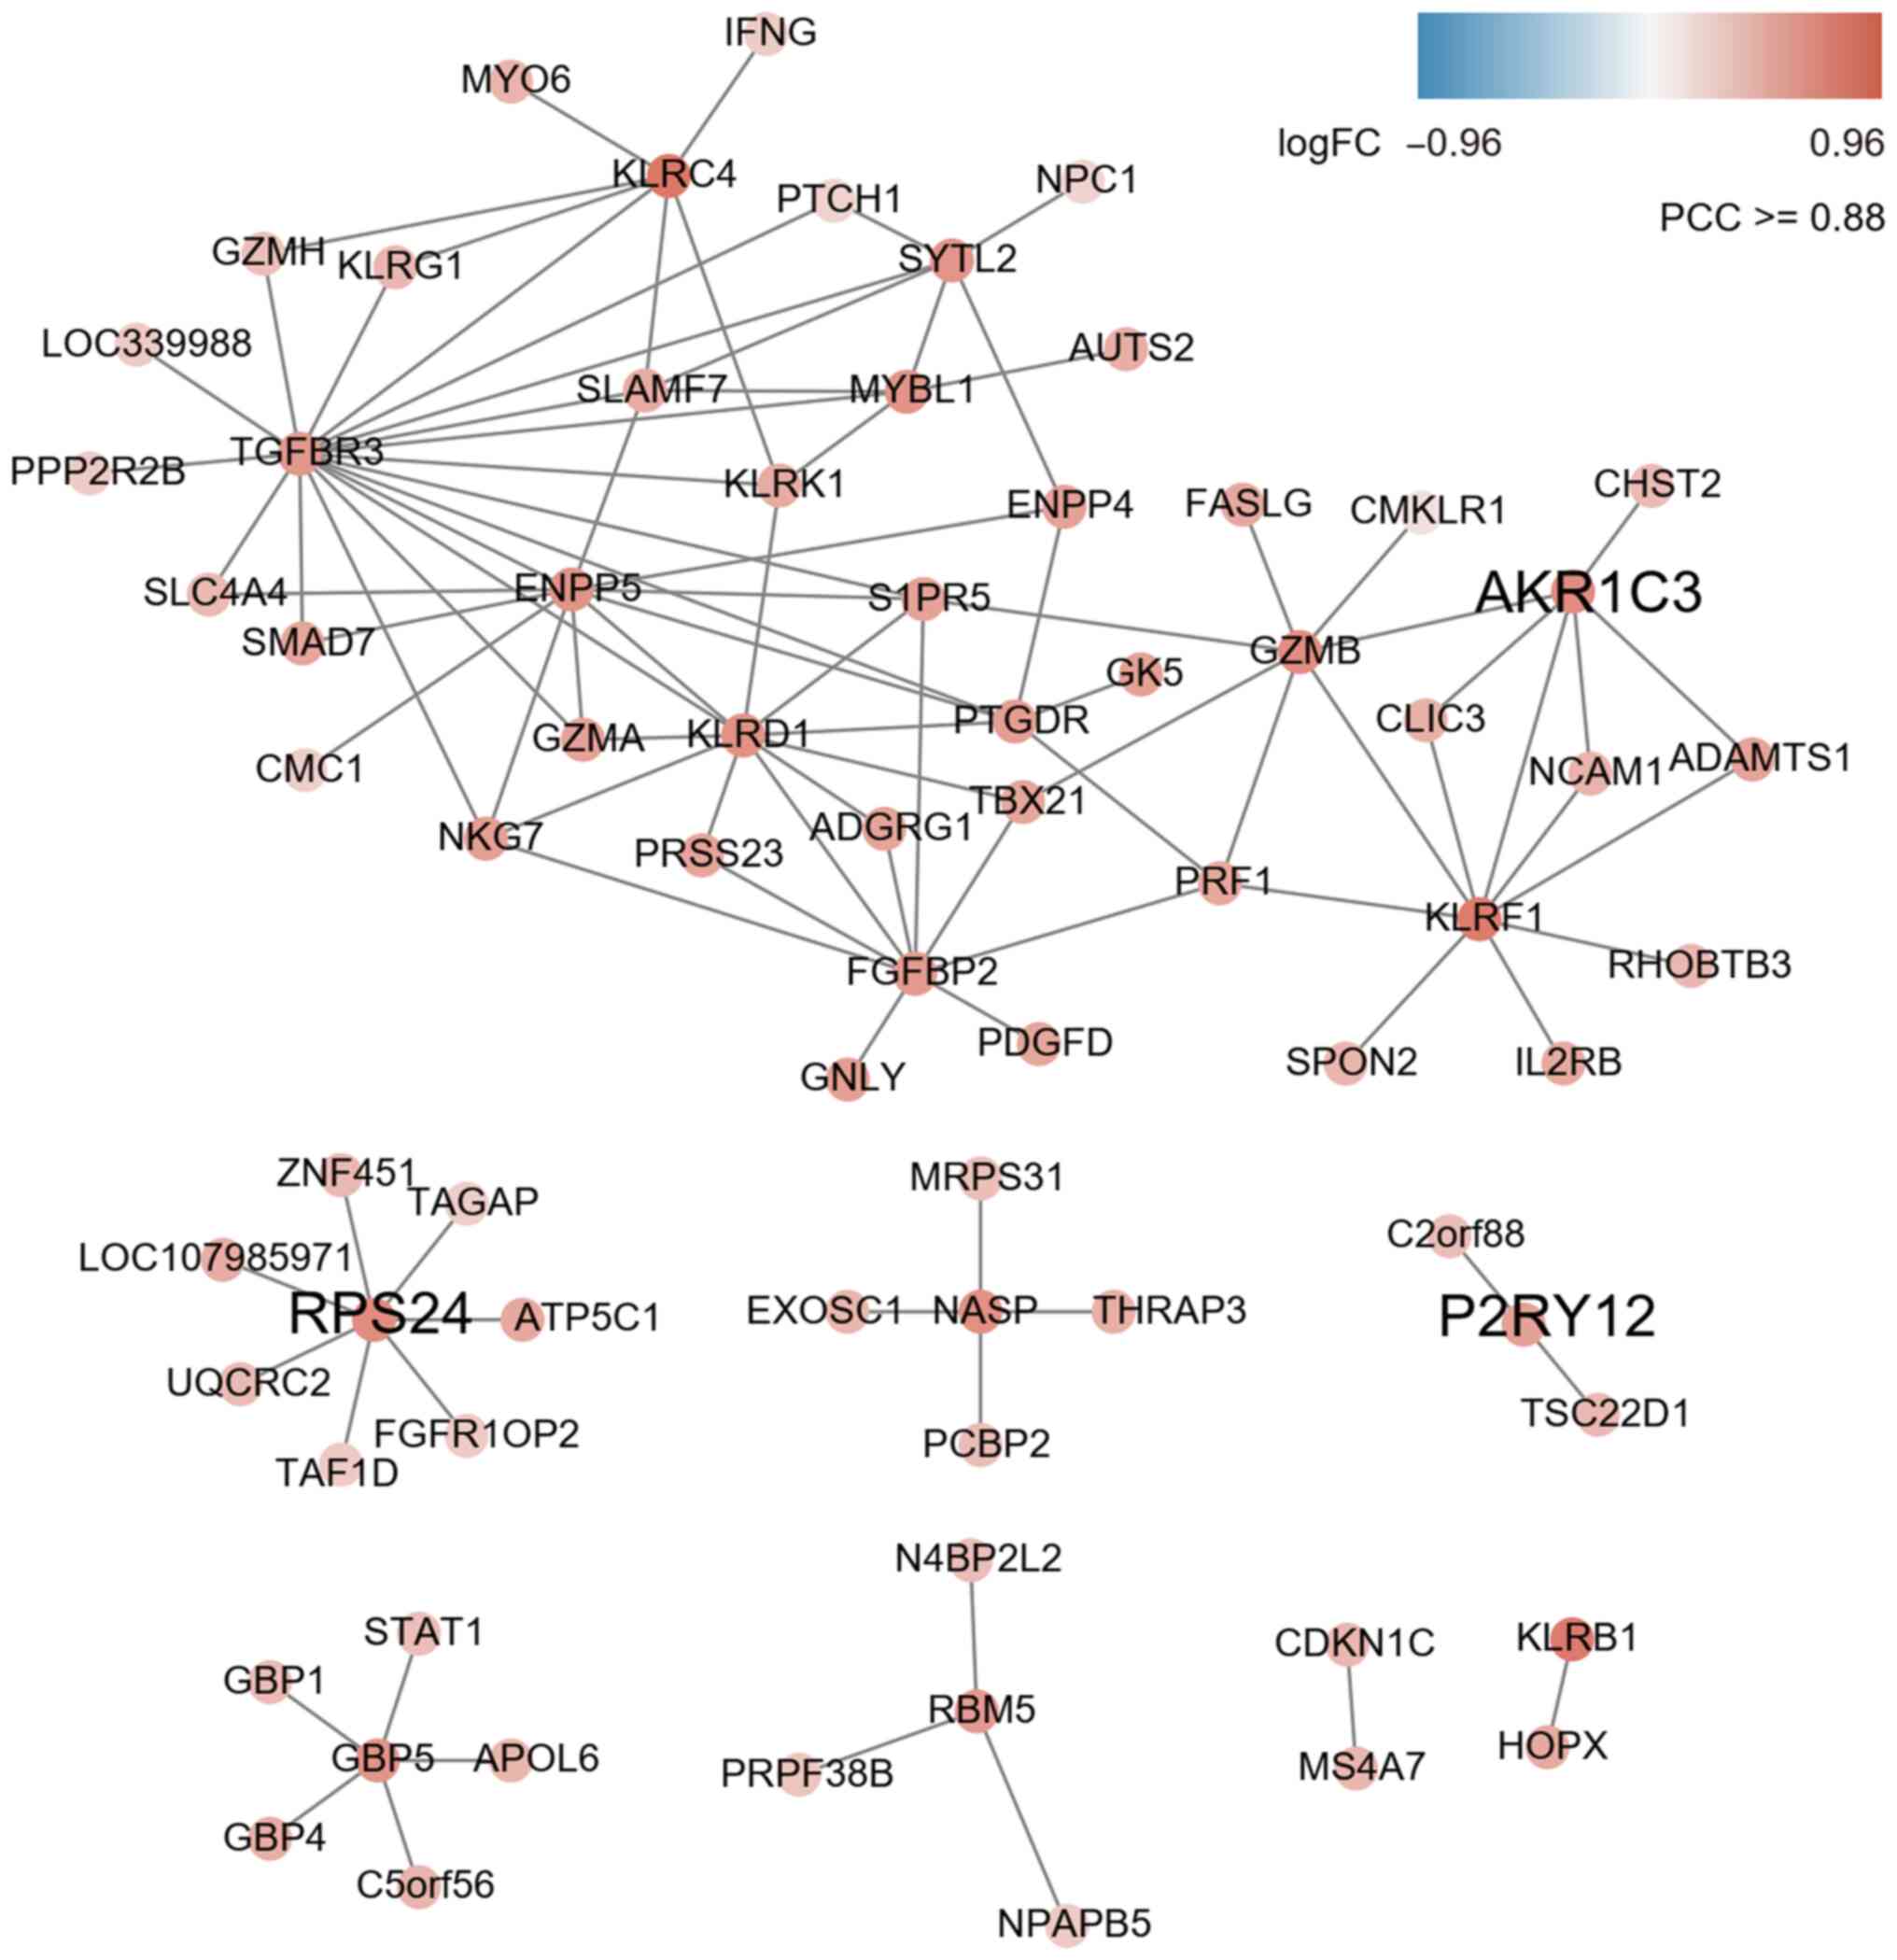
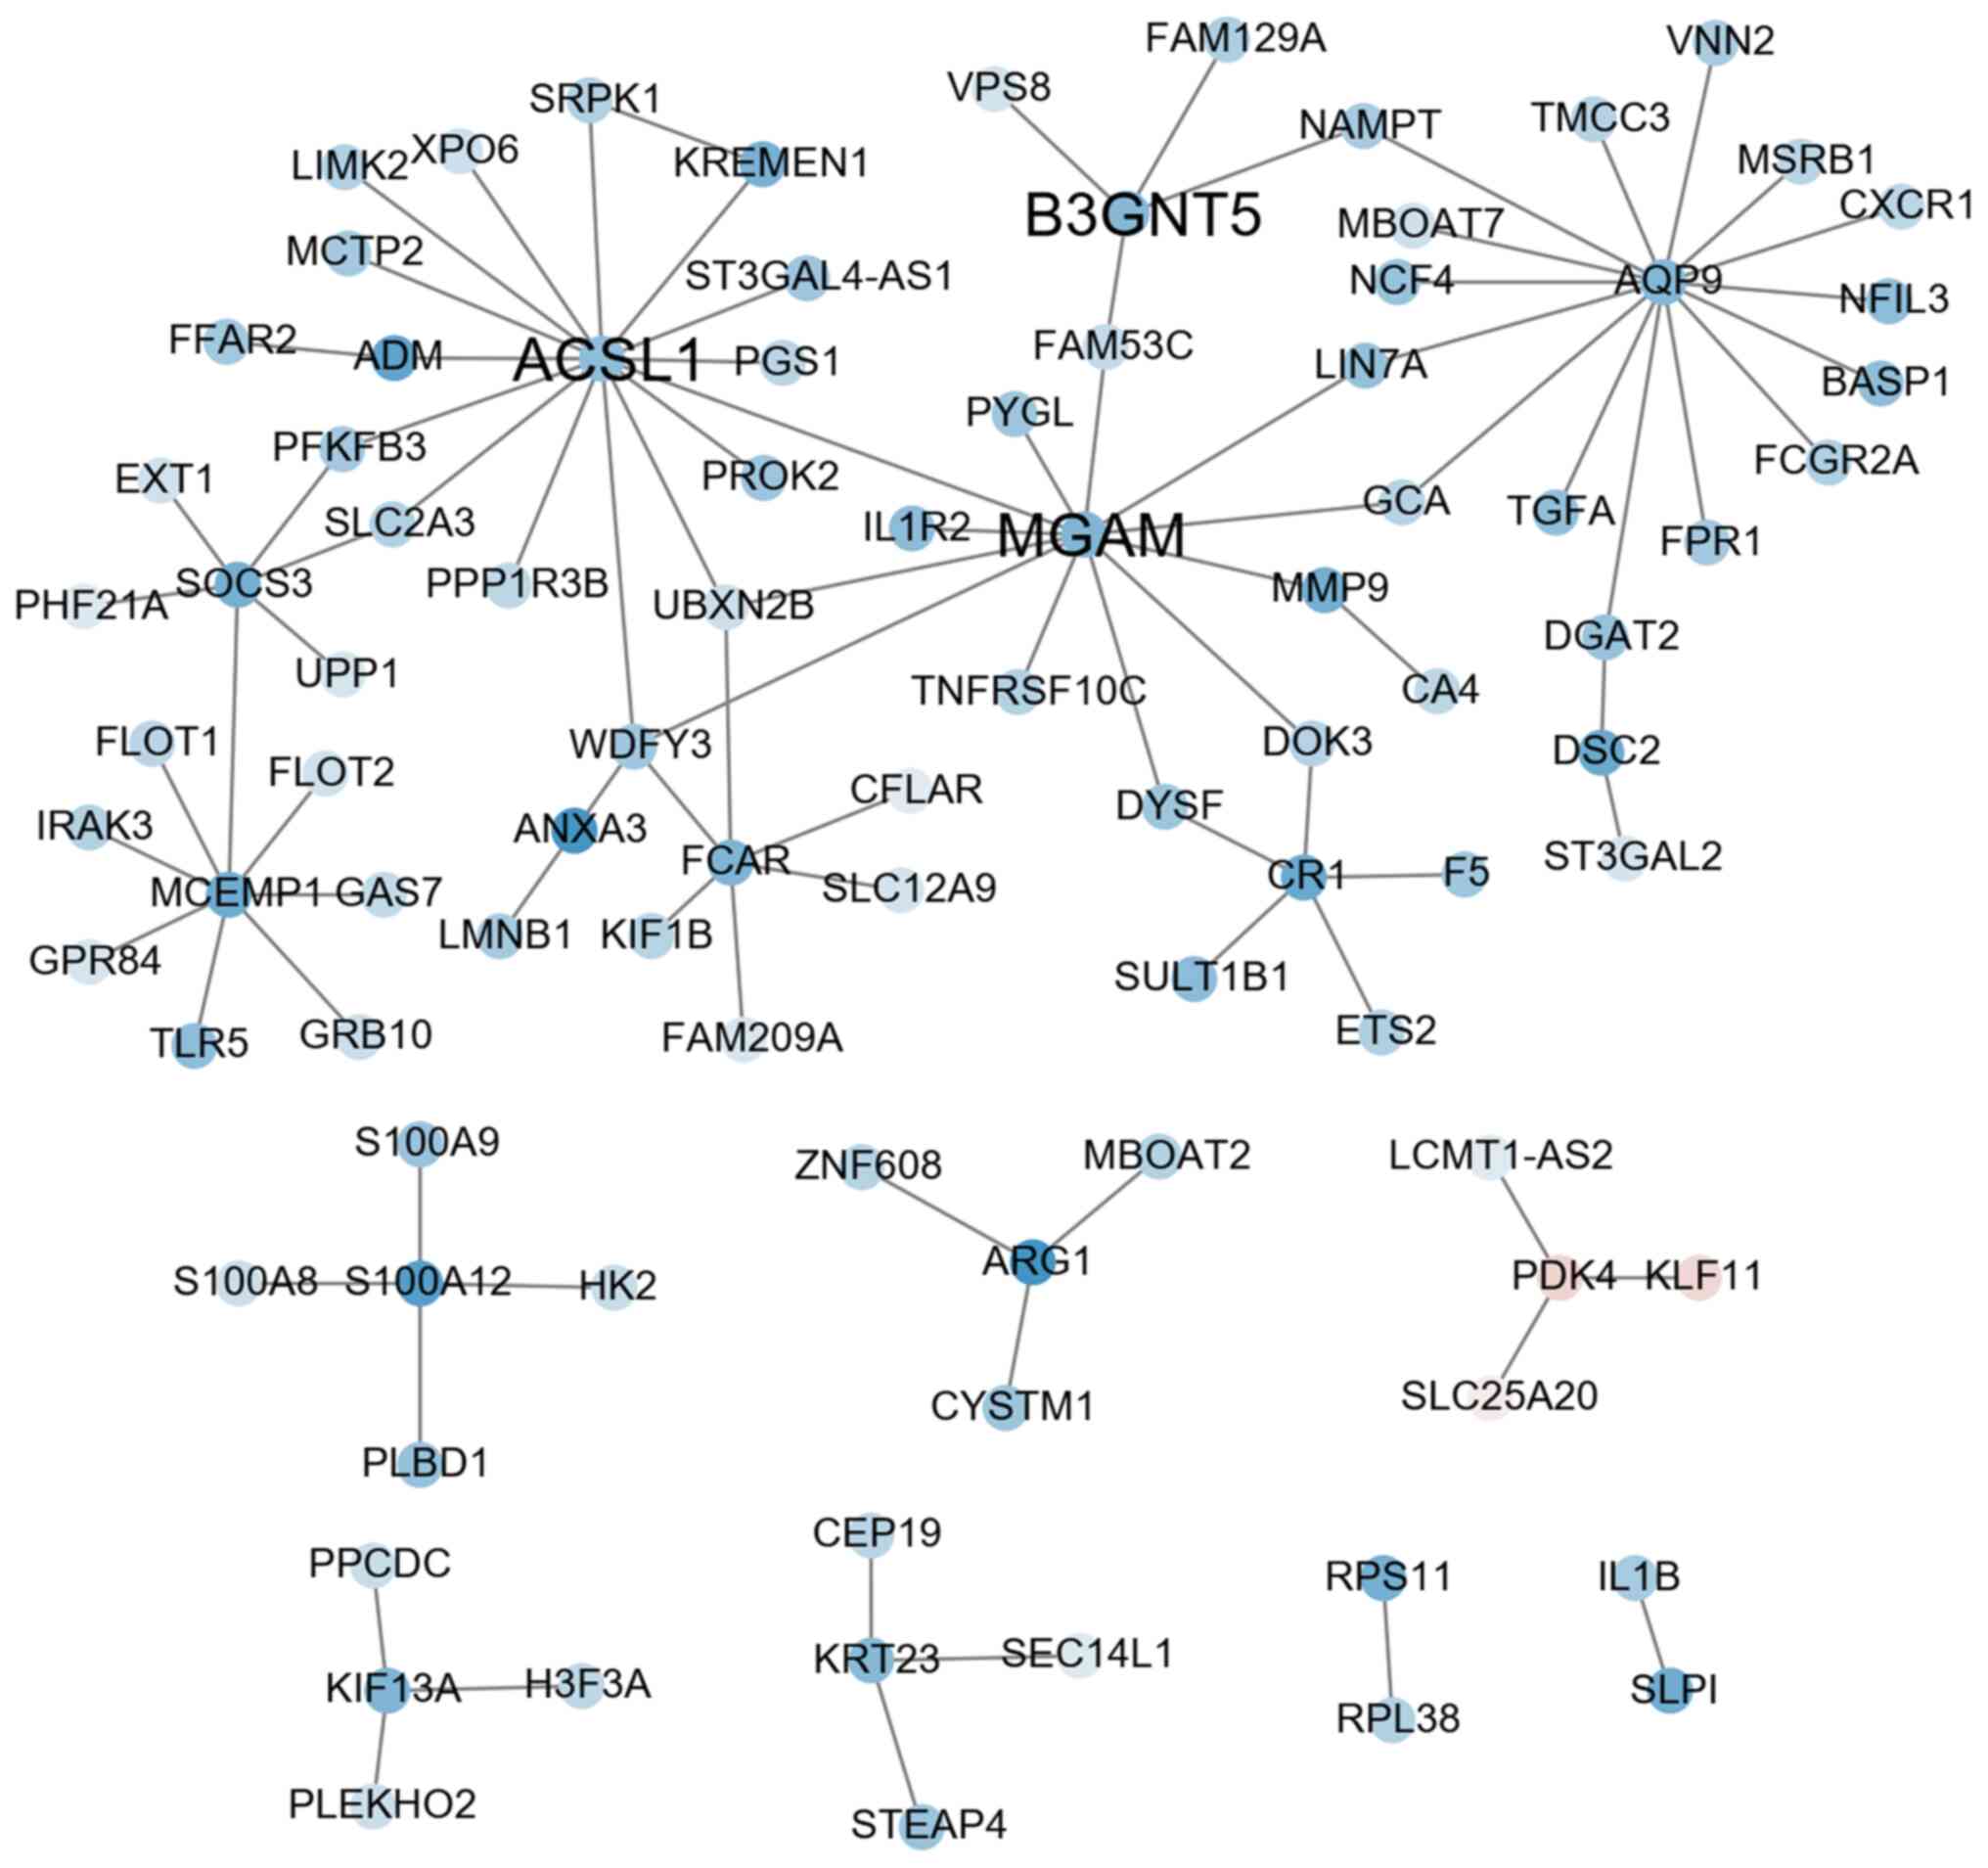
Co-expression network analysis
According to the character string database, the PCC
of all gene pairs was calculated and those with P<0.05 were
selected. Finally, 256 genes co-expressed with DEGs were obtained
through calculating the MR (≤10) and PCC ≥0.88 in each pair of
genes (as cutoff). The results of the co-expression network
analysis revealed that 8 gene modules were upregulated (marked in
red; Fig. 2) and 8 gene modules
were downregulated (marked in blue; Fig. 3). Among them, the expression levels
of AKR1C3, RPS24 and P2RY12 as key hub genes were upregulated
(Fig. 2 and Table SIII) and ACSL1, B3GNT5 and MGAM
were downregulated (Fig. 3 and
Table SIII).
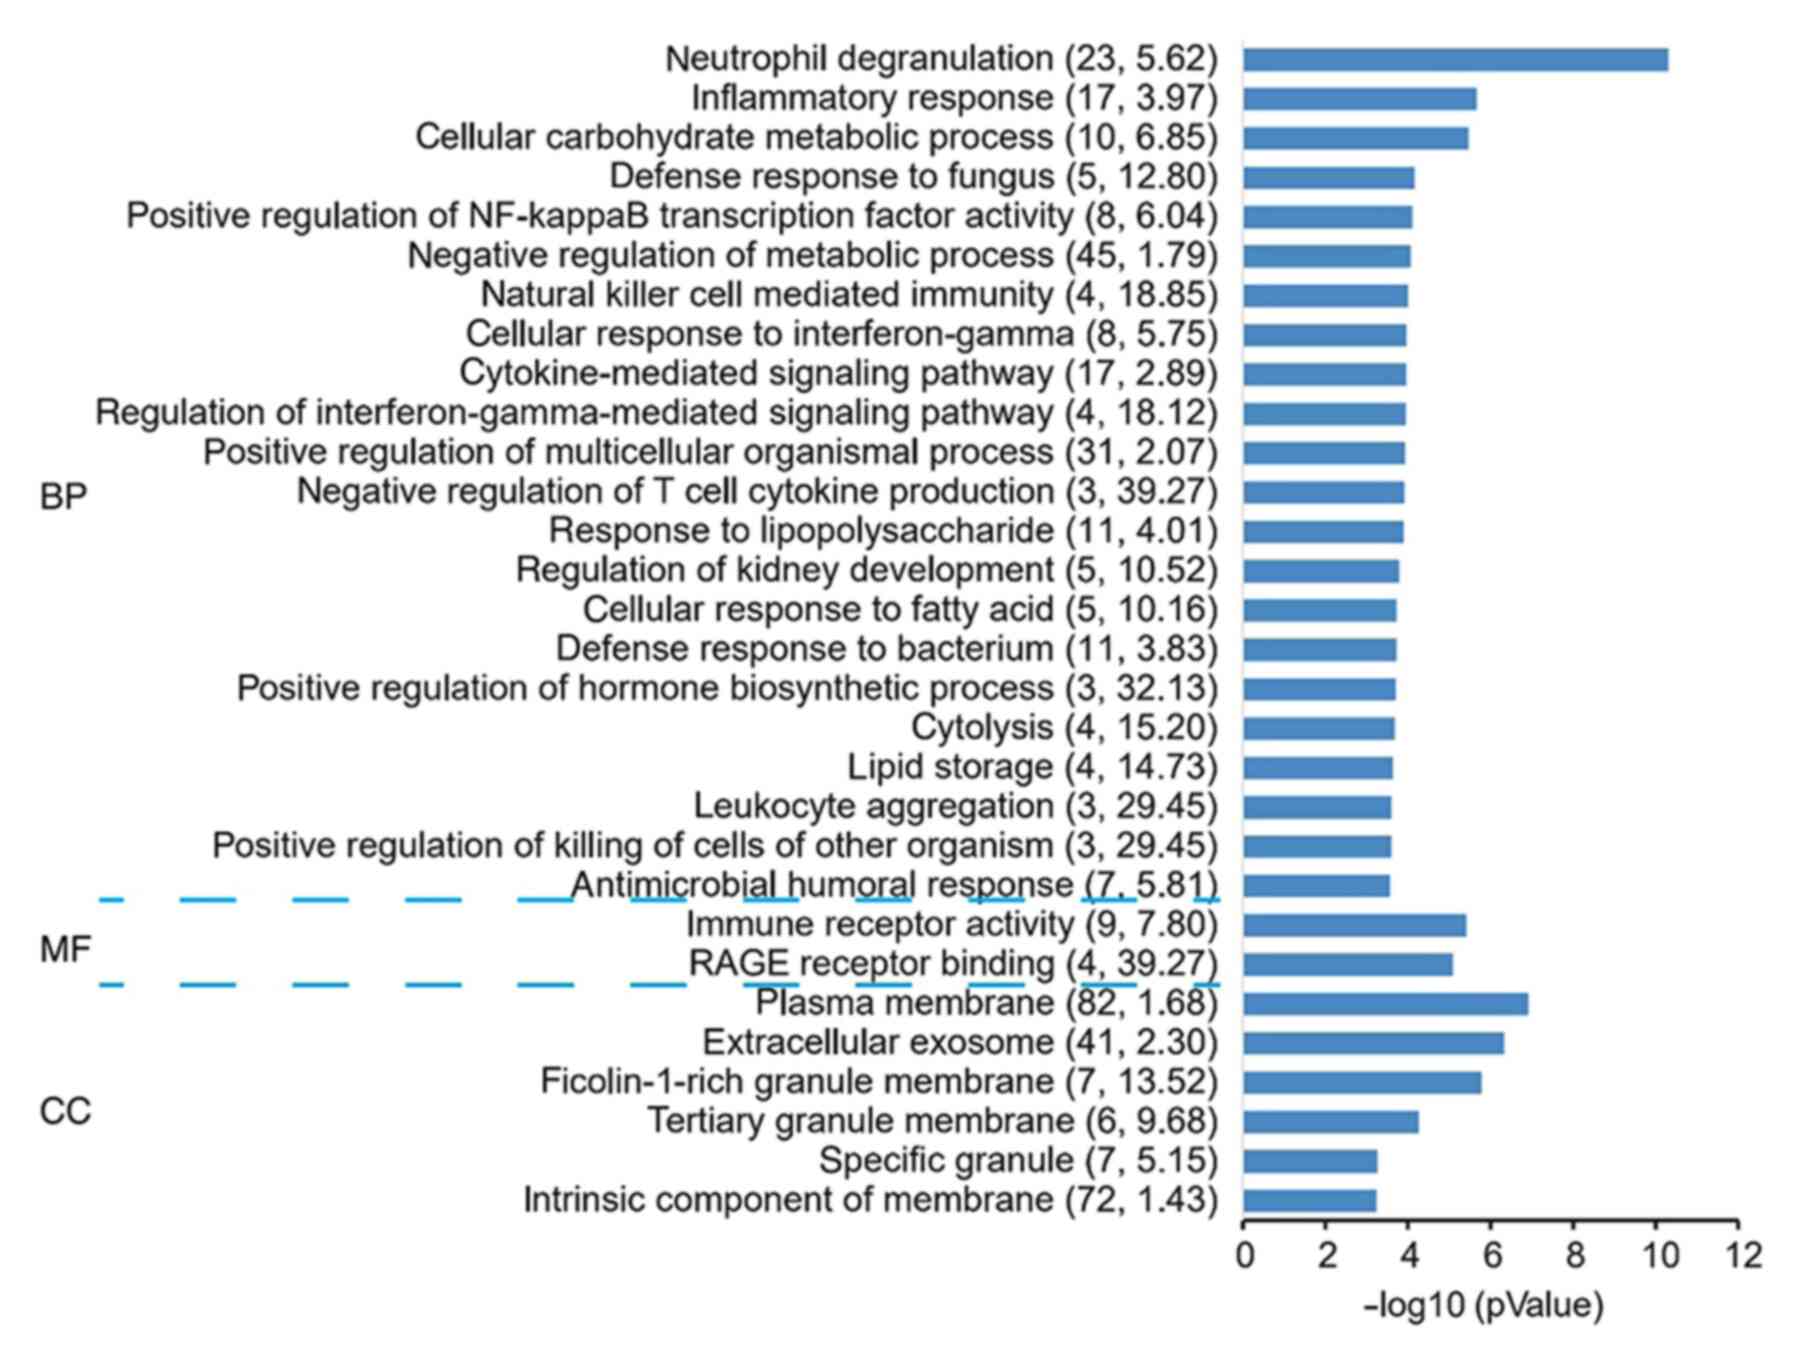
Functional enrichment of genes in
co-expression networks
Through analysis of the genes in this module by GO,
it was revealed that ‘RAGE receptor binding’, ‘positive regulation
of killing of cells of other organism’, ‘leukocyte aggregation’ and
‘negative regulation of T-cell cytokine production’ were
significantly enriched terms (Fig.
4 and Table SVI).
Furthermore, KEGG Disease and BioCyc analysis was
performed and a co-expression network was constructed, containing
256 genes. A total of three co-expression subnets centered on
upregulated genes (AKR1C3, RPS24 and P2RY12) and three
co-expression subnets centered on downregulated genes (ACSL1,
B3GNT5 and MGAM) were obtained. The genes with upregulated
expression had significant associations with functions such as
‘cardiovascular diseases’ and ‘cardenolide biosynthesis’ (Table I). The downregulated genes had
significant associations with functions such as ‘glycogenolysis’,
‘glycosphingolipids biosynthesis’ and ‘fatty acid activation’
(Table I). Of note, all of them
also participated in the enrichment of the 52 DEGs obtained by the
KEGG and BioCyc analysis in the present study. This suggested that
certain genes that have not been previously reported to be involved
in AMI may be mined from reported microarray data and novel
interactions between these genes may also be identified from the
connections in the network. AMI development is a distinct
biological event and co-expression network analysis may have the
greatest potential for identifying gene interactions in AMI.
 | Table IKEGG Disease and BioCyc analysis of
co-expressed genes with differentially expressed genes. |
Table I
KEGG Disease and BioCyc analysis of
co-expressed genes with differentially expressed genes.
| Term | Database | Input number | Background
number | P-value | Input |
|---|
| Cardiovascular
diseases | KEGG Disease | 5 | 342 | 0.00375 | IFNG|HK2|RPS24|
F5|P2RY12 |
| Triacylglycerol
biosynthesis | BioCyc | 3 | 26 | 0.000086 | MBOAT2|DGAT2|
MBOAT7 |
| Glycogenolysis | BioCyc | 2 | 7 | 0.000305 | MGAM|PYGL |
| CDP-diacylglycerol
biosynthesis | BioCyc | 2 | 17 | 0.00142 | MBOAT2|MBOAT7 |
| Super pathway of
glycosphingolipids biosynthesis | BioCyc | 2 | 25 | 0.002869 | ST3GAL2|
B3GNT5 |
| Fructose
2,6-bisphosphate synthesis | BioCyc | 1 | 5 | 0.017499 | PFKFB3 |
| Allopregnanolone
biosynthesis | BioCyc | 1 | 6 | 0.020386 | AKR1C3 |
| Pyrimidine
ribonucleosides degradation | BioCyc | 1 | 6 | 0.020386 | UPP1 |
| Coenzyme A
biosynthesis | BioCyc | 1 | 6 | 0.020386 | PPCDC |
| Cardenolide
biosynthesis | BioCyc | 1 | 6 | 0.020386 | AKR1C3 |
| Globo-series
glycosphingolipids biosynthesis | BioCyc | 1 | 8 | 0.026134 | ST3GAL2 |
| Lacto-series
glycosphingolipids biosynthesis | BioCyc | 1 | 8 | 0.026134 | B3GNT5 |
| Chondroitin sulfate
biosynthesis (late stages) | BioCyc | 1 | 9 | 0.028995 | CHST2 |
| Ganglio-series
glycosphingolipids biosynthesis | BioCyc | 1 | 9 | 0.028995 | ST3GAL2 |
| Androgen
biosynthesis | BioCyc | 1 | 11 | 0.034693 | AKR1C3 |
| Neolacto-series
glycosphingolipids biosynthesis | BioCyc | 1 | 13 | 0.040358 | B3GNT5 |
| Icosapentaenoate
biosynthesis II (metazoa) | BioCyc | 1 | 13 | 0.040358 | ACSL1 |
| BMP signaling
pathway | BioCyc | 1 | 13 | 0.040358 | SMAD7 |
| Gamma-linolenate
biosynthesis | BioCyc | 1 | 14 | 0.043178 | ACSL1 |
| Fatty acid
activation | BioCyc | 1 | 15 | 0.04599 | ACSL1 |
| Arachidonate
biosynthesis III (metazoa) | BioCyc | 1 | 16 | 0.048793 | ACSL1 |
Expression of hub genes in AMI
specimens
To further investigate the mRNA and protein levels
of hub genes in patients with AMI, the protein levels of AKR1C3,
RPS24, P2RY12, ACSL1, B3GNT5 and MGAM were assessed in 31 AMI
patients (20 males and 11 females, age from 49 to 82, medians: 70)
and 31 normal individuals (17 males and 14 females, age from 46 to
83, medians: 68) of whole blood samples using ELISA. As depicted in
Fig. 5, AKR1C3 and P2RY12 content
were significantly increased in patients with AMI relative to that
in the normal adjacent group (P<0.01; Fig. 5A and B), while the increase in RPS24 content
was not significant (Fig. 5C). The
contents of ACSL1 and MGAM were slightly decreased in patients with
AMI (Fig. 5D and F), but only the B3GNT5 content was
significantly decreased (P<0.05; Fig. 5E). Further verification at the mRNA
levels by RT-qPCR indicated that the relative expression of AKR1C3,
RPS24 and P2RY12 was significantly increased in patients with AMI
relative to that of the normal adjacent group (P<0.01; Fig. S2A-C). By contrast, the relative
expression of ACSL1, B3GNT5 and MGAM was significantly decreased in
patients with AMI (P<0.01; Fig.
S2D-F). These findings were consistent with the data of the
microarray expression profiles.
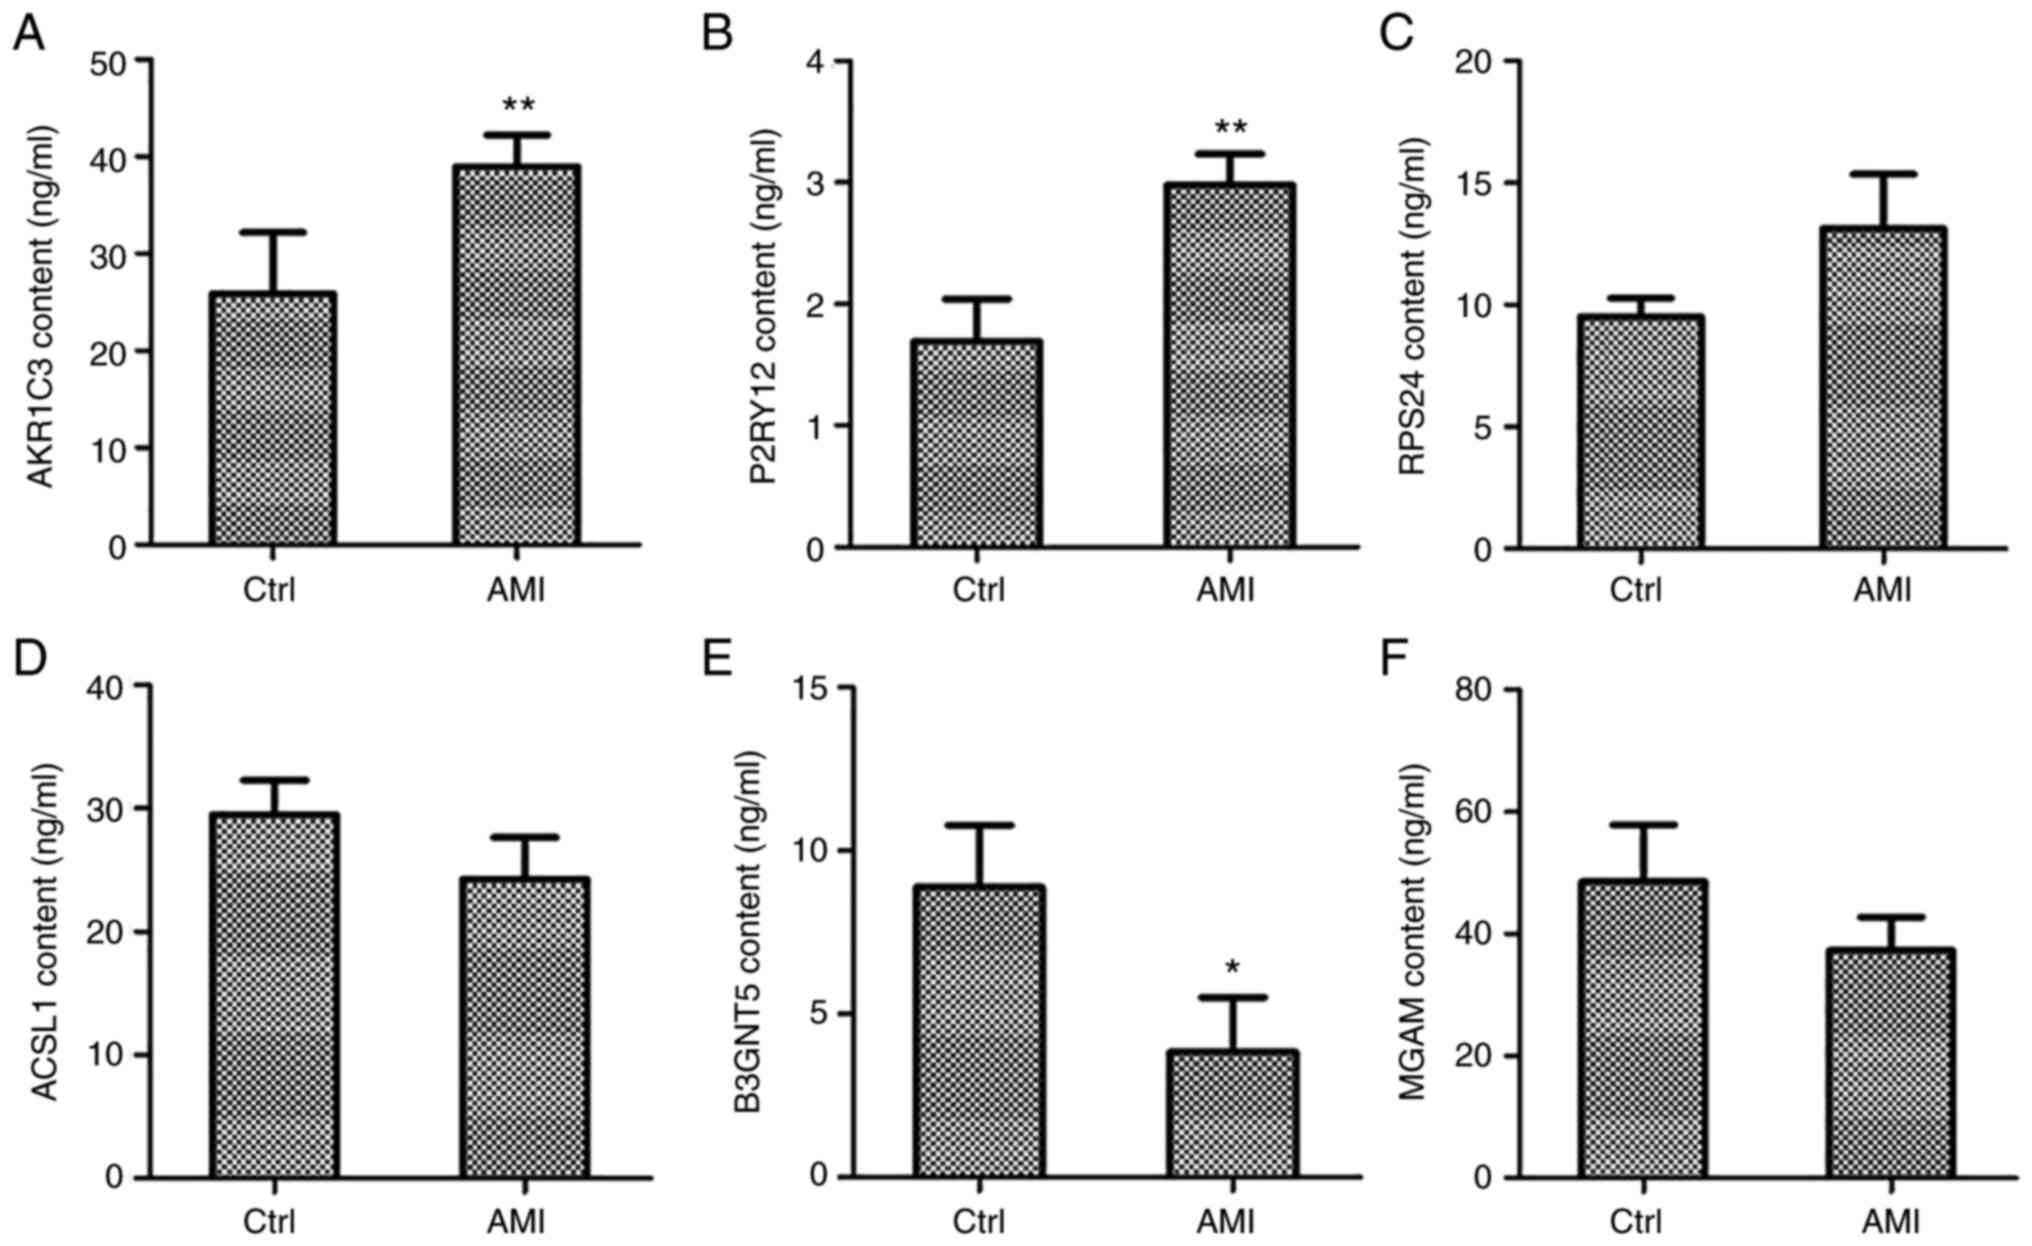 | Figure 5Co-expression network genes were
analyzed in whole blood collected from patients with AMI and
controls with a normal echocardiogram via ELISA. Protein levels of
three upregulated genes, namely (A) AKR1C3, (B) P2RY12 and (C)
RPS24, and three downregulated genes, namely (D) ACSL1, (E) B3GNT5
and (F) MGAM, were measured by ELISA. *P<0.05,
**P<0.01 vs. Ctrl. AMI, acute myocardial infarction;
Ctrl, control. AKR1C3, aldo-keto reductase family 1 member C3;
P2RY12, purinergic receptor P2Y12; RPS24, ribosomal protein S24;
ACSL1, acyl-CoA synthetase long chain family member 1; B3GNT5,
UDP-GlcNAc:βGal β-1,3-N-acetylglucosaminyltransferase 5; MGAM,
maltase-glucoamylase. |
Discussion
AMI is a serious cardiovascular disease that poses a
serious threat to human life; it may cause congestive heart failure
and malignant arrhythmias, leading to high morbidity and mortality
(32). Although thrombolysis and
percutaneous coronary intervention may improve the prognosis of
patients with AMI, numerous patients eventually develop heart
failure or arrhythmia due to unknown etiology (33). Looking for potential diagnostic
biomarkers of AMI and possible regulatory targets may help reduce
the mortality of AMI. The systematic biological analysis of gene
expression profiles provides a useful method for elucidating the
possible mechanisms of myocardial infarction from the perspective
of gene regulation (34). Using
gene expression profiles, sufficient information concerning changes
in gene expression associated with disease may be obtained.
Kiliszek et al (35)
performed microarray methods to demonstrate that, during
ST-elevation myocardial infarction, numerous genes exhibit altered
expression, including those involved in platelet function,
lipid/glucose metabolism and atherosclerotic plaque stability.
Based on the systematic level of gene expression profiling, gene
co-expression network analysis may be used as an alternative method
for analyzing profiling data to gain a deeper understanding of the
molecular regulatory mechanisms of heart disease caused by
myocardial infarction (7,36). The present study used GO, pathway
enrichment, KEGG Disease and BioCyc analysis methods to explore the
molecular mechanisms of myocardial infarction-induced heart
disease.
Gene co-expression network analysis has also been
used to study changes in transcriptome expression patterns in
complex diseases (37,38). Compared with the standardized
analysis of DEGs (the purpose of which is to detect individual
genes associated with disease), co-expression network analysis aims
to identify higher associations between gene products. In addition,
its algorithm may markedly simplify the multiple testing problems
that are unavoidable in the gene-centric standard microarray
expression profiling data analysis method (39). Therefore, it is a powerful system
analysis method, focusing on the relevant functions of the network
module.
Using the above-mentioned bioinformatics methods, GO
analysis, pathway function network and gene module changes of
patients with AMI were analyzed to explore the potential diagnostic
biomarkers and possible regulatory targets of AMI. Based on the
gene expression profile (12), a
gene co-expression network was constructed and co-expression
network analysis was used to detect peripheral blood gene modules
when AMI occurred. In the present study, AKR1C3, RPS24 and P2RY12
were increased and ACSL1, B3GNT5 and MGAM were decreased in
patients with AMI, which was also confirmed by RT-qPCR and ELISA,
highlighting their potential role as biomarkers of cardiac illness.
It was observed that the upregulated genes AKR1C3, RPS24 and P2RY12
were mainly involved in cardenolide biosynthesis and cardiovascular
diseases. Accumulating evidence suggests that AKR1C3 has an
important role in hormone-dependent and hormone-independent cancers
(40). RPS24c facilitates tumor
angiogenesis via the RPS24c/MVIH/PGK1 pathway in colorectal cancer
(41). P2RY12 is a gene encoding
P2Y12 receptor present on platelets, which has an essential role in
potentiating platelet responses initiated by other activators such
as thromboxane and thrombin (42).
Mutations in the P2RY12 gene have been demonstrated to be
associated with bleeding disorders (43). To date, research has focused on the
effects of P2RY12 variants in response to clopidogrel and
thrombotic diseases.
In addition, the three genes whose expression was
downregulated, ACSL1, B3GNT5 and MGAM, were associated with
glycogenolysis, glycosphingolipids biosynthesis and fatty acid
activation. ACSL1 exists in cells of the liver, heart and fat, as
is considered to affect activation fatty acid synthesis of
triglycerides through the peroxisome proliferator-activated
receptor γ pathway (44). B3GNT5
has been suggested as the key glycosyltransferase in the
biosynthesis of the (neo-)lacto series of glycosphingolipid in
regulating malignancy of glioblastoma multiforme (45). This result implies that the
etiology of AMI is associated with genes related to intravascular
disease, immune response and brain-derived factor regulation
system, suggesting that ACSL1, B3GNT5 and MGAM may be also used as
biomarkers for gene expression in early AMI. Previous studies have
researched DEGs in AMI; however, differential expression may not
mean that any of these genes are suitable biomarkers.
Although the present analysis is powerful, the
present study has certain limitations. First, the analytic data
originate from a microarray chip and not from RNA sequencing. Of
note, microarray chips are not able to discover new genes.
Furthermore, the sample size of the dataset was relatively small.
Thus, certain potential targets of AMI may have been missed in the
present analysis. In addition, although hub genes were identified
and a co-expression network analysis was performed, the
hierarchical processes between them have remained to be fully
elucidated. A potent biomarker of AMI should have high sensitivity
and specificity to reduce false positives or false negatives.
However, the present study did not evaluate the sensitivity and
specificity of these genes. In order to identify potential
biomarkers of AMI, further studies with larger sample sizes are
still warranted.
In conclusion, the present findings provide
important information for the prediction of molecular events
related to AMI, as well as potential biomarkers for detection and
prevention. The hub genes AKR1C3, RPS24, P2RY12, ACSL1, B3GNT5 and
MGAM may be considered biomarkers to assess the severity of heart
disease and may be promising therapeutic targets to develop novel
treatments.
Supplementary Material
GO term analysis in the categories BP,
MF and CC for the differentially expressed genes in acute
myocardial infarction. The negative logarithm of the P-value
(x-axis) indicates the significance of the gene set belonging to
predefined categories under the 52-gene background. The y-axis
represents each GO category. The gene number and EC value of the
category in the subnetwork are presented in brackets. GO, Gene
Ontology; BP, biological process; MF, molecular function; CC,
cellular component; EC, expression coherence.
mRNA expression of differentially
expressed genes in AMI. Expression of three upregulated genes (A)
AKR1C3, (B) P2RY12 (C) RPS24 and three downregulated genes (D)
ACSL1, (E) B3GNT5 and (F) MGAM in AMI vs. Ctrl was validated via
reverse transcription-quantitative PCR. **P<0.01.
AMI, acute myocardial infarction; Ctrl, control; AKR1C3, aldo-keto
reductase 1 C3; RPS24, ribosomal protein S24; P2RY12, purinergic
receptor P2Y12; ACSL1, acyl-CoA synthetase long chain family member
1; B3GNT5, UDP-GlcNAc: βGal β-1,3-N-acetylglucosaminyltransferase
5; MGAM, maltase-glucoamylase.
The information of AMI patients and
controls.
Samples in patient and control
groups.
Differentially expressed genes in
patient and control groups.
Gene Ontology term analysis of
co-expression network genes in acute myocardial infarction.
KEGG DISEASE and BioCyc analysis of
differentially expressed genes.
Gene Ontology term analysis of
differentially expressed genes in acute myocardial infarction.
Acknowledgements
The authors are grateful to Dr Yong Ye from Shanghai
East Hospital Tongji University for his professional statistical
advice.
Funding
Funding: This study was supported by research grants from the
Chinese National Natural Science Foundation (grant nos. 81900245,
81770395 and 81800224).
Availability of data and materials
The datasets used and/or analyzed during the current
study are available from the corresponding author on reasonable
request.
Authors' contributions
ZD and XL designed the study. ZH, RL, HH, XD, GL,
YW, YJ and SX analyzed the data. ZD, GL, YW and YJ wrote the
manuscript. ZD, XL and SX revised the manuscript. XL and ZH confirm
the authenticity of all the raw data. All authors have read and
approved the final manuscript.
Ethics approval and consent to
participate
Patients with AMI and controls provided written
informed consent prior to use their blood samples in this study.
This study was approved by the Ethics Committee of the Central
Hospital of Karamay (Karamay, China; ethics approval code:
YL-2020-2).
Patient consent for publication
Not applicable.
Competing interests
The authors declare that they have no competing
interests.
References
|
1
|
Reed GW, Rossi JE and Cannon CP: Acute
myocardial infarction. Lancet. 389:197–210. 2017.PubMed/NCBI View Article : Google Scholar
|
|
2
|
Castro-Dominguez Y, Dharmarajan K and
McNamara RL: Predicting death after acute myocardial infarction.
Trends Cardiovasc Med. 28:102–109. 2018.PubMed/NCBI View Article : Google Scholar
|
|
3
|
Shibata T, Kawakami S, Noguchi T, Tanaka
T, Asaumi Y, Kanaya T, Nagai T, Nakao K, Fujino M, Nagatsuka K, et
al: Prevalence, clinical features, and prognosis of acute
myocardial infarction attributable to coronary artery embolism.
Circulation. 132:241–250. 2015.PubMed/NCBI View Article : Google Scholar
|
|
4
|
Henry P, Lamhaut L, Delmas C and Belle L:
Can we still die from acute myocardial infarction in 2020? Reflex
mobile cardiac assistance unit or local team for ECMO implantation?
Arch Cardiovasc Dis. 112:733–737. 2019.PubMed/NCBI View Article : Google Scholar
|
|
5
|
Abdelaziz HK, Patel B, Chalil S and
Choudhury T: COVID-19 pandemic and acute myocardial infarction:
Management protocol from a british cardiac centre. Crit Pathw
Cardiol. 19:55–57. 2020.PubMed/NCBI View Article : Google Scholar
|
|
6
|
Johansson S, Rosengren A, Young K and
Jennings E: Mortality and morbidity trends after the first year in
survivors of acute myocardial infarction: A systematic review. BMC
Cardiovasc Disord. 17(53)2017.PubMed/NCBI View Article : Google Scholar
|
|
7
|
Liu Z, Ma C, Gu J and Yu M: Potential
biomarkers of acute myocardial infarction based on weighted gene
co-expression network analysis. Biomed Eng Online.
18(9)2019.PubMed/NCBI View Article : Google Scholar
|
|
8
|
Bavia L, Lidani KCF, Andrade FA, Sobrinho
MIAH, Nisihara RM and de Messias-Reason IJ: Complement activation
in acute myocardial infarction: An early marker of inflammation and
tissue injury? Immunol Lett. 200:18–25. 2018.PubMed/NCBI View Article : Google Scholar
|
|
9
|
Xue S, Zhu W, Liu D, Su Z, Zhang L, Chang
Q and Li P: Circulating miR-26a-1, miR-146a and miR-199a-1 are
potential candidate biomarkers for acute myocardial infarction. Mol
Med. 25(18)2019.PubMed/NCBI View Article : Google Scholar
|
|
10
|
Xue S, Liu D, Zhu W, Su Z, Zhang L, Zhou C
and Li P: Circulating MiR-17-5p, MiR-126-5p and MiR-145-3p are
novel biomarkers for diagnosis of acute myocardial infarction.
Front Physiol. 10(123)2019.PubMed/NCBI View Article : Google Scholar
|
|
11
|
Bukauskas T, Mickus R, Cereskevicius D and
Macas A: Value of serum miR-23a, miR-30d, and miR-146a biomarkers
in ST-Elevation myocardial infarction. Med Sci Monit. 25:3925–3932.
2019.PubMed/NCBI View Article : Google Scholar
|
|
12
|
Suresh R, Li X, Chiriac A, Goel K, Terzic
A, Perez-Terzic C and Nelson TJ: Transcriptome from circulating
cells suggests dysregulated pathways associated with long-term
recurrent events following first-time myocardial infarction. J Mol
Cell Cardiol. 74:13–21. 2014.PubMed/NCBI View Article : Google Scholar
|
|
13
|
Gao Y, Qi GX, Guo L and Sun YX:
Bioinformatics analyses of differentially expressed genes
associated with acute myocardial infarction. Cardiovasc Ther.
34:67–75. 2016.PubMed/NCBI View Article : Google Scholar
|
|
14
|
Xiang S, Huang Z, Wang T, Han Z, Yu CY, Ni
D, Huang K and Zhang J: Condition-specific Gene Co-Expression
network mining identifies key pathways and regulators in the brain
tissue of Alzheimer's disease patients. BMC Med Genomics. 11 (Suppl
6)(S115)2018.PubMed/NCBI View Article : Google Scholar
|
|
15
|
Ma C, Lv Q, Teng S, Yu Y, Niu K and Yi C:
Identifying key genes in rheumatoid arthritis by weighted gene
Co-Expression network analysis. Int J Rheum Dis. 20:971–979.
2017.PubMed/NCBI View Article : Google Scholar
|
|
16
|
Saris CG, Horvath S, van Vught PW, van Es
MA, Blauw HM, Fuller TF, Langfelder P, DeYoung J, Wokke JH, Veldink
JH, et al: Weighted gene co-expression network analysis of the
peripheral blood from amyotrophic lateral sclerosis patients. BMC
Genomics. 10(405)2009.PubMed/NCBI View Article : Google Scholar
|
|
17
|
Azuaje F, Zhang L, Jeanty C, Puhl SL,
Rodius S and Wagner DR: Analysis of a gene co-expression network
establishes robust association between Col5a2 and ischemic heart
disease. BMC Med Genomics. 6(13)2013.PubMed/NCBI View Article : Google Scholar
|
|
18
|
Malki K, Tosto MG, Jumabhoy I, Lourdusamy
A, Sluyter F, Craig I, Uher R, McGuffin P and Schalkwyk LC:
Integrative mouse and human mRNA studies using WGCNA nominates
novel candidate genes involved in the pathogenesis of major
depressive disorder. Pharmacogenomics. 14:1979–1990.
2013.PubMed/NCBI View Article : Google Scholar
|
|
19
|
Udyavar AR, Hoeksema MD, Clark JE, Zou Y,
Tang Z, Li Z, Li M, Chen H, Statnikov A, Shyr Y, et al:
Co-expression network analysis identifies spleen tyrosine kinase
(SYK) as a candidate oncogenic driver in a subset of small-cell
lung cancer. BMC Syst Biol. 7 (Suppl 5)(S1)2013.PubMed/NCBI View Article : Google Scholar
|
|
20
|
Zhao H, Cai W, Su S, Zhi D, Lu J and Liu
S: Screening genes crucial for pediatric pilocytic astrocytoma
using weighted gene coexpression network analysis combined with
methylation data analysis. Cancer Gene Ther. 21:448–455.
2014.PubMed/NCBI View Article : Google Scholar
|
|
21
|
Zhang S, Liu W, Liu X, Qi J and Deng C:
Biomarkers identification for acute myocardial infarction detection
via weighted gene Co-expression network analysis. Medicine
(Baltimore). 96(e8375)2017.PubMed/NCBI View Article : Google Scholar
|
|
22
|
Aya K, Suzuki G, Suwabe K, Hobo T,
Takahashi H, Shiono K, Yano K, Tsutsumi N, Nakazono M, Nagamura Y,
et al: Comprehensive network analysis of anther-expressed genes in
rice by the combination of 33 laser microdissection and 143
spatiotemporal microarrays. PLoS One. 6(e26162)2011.PubMed/NCBI View Article : Google Scholar
|
|
23
|
Obayashi T and Kinoshita K: Rank of
correlation coefficient as a comparable measure for biological
significance of gene coexpression. DNA Res. 16:249–260.
2009.PubMed/NCBI View Article : Google Scholar
|
|
24
|
Mutwil M, Ruprecht C, Giorgi FM, Bringmann
M, Usadel B and Persson S: Transcriptional wiring of cell
wall-related genes in arabidopsis. Mol Plant. 2:1015–1024.
2009.PubMed/NCBI View Article : Google Scholar
|
|
25
|
Ashburner M, Ball CA, Blake JA, Botstein
D, Butler H, Cherry JM, Davis AP, Dolinski K, Dwight SS, Eppig JT,
et al: Gene ontology: Tool for the unification of biology. The Gene
Ontology Consortium. Nat Genet. 25:25–29. 2000.PubMed/NCBI View
Article : Google Scholar
|
|
26
|
Gene Ontology Consortium. The gene
ontology resource: Enriching a GOld mine. Nucleic Acids Res.
49:D325–D334. 2021.PubMed/NCBI View Article : Google Scholar
|
|
27
|
Kanehisa M and Goto S: KEGG: Kyoto
encyclopedia of genes and genomes. Nucleic Acids Res. 28:27–30.
2000.PubMed/NCBI View Article : Google Scholar
|
|
28
|
Kanehisa M: Toward understanding the
origin and evolution of cellular organisms. Protein Sci.
28:1947–1951. 2019.PubMed/NCBI View Article : Google Scholar
|
|
29
|
Kanehisa M, Furumichi M, Sato Y,
Ishiguro-Watanabe M and Tanabe M: KEGG: Integrating viruses and
cellular organisms. Nucleic Acids Res. 49:D545–D551.
2021.PubMed/NCBI View Article : Google Scholar
|
|
30
|
Xie C, Mao X, Huang J, Ding Y, Wu J, Dong
S, Kong L, Gao G, Li CY and Wei L: KOBAS 2.0: A web server for
annotation and identification of enriched pathways and diseases.
Nucleic Acids Res. 39:W316–W322. 2011.PubMed/NCBI View Article : Google Scholar
|
|
31
|
Livak KJ and Schmittgen TD: Analysis of
relative gene expression data using real-time quantitative PCR and
the 2(-Delta Delta C(T)) method. Methods. 25:402–408.
2001.PubMed/NCBI View Article : Google Scholar
|
|
32
|
Shah M, Patel B, Tripathi B, Agarwal M,
Patnaik S, Ram P, Patil S, Shin J and Jorde UP: Hospital mortality
and thirty day readmission among patients with non-acute myocardial
infarction related cardiogenic shock. Int J Cardiol. 270:60–67.
2018.PubMed/NCBI View Article : Google Scholar
|
|
33
|
Chen Y, Song Y, Xu JJ, Tang XF, Wang HH,
Jiang P, Jiang L, Liu R, Zhao XY, Gao LJ, et al: Relationship
between thrombolysis in myocardial infarction risk index and the
severity of coronary artery lesions and long-term outcome in acute
myocardial infarction patients undergoing percutaneous coronary
intervention. Zhonghua Xin Xue Guan Bing Za Zhi. 46:874–881.
2018.PubMed/NCBI View Article : Google Scholar : (In Chinese).
|
|
34
|
Khodayari S, Khodayari H, Amiri AZ, Eslami
M, Farhud D, Hescheler J and Nayernia K: Inflammatory
microenvironment of acute myocardial infarction prevents
regeneration of heart with stem cells therapy. Cell Physiol
Biochem. 53:887–909. 2019.PubMed/NCBI View Article : Google Scholar
|
|
35
|
Kiliszek M, Szpakowicz A, Franaszczyk M,
Pepinski W, Waszkiewicz E, Skawronska M, Ploski R,
Niemcunowicz-Janica A, Budnik M, Poludniewska D, et al: The 9p21
Polymorphism is linked with atrial fibrillation during acute phase
of ST-segment elevation myocardial infarction. Heart Vessels.
31:1590–1594. 2016.PubMed/NCBI View Article : Google Scholar
|
|
36
|
Niu X, Zhang J, Zhang L, Hou Y, Pu S, Chu
A, Bai M and Zhang Z: Weighted gene co-expression network analysis
identifies critical genes in the development of heart failure after
acute myocardial infarction. Front Genet. 10(1214)2019.PubMed/NCBI View Article : Google Scholar
|
|
37
|
Choobdar S, Ahsen ME, Crawford J, Tomasoni
M, Fang T, Lamparter D, Lin J, Hescott B, Hu X, Mercer J, et al:
Assessment of network module identification across complex
diseases. Nat Methods. 16:843–852. 2019.PubMed/NCBI View Article : Google Scholar
|
|
38
|
Zhou Q, Ren J, Hou J, Wang G, Ju L, Xiao Y
and Gong Y: Co-expression network analysis identified candidate
biomarkers in association with progression and prognosis of breast
cancer. J Cancer Res Clin Oncol. 145:2383–2396. 2019.PubMed/NCBI View Article : Google Scholar
|
|
39
|
Tang J, Kong D, Cui Q, Wang K, Zhang D,
Gong Y and Wu G: Prognostic genes of breast cancer identified by
gene Co-expression network analysis. Front Oncol.
8(374)2018.PubMed/NCBI View Article : Google Scholar
|
|
40
|
Penning TM: AKR1C3 (type 5
17β-hydroxysteroid dehydrogenase/prostaglandin F synthase): Roles
in malignancy and endocrine disorders. Mol Cell Endocrinol.
489:82–91. 2019.PubMed/NCBI View Article : Google Scholar
|
|
41
|
Yue W, Youjun W, Kun X, Yingjie Z, Gang L,
Shiyan X and Fuquan W: RPS24c isoform facilitates tumor
angiogenesis via promoting the stability of MVIH in colorectal
cancer. Curr Mol Med. 20:388–395. 2020.PubMed/NCBI View Article : Google Scholar
|
|
42
|
Shankar H, Garcia A, Prabhakar J, Kim S
and Kunapuli SP: P2Y12 receptor-mediated potentiation of
thrombin-induced thromboxane A2 generation in platelets occurs
through regulation of Erk1/2 activation. J Thromb Haemost.
4:638–647. 2006.PubMed/NCBI View Article : Google Scholar
|
|
43
|
Hassani Idrissi H, Hmimech W, El Khorb N,
Akoudad H, Habbal R and Nadifi S: Does i-T744C P2Y12 polymorphism
modulate clopidogrel response among moroccan acute coronary
syndromes patients? Genet Res Int. 2017(9532471)2017.PubMed/NCBI View Article : Google Scholar
|
|
44
|
Tingting L, Xiangdong L, Heyu M, Lili C
and Fanbo M: ACSL1 affects Triglyceride Levels through the PPARγ
pathway. Int J Med Sci. 17:720–727. 2020.PubMed/NCBI View Article : Google Scholar
|
|
45
|
Jeong HY, Park SY, Kim HJ, Moon S, Lee S,
Lee SH and Kim SH: B3GNT5 is a novel marker correlated with
stem-like phenotype and poor clinical outcome in human gliomas. CNS
Neurosci Ther. 26:1147–1154. 2020.PubMed/NCBI View Article : Google Scholar
|