Introduction
Coronavirus disease 2019 (COVID-19) is a novel
respiratory and systemic disease caused by severe acute respiratory
syndrome coronavirus 2 (SARS-CoV-2). It first appeared in Wuhan
(China) and spread rapidly worldwide, bringing great challenges to
global public healthcare (1-3).
Until July 1 2020, >10 million people worldwide have been
infected with SARS-CoV-2(4). Most
patients with COVID-19 had mild symptoms and their clinical
manifestations were mostly fever, fatigue and dry cough, while a
small number of patients were critically ill; they developed severe
pneumonia and multiple organ failure, which eventually led to death
(5-7).
Therefore, it is crucial to predict and intervene with the disease
as early as possible.
Numerous studies have compared the clinical features
and laboratory test results in patients with mild and severe
COVID-19 (8-10).
Certain prediction models have been developed and studied,
including the high-risk population identification model, diagnosis
model and prognosis model of COVID-19 infection (11). The predictive factors of most models
are the patients' basic characteristics and imaging features
(12-14).
The present study aimed to establish a simple and effective
laboratory index model to predict the clinical classification and
risk stratification of patients with COVID-19. This is of great
value for the early identification of critically ill patients and
these routine laboratory tests are easily available even in
resource-poor environments.
Materials and methods
General data
The present study was a retrospective
cross-sectional study. The data of patients with COVID-19 who were
hospitalized at the negative pressure ward of Wuxi Fifth People's
Hospital (Wuxi, China) from January to April 2020 were analyzed.
This study was approved by the Institutional Ethics Committee of
Wuxi Fifth People's Hospital (Wuxi, China) for retrospective
analysis (approval no. 2020-016-1). All data were anonymous.
Therefore, informed consent was not required. The inclusion
criteria were as follows: i) Novel coronavirus nucleic acid
positive as detected by real-time fluorescence reverse
transcription PCR; ii) meeting of the diagnostic criteria outlined
in the ‘Diagnosis and Treatment Protocol for Novel Coronavirus
Pneumonia (Trial Version 7)’ (15).
The exclusion criteria were as follows: i) Pregnant females; ii)
patients who did not have a complete medical history, particularly
the routine blood test results and detection of infection markers.
The general information, complications and the results of routine
laboratory tests were collected.
Diagnosis
The clinical classification of patients with
COVID-19 was mainly based on symptoms and imaging manifestations.
According to the Diagnosis and Treatment Protocol for Novel
Coronavirus Pneumonia (trial version 7) published by the General
Office of the National Health Commission of China (15), patients with COVID-19 were
classified as mild, moderate, severe or critical cases. Patients
with mild COVID-19 had mild clinical symptoms and no pneumonia
signs on imaging. Moderate cases had fever and respiratory symptoms
with imaging findings of pneumonia. Cases meeting any of the
following criteria were defined as severe cases: Respiratory
distress (respiratory rate, ≥30 breaths/min); oxygen saturation
≤93% at rest; arterial oxygen partial pressure/fraction of inspired
oxygen ≤300 mmHg. Lung imaging indicated that the lesions
progressed significantly within 24-48 h and patients with lung
lesions occupying >50% of the lung were treated according to
management protocols for severe cases. Cases meeting any of the
following criteria were defined as critical cases: Respiratory
failure and requirement of mechanical ventilation; shock;
combination with failure of other organs that required care at the
intensive care unit.
Laboratory tests
The following parameters were analyzed: White blood
cells (reference range, 3.5-9.5x10⁹/l), the percentage
of neutrophils (Neur; reference range, 40.00-75.00%), neutrophil
count (Neuc; reference range, 1.8-6.3x10⁹/l), percentage
of lymphocytes (Lymr; reference range, 20.00-50.00%), lymphocyte
count (Lymc; reference range, 1.10-3.20x10⁹/l),
percentage of monocytes (Monr; reference range, 3.00-8.00%),
monocyte count (Monc; reference range, 0.10-0.60x10⁹/l),
red blood cell count (RBC; reference range for females and males,
3.80-5.10 and 4.30-5.80x10¹²/l, respectively),
hemoglobin (HGB; reference range for females and males, 115-150 and
130-17 5 g/l, respectively), hematocrit (HCT; reference range for
females and males, 35.0-45.0 and 40.0-50.0%, respectively),
platelet count (reference range, 125-350x109/l), red
blood cell distribution width (reference range, 11.50-14.90%),
plateletcrit (PTC; reference range, 0.108-0.272 l/l), mean platelet
volume (reference range, 6.00-11.50 fl), platelet distribution
width (reference range, 15.50-18.10 fl), high-sensitivity
C-reactive protein (hsCRP; reference range, 0-10 mg/l),
procalcitonin (PCT; reference range, 0-0.05 ng/ml). A routine blood
test was performed using a Sysmex XN9000 blood analyzer (Sysmex
Corp.). The hsCRP was detected using a specific protein analyzer
HP-083/4 (Hipro Biotechnology). PCT was determined using the
Autobio A2000PLUS automatic chemiluminescence instrument
(Sym-Biotechnology).
Statistical analysis
Continuous variables are expressed as the mean ±
standard deviation, while categorical variables were expressed as n
(%). An unpaired Student's t-test or Mann-Whitney U-test as
nonparametric tests were used to compare continuous variables.
Pearson's chi-square test and Fisher's exact test were used to
analyze categorical variables.
Multivariate logistic regression analysis was used
to establish the prediction model and the best model parameters
were selected according to the minimum Akaike's information
criterion. The nomogram and a calibration curve of the model were
generated. Receiver operating characteristic (ROC) curves were
created for each model. The area under the ROC curve (AUC) of
different models was compared using the DeLong method (16). The bootstrap resampling method
(times=500) recommended by the TRIPOD statement (14) was used to verify the model
internally and calculate the 95% confidence interval (CI) of the
AUC. Decision curve analysis (DCA) was used to quantify and compare
the clinical effectiveness of the model. This method was based on
the threshold probability to express the relative hazards of
false-positives and false-negatives. The net benefit was obtained
by subtracting the proportion of false-positive results from the
proportion of true-positive results and weighing the relative
hazards of false-positive and false-negative results. The following
formula was used to calculate the net benefit of making decisions
based on the model: Net benefit=True positives/n-[Pt/(1-Pt)] x
[False positives/n], where n is the total number of patients in the
study and Pt is the given threshold probability.
Finally, stratification analysis was performed to
evaluate the possible effects of different subgroups on the
prediction efficiency of the combined indexes model. All analyses
were performed using R software, version 3.4.3 (http://www.R-project.org). P<0.05 was considered to
indicate statistical significance.
Results
Patients
A total of 170 patients with COVID-19 were enrolled
in the present study, including 94 males and 76 females with an
average age of 44.7 ± 17.8 years (range, 5-91 years). According to
the symptoms and imaging findings on admission, there were 13
asymptomatic cases, 37 mild cases, 91 moderate cases, 27 severe
cases and 2 critical cases (15 patients were eventually classified
as severe cases because they converted from moderate to severe at 2
days after admission). According to the treatment's clinical
significance, the patients were divided into two groups: The
asymptomatic-moderate group (141 cases) and the severe or above
group (29 cases). A comparison of the general information between
the two groups is provided in Table
I. It was indicated that in the severe or above group, the age
was higher (P<0.001) and the proportion of cases combined with
hypertension, diabetes mellitus and cerebrovascular disease was
higher (P<0.05). The proportion of patients with a tumor history
was also higher in this group but the difference was not
statistically significant (P=0.076).
 | Table IComparison of the general data between
the asymptomatic-moderate group and the severe or above group. |
Table I
Comparison of the general data between
the asymptomatic-moderate group and the severe or above group.
| Clinical
classification | Asymptomatic-moderate
group (n=141) | Severe or above group
(n=29) | P-value |
|---|
| Age (years) | 41.6±16.9 | 59.6±14.8 | <0.001 |
| Age group
(years) | | | <0.001 |
|
<60 | 123 (87.2) | 17 (58.6) | |
|
≥60 | 18 (12.8) | 12 (41.4) | |
| Sex | | | 0.224 |
|
Female | 66 (46.8) | 10 (34.5) | |
|
Male | 75 (53.2) | 19 (65.5) | |
| Hypertension | 31 (22.0) | 12 (41.4) | 0.029 |
| Diabetes
mellitus | 15 (10.6) | 10 (34.5) | <0.001 |
| Coronary heart
disease | 3 (2.1) | 2 (6.9) | 0.166 |
| Cerebrovascular
disease | 0 (0.0) | 2 (6.9) | 0.002 |
| History of tumor | 1 (0.7) | 2 (6.9) | 0.076 |
| HBV | 1 (0.7) | 0 (0.0) | 0.649 |
| Chronic renal
disease | 1 (0.7) | 1 (3.4) | 0.215 |
| Chronic liver
disease/cirrhosis | 3 (2.1) | 0 (0.0) | 0.428 |
| Alcoholism | 4 (4.2) | 1 (3.4) | 0.855 |
| Smoking | 5 (5.3) | 2 (6.9) | 0.739 |
Laboratory data
A comparison of the laboratory indexes between the
two groups is provided in Table
II. After adjusting for age, gender, hypertension, diabetes
mellitus, cerebrovascular disease and tumor history, it was
revealed that the Neur, Neuc, hsCRP and PCT in the severe or above
group were significantly higher than those in the
asymptomatic-moderate group (all P<0.05), while the Lymr, Monr,
Lymc and HCT in the severe or above group were significantly lower
than those in the asymptomatic-moderate group (all P<0.05).
| Table IIComparison of laboratory indexes
between the asymptomatic-moderate group and the severe or above
group. |
Table II
Comparison of laboratory indexes
between the asymptomatic-moderate group and the severe or above
group.
| Laboratory
index | Reference
values |
Asymptomatic-moderate group (n=141) | Severe or above
(n=29) | OR (95% CI) | P-value |
|---|
| WBC
(x109/l) | 3.5-9.5 | 5.0±1.5 | 5.5±2.7 | 1.190 (0.937,
1.513) | 0.154 |
| Neur (%) | 40.0-75.0 | 58.8±11.9 | 70.5±16.1 | 1.072 (1.026,
1.120) | 0.002 |
| Lymr (%) | 20.0-50.0 | 30.4±11.1 | 21.1±12.6 | 0.935 (0.888,
0.985) | 0.012 |
| Monr (%) | 3.0-8.0 | 9.6±3.2 | 7.5±3.7 | 0.762 (0.633,
0.916) | 0.004 |
| Neuc
(x109/l) | 1.8-6.3 | 3.0±1.3 | 4.1±2.8 | 1.375 (1.042,
1.815) | 0.025 |
| Lymc
(x109/l) | 1.1-3.2 | 1.5±0.7 | 1.0±0.5 | 0.300 (0.099,
0.911) | 0.034 |
| Monc
(x109/l) | 0.1-0.6 | 0.5±0.2 | 0.4±0.2 | 0.058 (0.003,
1.018) | 0.051 |
| RBC
(x1012/l) | Females, 3.8-5.1;
males, 4.3-5.8 | 4.7±0.7 | 4.3±0.6 | 0.413 (0.148,
1.151) | 0.091 |
| HGB (g/l) | Females, 115-150;
males, 130-175 | 139.6±17.9 | 130.1±21.2 | 0.973 (0.946,
1.002) | 0.066 |
| HCT (%) | Females, 35.0-45.0;
males, 40.0-50.0 | 41.2±4.7 | 37.7±5.5 | 0.868 (0.775,
0.972) | 0.014 |
| PLT
(x109/l) | 125.0-350.0 | 184.3±58.5 | 173.9±56.5 | 1.006 (0.997,
1.015) | 0.173 |
| RDW (%) | 11.5-14.9 | 13.1±1.9 | 13.6±2.8 | 1.191 (0.871,
1.629) | 0.274 |
| MPV (fl) | 6.0-11.5 | 11.0±1.2 | 10.9±1.2 | 0.734 (0.467,
1.155) | 0.182 |
| PDW (fl) | 15.5-18.1 | 14.8±3.2 | 15.3±2.1 | 0.980 (0.806,
1.192) | 0.840 |
| PTC (l/l) | 0.108-0.272 | 0.2±0.1 | 0.2±0.1 | 0.904 (0.000,
10,957.021) | 0.983 |
| hsCRP (mg/l) | 0.0-10.0 | 13.6±21.0 | 78.3±63.8 | 1.041 (1.020,
1.062) | <0.001 |
| PCT (ng/ml) | 0.00-0.05 | 0.15±0.18 | 0.46±0.64 | 13.774 (1.399,
135.619) | 0.025 |
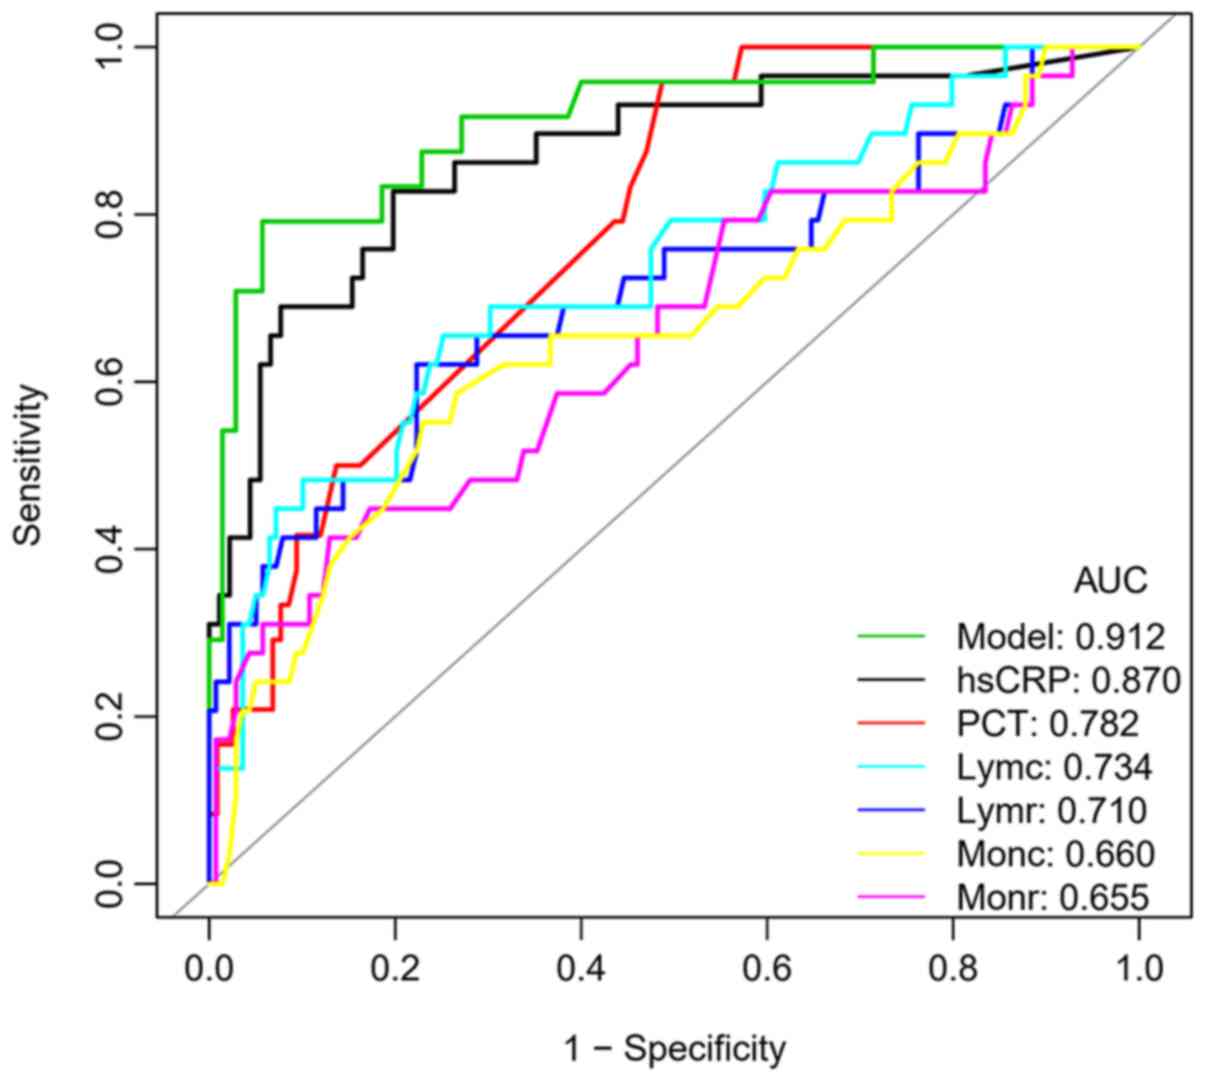
Predictive value of individual
laboratory indexes
The Diagnosis and Treatment Protocol for Novel
Coronavirus Pneumonia (trial version 7) (15) pointed out that the peripheral blood
lymphocytes of patients with severe COVID-19 were progressively
reduced. Therefore, ROC curves were generated for the Lymr, Lymc,
Monr and Monc in the two groups. The cut-off value, AUC and 95% CI
of the above four indexes were 22.10, 0.710 (0.591-0.828); 1.02,
0.734 (0.626-0.842); 6.45, 0.655 (0.535-0.776) and 0.34, 0.660
(0.540-0.780), respectively, and the AUC of Lymc was the largest
(Fig. 1, Table III).
| Table IIIComparison of the diagnostic efficacy
of different laboratory indexes and the prediction model with
combined indexes. |
Table III
Comparison of the diagnostic efficacy
of different laboratory indexes and the prediction model with
combined indexes.
| Index | Cut-off | AUC (95% CI) | Specificity | Sensitivity | Accuracy | Positive-LR | Negative-LR |
|---|
| Lymr (%) | 22.10 | 0.710
(0.591-0.828) | 0.777 | 0.621 | 0.750 | 2.783 | 0.488 |
| Lymc
(x109/l) | 1.02 | 0.734
(0.626-0.842) | 0.748 | 0.655 | 0.732 | 2.602 | 0.461 |
| Monr (%) | 6.45 | 0.655
(0.535-0.776) | 0.871 | 0.414 | 0.792 | 3.195 | 0.673 |
| Monc
(x109/l) | 0.34 | 0.660
(0.540-0.780) | 0.770 | 0.552 | 0.732 | 2.397 | 0.582 |
| PCT (ng/ml) | 0.15 | 0.782
(0.696-0.868) | 0.513 | 0.958 | 0.589 | 1.967 | 0.081 |
| hsCRP (mg/l) | 19.32 | 0.870
(0.788-0.952) | 0.802 | 0.828 | 0.808 | 4.184 | 0.215 |
| Model | -0.85 | 0.912
(0.839-0.985) | 0.943 | 0.792 | 0.904 | 13.854 | 0.221 |
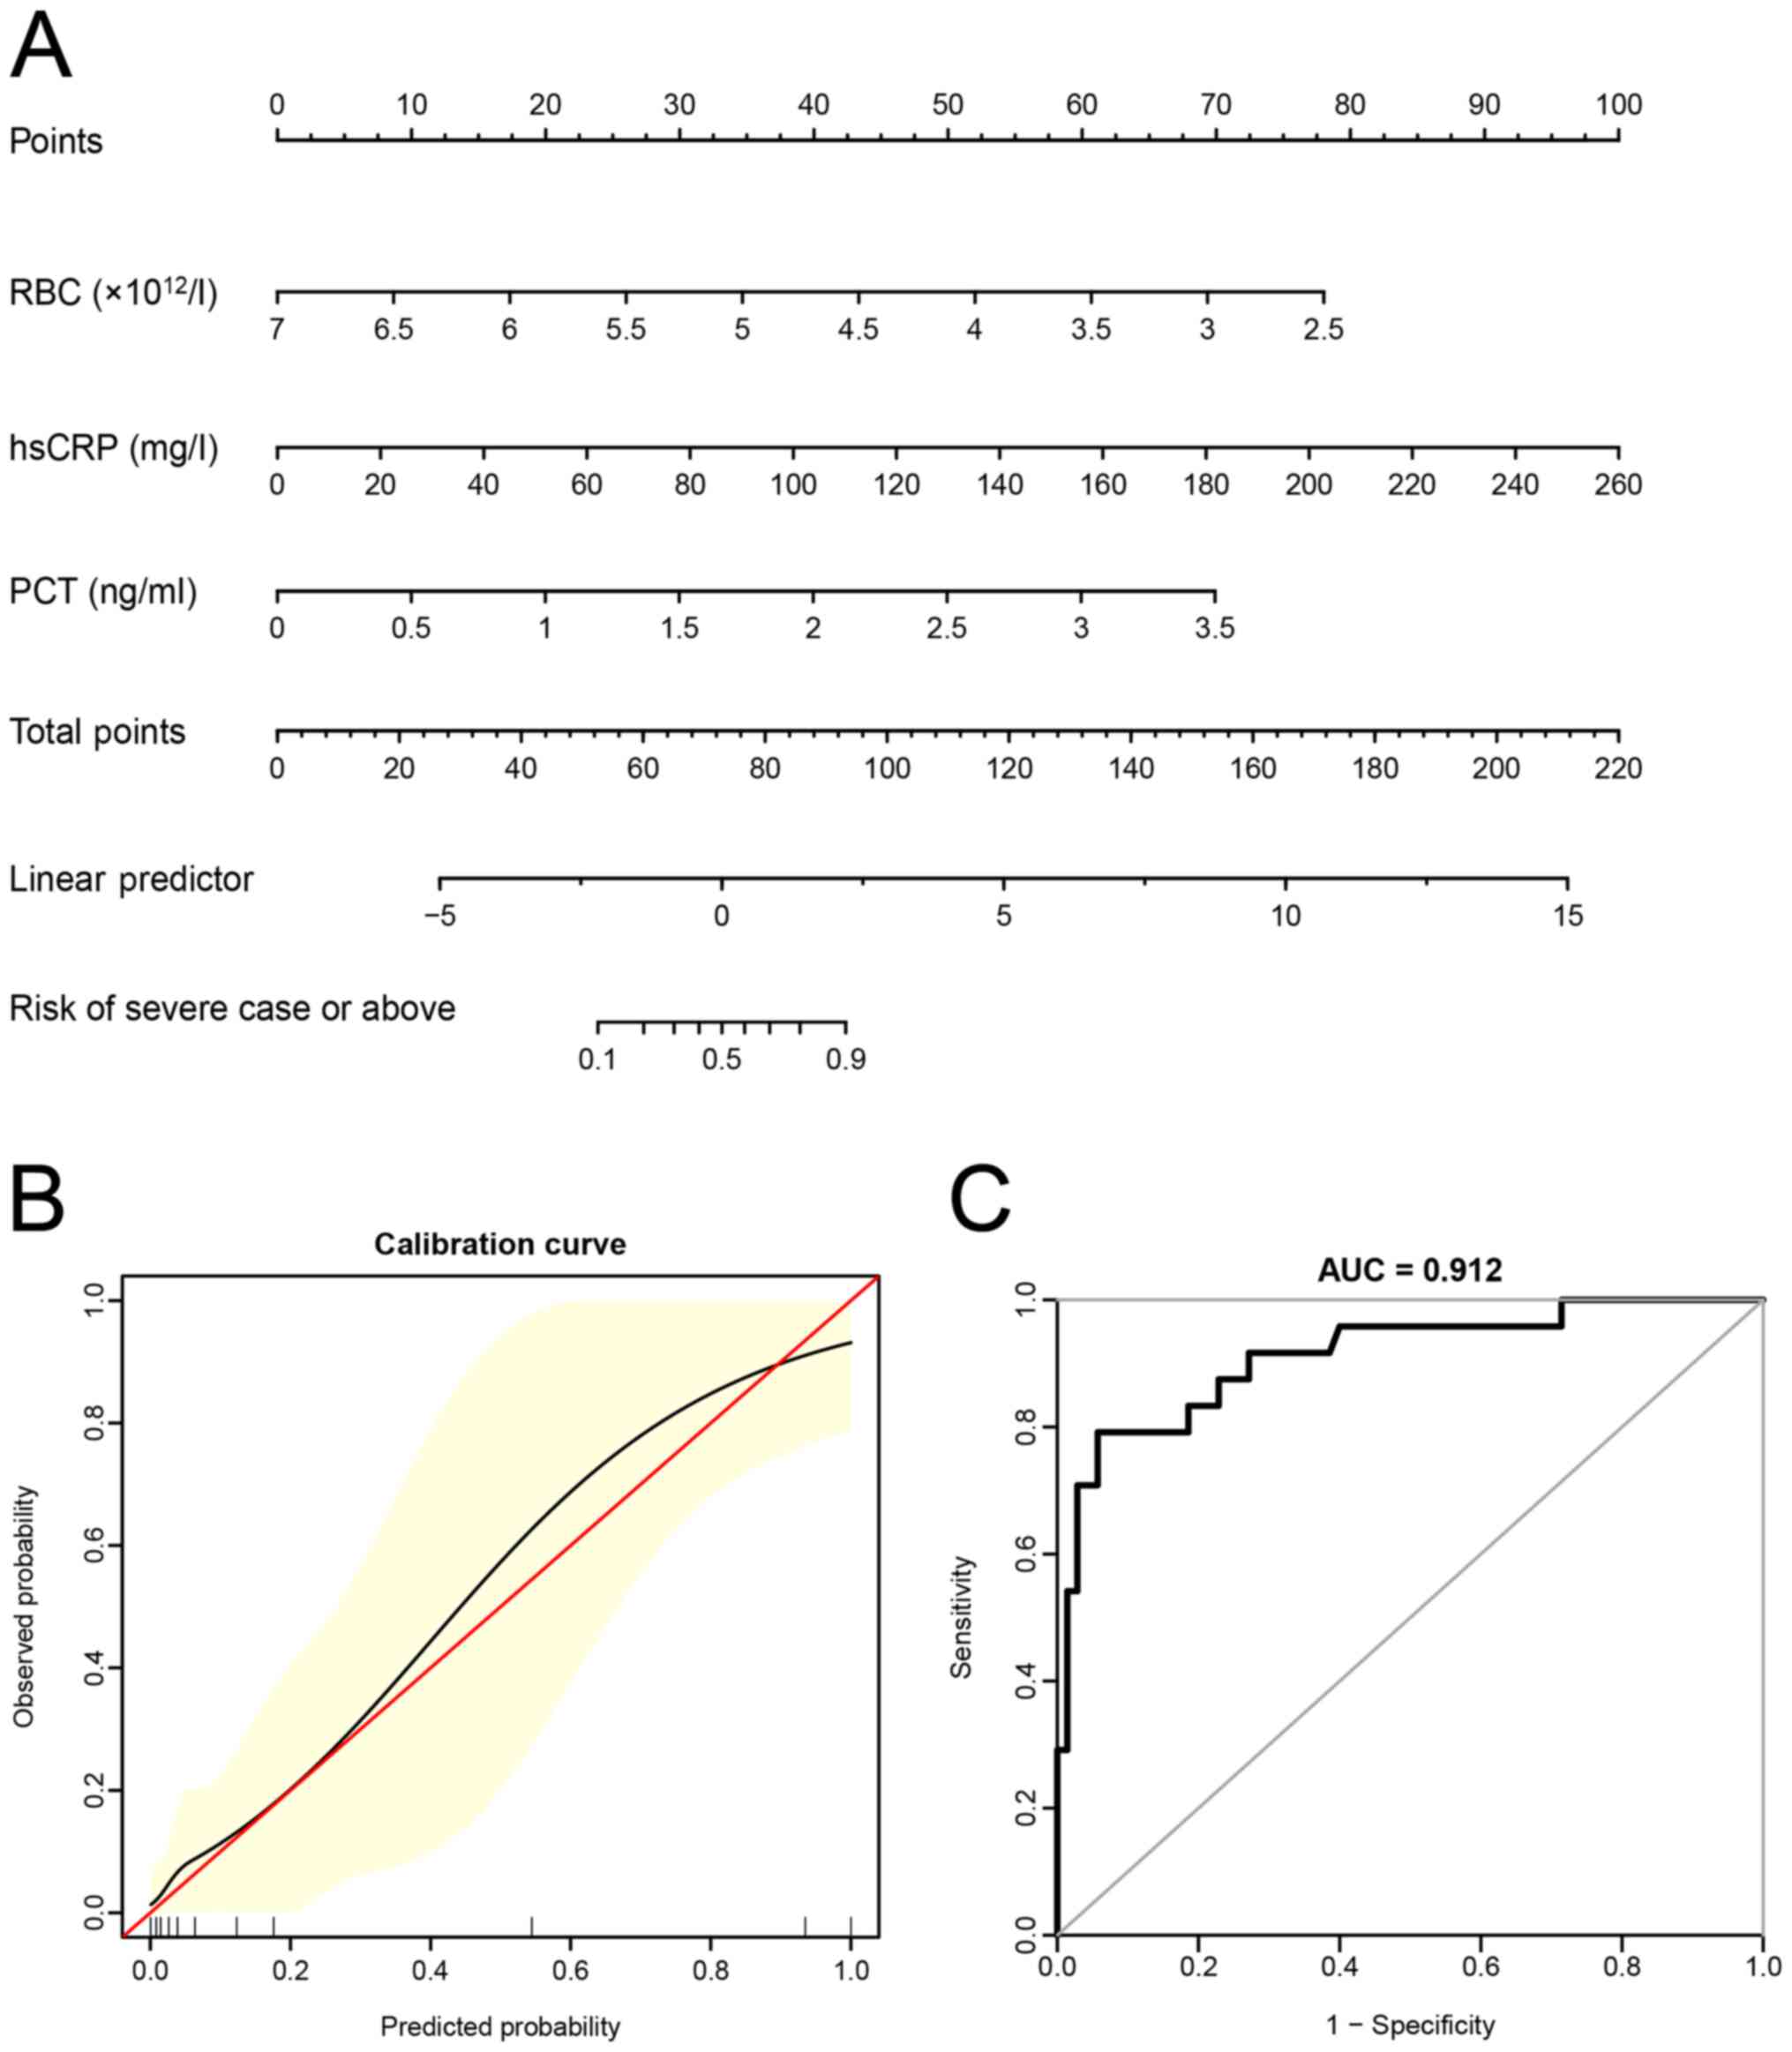
Construction of prediction model using
combined laboratory indexes
Multivariate logistic regression analysis was
performed using whether the patient was diagnosed as a severe case
or above as the dependent variable and laboratory indexes,
including the Neur, Lymr, Monr, Neuc, Lymc, Monc, RBC, HGB, HCT,
hsCRP and PCT, as independent variables (Table II; P-value threshold was extended
to 0.10) to establish the risk prediction model. It was indicated
that RBC, hsCRP and PCT were independent risk factors for severe
disease. The prediction model formula established was as follows:
Logit (P)=6.88787-2.36962 x RBC (x1012/l)+0.04830 x
hsCRP (mg/l)+2.62161 x PCT (ng/ml), where the P-value referred to
the probability that the patient was diagnosed as a severe case or
above.
Next, the nomogram, calibration curve and ROC curve
of the prediction model were generated (Fig. 2A-C). It was revealed that the
predicted value and the observed value were in agreement with each
other.
When comparing the ROC curves of different
laboratory indexes and the model with combined indexes for the
prediction of clinical classifications of patients with COVID-19
(Table III), it was revealed that
the AUC value of the prediction model was higher than that of hsCRP
(0.912 vs. 0.870, respectively), but the difference was not
statistically significant (P=0.307). However, the AUC of the model
was significantly higher than that of PCT, lymphocytes and
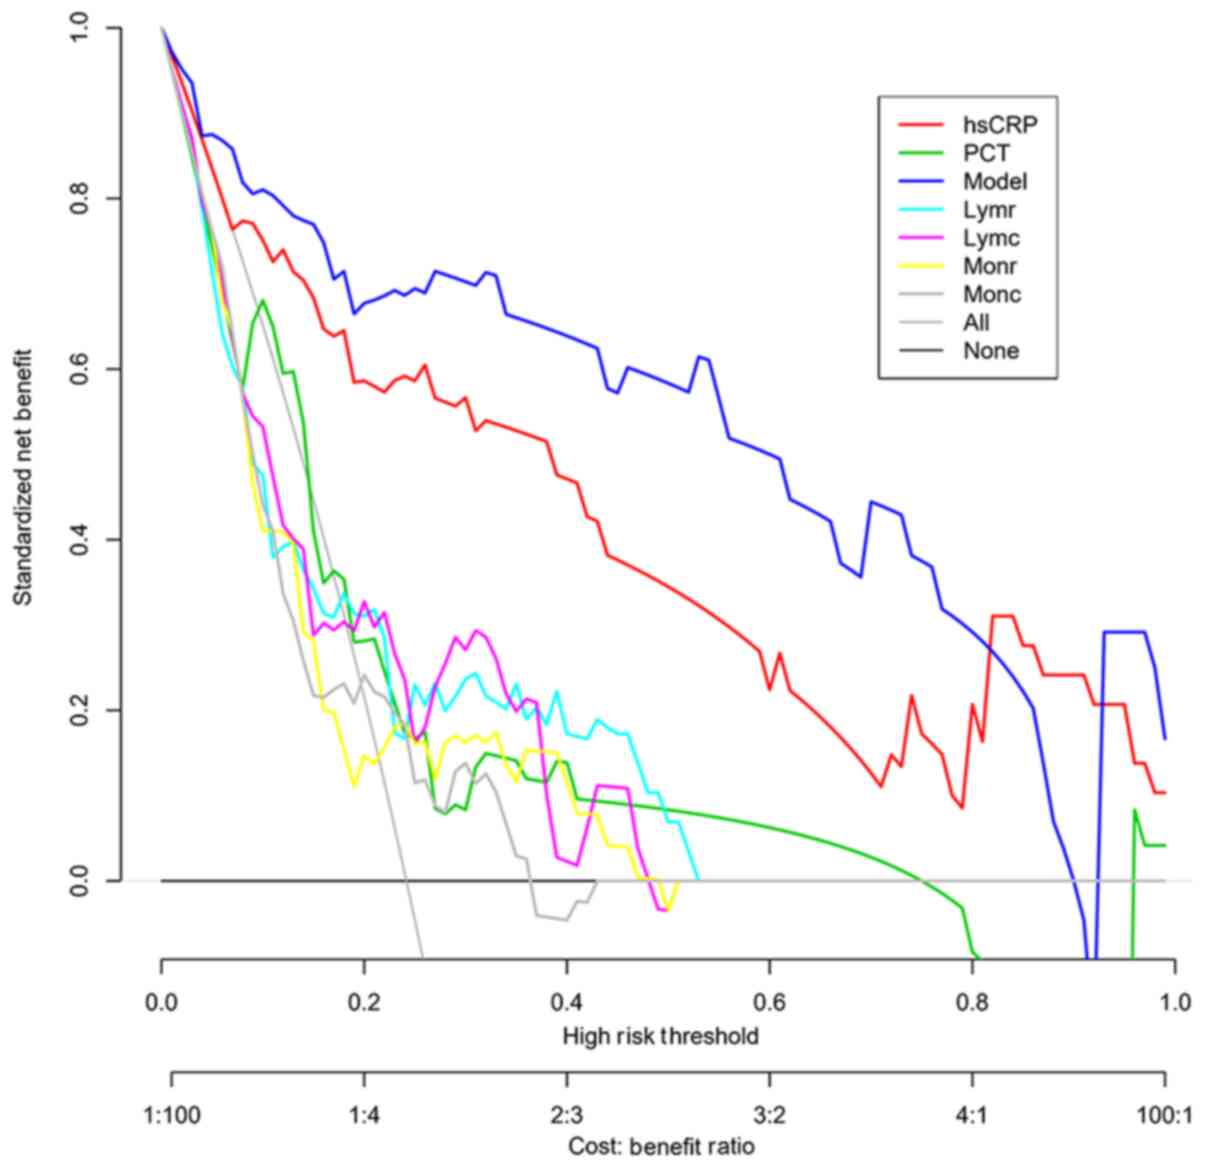
monocytes (all P<0.001). The decision curves of different
indexes and the prediction model were further generated (Fig. 3). In most cases, the model's net
benefit was higher than that of hsCRP and was significantly higher
than that of PCT, lymphocytes and monocytes.
Comparison of the laboratory index
model in different subgroups
The prediction model indicated a similar trend in
different age, gender, hypertension and diabetes subgroups and was
a risk factor among different subgroups (all P<0.05), and the
interaction was not significant (all P>0.05; Table IV). As the number of cases in the
coronary heart disease, cerebrovascular disease, tumor, Hepatitis B
virus (HBV), chronic kidney disease (CKD) and chronic liver
disease/liver cirrhosis subgroups was <20 cases, they were not
included in the comparison.
| Table IVComparison of the efficacy of the
prediction model in different subgroups by age, sex, hypertension
and diabetes. |
Table IV
Comparison of the efficacy of the
prediction model in different subgroups by age, sex, hypertension
and diabetes.
| Item | N | OR (95% CI) | P-value | P
(interaction) |
|---|
| Age group
(years) | | | | 0.452 |
|
<60 | 140 | 2.070
(1.363-3.142) | 0.001 | |
|
≥60 | 30 | 2.959
(1.180-7.423) | 0.021 | |
| Sex | | | | 0.507 |
|
Female | 76 | 2.007
(1.195-3.370) | 0.009 | |
|
Male | 94 | 2.579
(1.527-4.354) | <0.001 | |
| Hypertension | | | | 0.394 |
|
No | 127 | 2.060
(1.387-3.062) | <0.001 | |
|
Yes | 43 | 2.974
(1.339-6.602) | 0.007 | |
| Diabetes
mellitus | | | | 0.282 |
|
No | 145 | 2.636
(1.628-4.269) | <0.001 | |
|
Yes | 25 | 1.720
(1.003-2.948) | 0.049 | |
Discussion
The present study mainly discussed the differences
between the clinical characteristics, blood routine results and
routine inflammatory indexes between mild and severe cases and a
prediction model based on laboratory indexes was constructed to
predict the clinical classification of patients with COVID-19.
These laboratory indexes are simple and easy to obtain and are
quantitative indexes so that clinicians are able to evaluate the
patient's condition in a timely and effective manner.
The present study indicated that older people and
patients with underlying diseases, such as diabetes and
hypertension, had a higher risk of severe COVID-19, which was
consistent with most studies (17-19).
Su et al (20) also pointed
out that 19% of the hospitalized patients with COVID-19 had
diabetes mellitus and diabetes mellitus is a risk factor of poor
prognosis for the disease.
The present results also suggested that neutrophils
increased significantly in patients with severe COVID-19, while
lymphocytes, monocytes and hematocrit decreased significantly,
consistent with most previous studies (21-24).
A meta-analysis by Soraya and Ulhaq (25) suggested that progressive lymphopenia
is an important marker for the severity of COVID-19, indicating
that viral infection damages the patients' immune system. The
present results indicated that the lymphocyte count had the highest
diagnostic efficacy for severe COVID-19 (AUC=0.734), which was
slightly lower than the result of Soraya and Ulhaq (25) (AUC=0.870), but it was not an
independent risk factor for severe disease. RBC are critical for
oxygen transport and off-loading and Thomas et al (26) reported that angiotensin and
angiotensin converting enzyme 2 receptor interacting proteins were
identified on the RBC surface via proteomics. This indicated that
RBC, which theoretically do not support viral replication, may be
invaded by SARS-CoV-2, thereby leading to the alteration of the RBC
form and their destruction, resulting in hypoxemia in patients and
multiple organ failure in severe cases. The results of the present
study indicated that this low-cost and routine hematological index
may help diagnose and monitor the progress of COVID-19 and should
be continuously evaluated during SARS-CoV-2 infection. The present
study also suggested that hsCRP and PCT are risk factors for the
progression of COVID-19 to severe disease. It has been reported
that hsCRP has a significant role in predicting the progression of
COVID-19(27). PCT is a useful
marker for evaluating the severity and prognosis of sepsis
(28), which helps guide antibiotic
treatment. Patients with severe COVID-19 have poor immune function,
which increases the risk of secondary infection. Elevated levels of
hsCRP and PCT in patients with severe COVID-19 may indicate mixed
bacterial infection (29-31).
However, in the literature, no significant change in the PCT levels
in patients with severe COVID-19 was reported (25). Therefore, future studies with an
increased sample size should be performed to investigate this issue
further.
Studies have indicated that certain routine
laboratory tests are associated with the severity of COVID-19
(32,33). Although certain individual
laboratory indexes may help identify severe cases, the AUC,
specificity and sensitivity are generally low (5,17).
Therefore, it is urgent to construct a multi-factor prediction
model to evaluate patients with COVID-19 effectively. At present,
the prediction models that draw attention include a risk model for
identifying a high-risk population with SARS-CoV-2 infection within
the general population, a diagnosis model for the identification of
suspected COVID-19 cases and a prognosis model for predicting the
course of infection in patients with COVID-19(11). Most of the models are based on
clinical and imaging features (12-14).
To identify patients with severe COVID-19 early, a prediction model
based on three quantitative laboratory indexes was established:
RBC, hsCRP and PCT. Although there was no significant difference in
the AUC between this prediction model and hsCRP, the model's
specificity was markedly higher (0.943), which was conducive to
diagnosing patients with severe COVID-19; it was not affected by
age, gender, hypertension or diabetes. In addition, DCA suggested
that the clinical benefit of the prediction model with combined
laboratory indexes was better than that of hsCRP in most cases. In
the present study, certain patients changed from moderate to severe
cases, which further highlights the importance of finding good
prediction models. Given the common clinical manifestations of
viral pneumonia in patients with COVID-19, the progress of general
diseases is also short-term (most of the time will appear within a
week, even in a week or less), and for such patients, the
prediction model may be used to re-evaluate the corresponding
indicators in the short term, which can more effectively predict
the clinical classification of COVID-19 patients.
The present study had certain limitations. First, it
was a retrospective, single-center study; therefore, there may have
been a patient selection bias. Furthermore, due to insufficient
sample size, the number of cases in subgroups of coronary heart
disease, cerebrovascular disease, tumor, HBV, CKD and chronic liver
disease/liver cirrhosis is <20; thus, stratified validation
cannot be performed. In addition, the prediction model was only
subjected to internal verification and the feasibility of the model
is required to be further verified using external data. Finally,
the applicability of the model in 15 patients who had changed from
moderate to severe within 2 days after admission was not
independently assessed and the period of re-evaluation of
laboratory indicators was not taken into account.
In conclusion, in the present study, a prediction
model with the following laboratory indexes was constructed: RBC,
hsCRP and PCT. This model was able to more effectively predict
patients' clinical classification with COVID-19 and may be used as
a tool for risk stratification, which is conducive to allocating
medical resources and improving the treatment outcome in patients
with COVID-19.
Acknowledgements
Not applicable.
Funding
The present study was supported by the Young Talent
Development Plan of Changzhou Health Commission (grant no.
CZQM2020039) and the Youth Foundation Program of Nanjing Medical
University (grant no. 2016NJMU170).
Availability of data and materials
The datasets used and/or analyzed during the current
study are available from the corresponding author on reasonable
request.
Authors' contributions
JY drafted the manuscript. JY, FZ and YT made
substantial contributions to the conception and design of the
study. XZ and YT participated in the acquisition, analysis or
interpretation of the data. XZ and YT confirm the authenticity of
the raw data. All authors read and approved the final
manuscript.
Ethics approval and consent to
participate
This study was approved by the Institutional Ethics
Committee of Wuxi Fifth People's Hospital (Wuxi, China; approval
no. 2020-016-1). As it was a retrospective analysis and all data
were anonymous, no informed consent was required.
Patient consent for publication
Not applicable.
Competing interests
The authors declare that they have no competing
interests.
References
|
1
|
Fan Z, Chen L, Li J, Cheng X, Yang J, Tian
C, Zhang Y, Huang S, Liu Z and Cheng J: Clinical features of
COVID-19-related liver functional abnormality. Clin Gastroenterol
Hepatol. 18:1561–1566. 2020.PubMed/NCBI View Article : Google Scholar
|
|
2
|
Wu J, Song S, Cao HC and Li LJ: Liver
diseases in COVID-19: Etiology, treatment and prognosis. World J
Gastroenterol. 26:2286–2293. 2020.PubMed/NCBI View Article : Google Scholar
|
|
3
|
Martins-Filho PR, Tavares CSS and Santos
VS: Factors associated with mortality in patients with COVID-19. A
quantitative evidence synthesis of clinical and laboratory data.
Eur J Intern Med. 76:97–99. 2020.PubMed/NCBI View Article : Google Scholar
|
|
4
|
Wiersinga WJ, Rhodes A, Cheng AC, Peacock
SJ and Prescott HC: Pathophysiology, transmission, diagnosis, and
treatment of coronavirus disease 2019 (COVID-19): A review. JAMA.
324:782–793. 2020.PubMed/NCBI View Article : Google Scholar
|
|
5
|
Liu Q, Song NC, Zheng ZK, Li JS and Li SK:
Laboratory findings and a combined multifactorial approach to
predict death in critically ill patients with COVID-19: A
retrospective study. Epidemiol Infect. 148(e129)2020.PubMed/NCBI View Article : Google Scholar
|
|
6
|
Wang F, Hou H, Luo Y, Tang G, Wu S, Huang
M, Liu W, Zhu Y, Lin Q, Mao L, et al: The laboratory tests and host
immunity of COVID-19 patients with different severity of illness.
JCI Insight. 5(e137799)2020.PubMed/NCBI View Article : Google Scholar
|
|
7
|
Vultaggio A, Vivarelli E, Virgili G,
Lucenteforte E, Bartoloni A, Nozzoli C, Morettini A, Berni A,
Malandrino D, Rossi O, et al: Prompt predicting of early clinical
deterioration of moderate-to-severe COVID-19 patients: Usefulness
of a combined score using IL-6 in a preliminary study. J Allergy
Clin Immunol Pract. 8:2575–2581.e2. 2020.PubMed/NCBI View Article : Google Scholar
|
|
8
|
Chen G, Wu D, Guo W, Cao Y, Huang D, Wang
H, Wang T, Zhang X, Chen H, Yu H, et al: Clinical and immunological
features of severe and moderate coronavirus disease 2019. J Clin
Invest. 130:2620–2629. 2020.PubMed/NCBI View Article : Google Scholar
|
|
9
|
Rodriguez-Morales AJ, Cardona-Ospina JA,
Gutiérrez-Ocampo E, Villamizar-Peña R, Holguin-Rivera Y,
Escalera-Antezana JP, Alvarado-Arnez LE, Bonilla-Aldana DK,
Franco-Paredes C, Henao-Martinez AF, et al: Clinical, laboratory
and imaging features of COVID-19: A systematic review and
meta-analysis. Travel Med Infect Dis. 34(101623)2020.PubMed/NCBI View Article : Google Scholar
|
|
10
|
Zhang B, Zhang J, Chen H, Chen L, Chen Q,
Li M, Chen Z, You J, Yang K and Zhang S: Novel coronavirus disease
2019 (COVID-19): Relationship between chest CT scores and
laboratory parameters. Eur J Nucl Med Mol Imaging. 47:2083–2089.
2020.PubMed/NCBI View Article : Google Scholar
|
|
11
|
Wynants L, Van Calster B, Collins GS,
Riley RD, Heinze G, Schuit E, Bonten MMJ, Damen JAA, Debray TPA, De
Vos M, et al: Prediction models for diagnosis and prognosis of
covid-19 infection: Systematic review and critical appraisal. BMJ.
369(m1328)2020.PubMed/NCBI View Article : Google Scholar
|
|
12
|
Lorente-Ros A, Monteagudo Ruiz JM, Rincón
LM, Ortega Pérez R, Rivas S, Martínez-Moya R, Sanromán MA, Manzano
L, Alonso GL, Ibáñez B and Zamorano JL: Myocardial injury
determination improves risk stratification and predicts mortality
in COVID-19 patients. Cardiol J. 27:489–496. 2020.PubMed/NCBI View Article : Google Scholar
|
|
13
|
Qin L, Yang Y, Cao Q, Cheng Z, Wang X, Sun
Q, Yan F, Qu J and Yang W: A predictive model and scoring system
combining clinical and CT characteristics for the diagnosis of
COVID-19. Eur Radiol. 30:6797–6807. 2020.PubMed/NCBI View Article : Google Scholar
|
|
14
|
Chen X, Tang Y, Mo Y, Li S, Lin D, Yang Z,
Yang Z, Sun H, Qiu J, Liao Y, et al: A diagnostic model for
coronavirus disease 2019 (COVID-19) based on radiological semantic
and clinical features: A multi-center study. Eur Radiol.
30:4893–4902. 2020.PubMed/NCBI View Article : Google Scholar
|
|
15
|
Released by National Health Commission
& National Administration of Traditional Chinese Medicine on
March 3, 2020. Diagnosis and treatment protocol for novel
coronavirus pneumonia (Trial Version 7). Chin Med J (Engl).
133:1087–1095. 2020.PubMed/NCBI View Article : Google Scholar
|
|
16
|
DeLong ER, DeLong DM and Clarke-Pearson
DL: Comparing the areas under two or more correlated receiver
operating characteristic curves: A nonparametric approach.
Biometrics. 44:837–845. 1988.PubMed/NCBI
|
|
17
|
Liu YP, Li GM, He J, Liu Y, Li M, Zhang R,
Li YL, Wu YZ and Diao B: Combined use of the
neutrophil-to-lymphocyte ratio and CRP to predict 7-day disease
severity in 84 hospitalized patients with COVID-19 pneumonia: A
retrospective cohort study. Ann Transl Med. 8(635)2020.PubMed/NCBI View Article : Google Scholar
|
|
18
|
Su TH and Kao JH: The clinical
manifestations and management of COVID-19-related liver injury. J
Formos Med Assoc. 119:1016–1018. 2020.PubMed/NCBI View Article : Google Scholar
|
|
19
|
Hu L, Chen S, Fu Y, Gao Z, Long H, Ren HW,
Zuo Y, Wang J, Li H, Xu QB, et al: Risk factors associated with
clinical outcomes in 323 coronavirus disease 2019 (COVID-19)
hospitalized patients in Wuhan, China. Clin Infect Dis.
71:2089–2098. 2020.PubMed/NCBI View Article : Google Scholar
|
|
20
|
Su M, Yuan J, Peng J, Wu M, Yang Y and
Peng YG: Clinical prediction model for mortality of adult diabetes
inpatients with COVID-19 in Wuhan, China: A retrospective pilot
study. J Clin Anesth. 66(109927)2020.PubMed/NCBI View Article : Google Scholar
|
|
21
|
Wang F, Hou H, Wang T, Luo Y, Tang G, Wu
S, Zhou H and Sun Z: Establishing a model for predicting the
outcome of COVID-19 based on combination of laboratory tests.
Travel Med Infect Dis. 36(101782)2020.PubMed/NCBI View Article : Google Scholar
|
|
22
|
Tian S, Liu H, Liao M, Wu Y, Yang C, Cai
Y, Peng Z and Xiao SY: Analysis of mortality in patients with
COVID-19: Clinical and laboratory parameters. Open Forum Infect
Dis. 7(ofaa152)2020.PubMed/NCBI View Article : Google Scholar
|
|
23
|
Liu J, Li S, Liu J, Liang B, Wang X, Wang
H, Li W, Tong Q, Yi J, Zhao L, et al: Longitudinal characteristics
of lymphocyte responses and cytokine profiles in the peripheral
blood of SARS-CoV-2 infected patients. EBioMedicine.
55(102763)2020.PubMed/NCBI View Article : Google Scholar
|
|
24
|
Wang L, Liu Y, Zhang T, Jiang Y, Yang S,
Xu Y, Song R, Song M, Wang L, Zhang W, et al: Differentiating
between 2019 novel coronavirus pneumonia and influenza using a
nonspecific laboratory marker-based dynamic nomogram. Open Forum
Infect Dis. 7(ofaa169)2020.PubMed/NCBI View Article : Google Scholar
|
|
25
|
Soraya GV and Ulhaq ZS: Crucial laboratory
parameters in COVID-19 diagnosis and prognosis: An updated
meta-analysis. Med Clin (Barc). 155:143–151. 2020.PubMed/NCBI View Article : Google Scholar
|
|
26
|
Thomas T, Stefanoni D, Dzieciatkowska M,
Issaian A, Nemkov T, Hill RC, Francis RO, Hudson KE, Buehler PW,
Zimring JC, et al: Evidence of structural protein damage and
membrane lipid remodeling in red blood cells from COVID-19
patients. J Proteome Res. 19:4455–4469. 2020.PubMed/NCBI View Article : Google Scholar
|
|
27
|
Wang K, Zuo P, Liu Y, Zhang M, Zhao X, Xie
S, Zhang H, Chen X and Liu C: Clinical and laboratory predictors of
in-hospital mortality in patients with coronavirus disease-2019: A
cohort study in Wuhan, China. Clin Infect Dis. 71:2079–2088.
2020.PubMed/NCBI View Article : Google Scholar
|
|
28
|
Sager R, Kutz A, Mueller B and Schuetz P:
Procalcitonin-guided diagnosis and antibiotic stewardship
revisited. BMC Med. 15(15)2017.PubMed/NCBI View Article : Google Scholar
|
|
29
|
Hu R, Han C, Pei S, Yin M and Chen X:
Procalcitonin levels in COVID-19 patients. Int J Antimicrob Agents.
56(106051)2020.PubMed/NCBI View Article : Google Scholar
|
|
30
|
Lippi G and Plebani M: Procalcitonin in
patients with severe coronavirus disease 2019 (COVID-19): A
meta-analysis. Clin Chim Acta. 505:190–191. 2020.PubMed/NCBI View Article : Google Scholar
|
|
31
|
Liu F, Li L, Xu M, Wu J, Luo D, Zhu Y, Li
B, Song X and Zhou X: Prognostic value of interleukin-6, C-reactive
protein, and procalcitonin in patients with COVID-19. J Clin Virol.
127(104370)2020.PubMed/NCBI View Article : Google Scholar
|
|
32
|
Fang FC, Naccache SN and Greninger AL: The
laboratory diagnosis of COVID-19-frequently-asked questions. Clin
Infect Dis, Jun 8, 2020 (Epub ahead of print).
|
|
33
|
Chen R, Sang L, Jiang M, Yang Z, Jia N, Fu
W, Xie J, Guan W, Liang W, Ni Z, et al: Longitudinal hematologic
and immunologic variations associated with the progression of
COVID-19 patients in China. J Allergy Clin Immunol. 146:89–100.
2020.PubMed/NCBI View Article : Google Scholar
|