Introduction
Hepatitis B virus (HBV) is a double-stranded DNA
virus that causes acute and chronic hepatitis, cirrhosis and
hepatocellular carcinoma, and poses a significant threat to human
health (1). It is estimated by the
World Health Organization that 257 million people worldwide are
chronically infected with HBV, and ~887,000 people die each year
from complications associated with HBV/hepatic cell carcinoma
(2). Interferon (IFN)-α is a
cytokine with immunomodulatory and antiviral effects, which is one
of the first choices for clinical treatment of chronic hepatitis B
(CHB) (3,4). However, the long-term application of
IFN-α is prone to result in drug resistance, which severely limits
the effectiveness of IFN drugs (5).
IFN-α exerts anti-HBV effects primarily via the
JAK-STAT signaling pathway (6,7). This
begins with IFN-α binding the pattern recognition receptor on the
cell membrane, which results in heterodimerization of IFNAR1/2, the
subunit of the receptor. This subsequently changes the
intracellular conformation of the receptor and activates janus
kinase (JAK). JAK phosphorylates signal transducer and activator of
transcription (STAT) in the cytoplasm, which then forms STAT1/2
heterodimers and is transported to the nucleus to interact with
IFN-stimulated response elements (ISRE). This initiates the
transcription of IFN-stimulated genes (ISGs), resulting in proteins
which exert direct or indirect antiviral effects (8), such as double-stranded RNA-dependent
protease (Protein Kinase r; RKR) and 2',5'-oligoadenylate
synthetase 1 (OAS1), anti-myxovirus protein (myxovirus resistance
protein A; MxA), ISG15. Subsequently, STAT1 can be dephosphorylated
by tyrosine phosphatase in the nucleus and translocated to the
cytoplasm for reuse.
JAKs are a group of intracellular non-receptor
tyrosine kinases, comprising four family members: JAK1, JAK2, JAK3
and TYK2. They mediate the signal transduction of a variety of
cytokines and growth factors, participate in immunity and
inflammation, and regulate hematopoiesis cell development,
differentiation, apoptosis and biological functions (9). In previous years, several JAK kinase
inhibitors have been developed, either already on the market or
still in clinical trial stages, such as Ruxolitibib an inhibitor of
JAK1 and JAK2 (produced by Incyte Corporation) (10) or Tofacitinib, an inhibitor of JAK3
and JAK1 (produced by Pfizer, Inc.) (11). AG-490 is a JAK inhibitor that blocks
the phosphorylation of tyrosine or serine at specific sites of JAK,
thereby preventing the binding of JAK to STAT and activation of
downstream signaling (12).
Previous studies of cancer, smooth muscle and intimal proliferative
diseases have revealed that AG-490 can inhibit STAT3 activity,
thereby reducing the in vitro invasiveness of human
pancreatic cancer cells (12,13).
STAT1 is a key molecule in the JAK-STAT signaling
pathway (14), and the
phosphorylation (15-17)
and acetylation (18,19) of which have an important impact on
the antiviral activity of IFN-α. Concurrently, resistance of the
virus to IFN-α is associated with the phosphorylation of STAT1. For
example, inhibition of STAT1 phosphorylation can make HCV resistant
to IFN-α (15). Also, modification
of STAT1 phosphorylation reduces the resistance of HCV to IFN-α
(16). Nevertheless, whether the
association between STAT1 phosphorylation in HBV is the same as
that in HCV is yet to be elucidated. The present study aimed to
investigate the resistance of HBV to IFN-α based on a resistant
cell model. The HepG2.2.15 cell line is widely used as an in
vitro cell model for anti-HBV research (20). Therefore, in the current study, the
mechanism of resistance to IFNα-2b and its association with STAT1
was explored using the pre-established IFNα-2b-resistant
HepG2.2.15/IFNα-2b cell model (21), so as to provide a basis for finding
suitable interventions.
Materials and methods
Induction of drug-resistant cell lines
(HepG2.2.15/IFNα-2b)
HepG2.2.15 cells (purchased from Shanghai Bodong
Biotechnology Co., Ltd.) were routinely cultured in
25-cm2 culture flasks in Dulbecco's Modified Eagle
Medium (DMEM, Gibco; Thermo Fisher Scientific, Inc.) supplemented
with 10% (v/v) fetal bovine serum (Gibco; Thermo Fisher Scientific,
Inc.) at 37˚C in a humidified incubator at 5% CO2. Cells
were divided into 5 groups after counting, and were placed into
culture solution, into which IFNα-2b (Anhui Anke Biotechnology Co.,
Ltd.; at final concentrations of 0, 10, 30, 50 and 70 IU/ml) and
G418 (Beijing Solarbio Science & Technology Co.,
Ltd.) (380 mg/l), were added for induction, and cells were cultured
at 37˚C for 3-4 days. The culture medium was replaced every 3 days,
and the cells were digested and counted every 5-6 days, and were
continuously cultured with IFNα-2b for 24 weeks. Then the
supernatants and cells were harvested on the 3rd and 6th day, and
stored at -80˚C for subsequent experiments. The levels of hepatitis
B surface antigen (HBsAg) and hepatitis B e antigen (HBeAg) in the
supernatant were detected using ELISAs. HBV DNA was tested using
PCR-fluorescence probe, the expression of cellular protein was
detected via western blotting and the relative expression of mRNA
in cells was detected via reverse transcription-quantitative
(RT-q)PCR.
Comparison of HepG2.2.15 and
HepG2.2.15/IFNα-2b cells
HepG2.2.15 cells and HepG2.2.15/IFNα-2b cells were
selected and separately divided into 5 groups, of which group 1 was
considered as the control group. The other four groups were treated
with the following: i) Group 1, IFNα-2b (1,000 IU/ml); group 2,
IFNα-2b (1,000 IU/ml) + AG-490 (1 µM); group 3, IFNα-2b (1,000
IU/ml) + Trichostatin A(TSA) (30 nmol/ml); and iv) group 4, IFNα-2b
(1,000 IU/ml) + AG-490 (1 µM) + TSA (30 nmol/ml), respectively, and
were cultured at 37˚C for 24 h. Then the supernatant and cells were
collected. The levels of HBsAg and HBeAg were detected using
enzyme-linked immunosorbent assay (ELISA), and the Quantification
Kits for HBsAg (cat. no. S10910113) and HBeAg (cat. no.
20123400740) were provided by Kehua Biotechnology Co., Ltd., China.
The HBV DNA was detected by PCR-fluorescence probe, expressions of
STAT1, p-STAT1 and OAS1 proteins were detected via western
blotting, expression levels of mRNA in β-actin, STAT1, OAS1 and
Ubiquitin-Specific Protease 18 (USP18) were detected by
quantitative reverse transcription PCR (RT-qPCR).
Western blotting
Cells were lysed in lysis buffer (Beyotime Institute
of Biotechnology) for 30 min at 4˚C, and centrifuged at 12,000
r/min for 10 min, then the supernatants (containing soluble
proteins) were quantified using the UV-Vis spectrophotometer (SSI).
The protein samples (30-50 µg/lane) were separated on 12% SDS
polyacrylamide gels at 20 mA. The separated proteins were
transferred to PVDF membrane (EMD Millipore; 1.5 h at 160 mA using
a Bio-Rad mini-transblotter), and immunoblotted at 4˚C for 12 h
with primary antibodies against STAT1 (1:1,000; Cell Signaling
Technology, Inc.; cat. no. 9176), p-STAT1 (1:1,000; Cell Signaling
Technology, Inc; cat. no. 9167) and OAS1 (1:1,000; Cell Signaling
Technology, Inc.; cat. no. 14498), and incubated with
horseradish-peroxidase-conjugated secondary antibody (1:10,000;
Beijing Zhongshan Jinqiao Biological Technology Co., Ltd.) at room
temperature for 1.5 h. Immunoreactive bands were visualized by
enhanced chemiluminescence (Beyotime Institute of Biotechnology).
The intensities of bands were normalized to β-actin (1:1,000;
Beijing Zhongshan Jinqiao Biological Technology. Co., Ltd.) and
analyzed using Image J software (Version 1.6.1 for Windows;
National Institutes of Health).
RT-qPCR
All steps were performed using a sterile technique
in designated areas for RNA extraction and RT-qPCR. The specific
primer sequences were synthesized by Shanghai Sangon Biotech Co.,
Ltd., and the sequences are displayed in Table I. Total RNA was extracted according
to the instructions of total RNA small quantity kit (Axygen;
Corning Inc.). The quantity and purity of RNA were measured by
reading the absorbance at 260 and 280 nm with the UV-Vis
spectrophotometer (SSI). According to the protocol of the
PrimeScript RT Master Mix (Perfect Real Time; Takara Biotechnology
Co., Ltd.), the reverse transcription and amplification were
performed in a reaction volume of 20 µl, containing 1 µg total RNA.
Samples were incubated at 95˚C for 30 sec, and then 40 cycles of
amplification were conducted using the following program: 95˚C for
5 sec and 60˚C for 30 sec (22).
 | Table IPrimers for reverse
transcription-quantitative PCR. |
Table I
Primers for reverse
transcription-quantitative PCR.
| Gene | Sequence (5'-3') |
|---|
| β-actin | Forward:
GGGAAACTGTGGCGTGAT |
| | Reverse:
AAAGGTGGAGGAGTGGGT |
| STAT1 | Forward:
GAACTTACCCAGAATGCC |
| | Reverse:
CTTTCCACCACAAACGAG |
| OAS1 | Forward:
AGGTGGTAAAGGGTGGCT |
| | Reverse:
TGCTTGACTAGGCGGATG |
| USP18 | Forward:
CAGACCCTGACAATCCACCT |
| | Reverse:
AGCTCATACTGCCCTCCAGA |
qPCR of HBV
HBV DNA was extracted from culture supernatants
using a DNA Extraction kit (Da'an gene Co., Ltd, China, https://www.daangene.com), and qPCR was performed in a
96-well Real-Time PCR instrument (Applied Biosystems; Thermo Fisher
Scientific, Inc.) using an HBV fluorescent quantitative PCR
detection kit (Kehua Biotechnology Co., Ltd.). DNA template (100
ng, 2.0 µl) was added to the amplification tube containing the
reaction mixture (PCR reaction solution A, 13.5 µl; PCR reaction
solution B, 13.5 µl; PCR reaction solution C, 1.0 µl). After
initial denaturation (94˚C for 2 min), and then 40 cycles of
denaturation (94˚C for 10 sec) and annealing/extension (60˚C for 30
sec). In this assay, HBV DNA was quantified using a standard curve;
the linear range was 1x10³-1x10⁸ copies/ml
(23). Each sample was run in
duplicate.
Statistical analysis
Statistical analyses were performed using SPSS 17.0
software (SPSS, Inc.). Measurement data were expressed as mean ±
SD, and were analyzed using the independent samples t-test. One-way
ANOVA followed by Tukey's post hoc test was used for multiple
pairwise comparisons, with an inspection level α=0.05. P<0.05
was considered to indicate a statistically significant difference,
while P<0.01 was considered to indicate an extremely significant
difference.
Results
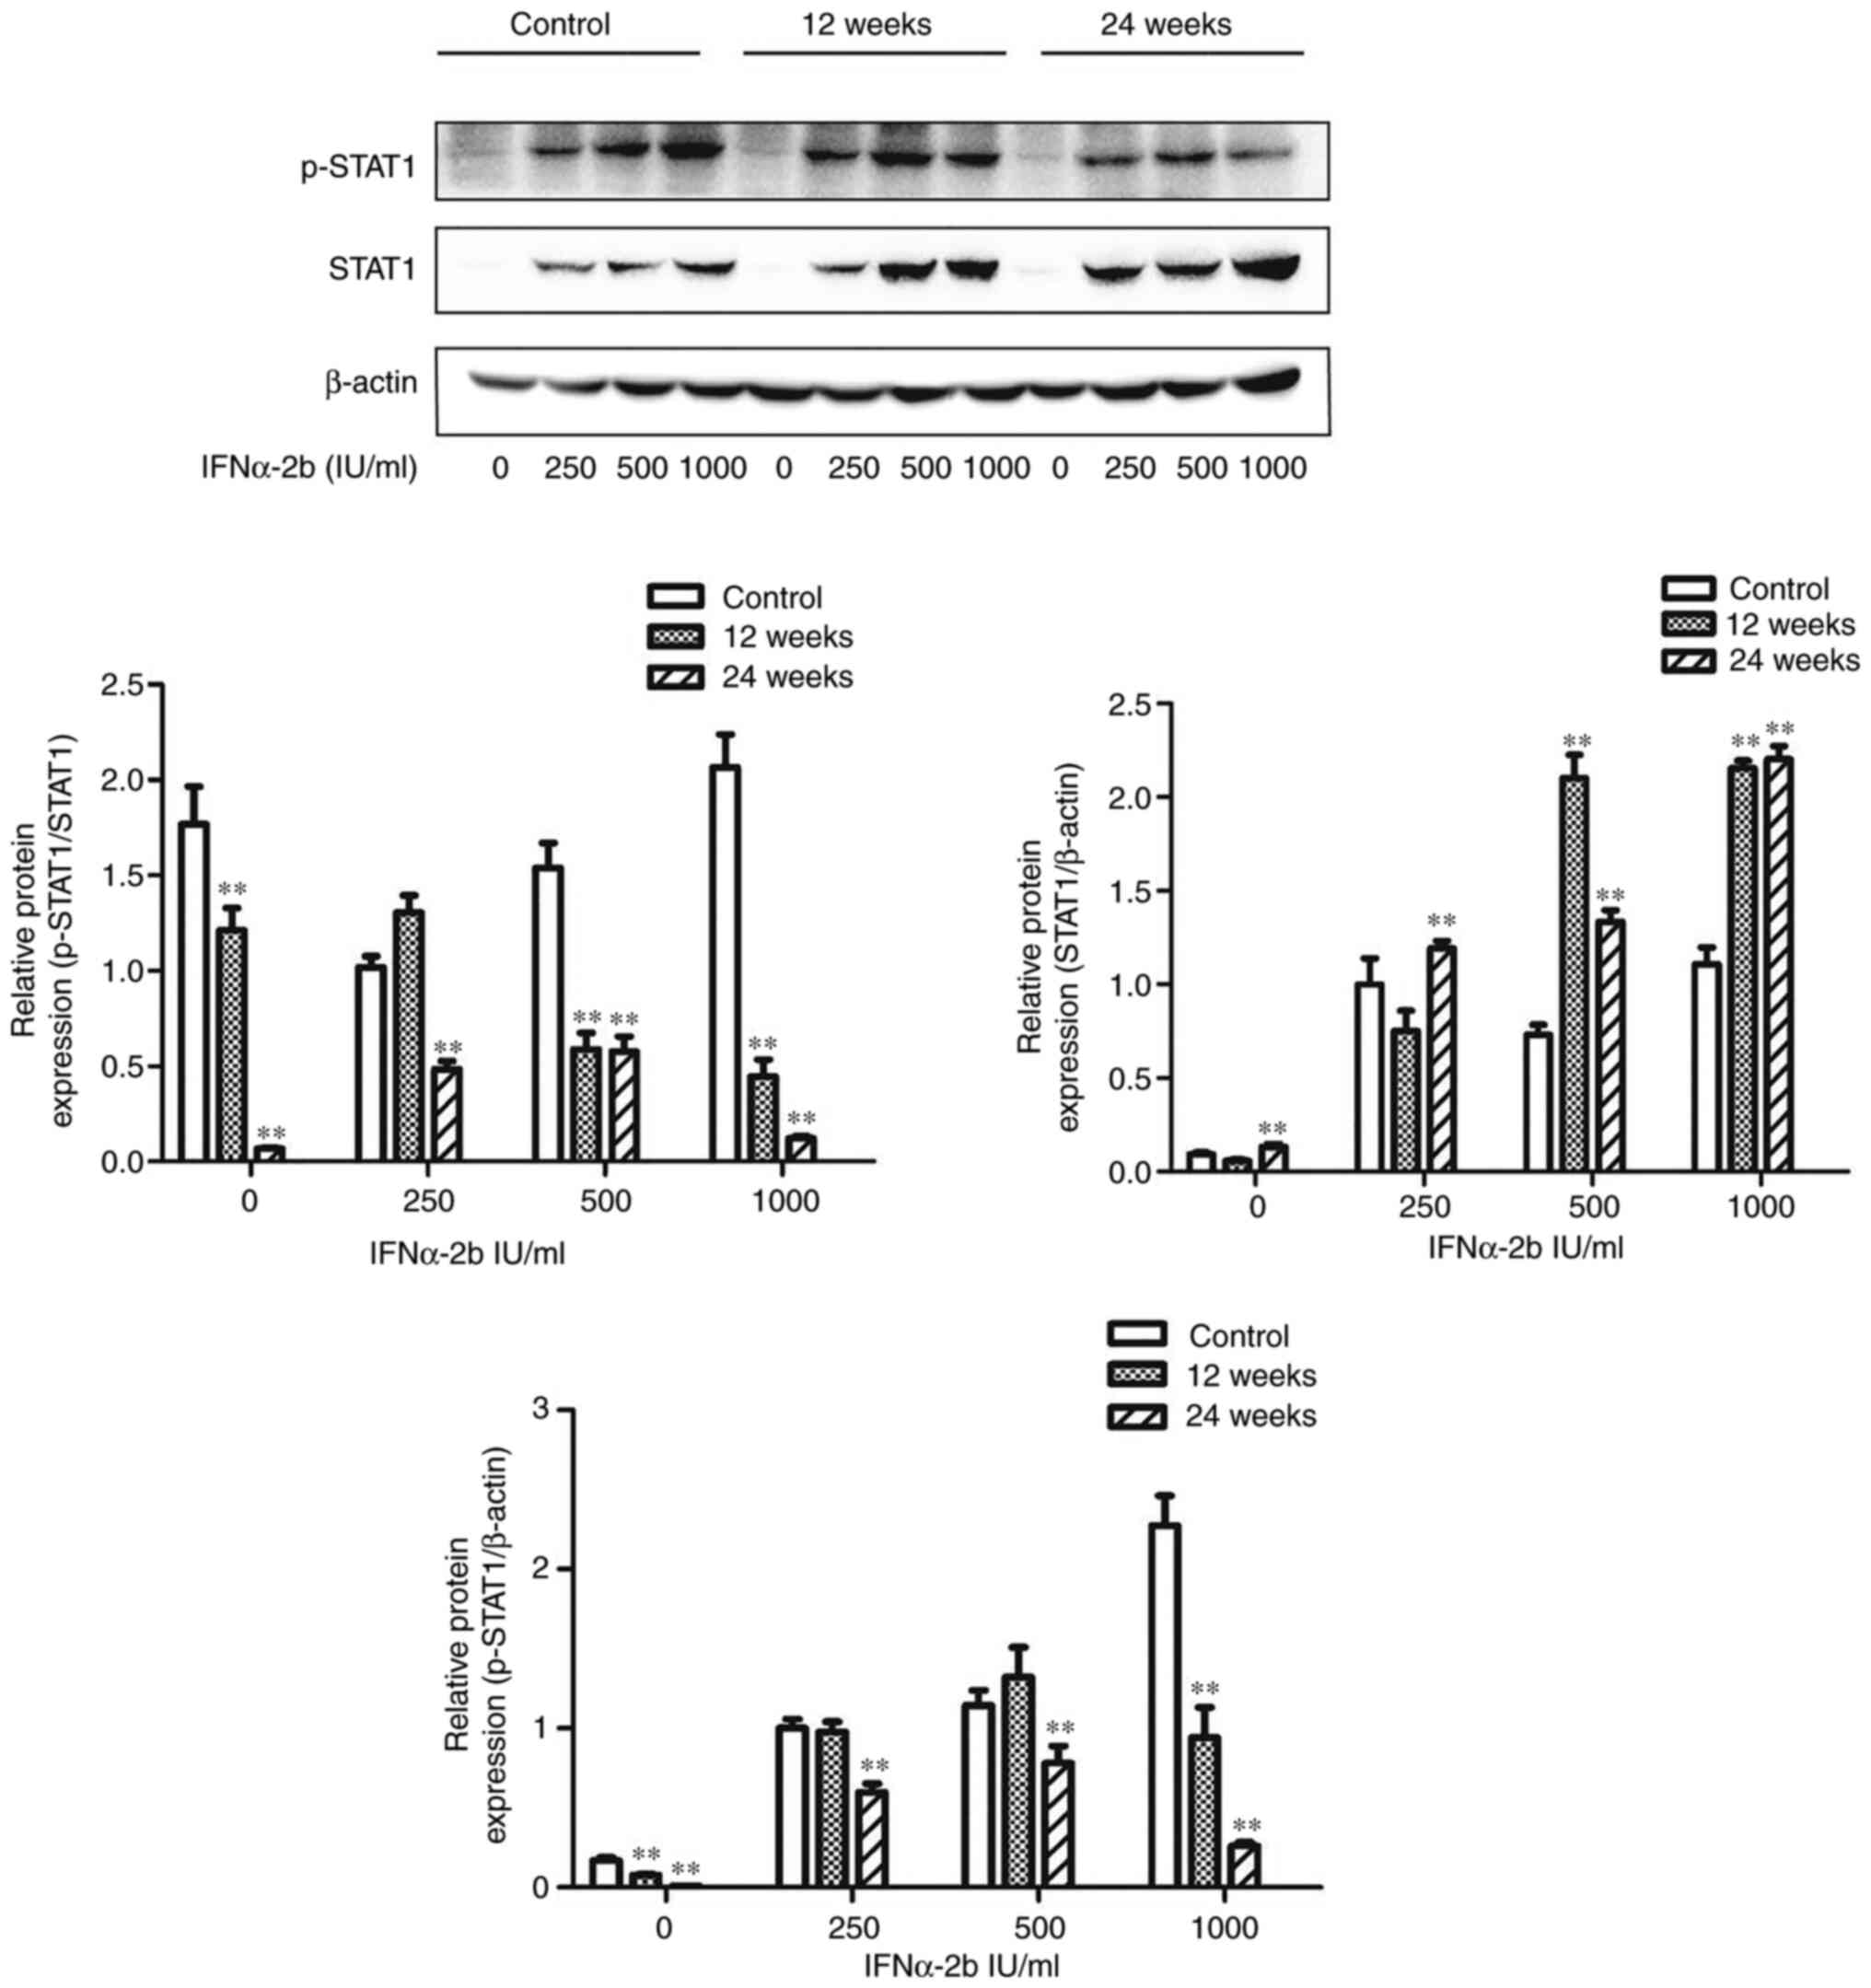
Expression levels of STAT1 and p-STAT1
proteins in HepG2.2.15 cells after long-term stimulation with a low
dose of IFNα-2b
Cells in the control group, 12-week stimulation
group and 24-week stimulation group were treated with 0, 250, 500
and 1,000 IU/ml IFNα-2b for 72 h, and the expression levels of
STAT1 and p-STAT1 proteins were examined using western blotting.
The results revealed that compared with the control group, at all
concentrations of IFNα-2b, the expression of p-STAT1 protein was
downregulated and the expression of STAT1 protein was upregulated,
and p-STAT1/STAT1 was significantly decreased in the 24-week
stimulation group (P<0.05). In the 12-week stimulation group,
the expression of p-STAT1 protein was downregulated when the
concentration of IFNα-2b was 1,000 IU/ml, the expression of STAT1
protein was upregulated when the concentration of IFNα-2b was 500
and 1,000 IU/ml, and p-STAT1/STAT1 was significantly decreased
(P<0.05) (Fig. 1).
Effects of AG-490 and TSA on IFNα-2b
inhibition to HBsAg, HBeAg and HBV DNA
In the control group, the inhibitory effect of
IFNα-2b on HBsAg, HBeAg and HBV DNA was significantly decreased
after administration of AG-490 (P<0.05). In the model group,
after administration of AG-490, the anti-HBsAg effect of IFNα-2b
was almost unchanged, while the inhibitory effect on HBeAg and HBV
DNA was significant decreased (P<0.05). Notably, the decrease
was smaller than that in the control group. Meanwhile, after
treatment with TSA, the inhibitory effect of IFNα-2b on HBsAg,
HBeAg and HBV DNA was significantly decreased in the control group,
after administration of AG-490 (P<0.05). In the model group,
after treatment with TSA, the anti-HBsAg and HBV DNA effects of
IFNα-2b were almost unchanged, while the inhibitory effect on HBeAg
was significantly decreased (P<0.05). Notably, after
simultaneous treatment with AG-490 and TSA, the inhibition rates of
HBsAg, HBeAg and HBV DNA were significantly decreased in both the
control group and model group (P<0.05); however, the decrease
was more notable in the control group (Fig. 2).
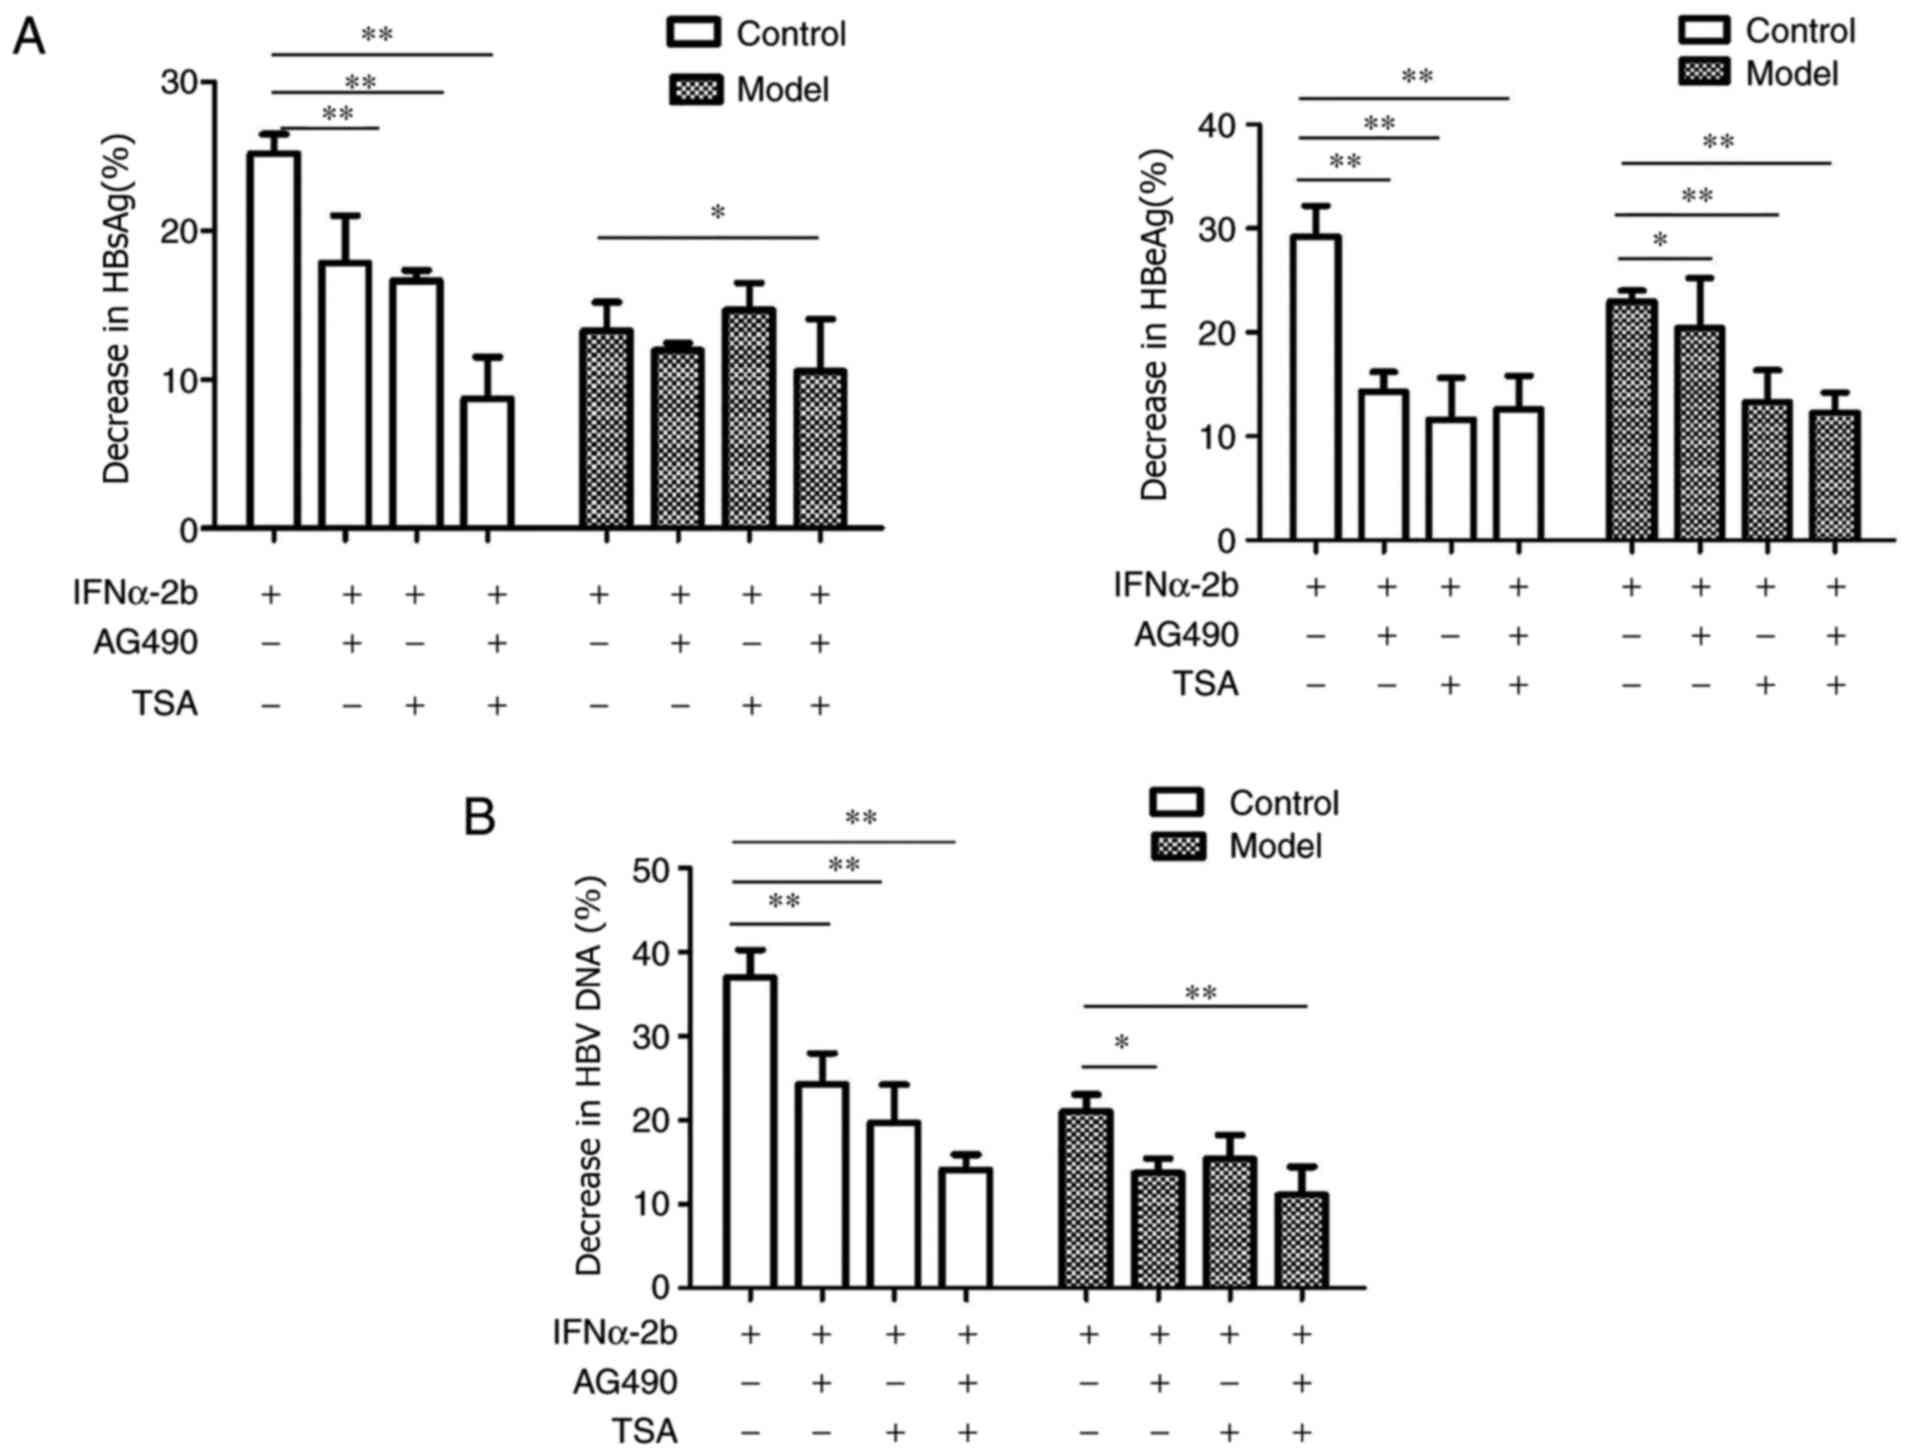 | Figure 2Effects of AG-490 and TSA on HBsAg,
HBeAg and HBV DNA of IFNα-2b. The control and model groups were
treated with 0, IFNα-2b (1,000 IU/ml), IFNα-2b (1,000 IU/ml) +
AG-490 (1 µM), IFNα-2b (1,000 IU/ml) + TSA (30 nmol/ml), IFNα-2b
(1,000 IU/ml) + AG-490 (1 µM) + TSA (30 nmol/ml) for 24 h. (A) The
levels of HBsAg and HBeAg were detected using ELISA kits. (B) The
amount of HBV DNA was detected by PCR-fluorescence probing. Data
were expressed as the mean ± SD. Error bars were calculated from
three independent experiments. Experiments were performed at least
in triplicate. The P-values were obtained using one-way ANOVA
followed by Tukey's post hoc test. *P<0.05;
**P<0.01. TSA, Trichostatin A; HBsAg, hepatitis B
surface antigen; HBeAg, hepatitis B e antigen; HBV, hepatitis B
virus. |
Effects of AG-490 and TSA on the
expression levels of p-STAT1, STAT1 and OAS1 proteins
The expressions of p-STAT1, STAT1 and OAS1 proteins
were significantly downregulated in the control group after
administration of AG-490 (P<0.05). Similarly, the expressions of
p-STAT1, STAT1 and OAS1 proteins were significantly downregulated
in the model group after administration of AG-490 (P<0.05), and
the decrease of p-STAT1 in the control group was more notable than
that in the model group. After treatment with TSA, the expression
levels of STAT1 and OAS1 proteins were significantly downregulated
in both the control and model groups (P<0.05). After treatment
with a combination of AG-490 and TSA, the expressions of p-STAT1,
STAT1 and OAS1 were downregulated in the control group, while those
of STAT1 and OAS1 were downregulated in the model group (P<0.05)
(Fig. 3).
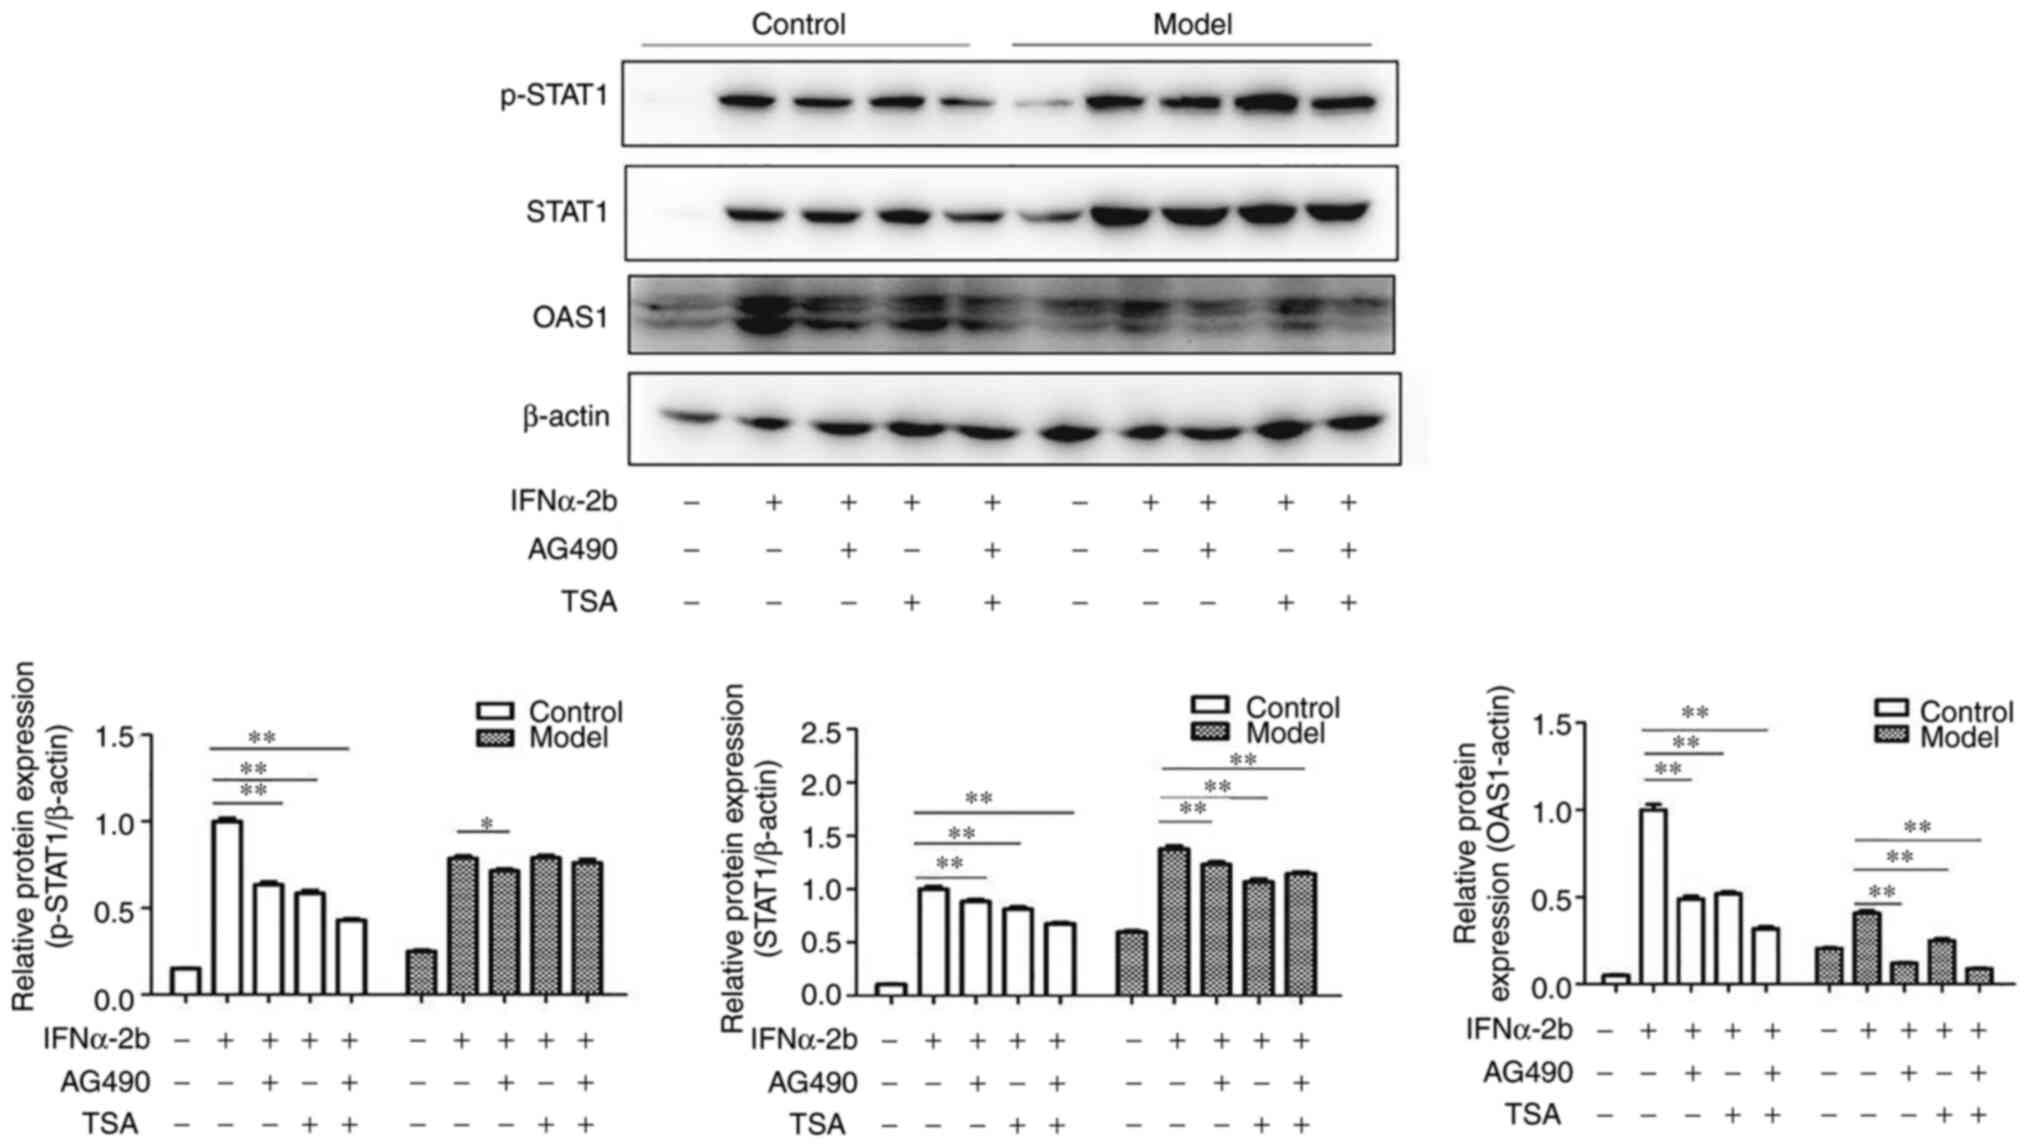 | Figure 3Effects of AG-490 and TSA on the
expression levels of STAT1, p-STAT1 and OAS1 with IFNα-2b. The
control and model groups were treated with 0, IFNα-2b (1,000
IU/ml), IFNα-2b (1,000 IU/ml) + AG-490 (1 µM), IFNα-2b (1,000
IU/ml) + TSA (30 nmol/ml), IFNα-2b (1,000 IU/ml) + AG-490(1 µM) +
TSA (30 nmol/ml) for 24 h. Then, proteins were quantified via
western blotting. Data were expressed as the mean ± SD. Error bars
were calculated from three independent experiments. Samples were
done at least in triplicate. The P-values were obtained using
one-way ANOVA followed by Tukey's post hoc test.
*P<0.05; **P<0.01. TSA, Trichostatin A;
p-, phosphorylated-; OAS1, 2'-5'-oligoadenylate synthetase 1. |
Effects of AG-490 and TSA on the
expressions of STAT1, OAS1 and USP18 mRNA
The expression levels of STAT1 and OAS1 mRNA were
downregulated in the control group after administration of AG-490
(P<0.05). Meanwhile, the expression levels of STAT1 and OAS1
mRNA were downregulated and the expression of USP18 mRNA was
upregulated in the model group after administration of AG-490
(P<0.05). After treatment with TSA, the expression levels of
STAT1 and OAS1 mRNA were downregulated, and the expression of USP18
mRNA was upregulated in both the control group and model group,
where the difference was statistically significant (P<0.05).
After administration of AG-490 and TSA, the expression levels of
STAT1 and OAS1 mRNA were downregulated in the control and model
groups (P<0.05), while the expression level of USP18 mRNA was
significantly upregulated in the model group (P<0.05) (Fig. 4).
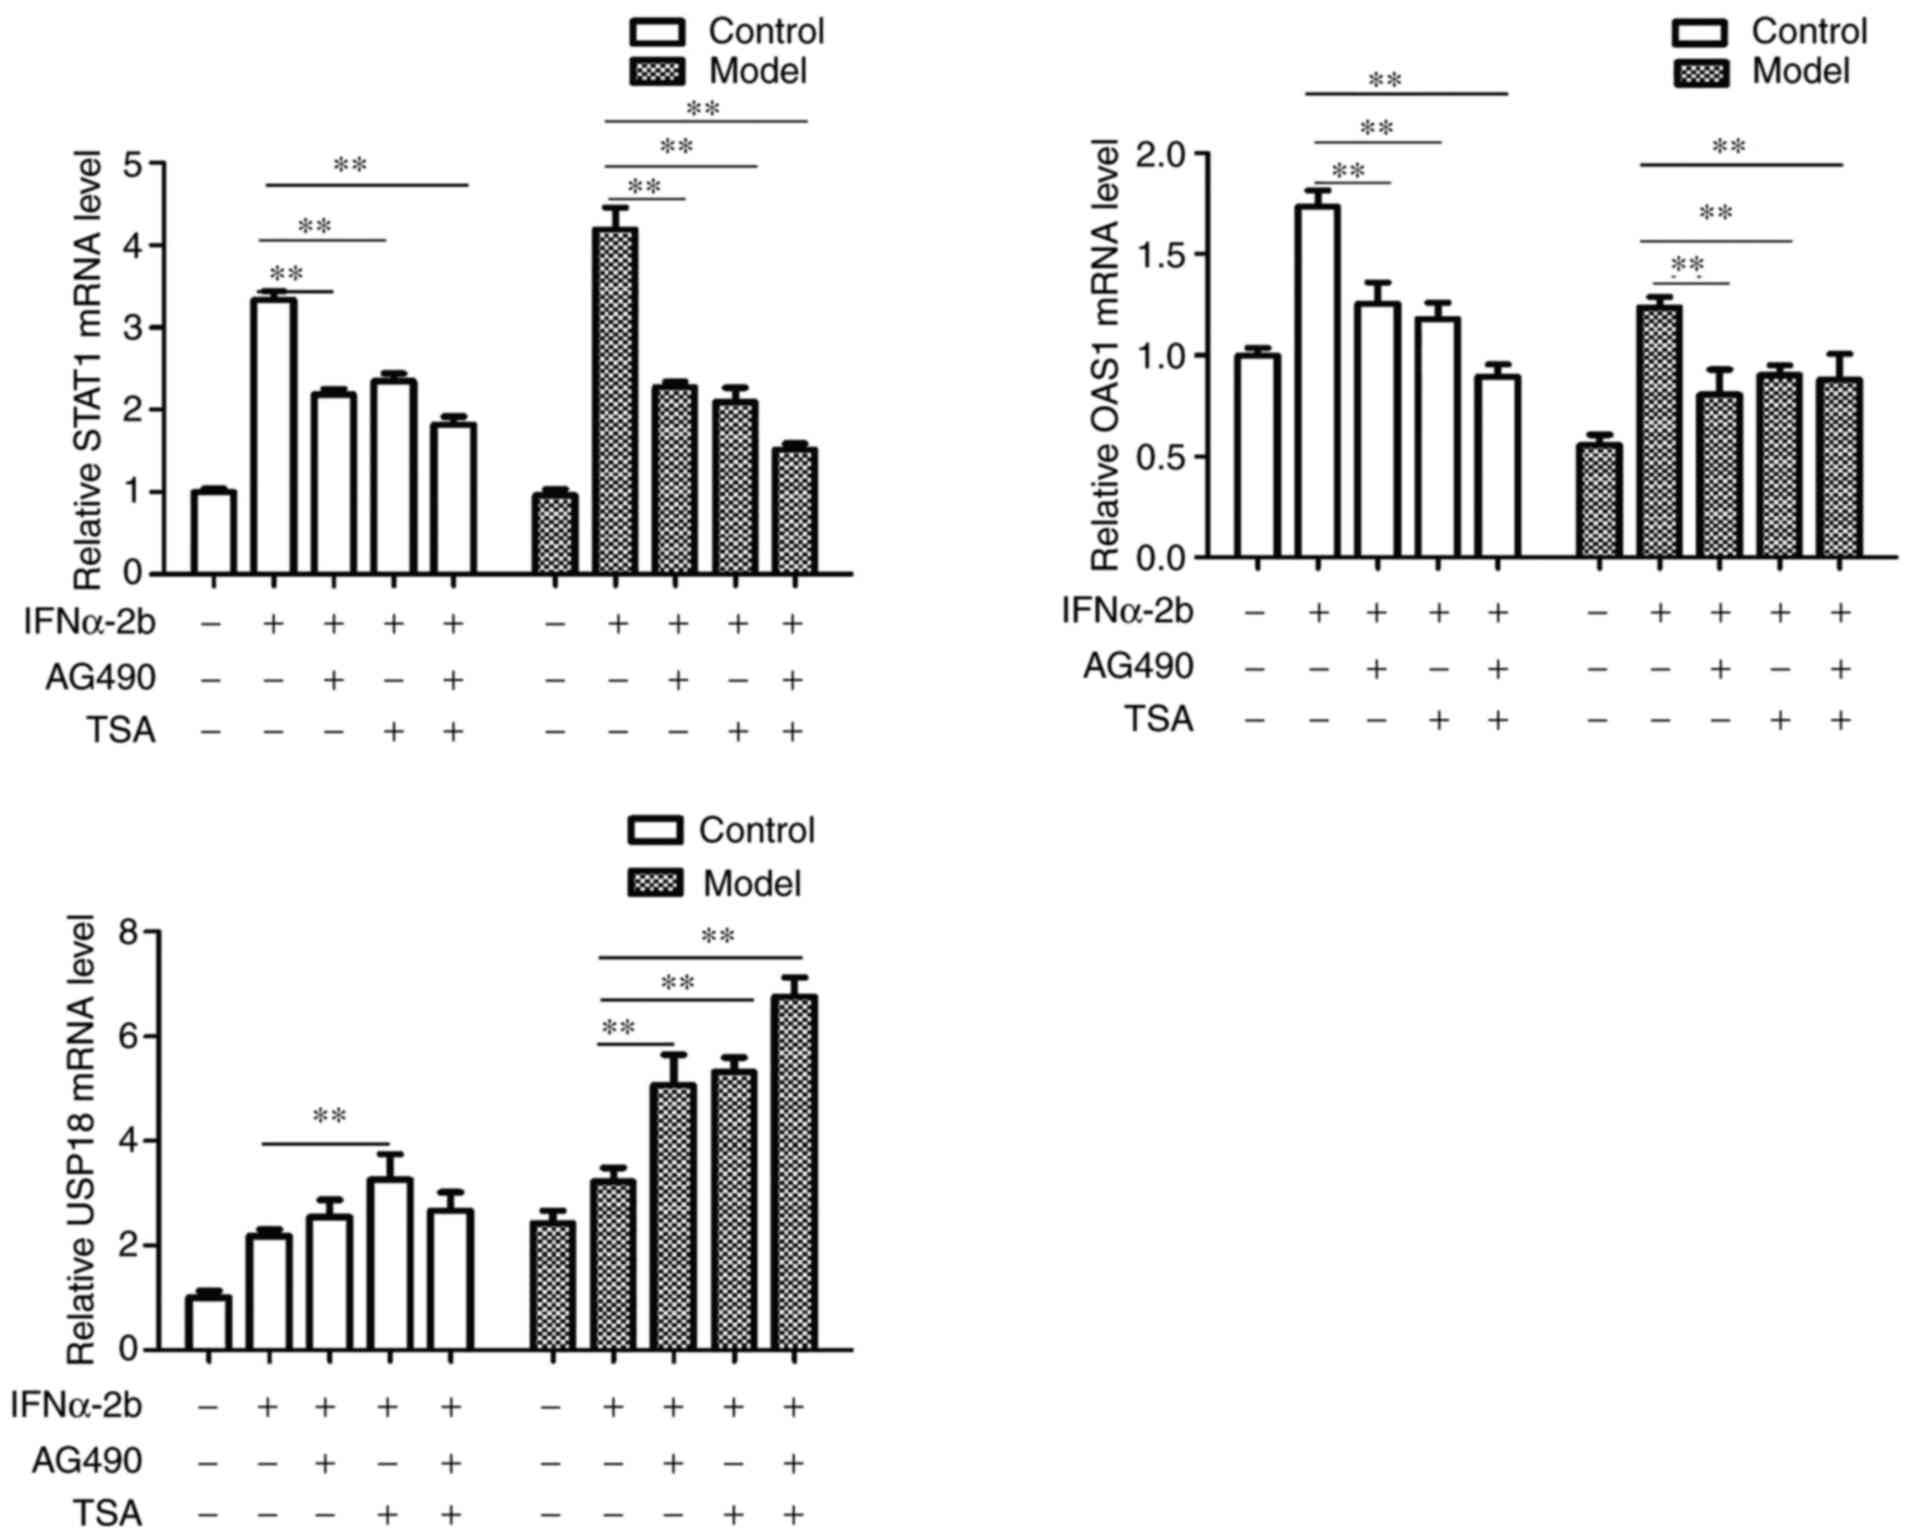 | Figure 4Effects of AG-490 and TSA on the mRNA
expression level of STAT1, OAS1 and USP18. The control and model
groups were treated with 0, IFNα-2b (1,000 IU/ml), IFNα-2b (1,000
IU/ml) + AG-490 (1 µM), IFNα-2b (1,000 IU/ml) + TSA (30 nmol/ml),
IFNα-2b (1,000 IU/ml) + AG-490(1 µM) + TSA (30 nmol/ml) for 24 h.
Then, the mRNA expression levels of STAT1, OAS1 and USP18 were
quantified via reverse transcription-quantitative PCR. Data were
expressed as the mean ± SD. Error bars were calculated from three
independent experiments. Experiments were performed at least in
triplicate. The P-values were obtained using one-way ANOVA followed
by Tukey's post hoc test. **P<0.01. TSA, Trichostatin
A; USP18, Ubiquitin-Specific Protease 18; OAS1,
2'-5'-oligoadenylate synthetase 1. |
Discussion
HBV resistance is the primary factor limiting the
clinical application of IFN-α as treatment for patients with HBV
(24,25). Establishing an in vitro drug
resistance cell model is one of the important means to study the
drug resistance mechanism. Current methods for establishing
drug-resistant cell lines primarily include the in vitro
drug induction and drug-resistant gene transfection methods. The
latter can be achieved by either low-concentration long-term
maintenance or intermittent high-dose shock with gradually
increased doses (26). The method
of low-concentration long-term maintenance is a common method to
screen successful and stable drug-resistant strains (27).
In the present study, HepG2.2.15 cell lines were
continuously stimulated with low concentrations of IFNα-2b for 24
weeks, and it was revealed that the sensitivity of cells to IFNα-2b
was significantly decreased, the inhibition rates of HBsAg, HBeAg
and HBV DNA were decreased to varying degrees, and drug resistance
was gradually developed. This suggests that IFN-α-resistant HBV
cell models can also be constructed using low-dose continuous
stimulation.
The method of low-concentration long-term
maintenance is a common method to screen successful and stable
drug-resistant strains, and was the method used in the present
study. IFNα-2b concentrations of 10, 30, 50 and 70 IU/ml were used
to treat HepG2.2.15 cells, with the aim of establishing a cell line
resistant to IFN-α. We agree that IFNα-2b treatment will only
inhibit the replication of the virus in the sensitive cells. But
for IFNα-resistant cell model, IFN-α treatment exerts similar
effects; however, this effect was significantly reduced compared
with sensitive cells. Certainly, for both sensitive and resistant
cells, the effect is not killing the cell but merely inhibiting DNA
replication.
A number of studies have reported that IFN-α exerts
an anti-HBV effect mainly through the JAK-STAT signaling pathway,
which induces the expression of antiviral protein OAS1 and produces
an antiviral effect (28-31).
Phosphorylation of STAT1 serves an important role in this signaling
pathway. After stimulation with IFNα-2b, the expression of p-STAT1
protein was decreased in HepG2.2.15/IFNα-2b cells, and the ratio of
p-STAT1/total STAT1 was significantly lower than that of the
control group, and the expression of antiviral protein OAS1 in the
downstream was significantly decreased. Downregulation of STAT1
phosphorylation is part of the mechanism by which HBV is resistant
to IFNα-2b. As the phosphorylation level of STAT1 is inhibited, it
directly affects the expressions of associated genes and antiviral
proteins in the downstream of JAK-STAT signaling pathway, which
significantly weakens the antiviral effect of IFNα-2b on HBV. The
present study also revealed that expression of USP18 mRNA was
significantly increased at the transcriptional level. It has been
reported that USP18 negatively regulates the JAK-STAT signaling
pathway, which inhibits phosphorylation of STAT1 and prevents
nuclear transport of phosphorylated STAT1(32).
In the present study, HepG2.2.15/IFNα-2b cells and
HepG2.2.15 cells were treated with AG-490 and TSA to investigate
the changes of their anti-HBV activity after administration of
IFNα-2b. It was revealed that the anti-HBV effect of IFNα-2b was
weakened to varying degrees after treatment with AG-490 and TSA,
which manifested as the decrease of inhibition rates of HBsAg,
HBeAg and HBV DNA, downregulation of p-STAT1 and OAS1 protein
expressions, as well as corresponding changes in mRNA expressions.
Previous studies have reported that phosphorylation-acetylation
equilibrium is an important switch regulating STAT1 signaling.
Phosphorylation of STAT1 tyrosine and serine is a necessity for
STAT1 to serve its role, while acetylation of STAT1 lysine can
promote dephosphorylation and inactivation of STAT1 (18,33,34).
Whether STAT1 serves its role depends on the balance of
intracellular phosphorylation-acetylation. Therefore, the
resistance of IFNα-2b to HepG2.2.15/IFNα-2b cells may be associated
with the phosphorylation-acetylation balance, which in turn affects
the role of STAT1 in the signaling pathway and ultimately changes
the antiviral activity.
The present study primarily focused on STAT1 rather
than STAT3. While STAT3 regulates growth, proliferation,
differentiation and apoptosis in normal cells. Current studies in
tumors have reported that inhibiting STAT3 not only directly acts
on tumor cells to inhibit tumor growth and metastasis, but also
regulates tumor-related immune cells. Investigation using clinical
tumor samples confirmed that STAT3 promotes tumor cell
proliferation and metastasis and has the function of inhibiting
cell apoptosis. In vivo and in vitro experiments
demonstrated that cancer cells highly express STAT3, and this is
positively correlated with tumor metastasis (35). Previous studies have also reported
that STAT3 inhibits the activity of T lymphocytes in the immune
microenvironment and regulates the expression of PD-L1 to promote
tumor immune escape (36). STAT3
has become one of the popular targets for anti-tumor and tumor
immunotherapy (37). However,
whether the expression of STAT3 and its downstream related proteins
in the JAK-STAT signaling pathway are associated with the
resistance of HBV to IFN-α is yet to be elucidated. Future studies
should be designed with related experiments to investigate this
issue.
In addition, the present study established an
IFN-α-resistant HBV cell model and tested AG-490 and TSA on these
resistant cell lines. Nevertheless, whether using a JAK agonist can
improve the antiviral effect of IFN-α warrants further
investigation, and the result could be very meaningful to clinical
research. Therefore, we also have plan to will also design
experiments.
In conclusion, a low level of STAT1 phosphorylation
in the JAK-STAT signaling pathway is part of the mechanism
underlying HBV resistance to IFN-α, which may be closely associated
with high expression of USP18, the balance of STAT1 phosphorylation
and acetylation. The specific mechanism underlying HBV resistance
to IFN-α remains to be elucidated, for which in-depth research will
be continued.
Acknowledgements
The authors would like to thank Professor Lihua Song
(Anhui Academic Institute of Biology), Professor Luyan Fan
(Department of Pharmacy, The Third Affiliated Hospital of Anhui
Medical University) and Mr Kan Qin (Department of Pharmacy, The
Third Affiliated Hospital of Anhui Medical University) for their
support and leadership.
Funding
Funding: The present study was supported by grants from National
Natural Science Foundation of China (grant no. 81470165).
Availability of data and materials
The datasets used and/or analyzed during the current
study are available from the corresponding author on reasonable
request.
Authors' contributions
BX designed this study. BT and JW performed
experiments and statistical analysis. BX and BT wrote the
manuscript. BX and BT confirm the authenticity of all the raw data.
All authors read and approved the final manuscript.
Ethics approval and consent to
participate
The present study was approved by the Ethics
Committee of Anhui Medical University (Anhui, China).
Patient consent for publication
Not applicable.
Competing interests
The authors declare that they have no competing
interests.
References
|
1
|
Woo HG, Kim SS, Cho H, Kwon SM, Cho HJ,
Ahn SJ, Park ES, Lee JS, Cho SW and Cheong JY: Profiling of exome
mutations associated with progression of HBV-related hepatocellular
carcinoma. PLoS One. 9(e115152)2014.PubMed/NCBI View Article : Google Scholar
|
|
2
|
Schweitzer A, Horn J, Mikolajczyk RT,
Krause G and Ott JJ: Estimations of worldwide prevalence of chronic
hepatitis B virus infection: A systematic review of data published
between 1965 and 2013. Lancet. 386:1546–1555. 2015.PubMed/NCBI View Article : Google Scholar
|
|
3
|
Cho H and Kelsall BL: The role of type I
interferons in intestinal infection, homeostasis, and inflammation.
Immunol Rev. 260:145–167. 2014.PubMed/NCBI View Article : Google Scholar
|
|
4
|
Terrault NA, Lok ASF, Mcmahon BJ, Chang
KM, Hwang JP, Jonas MM, Brown RS Jr, Bzowej NH and Wong JB: Update
on prevention, diagnosis, and treatment and of chronic hepatitis B:
AASLD 2018 hepatitis B guidance. Hepatology. 67:1560–1599.
2018.PubMed/NCBI View Article : Google Scholar
|
|
5
|
Koumbi L: Current and future antiviral
drug therapies of hepatitis B chronic infection. World J Hepatol.
7:1030–1040. 2015.PubMed/NCBI View Article : Google Scholar
|
|
6
|
Li H, Gade P, Xiao W and Kalvakolanu DV:
The interferon signaling network and transcription factor
C/EBP-beta. Cell Mol Immunol. 4:407–418. 2007.PubMed/NCBI
|
|
7
|
Mani SKK and Andrisani O: Interferon
signaling during Hepatitis B Virus (HBV) infection and
HBV-associated hepatocellular carcinoma. Cytokine.
124(154518)2019.PubMed/NCBI View Article : Google Scholar
|
|
8
|
Liongue C, O'Sullivan LA, Trengove MC and
Ward AC: Evolution of JAK-STAT pathway component: Mechanisms and
role in immune system development. PLoS One.
7(e32777)2012.PubMed/NCBI View Article : Google Scholar
|
|
9
|
O'Shea JJ and Plenge R: JAKs and STATs in
immunoregulation and immune-mediated disease. Immunity. 36:542–550.
2012.PubMed/NCBI View Article : Google Scholar
|
|
10
|
Elli EM, Baratè C, Mendicino F, Palandri F
and Palumbo GA: Mechanisms underlying the anti-inflammatory and
immunosuppressive activity of ruxolitinib. Front Oncol.
9(1186)2019.PubMed/NCBI View Article : Google Scholar
|
|
11
|
Sanachai K, Mahalapbutr P, Choowongkomon
K, Poo-Arporn RP, Wolschann P and Rungrotmongkol T: Insights into
the binding recognition and susceptibility of tofacitinib toward
janus kinases. ACS Omega. 5:369–377. 2020.PubMed/NCBI View Article : Google Scholar
|
|
12
|
Rashid S, Bibi N, Parveen Z and Shafique
S: Inhibition of Janus kinases by tyrosine phosphorylation
inhibitor, Tyrphostin AG-490. J Biomol Struct Dyn. 33:2368–2379.
2015.PubMed/NCBI View Article : Google Scholar
|
|
13
|
Huang C, Cao J, Huang KJ, Zhang F, Jiang
T, Zhu L and Qiu ZJ: Inhibition of STAT3 activity with AG490
decreases the invasion of human pancreatic cancer cells in vitro.
Cancer Sci. 97:1417–1423. 2010.
|
|
14
|
Aue A, Szelinski F, Weißenberg SY,
Wiedemann A, Rose T, Lino AC and Dörner T: Elevated STAT1
expression but not phosphorylation in lupus B cells correlates with
disease activity and increased plasmablast susceptibility.
Rheumatology (Oxford). 59:3435–3442. 2020.PubMed/NCBI View Article : Google Scholar
|
|
15
|
Hazari S, Chandra PK, Poat B, Datta S,
Garry RF, Foster TP, Kousoulas G, Wakita T and Dash S: Impaired
antiviral activity of interferon alpha against hepatitis C virus 2a
in Huh-7 cells with a defective Jak-Stat pathway. Virol J.
7(36)2010.PubMed/NCBI View Article : Google Scholar
|
|
16
|
Poat B, Hazari S, Chandra PK, Gunduz F,
Balart LA, Alvarez X and Dash S: SH2 modified STAT1 induces HLA-I
expression and improves IFN-γ signaling in IFN-α resistant HCV
replicon cells. PLoS One. 5(e13117)2010.PubMed/NCBI View Article : Google Scholar
|
|
17
|
Nguyen NV, Tran JT and Sanchez DJ: HIV
blocks Type I IFN signaling through disruption of STAT1
phosphorylation. Innate Immun. 24:490–500. 2018.PubMed/NCBI View Article : Google Scholar
|
|
18
|
Spange S, Wagner T, Heinzel T and Krämer
OH: Acetylation of non-histone proteins modulates cellular
signalling at multiple levels. Int J Biochem Cell Biol. 4:185–198.
2009.PubMed/NCBI View Article : Google Scholar
|
|
19
|
Krämer OH and Heinzel T:
Phosphorylation-acetylation switch in the regulation of STAT1
signaling. Mol Cell Endocrinol. 315:40–48. 2010.PubMed/NCBI View Article : Google Scholar
|
|
20
|
Wen D, Wang J, Yan H, Chen J, Xia K, Liu J
and Zhang A: Effect of radix trichosanthis and trichosanthin on
hepatitis B virus in HepG2.2.15 cells. J Nanosci Nanotechnol.
15:2094–2098. 2015.PubMed/NCBI View Article : Google Scholar
|
|
21
|
Wei J, Tang Bo, Xu B, et al: Construction
of interferon-resistant HBV cell model. Chin Pharm J. 52:832–837.
2017.
|
|
22
|
Livak KJ and Schmittgen TD: Analysis of
relative gene expression data using real-time quantitative PCR and
the 2(-Delta Delta C(T)) method. Methods. 25:402–408.
2001.PubMed/NCBI View Article : Google Scholar
|
|
23
|
Lu YQ, Han JX, Qi P, Xu W, Zu YH and Zhu
B: Rapid quantification of hepatitis B virus DNA by real-time PCR
using efficient TaqMan probe and extraction of virus DNA. World J
Gastroenterol. 12:7365–7370. 2006.PubMed/NCBI View Article : Google Scholar
|
|
24
|
Shaw T, Bartholomeusz A and Locarnini S:
HBV drug resistance: Mechanisms, detection and interpretation. J
Hepatol. 44:593–606. 2006.PubMed/NCBI View Article : Google Scholar
|
|
25
|
Férir G, Kaptein S, Neyts J and De Clercq
E: Antiviral treatment of chronic hepatitis B virus infections: the
past, the present and the future. Rev Med Virol. 18:19–34.
2008.PubMed/NCBI View
Article : Google Scholar
|
|
26
|
Uchibori K, Kasamatsu A, Sunaga M, Yokota
S, Sakurada T, Kobayashi E, Yoshikawa M, Uzawa K, Ueda S, Tanzawa H
and Sato N: Establishment and characterization of two
5-fluorouracil-resistant hepatocellular carcinoma cell lines. Int J
Oncol. 40:1005–1010. 2012.PubMed/NCBI View Article : Google Scholar
|
|
27
|
Tran HT, Lim YS and Hwang SB:
Establishment of interferon alpha-resistant hepatitis C virus using
cell culture system. FEBS Lett. 585:409–413. 2011.PubMed/NCBI View Article : Google Scholar
|
|
28
|
Hou ZH, Han QJ, Zhang C, Tian ZG and Zhang
J: miR146a impairs the IFN-induced anti-HBV immune response by
downregulating STAT1 in hepatocytes. Liver Int. 34:58–68.
2014.PubMed/NCBI View Article : Google Scholar
|
|
29
|
Li J, Chen F, Zheng M, Zhu H, Zhao D, Liu
W, Liu W and Chen Z: Inhibition of STAT1 methylation is involved in
the resistance of hepatitis B virus to Interferon alpha. Antiviral
Res. 85:463–469. 2010.PubMed/NCBI View Article : Google Scholar
|
|
30
|
Chen K, Liu J, Liu S, Xia M, Zhang X, Han
D, Jiang Y, Wang C and Cao X: Methyltransferase SETD2-mediated
methylation of STAT1 is critical for interferon antiviral activity.
Cell. 170:492–506, e14. 2017.PubMed/NCBI View Article : Google Scholar
|
|
31
|
Bing Y, Zhu S, Yu G, Li T, Liu W, Li C,
Wang Y, Qi H, Guo T, Yuan Y, et al: Glucocorticoid-induced
S-adenosylmethionine enhances the interferon signaling pathway by
restoring STAT1 protein methylation in hepatitis B virus-infected
cells. J Biol Chem. 289:32639–23655. 2014.PubMed/NCBI View Article : Google Scholar
|
|
32
|
Li L, Lei QS, Zhang SJ, Kong LN and Qin B:
Suppression of USP18 potentiates the anti-HBV activity of
interferon alpha in HepG2.2.15 cells via JAK/STAT signaling. PLoS
One. 11(e0156496)2016.PubMed/NCBI View Article : Google Scholar
|
|
33
|
Krämer OH, Knauer SK, Greiner G, Jandt E,
Reichardt S, Gührs KH, Stauber RH, Böhmer FD and Heinzel T: A
phosphorylation-acetylation switch regulates STAT1 signaling. Genes
Dev. 23:223–235. 2009.PubMed/NCBI View Article : Google Scholar
|
|
34
|
Ginter T, Bier C, Knauer SK, Sughra K,
Hildebrand D, Münz T, Liebe T, Heller R, Henke A, Stauber RH, et
al: Histone deacetylase inhibitors block IFNγ-induced STAT1
phosphorylation. Cell Signal. 24:1453–1460. 2012.PubMed/NCBI View Article : Google Scholar
|
|
35
|
Gu L, Dagvadorj A, Lutz J, Leiby B,
Bonuccelli G, Lisanti MP, Addya S, Fortina P, Dasgupta A, Hyslop T,
et al: Transcription factor stat3 stimulates metastatic behavior of
human prostate cancer cells in vivo, whereas stat5b has a
preferential role in the promotion of prostate cancer cell
viability and tumor growth. Am J Pathol. 176:1959–1972.
2010.PubMed/NCBI View Article : Google Scholar
|
|
36
|
Huynh J, Etemadi N, Hollande F, Ernst M
and Buchert M: The JAK/STAT3 axis: A comprehensive drug target for
solid malignancies. Semin Cancer Biol. 45:13–22. 2017.PubMed/NCBI View Article : Google Scholar
|
|
37
|
Johnson DE, O'Keefe RA and Grandis JR:
Targeting the IL-6/JAK/STAT3 signalling axis in cancer. Nat Rev
Clin Oncol. 15:234–248. 2018.PubMed/NCBI View Article : Google Scholar
|