Introduction
Melanoma antigen gene family A (MAGEA) genes are
highly expressed in different types of cancer, such as melanoma,
esophageal cancer and gastric cancer (1). Van der Bruggen first discovered human
proteins, and discovered that the melanoma-associated antigen was
encoded by the MAGEA1 gene (2). After the discovery of MAGEA, other
MAGE family members, MAGE-B, C, D, E, F, G, H, L and Necdin, were
also discovered (2).
There are two types of MAGEs based on tissue
expression. Both types of MAGE (type I and II) have a MAGE homology
domain, which contains ~170 amino acids (2,3).
MAGE-I of the MAGE gene family is expressed in human tumour
cells, such as melanoma, esophageal cancer, gastric cancer, but not
in normal human adult tissues, except in the germ line of males
(2). There are 12 members in the
MAGE-A family, which includes type I MAGE proteins encoded by
chromosome Xq28 in humans (2). MAGE
proteins are candidates for vaccine development. MAGE is a target
protein for the treatment of many malignant diseases and the
results of a previous study demonstrated the development of a
potent cytotoxic T-lymphocyte epitope to elicit a desirable immune
response against carcinogenic melanoma-associated
antigen-A11(3). Although their
expression has been measured in a number of tumour cell types, such
as melanoma, esophageal cancer, gastric cancer, to the best of our
knowledge, their role in disease pathogenesis has not been explored
in detail (4). At present, the
research on its mechanism is not perfect, and the mechanism in many
diseases is still unclear, such as melanoma, esophageal cancer,
gastric cancer, etc.
All members of the MAGE family encode
proteins that share a strong homology with each other, where MAGEA6
and MAGEA3 have the highest homology (98%). However, in tumour
tissues such as cervical cancer tissues, there is a negative
correlation between the expression of MAGEA6/MAGEA3 and clinical
staging (4,5). These two MAGEs may therefore serve as
biomarkers for the in situ prediction of early precancerous
lesions (4). A recent study has
focused on the role of MAGEA3 in cervical cancer, which has been
hypothesised to participate in a number of functional processes.
The overexpression of MAGEA3 significantly promoted the
proliferation of SiHa cells in vitro and in vivo,
increased the proportion of cells in S-phase of the cell cycle and
inhibited apoptosis (5). In
addition, MAGEA3 downregulation was revealed to inhibit HeLa cell
proliferation, block cell cycle progression in the G1
phase and promote cell apoptosis (5). Studies into the underlying mechanism
found that MAGEA3 interacts with KRAB domain-associated protein 1
(KAP1) to inhibit the transcriptional activity of p53, thereby
inhibiting the expression of p53-mediated cell cycle (p21 and
Cyclin D1) and apoptosis (Bax, Bcl-2 and Bcl-2 binding component
3)-related genes (5). These results
suggest that MAGEA3 contributes to the proliferation of cervical
cancer cells and tumour growth, in turn serving an oncogenic role,
by regulating the KAP1/p53 signalling pathway (5). At present, to the best of our
knowledge, there have only been a small number of studies on
MAGEA6. It has been previously revealed that MAGEA6 mediates the
survival of human glioma cells by targeting 5'AMP-activated protein
kinase (AMPK)α1, mediating AMPK signalling to inhibit the
maintenance and self-renewal ability of glioma cells (6). The MAGEA6 gene has a total of three
exon regions and is located at the end of the long arm of the X
chromosome Xq28 (6,7). MAGEA6 is frequently expressed and
reactivated in a number of human cancer cells, such as human glioma
and esophageal cancer. (7). A
previous study by Pineda et al (7) demonstrated that the MAGEA6/KAP1
complex is a cancer-specific ubiquitin ligase that only degrades
AMPKα1 in human glioma cells and gastric cancer cells. In addition,
knocking down MAGEA6 expression inhibited the growth of severe
combined immunodeficiency mice-transplanted tumours and inhibited
the proliferation of primary human glioma cells in vivo
(7).
A previous study measured the expression level of
MAGEA6 in oesophageal squamous cell carcinoma (ESCC) cells and
oesophageal adenocarcinoma tissues. The results indicated that
MAGEA6 is highly transcribed and expressed in the development of
ESCC and may therefore serve as a novel biomarker for the diagnosis
or treatment of ESCC (8). In
vitro assays were also performed to investigate the biological
function of MAGEA6 in ESCC, which may help to understand its role
in this disease and the factors contributing to its upregulation.
It is hypothesised that for individuals who are prone to developing
specific types of cancer, their natural cellular immunity against
MAGEA6 may serve a role in the development of cancer. Specifically,
cellular immunity may also protect against the recurrence of
MAGEA6-associated disease, such as human glioma cells, in addition
to tumour growth (8,9). Therefore, the function of MAGEA6 and
its regulation need to be studied in depth.
Materials and methods
Cell culture and screening
The ESCC cell lines Eca109, EC9706, KYSE150, and
Hacat cell line were obtained from the Zeng Academician Laboratory
of the Virus Prevention and Control Institute; Chinese Center for
Disease Control and Prevention. Cells were cultured in DMEM
(HyClone; Cytiva) supplemented with 10% FBS (Gibco; Thermo Fisher
Scientific, Inc.) and maintained at 37˚C with 5% CO2 in
a humidified incubator (10).
Vector construction and selection of
stable cell lines
At the logarithmic phase, Eca109 cells were digested
with trypsin at 37˚C for 3 min, and were inoculated into a six-well
at 2x10⁵ cells/ml. Transfection was performed when cells
reached 60-70% confluence. The plate was placed in a humidified
incubator overnight at 37˚C with 5% CO2. The virus was
thawed on the day of transfection and 1 ml complete medium was
added. The mixture was gently pipetted and 2 µg
polybrene-containing virus solution (Invitrogen; Thermo Fisher
Scientific, Inc.) was added to Eca109 cells. The cells were placed
in a humidified incubator at 37˚C with 5% CO2. After 48
h of exposure, the aforementioned medium was changed to a selection
medium, which contained 2 µg/ml puromycin (Thermo Fisher
Scientific, Inc.). The medium was changed every 3 days for 2 weeks
and the cells that died were not deemed stable with puromycin
resistance. Lentivirus-mediated MAGEA6-overexpressing Eca109 cells
were constructed (Eca109-MAGEA6-3.1). The lentiviral plasmid
backbone used was pcDNA™3.1 (+; Thermo Fisher Scientific, Inc.),
and the interim cell line used was the 293T cell line obtained from
the Chinese Center for Disease Control and Prevention. The quantity
of lentiviral plasmid used for transfection was 2 µg, incubated for
12 h overnight in an incubator at 37˚C and 5% CO2. The
same method was used to obtain cells transfected with an empty
carrier (Eca109-3.1).
RNA sequencing
For high-throughput sequencing, cultured Eca109-3.1
cells and Eca109-MAGEA6-3.1 cells were handed over to Beijing
IgeneCode Biotech Co., Ltd. to perform the sequencing experiments.
A total of 2 ml Trizol® reagent (Invitrogen; Thermo
Fisher Scientific, Inc.) was added to extract RNA from cells and
digesting the DNA with DNase I (Invitrogen; Thermo Fisher
Scientific, Inc.), the consequent RNA samples were tested. After
the high-throughput detection results met the requirements, the
database was built. An Agilent 2100 Bioanalyzer (Agilent
Technologies, Inc.) was used to detect RNA concentration, Rin
value, 28S/18S ratio and fragment size to determine RNA integrity.
The purity of RNA (optical density ratio of 260/280) was detected
by Nanodrop. After the samples were qualified, the library was
constructed according to the following steps, according to the
manufacturer's protocol: i) Oligo d(T)-loaded magnetic beads were
used to enrich the eukaryotic mRNA; ii) the fragmentation buffer
was added to break the mRNA into short fragments; iii) using Eca109
mRNA as template, the first cDNA strand was synthesized with random
hexamers before the second cDNA strand was synthesized by adding
buffer, dNTPs, RNase H and DNA polymerase; iv) the purified double
stranded cDNA was repaired at the end, added a tail and connected
to the sequencing adaptor; and v) PCR amplification was performed
and the constructed sequencing library was used for sequencing.
After the construction of the library, Agilent 2100 Bioanalyzer was
used to detect the insert range of the library and ABI StepOnePlus™
real time PCR system was used to quantify the concentration of the
library. After the quality inspection was qualified, Illumina hiseq
sequencer (Illumina, Inc.) was used for sequencing.
Construction of siRNA
To knock down MAGEA6, three short interfering
(si)RNAs were constructed (si-MAGEA6) and a non-targeting negative
control (si-NC) (Table I), which
were synthesised by Guangzhou RiboBio Co., Ltd. Eca109 cells
(2x10⁵ cells/well) were seeded into 6-well plates
overnight before they were transfected with the three siRNAs or
si-NC (100 nM) using the FuGENE HD transfection reagent (Promega
Corporation), according to the manufacturer's protocol. After 48 h,
results were detected by reverse transcription-quantitative PCR
(RT-qPCR). The most effective siRNA was then selected for further
experiments, where the transfected cells were named
Eca109-MAGEA6-siRNA thereafter.
 | Table IPrimers for short interfering
RNA. |
Table I
Primers for short interfering
RNA.
| Primer | Sequence,
5'-3' |
|---|
| MAGEA6-1
forward |
GCCCTCTCACTTCCTCCTT |
| MAGEA6-1
reverse |
AAGGAGGAAGTGAGAGGGC |
| MAGEA6-2
forward |
CCAAGGGCCCTCATTGAAA |
| MAGEA6-2
reverse |
TTTCAATGAGGGCCCTTGG |
| MAGEA6-3
forward |
CCTCATTGAAACCAGCTAT |
| MAGEA6-3
reverse |
ATAGCTGGTTTCAATGAGG |
Growth curve
Cell Counting Kit-8 (CCK-8) (cat. no. CA1210;
Beijing Solarbio Science & Technology Co., Ltd.) was used to
assess cell viability. The Eca109 cells suspension (100 µl/well)
was inoculated into a 96-well plate. The culture plate was then
kept in an incubator for ~6 h at 37˚C with 5% CO2.
Subsequently, 10 µl of CCK-8 solution was added to each well. The
culture plate was then kept in an incubator for 1-4 h at 37˚C with
5% CO2. Absorbance in each well was measured at 450 nm
using a microplate reader.
Wound healing assay
Eca109 cells of the experimental group and the
control group were cultured in 6-well plates (Corning, Inc.) using
serum-free medium (Gibco; Thermo Fisher Scientific, Inc.). The
cells were scratched using the same speed and strength with a 10-µl
pipette tip, and incubated overnight at 37˚C with 5%
CO2. The wound healing rates were observed under an
optical microscope at 0 and 12 h (magnification, x40). Average
scratch width=scratch gap area/length. Cell migration rate=(0 h
scratch width-scratch width after culture)/0 h scratch width x100.
Thus, the migration rate of cells could be determined by
imaging.
Transwell assay
Transwell assays were used to assess the cell
migration and invasion using Costar chambers with Transwell inserts
having an 8-µm pore size (Corning, Inc.). Matrigel (Invitrogen;
Thermo Fisher Scientific, Inc.) was used to coat the upper chambers
at 37˚C for 30 min, for the invasion assay but not for the
migration assay. After transfection with siRNAs or siNC, Eca109
cells (5x10⁴) were suspended in serum-free medium (200
µl) and seeded into the upper chamber, whereas the medium present
in the lower chamber was mixed with FBS (20%). Incubation was
performed for 42 h at 37˚C and 5% CO2, before cells in
the upper chamber were removed using a cotton swab. Migrated or
invaded cells were fixed using 4% paraformaldehyde at room
temperature for 30 min, and crystal violet (0.1%) was used to stain
the cells at room temperature for 20 min (11). Under an inverted microscope, cells
were counted based on five random fields (Olympus Corporation;
magnification, x40).
RNA extraction and RT-qPCR
TRIzol® reagent (Thermo Fisher
Scientific, Inc.) was used to extract total RNA from Eca109 cells
according to the standard protocol. The Prime Script™ RT reagent
Kit (Takara Bio, Inc.) was used to synthesise cDNA from a total of
200 ng RNA, following which the SYBR® Green Kit (Promega
Corporation) was used for amplification for qPCR as previously
described (12). RT-qPCR was
performed at 50˚C for 2 min and 95˚C for 2 min, followed by 40
cycles at 95˚C for 15 sec and 60˚C for 1 min. GAPDH was used
as the internal reference, and the quantitative study of primer
level of MAGEA6 was normalised to that of GAPDH. The
sequences of the MAGEA6 and GAPDH primers used for
RT-qPCR are listed in Table
II.
| Table IIPrimers for reverse
transcription-quantitative PCR. |
Table II
Primers for reverse
transcription-quantitative PCR.
| Primer | Sequence,
5'-3' |
|---|
| GAPDH forward |
ACCACAGTCCATGCCATCAC |
| GAPDH reverse |
TCCACCACCCTGTTGCTGTA |
| MAGEA6 forward |
CGGTCACAAAGGCAGAAAT |
| MAGEA6 reverse |
AGGCAGGTGGCAAAGATG |
| MSMO1 forward |
AAGTGTTTCAAAGTTCTTCTCT |
| MSMO1 reverse |
ATAGTGCCAAGTATCTTCAATG |
Western blotting
After 72 h of cell transfection, Eca109-MAGEA6-3.1
and control (Eca109-3.1) cells were lysed with RIPA buffer
(Beyotime Institute of Biotechnology), which was used as a protein
extraction reagent. The protease inhibitor PMSF (Roche Diagnostics)
was also added as a supplement in the protein extraction reagent.
The protein was transferred to polyvinylidene difluoride film
membranes after separation of equal amounts of protein at 50 µg by
12% SDS-polyacrylamide gel electrophoresis (13). BCA protein quantification was used.
The membranes were blocked with QuickBlock™ Blocking Buffer for
Western Blot (Beyotime Institute of Biotechnology) for 1 h at room
temperature and subsequently incubated with rabbit anti-human
MAGEA6 polyclonal antibody (1:5,000; ProteinTech Group, Inc.) for
12 h at room temperature. The membranes were then incubated with
horseradish enzyme labelled Goat anti-rabbit IgG (1:10,000; cat.
no. 2301; OriGene Technologies, Inc.) and incubated at room
temperature for 1 h after washing three times with TBS with 20%
Tween-20. Bands were visualised using Super ECL plus (cat. no.
p1050; Applygen Technologies, Inc.) on a Luminoskan
chemiluminescence reader (Thermo Fisher Scientific, Inc.). GAPDH
was used as the control.
Statistical analysis
Data are expressed as the mean ± standard deviation.
Each experiment was repeated three times to ensure that all the
data were consistent. All data were calculated using GraphPad Prism
v8.4.3 (GraphPad Software, Inc.). One-way ANOVA followed by Tukey's
post hoc test was used to determine that the difference was
statistically significant and multiple comparisons were performed
using SPSS 19 software (version, 19; IBM Corp.). P<0.05 was
considered to indicate a statistically significant difference.
Bioinformatical analyses
This part is from Beijing igeneCode Biotech Co.,
Ltd. Responsible. After Illumina Hiseq sequencing, FastQC software
(v0.11.2; Beijing igeneCode Biotech Co., Ltd.) was used to evaluate
and sort the raw data into fastq format, before NGSQC software
(v2.3.2) was used to filter out low-quality data. Subsequently, the
default parameter HISAT software (v2.0.4) was used to compare the
clean reads with high-quality to the reference genome, before the
‘heatmap’ function in the R software (https://www.r-project.org) was used to perform
hierarchical clustering analysis and a heatmap for the sequencing
data that cannot be directly aligned with the reference genome. The
differential gene data obtained was screened by sequencing with
thresholds of P<0.05, log2(fold-change)>1.5, and
entering the selected genes into the Database for Annotation,
Visualization and Integrated Discovery v6.8 (https://david.ncifcrf.gov/home.jsp) to obtain the Gene
Ontology (GO) and Kyoto Encyclopaedia of Genes and Genomes (KEGG)
pathway enrichment data. GraphPad Prism v8 was used to generate
histograms. For analysis of the protein-protein interaction (PPI)
network of methylsterol monooxygenase 1 (MSMO1) with a combined
score >0.6, The Search Tool for the Retrieval of Interacting
Gene (STRING; https://string-db.org/) was used.
Construction of the PPI network was performed after downloading and
importing results to the Cytoscape software [v3.5.1; https://cytoscape.org; P<0.05,
log2(fold-change)>1.5] (14).
Results
Measurement of MAGEA6 gene expression
level and cell selection
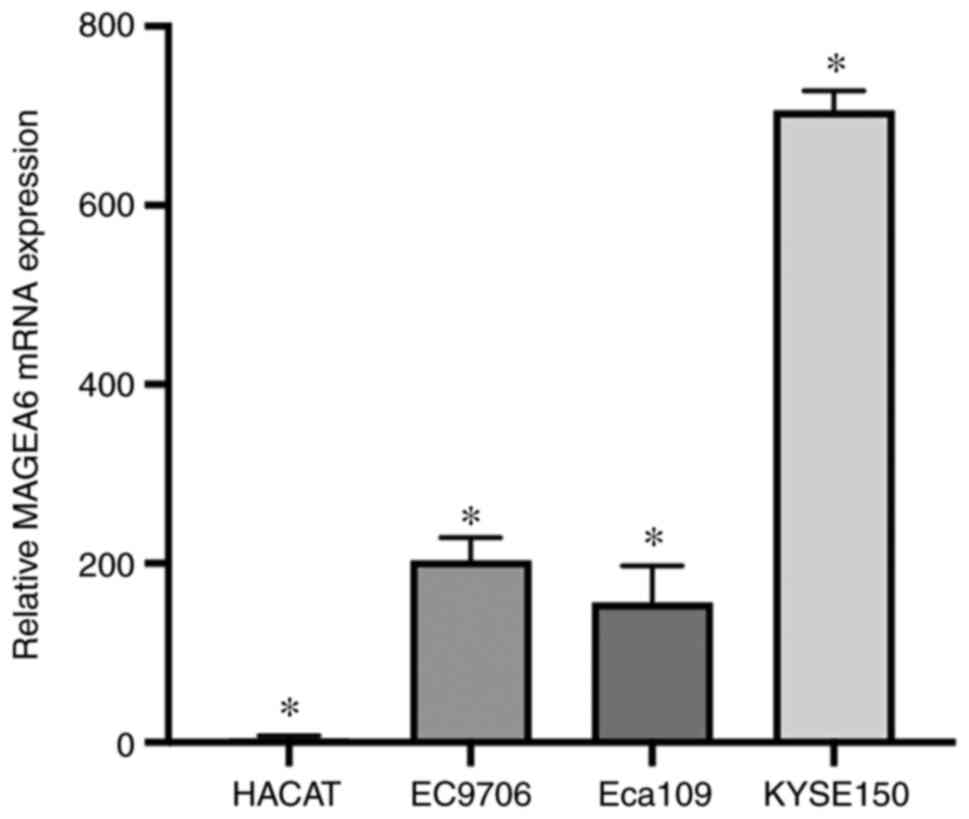
By comparing the expression of MAGEA6 in three
oesophageal cancer cells and Hacat cells, it was revealed that
MAGEA6 is expressed at low levels in Hacat cells but is generally
expressed at higher levels in oesophageal cancer cells (Fig. 1). The expression level of
MAGEA6 mRNA in the oesophageal cancer cell line Eca109 was
significantly elevated compared with that in Hacat cells
(P<0.01). MAGEA6 mRNA expression in the EC9706
oesophageal cancer cell line was significantly elevated compared
with that in Hacat cells (P<0.05). The expression level of
MAGEA6 mRNA in the KYSE150 oesophageal cancer cell line was
significantly elevated compared with that in Hacat cells
(P<0.01).
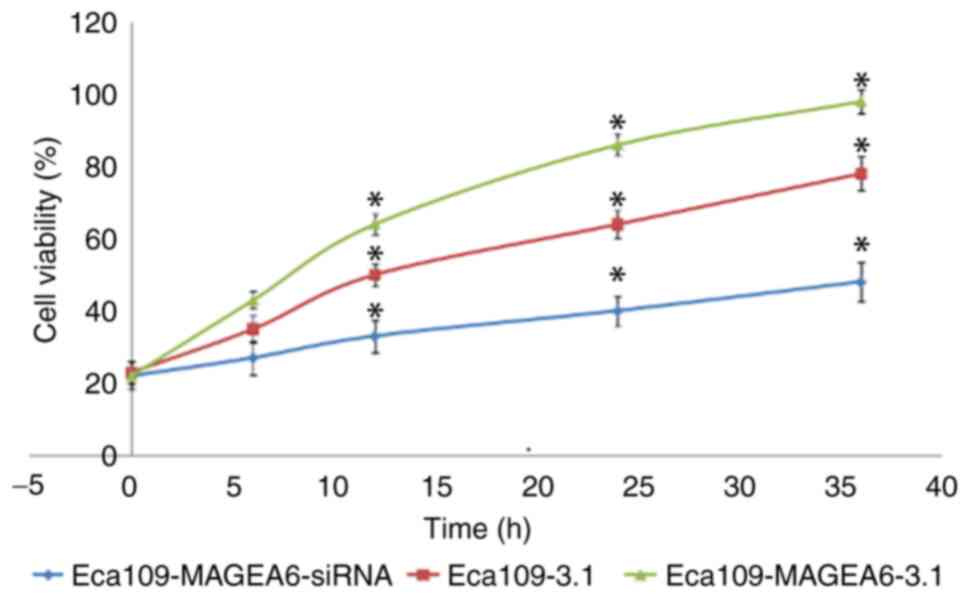
MAGEA6 overexpression promotes
oesophageal cancer cell proliferation
A Eca109 cell line overexpressing MAGEA6
(Eca109-MAGEA6-3.1) and one with MAGEA6 expression knocked down
(Eca109-MAGEA6-siRNA) were constructed. The effect of MAGEA6 on
cell proliferation was assessed using the CCK-8 kit (Fig. 2). The results demonstrated that the
overexpression of MAGEA6 promoted cell proliferation, whereas
MAGEA6 knockdown had an inhibitory effect on cell proliferation in
Eca109 cells in vitro.
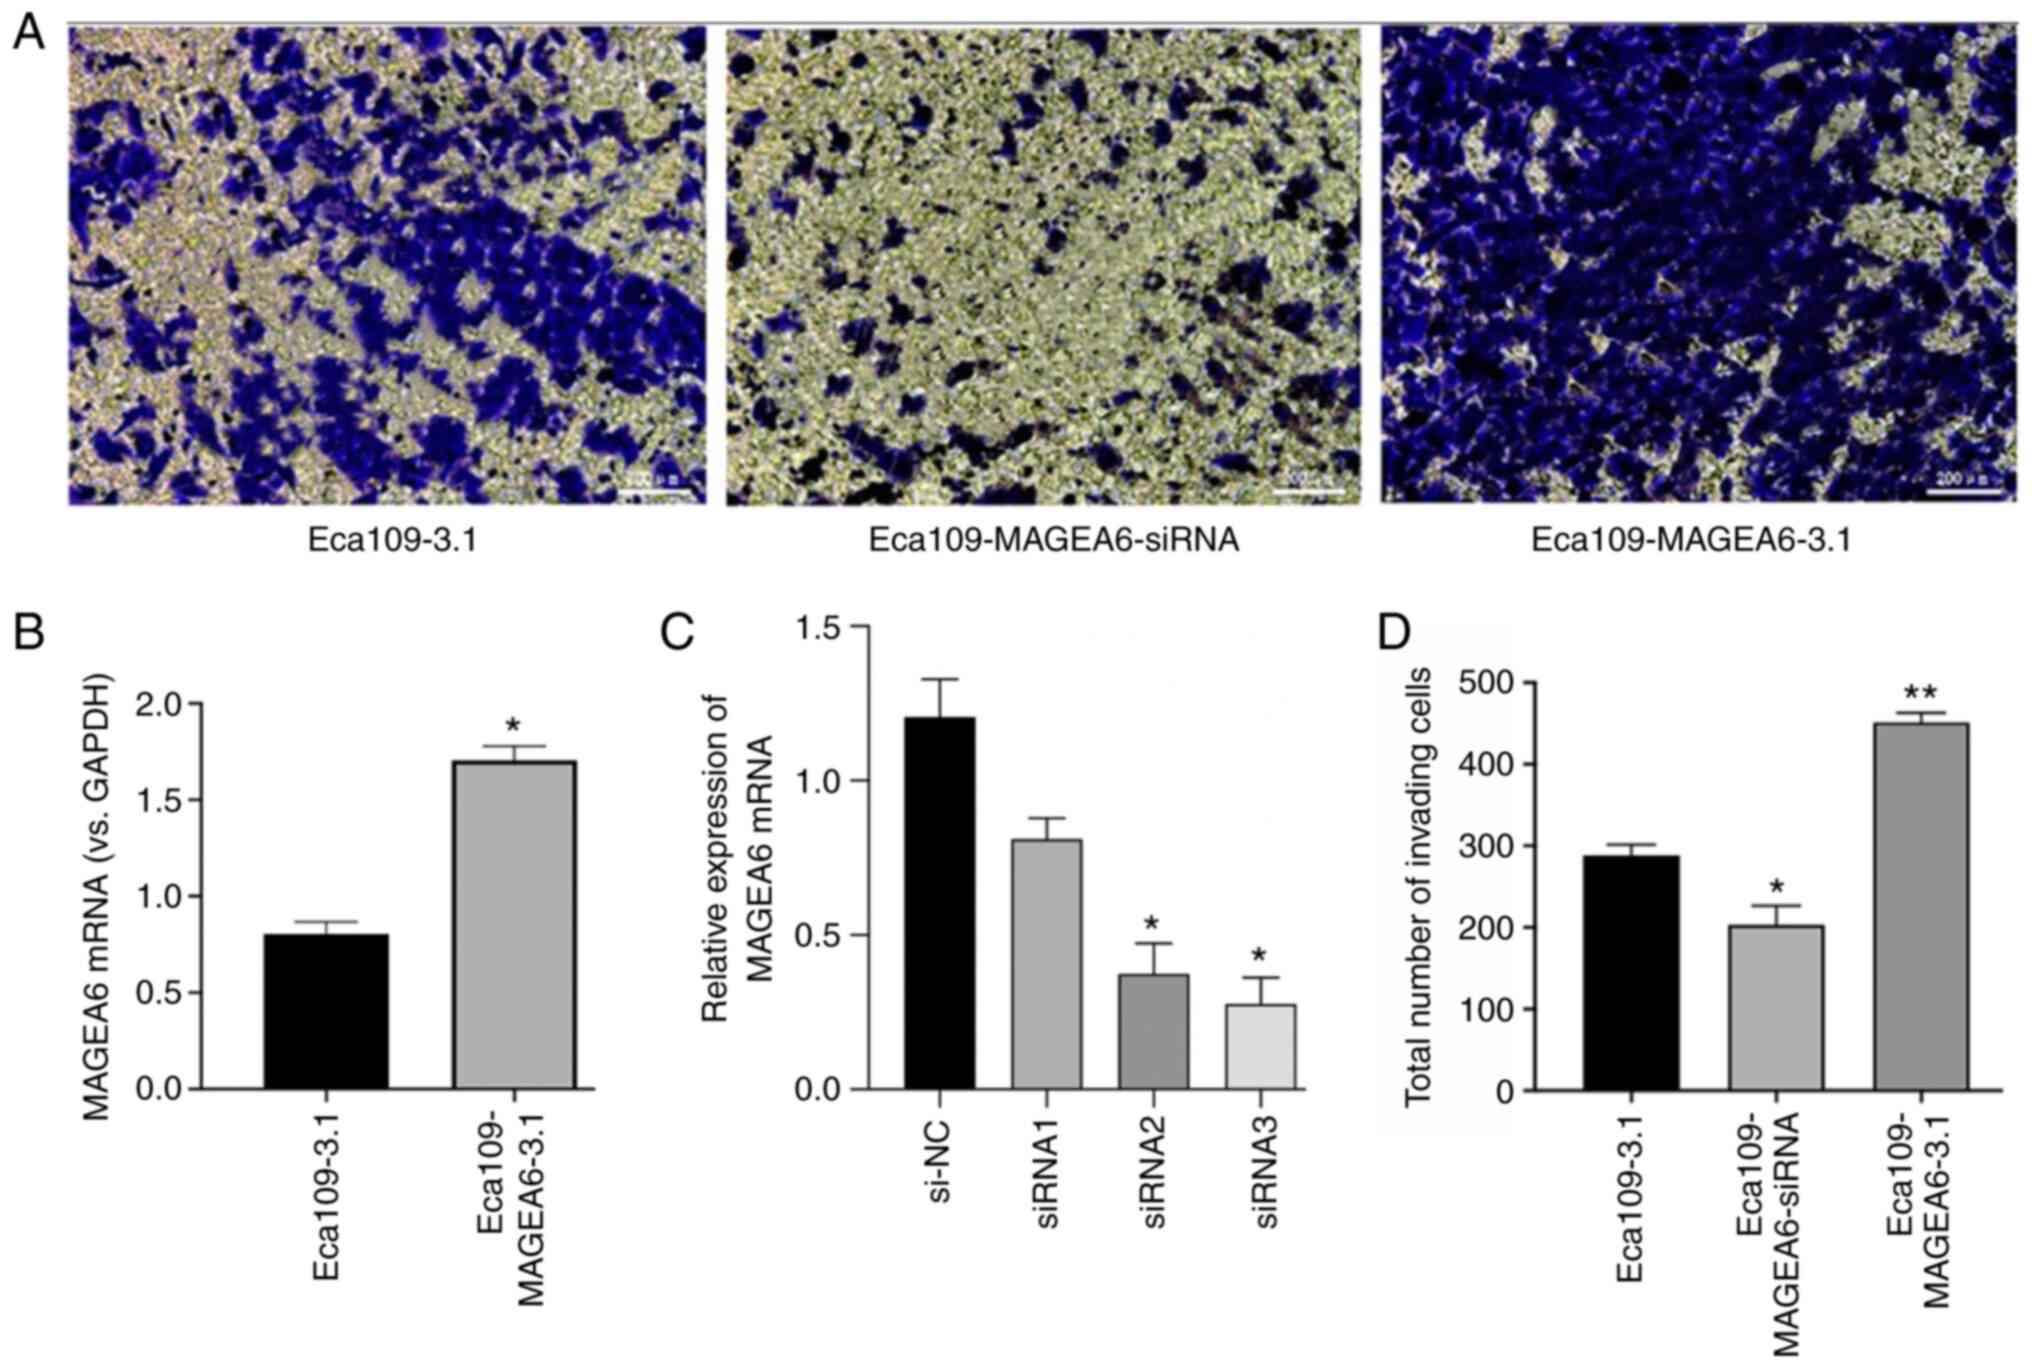
MAGEA6 increases oesophageal cancer
cell migration and invasion in vitro
To explore the physiological function of MAGEA6 in
oesophageal cancer and its role in the invasion of ESCC cells,
Transwell assays were performed using the Eca109 cell line
(Fig. 3A). The expression levels of
MAGEA6 in Eca109-MAGEA6-3.1 was notably higher than that in
Eca109-3.1 (Fig. 3B). As indicated
in Fig. 3C, siRNA3 was the most
efficient at knocking down MAGEA6 expression in Eca109 cells
(P<0.05). Eca109-MAGEA6-3.1 cells exhibited significantly higher
cell invasion rates through the Matrigel matrix compared with those
by Eca109-3.1 cells (P<0.01; Fig.
3D). By contrast, Eca109-MAGEA6-siRNA cells demonstrated
significantly reduced cell invasion and invasion in the Transwell
assays (Fig. 3D; P<0.05).
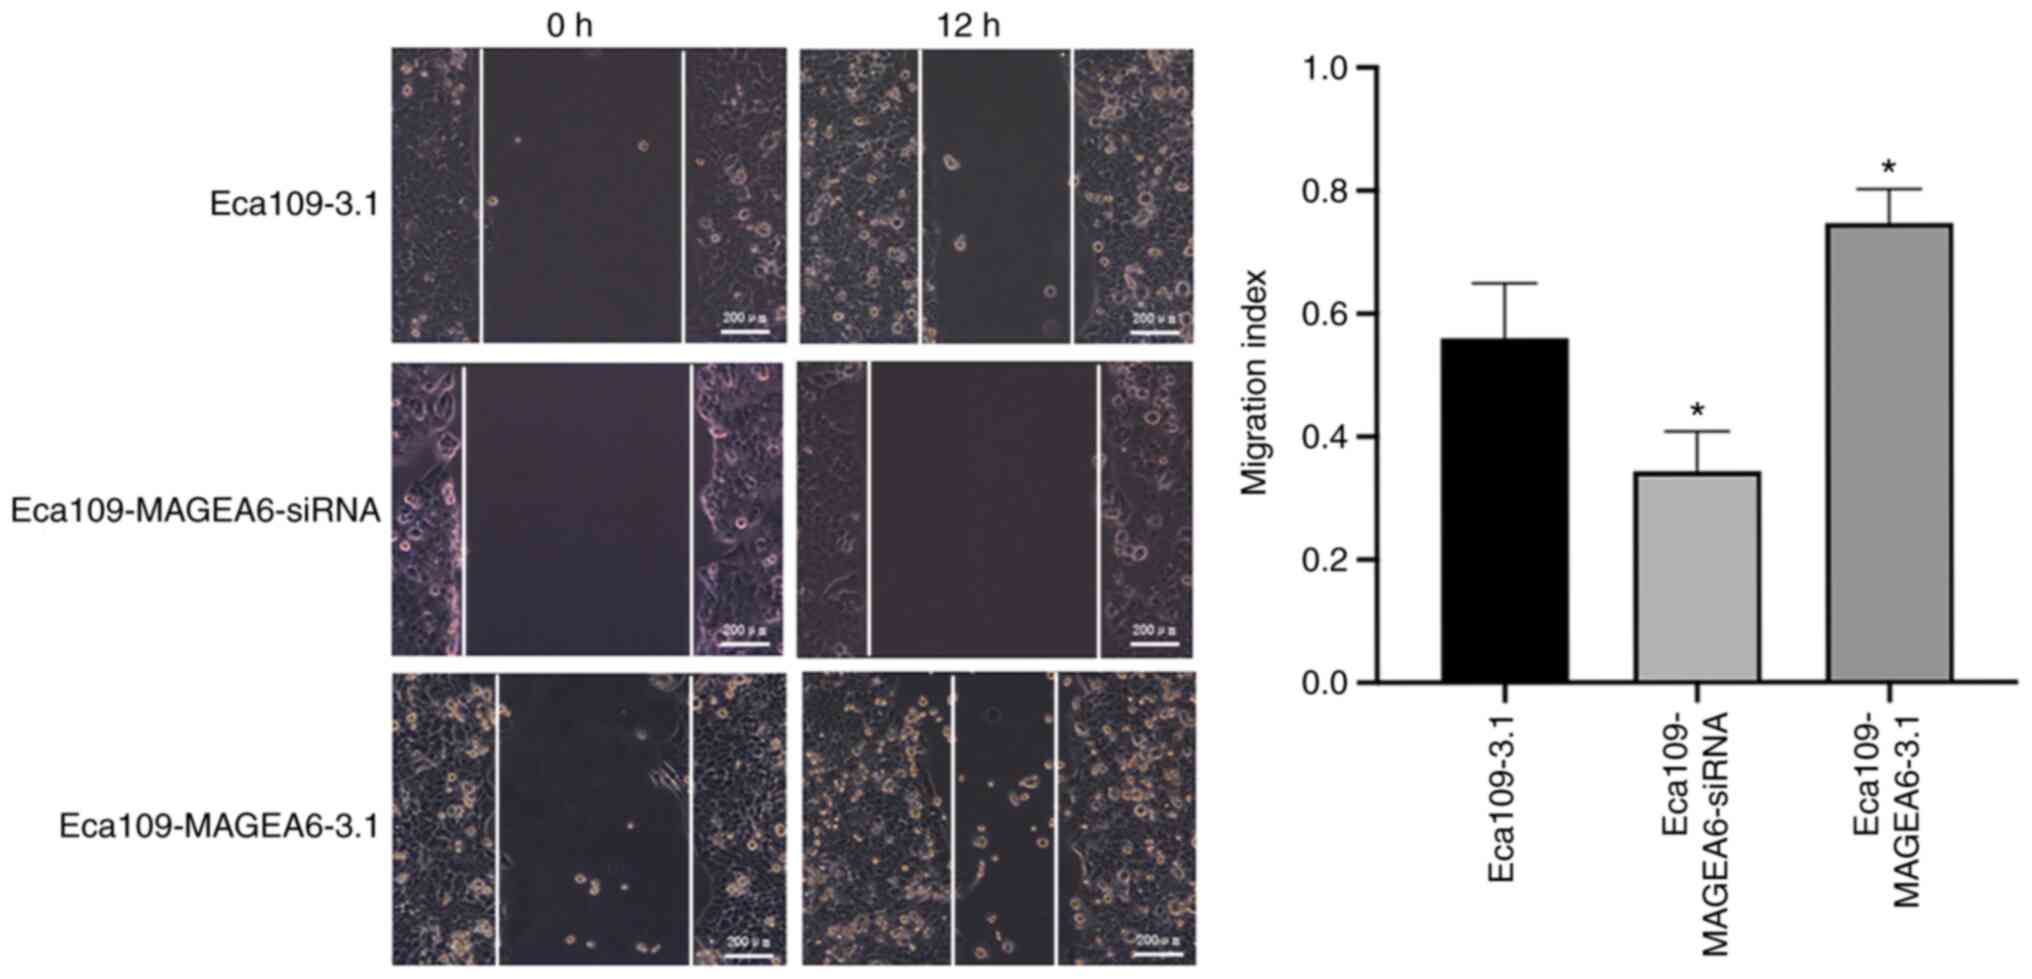
Results from wound healing assay also demonstrated that Eca109
cells overexpressing MAGEA6 migrated significantly faster compared
with that in Eca109-3.1 cells (P<0.05; Fig. 4).
Cluster analysis of MAGEA6
differentially expressed genes
According to the two groups of stable cell lines,
with each having three replicates, hierarchical cluster analysis
was performed through transcriptome sequencing analysis. Different
coloured areas represent different cluster grouping information.
Within each experimental repeat of the same group, gene expression
patterns were similar, which may have similar functions or
participate in the same biological processes. Fig. 5 demonstrates the differences between
the two groups of cells. Compared with the control, GDF15, ATF3,
GADD45A and MSMO1 were highly upregulated, whereas TFRC, IGFBP1,
PAPPA2, HAL and CHL1 were significantly downregulated.
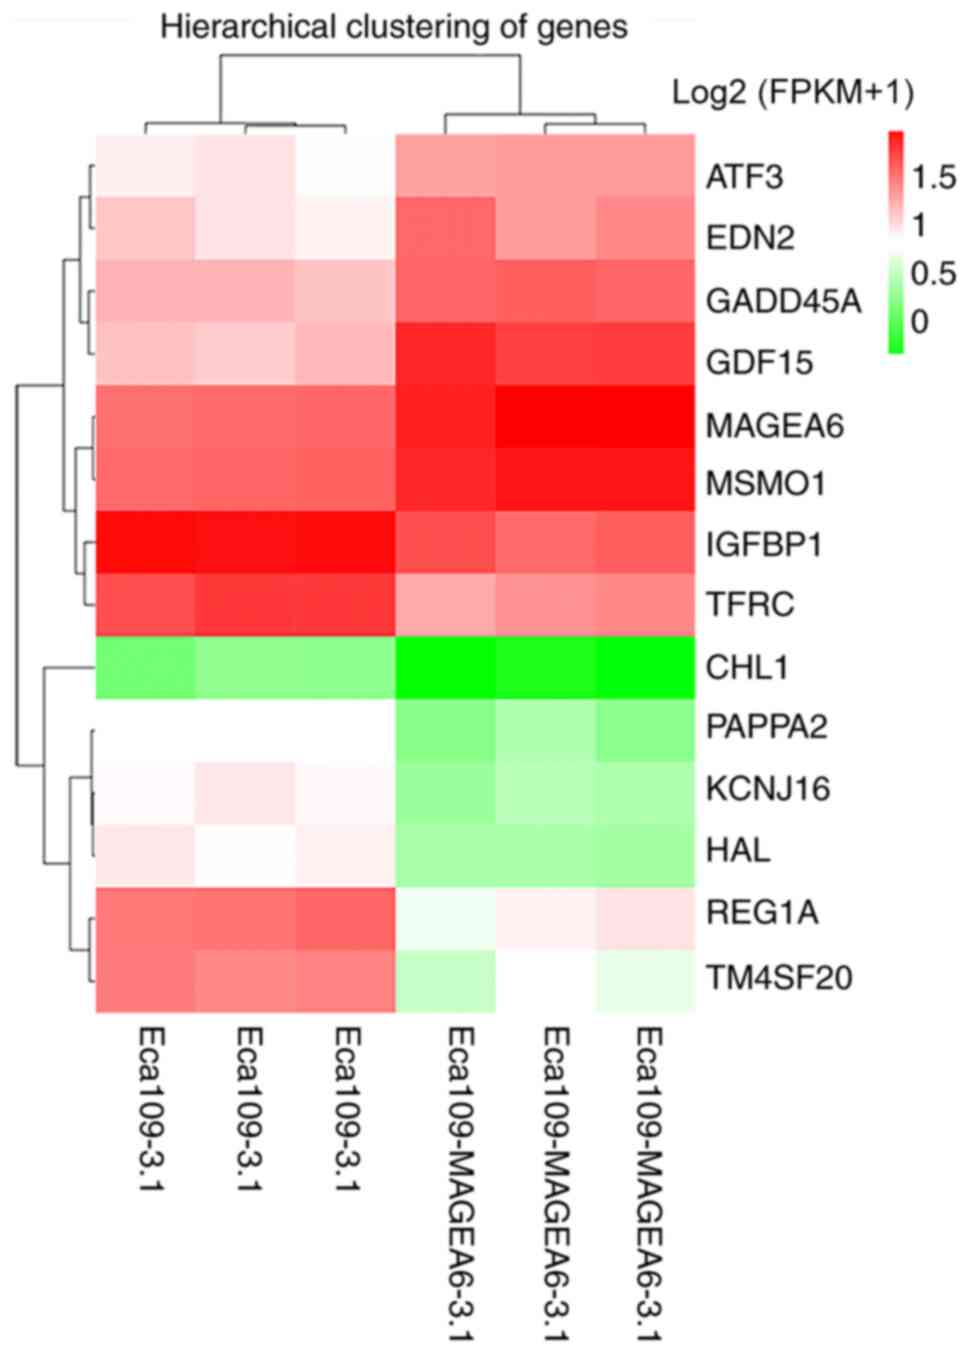 | Figure 5Cluster heat map of differentially
expressed genes after MAGEA6 overexpression. Abscissa represents
the sample name and sample clustering results, whereas the ordinate
represents the differentially expressed genes and gene clustering
results. Different columns represent the different Eca109-3.1 and
Eca109-MAGEA6-3.1 samples, whilst different rows represent the
expression of the different genes. The color represents the gene
expression level log2 (FPKM+1) in the sample (R software
heatmap). Red represents a high degree of enrichment and green
represents a low degree of enrichment. MAGEA6, melanoma antigen
gene family A; ATF3, activating transcription factor 3; EDN2,
endothelin 2; GADD45A, growth arrest and DNA damage inducible
alpha; GDF15, growth differentiation factor 15; MSMO1, methylsterol
monooxygenase 1; IGFBP1, insulin like growth factor binding protein
1; TFRC, transferrin receptor; CHL1, cell adhesion molecule L1
like; PAPPA2, pappalysin 2; KCNJ16, potassium inwardly rectifying
channel subfamily J member 16; HAL, histidine ammonia-lyase; REG1A,
regenerating family member 1 alpha; TM4SF20, transmembrane 4 L six
family member 20. |
Analysis of differentially expressed
genes after MAGEA6 overexpression
A Minus-vs.-Add diagram can be used to visually
examine the overall distribution of gene expression levels and
differential multiples of two experimental samples for comparison
(15). In Fig. 6, upregulated genes are represented
by red dots, whereas downregulated genes are represented by blue
dots, and non-differentially expressed genes are represented by
black dots. Compared with the control, GDF15, ATF3, GADD45A and
MSMO1 were highly upregulated, whereas TFRC, IGFBP1, PAPPA2, HAL
and CHL1 were significantly downregulated.
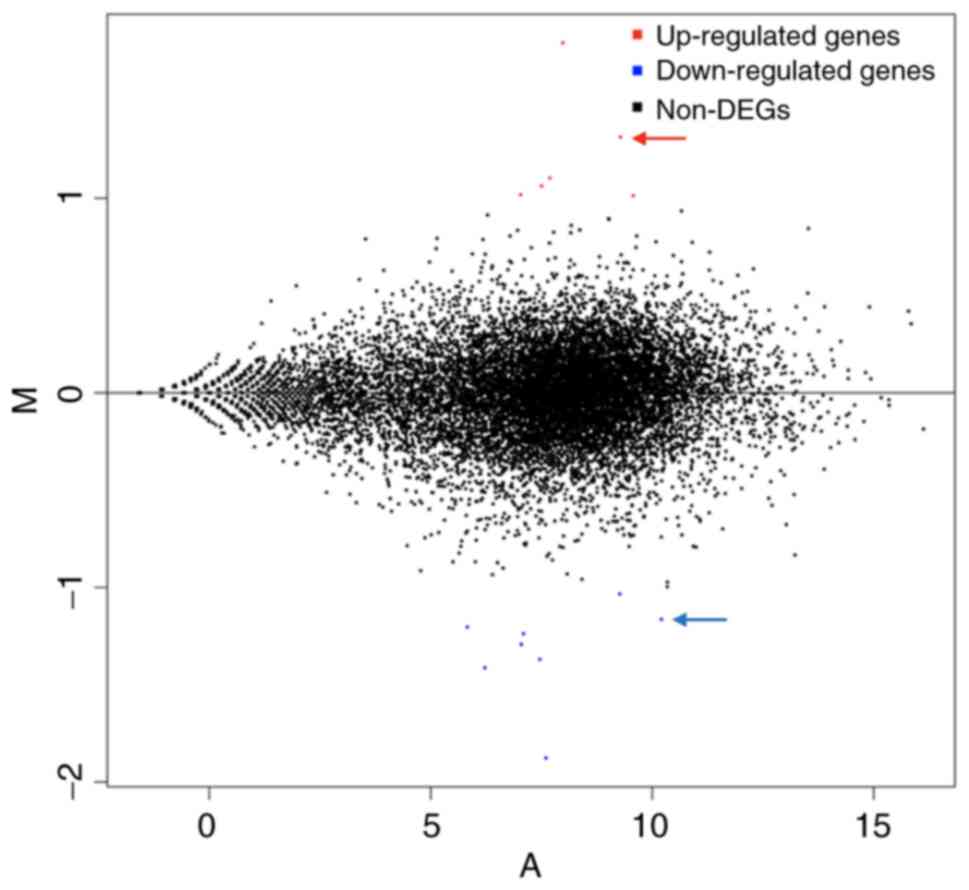 | Figure 6MA map (produced by R software
DEseq2) of differentially expressed genes after MAGEA6
overexpression. Each dot in the MA map represents a gene. Abscissa
represents the log2 (FPKM) or the A value, which is the
logarithmic value of the mean expression quantity in
Eca109-MAGEA6-3.1 and Eca109-3.1 groups. Ordinate is M value:
Log2 (Fc), which is the logarithmic value of the
multiple of gene expression difference between the two samples,
used to measure the difference in gene expression. In the figure,
red dots represent upregulated genes, blue dots represent
downregulated genes and black dots represent not differentially
expressed genes. Fc, fold-change; A, Log2(FPKM) value; B, Log2(Fc);
MAGEA6, melanoma antigen gene family A; DEGs, differentially
expressed genes; MA, Minus-vs.-Add. |
Number of differentially expressed
genes after MAGEA6 overexpression in different alignment schemes
and protein level verification
Sequence analysis of the target genes and proteins
in Cytoscape revealed a differential gene interaction network after
MAGEA6 overexpression (Fig. 7). By
sequencing the Eca109-3.1 and Eca109-MAGEA6-3.1 cells, 14 genes
were revealed to be closely associated with MAGEA6 overexpression.
Yellow indicates upregulation and blue indicates downregulation.
GDF15, ATF3, GADD45A and MSMO1 were
highly upregulated, whereas TFRC, IGFBP1,
PAPPA2, HAL and CHL1 were significantly
downregulated. According to the functions of these genes,
GDF15, GADD45A, MSMO1, EDN2,
REG1A and PAPPA2 are found to be closely associated
with the occurrence of cancer, these genes have great research
value in tumor (Table III). The
function of some of these genes can be found in NCBI (https://www.ncbi.nlm.nih.gov).
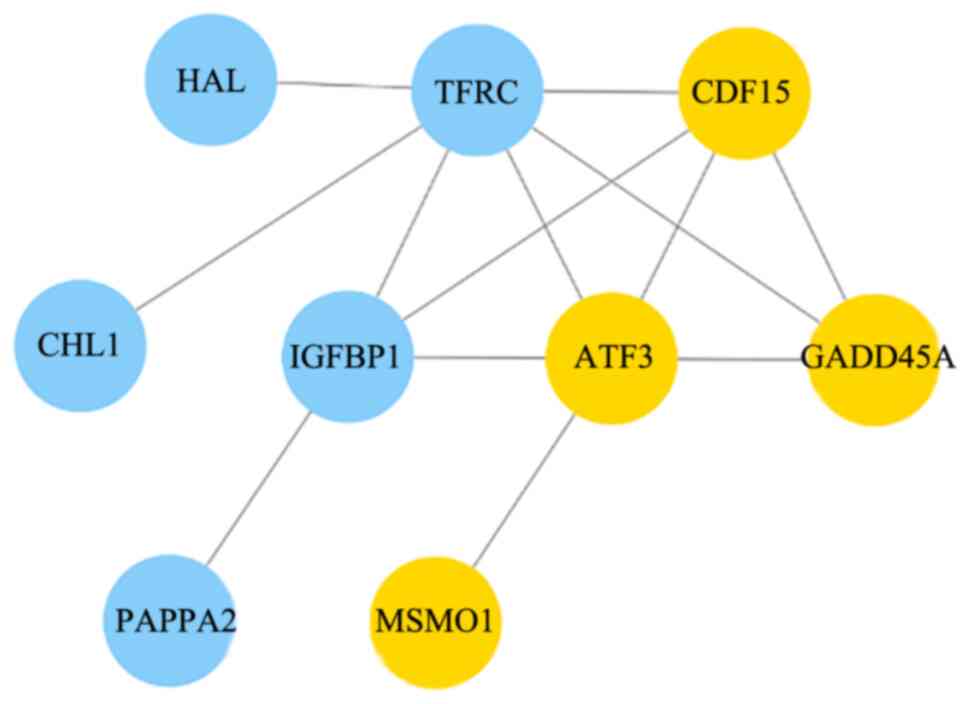 | Figure 7Protein interaction network diagram
of differentially expressed genes after MAGEA6 overexpression,
analyzed using Cytoscape. Each node in the figure represents a
differentially expressed gene and its corresponding protein. Yellow
dots represent a gene that was upregulated whereas blue dots
represent a gene that was downregulated. MAGEA6, melanoma antigen
gene family A; HAL, histidine ammonia-lyase; TFRC, transferrin
receptor; GDF15, growth differentiation factor 15; CHL1, cell
adhesion molecule L1 like; IGFBP1, insulin like growth factor
binding protein 1; ATF3, activating transcription factor 3;
GADD45A, growth arrest and DNA damage inducible alpha; PAPPA2,
pappalysin 2; MSMO1, methylsterol monooxygenase 1. |
| Table IIIVerification and function the
expression levels of differentially expressed proteins after MAGEA6
overexpression. |
Table III
Verification and function the
expression levels of differentially expressed proteins after MAGEA6
overexpression.
| Gene | Gene
regulation | Fold-change,
log2 | Function |
|---|
| GDF15 | Up | 1.798961725 | After cell injury,
it participates in the process of cell stress response, where
increases in its level is associated with inflammation and acute
injury (14). |
| ATF3 | Up | 1.062712819 | Involved in cell
cycle progression and stimulation of invasive and metastatic genes
(30). |
| GADD45A | Up | 1.104190772 | DNA damaging agent
treatment increases and promotes oesophageal squamous cell
carcinoma cell proliferation (31). |
| MSMO1 | Up | 1.012811618 | It serves an
important role in the biosynthesis of lipids and also plays a
regulatory role in cell proliferation and immune regulation
(32). |
| EDN2 | Up | 1.018092856 | EDN are produced by
ovarian follicles and are involved in the regulation of
steroidogenesis of GC of several mammalian species including
humans, cattle, pigs and rats (33). |
| MAGEA6 | Up | 1.314680031 | Elevated expression
in cancer cells but not in normal cells. It is a tumor marker and
promotes the migration and invasion of cancer cells, such as human
glioma cells (6). |
| REG1A | Down | -1.413208462 | It is associated
with islet cell regeneration and diabetogenesis and may be involved
in pancreatic lithogenesis (34). |
| TM4SF20 | Down | -1.877859733 | Deletion mutations
in this gene are associated with specific language disorders, such
as language delay (35). |
| KCNJ16 | Down | -1.23791537 | May serve a role in
liquid and pH balance adjustment (36). |
| TFRC | Down | -1.163899233 | This gene encodes a
cell surface receptor, which is required for the uptake of iron
through receptor-mediated endocytosis (37). |
| IGFBP1 | Down | -1.033847315 | It serves a major
role in cell migration and metabolism. When used in low doses, it
stimulates cell proliferation (38). |
| PAPPA2 | Down | -1.369985674 | Inhibit the
migration, invasion and tube formation of extracellular
trophoblasts (39). |
| HAL | Down | -1.292750813 | One of the main
reasons for the increased histidine and histamine and decreased
urocanic acid in body fluids(a substance found in body fluids)
(40). |
| CHL1 | Down | -1.203237487 | It is a neural
recognition molecule that may participate in signal transduction
pathways (41). |
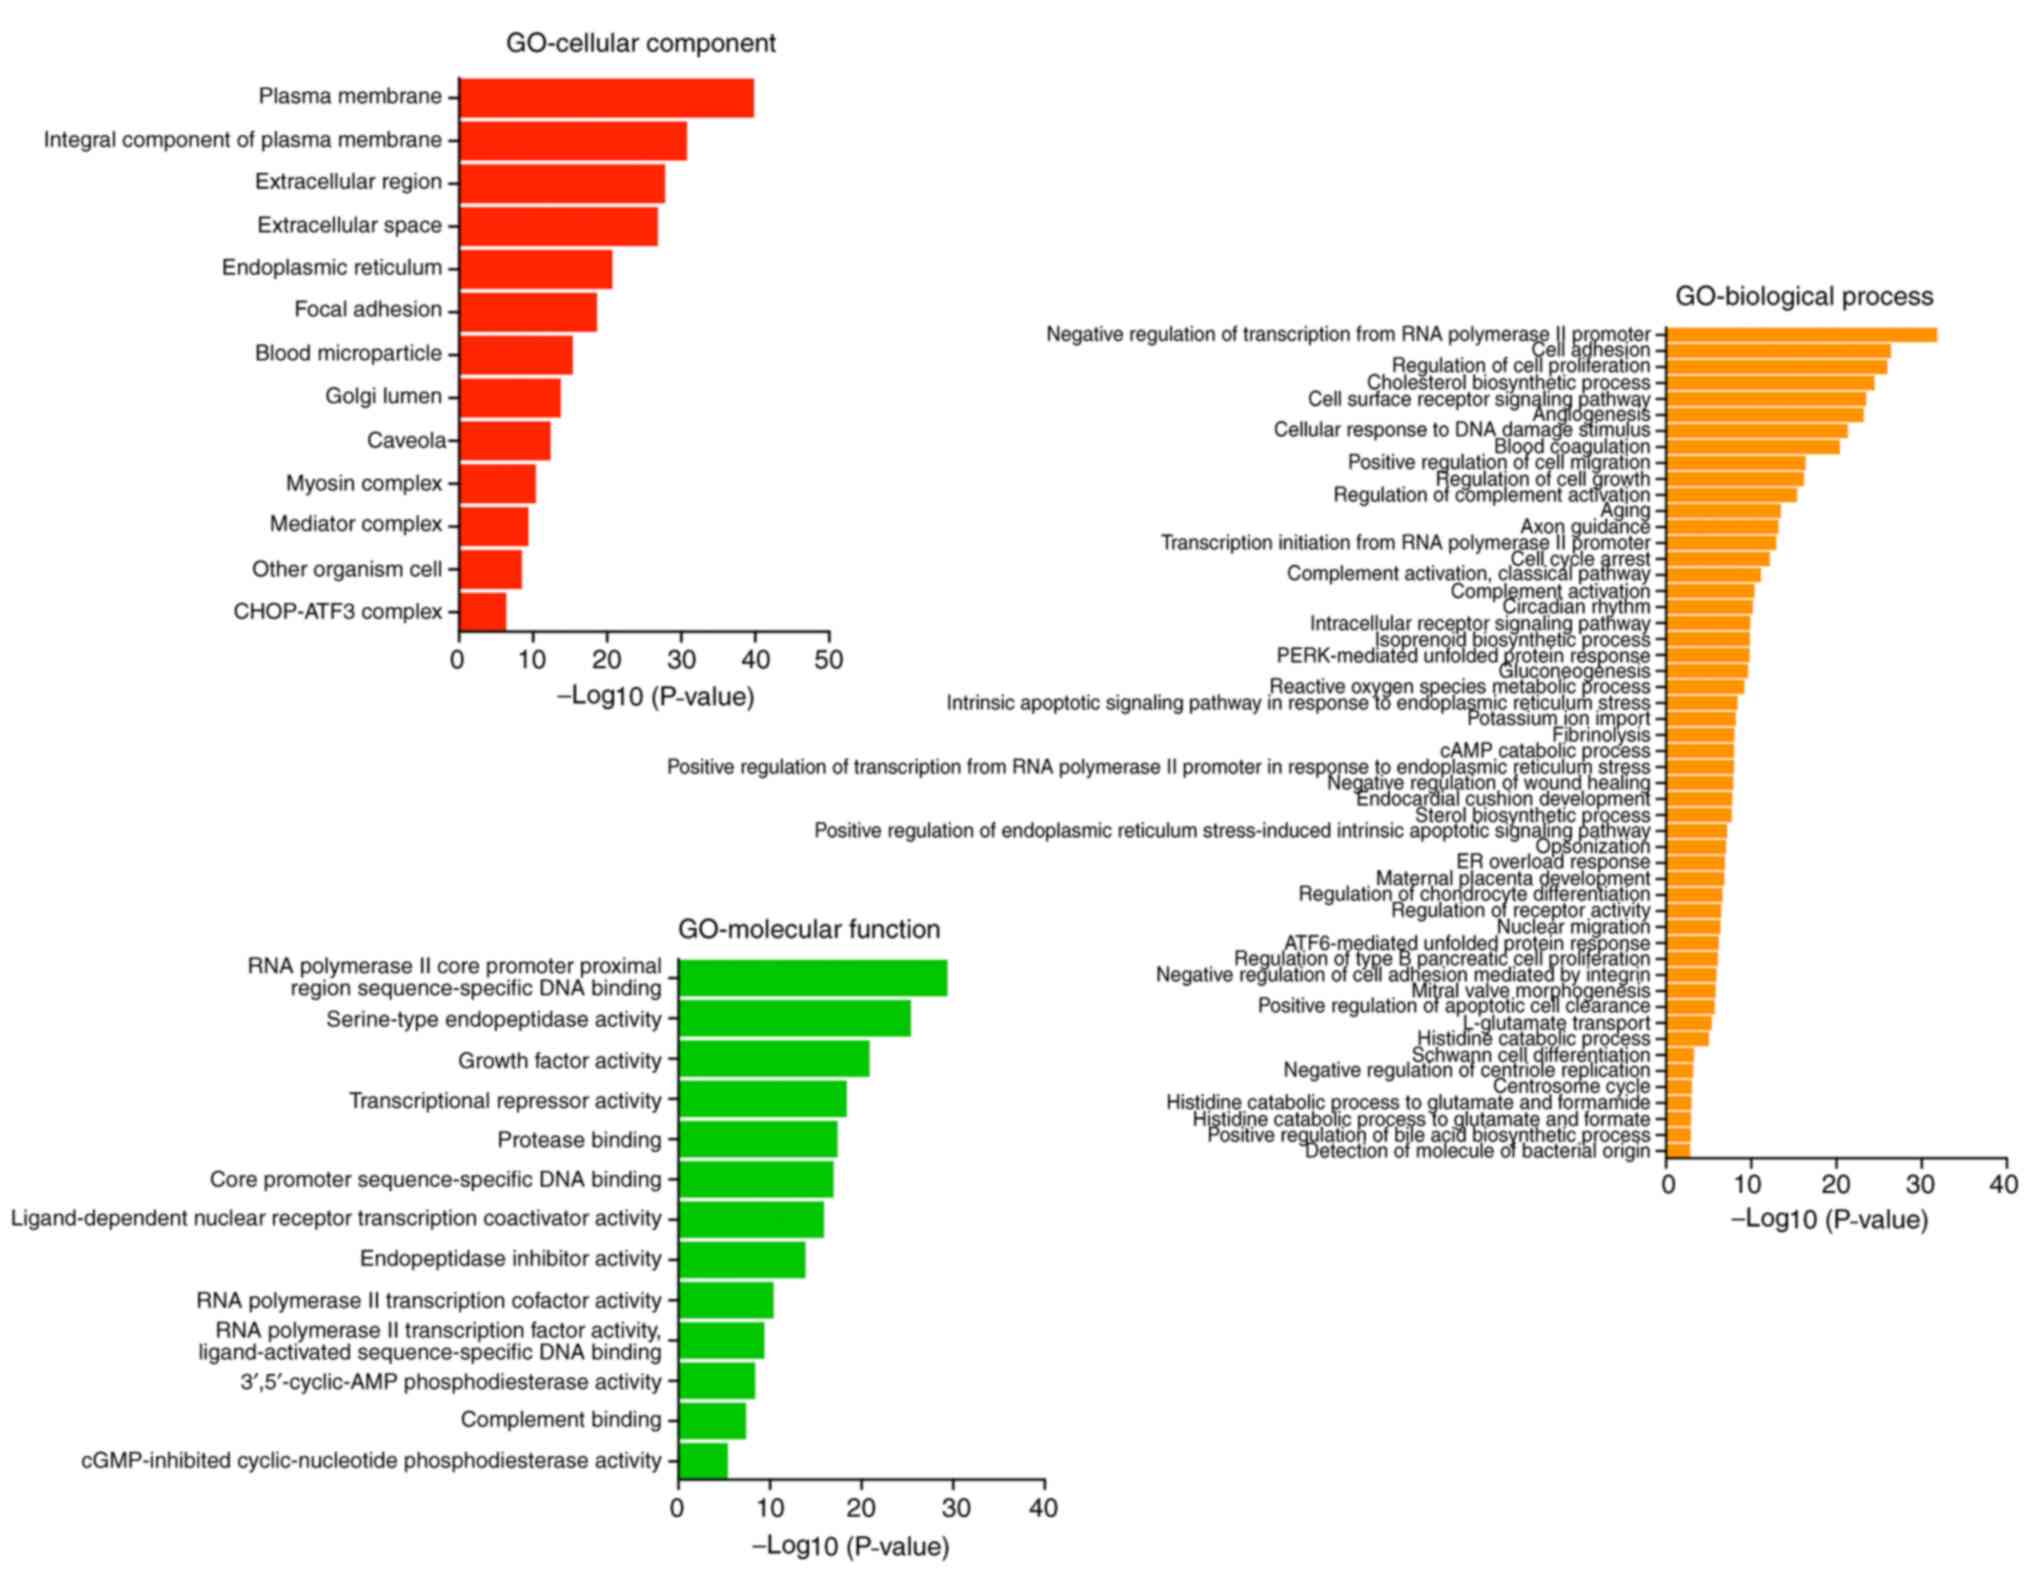
GO function classification of
differentially expressed genes after MAGEA6 overexpression
According to analyses of cellular component,
molecular function and biological processes using the threshold of
P<0.05 and log2(fold change)>1.5, it was observed
that the proteins encoded by these enriched genes are mainly
concentrated in the space outside the cell (the red one) and the
‘endoplasmic reticulum’. The main molecular function was determined
to be ‘RNA polymerase II core promoter proximal regions
sequence-specific DNA binding’ and ‘serine-type endopeptidase
activity’. The main biological processes involved were identified
as the ‘negative regulation of transcription from RNA polymerase II
promoter’, ‘cell adhesion’ and ‘cholesterol biosynthesis’ (Fig. 8). This result suggests that the
overexpression of MAGEA6 can induce a significant impact on gene
transcription.
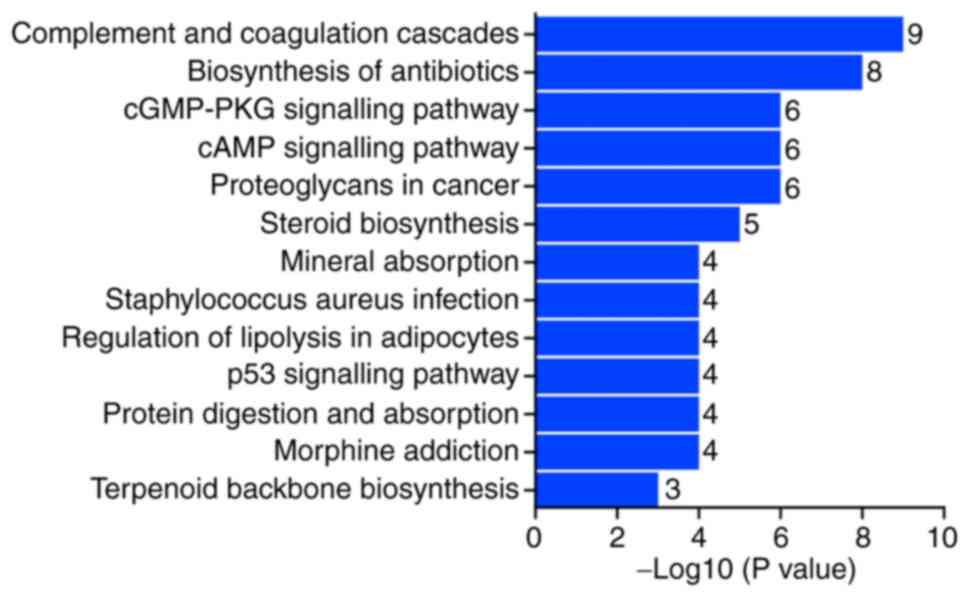
Pathway function analysis of MAGEA6
differentially expressed genes
From the analysis of KEGG pathways using the
threshold of P<0.05 and log2(fold-change)>1.5, it
was observed that the pathways of these differentially expressed
genes were mainly in the ‘complement and coagulation cascade’,
‘biosynthesis of antibiotics’ pathway and the ‘cGMP-PKG signalling
pathway’ (Fig. 9). This indicates
that MAGEA6 is closely associated with the complement cascade in
the blood.
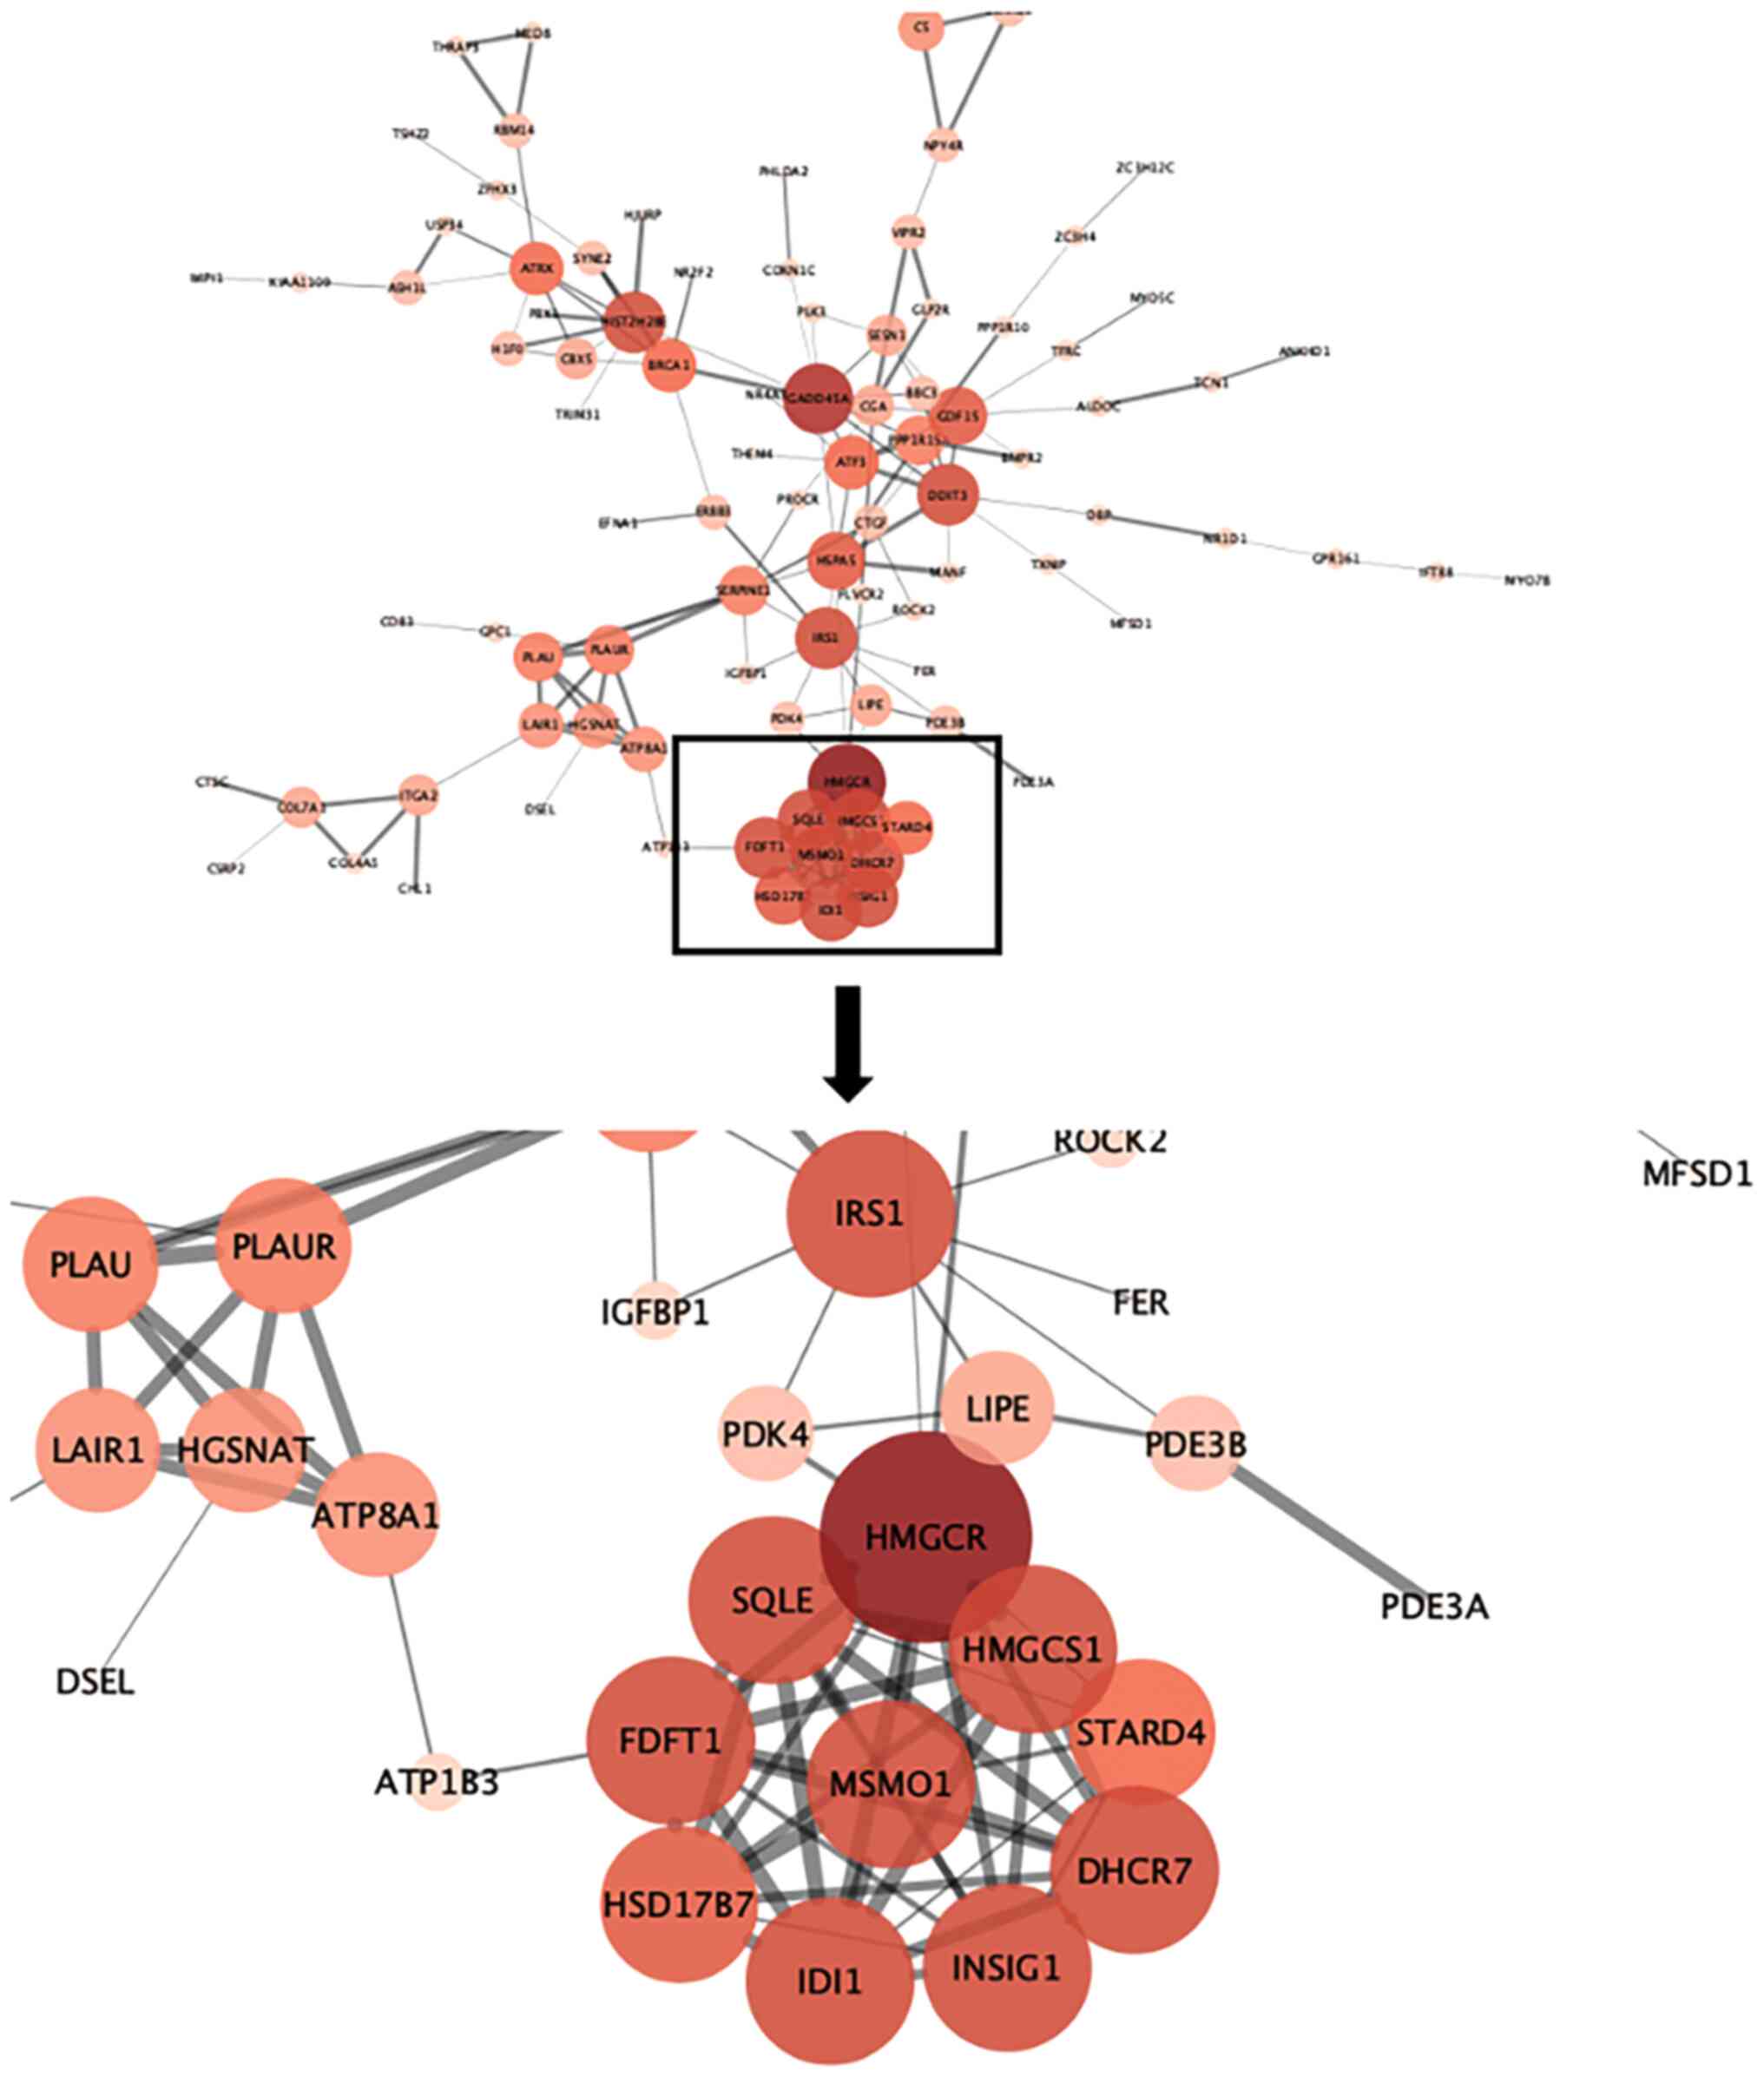
Identification of core genes through
screening of differentially expressed genes after MAGEA6
overexpression
A total of 197 differentially expressed genes were
screened through the differential gene analysis report obtained
from the aforementioned sequencing. These genes were analysed using
the STRING website to obtain a form containing information about
the corresponding interactions. This form was then applied to
Cytoscape to obtain a protein interaction map. HMGCR, SQLE, FDFT1,
HSD17B7, IDI1, INSIG1, DHCR7, HMGCS1, MSMO1, IRS1, DDTI3, GADD45A
and HIST2H2BE were determined to be the core genes. The interaction
relationship within the MSMO1 cluster of proteins can be seen from
the map in Fig. 10. The larger the
circle, the darker the color and the thicker the line, the more
central and important the gene. Through interaction analysis, MSMO1
was found to be a core protein surrounded by multiple related
pathway proteins.
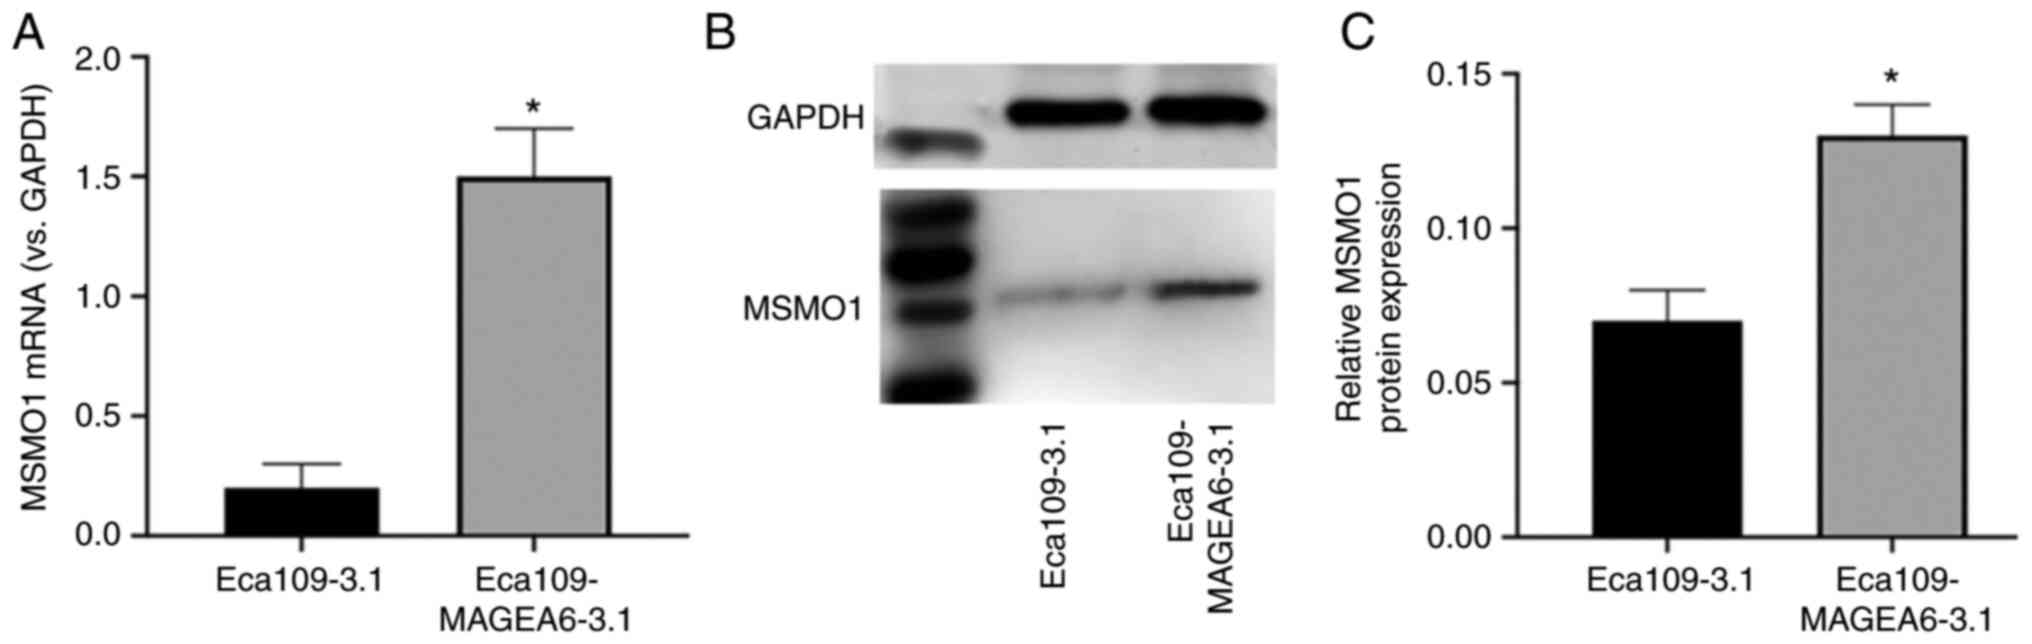
Regulation of MSMO1 expression
downstrea of MAGEA6 overexpression
The results of a previous screen demonstrated that
MSMO1 is both a differential protein and a core protein, which may
be closely associated with MAGEA6. The expression of MSMO1
increased with the increase of MAGEA6 expression (Fig. 11A). Western blotting results
demonstrated that the MSMO1 expression levels were significantly
higher in Eca109-MAGEA6-3.1 cells compared with those in the
Eca109-3.1 cells, which was consistent with the sequencing results
(Fig. 11B and C).
Discussion
In 1991, Van Der Bruggen et al isolated the
first melanoma-associated antigen (MAGE) gene from melanoma cells
and named it MAGEA1, which is a type of testicular tumour
antigen gene. It is expressed in tumor tissue and normal testicular
cells, but not in other normal cells (16). Subsequently, members of the MAGE
family discovered were named MAGEA, B, C, D, E, F, G, H and L2,
Necidin, MAGE-I and J (17). In
addition, the tumour-associated antigen encoded by the MAGE
gene can form a complex with specific human leukocyte antigen
molecules that can be recognised and killed by specific cytotoxic T
lymphocytes (18).
The MAGE gene family can be categorised as
either group I or II. There have been a number of studies on
members of group I, including the sub-families MAGE A, B and C
(15,18). Although they are expressed in
different types of tumour tissues, they are not expressed in normal
tissues except in testicular germ cells and placenta (15). Therefore, they are considered to be
tumour-specific antigens. Previous studies have shown that the
expression of MAGE is closely associated with the degree of tumour
differentiation, where its expression rate increases as the degree
of differentiation decreases (15,19).
Therefore, the level of MAGE gene expression has reliable
prognostic values for a number of malignant tumours, such as
stomach cancer and melanoma (19).
The MAGEA gene is an important member of the MAGE-I group. Because
it can encode tumour-specific antigen polypeptides, studies have
reported that MAGEA family members are important target molecules
for tumour immunotherapy (19,20).
The MAGEA gene subfamily has 15 members, which are all
located on Xq28 (19,20). The MAGEA1 gene is ~45 kb in
length, has three exons and encodes a protein of ~309-319 amino
acid residues, whereas MAGEA5, A7, A13,
A14 and A15 are pseudogenes with no transcriptional
products (20).
To the best of our knowledge, MAGEA3 is the most
widely studied protein in the MAGEA family, which shows almost no
expression in normal tissues but is expressed in different types of
malignant tissues (20,21). The mechanism of its action in tumour
tissues is not yet fully understood. Studies have previously
confirmed that MAGEA3 is highly expressed in a variety of
epithelial and hematopoietic malignancies and malignant tumours
derived from mesenchymal tissues (20,21).
Previous studies have also shown that the expression of MAGEA3 is
associated with the metastasis, invasion, prognosis and recurrence
of malignant tumours, suggesting that it can be used as an
indicator for the diagnosis and prognosis of patients with tumours
(20-22).
In addition, MAGEA3 has been shown to bind KAP1 and p53, thereby
inhibiting the activity of p53 and ultimately promoting the
activation of melanoma cells (21,22).
Atanackovic et al (23)
revealed that silencing the expression of MAGEA3 can induce
the apoptosis of malignant tumour cells, such as lung cancer,
confirmed that it is not involved in the regulation of
proliferation and adhesion in multiple myeloma cells, but that it
can promote multiple myeloma cell proliferation (23).
Limited studies suggest that MAGEA6 may participate
in the AMPK signalling pathway to inhibit the maintenance and
self-renewal of liver cells, and that it mediates the survival of
human glioma cells by targeting AMPKα1(24). According to the results from the
present study, although they share ~98% homology, MAGEA3 and MAGEA6
have significant differences in terms of functions and pathways
(24,25). A preliminary study using clinical
samples revealed that MAGEA6 expression is closely associated with
the occurrence of oesophageal cancer (25). The present study was conducted to
provide an in-depth analysis of the role of MAGEA6, which revealed
that it affected cell proliferation, invasion and migration. To
analyse the possible associated signalling pathways and function of
MAGEA6, transcriptome sequencing and bioinformatics analysis were
performed after MAGEA6 overexpression. This analysis found 14 genes
with significant differences after MAGEA6 overexpression. The
analysis revealed further that the majority of these 14 genes are
closely associated with cell migration and proliferation, which is
different from the signalling pathway in which MAGEA6 participates
in human glioma cells. Contrary to a previous report, MAGEA6 is
involved in other new signalling pathways, MAGEA6 and MSMO1 are
mutually regulated signalling pathways (6).
After modulating the expression level of MAGEA6, it
was revealed that it mainly affects the ‘negative regulation of
transcription from RNA polymerase II promoter’, ‘cell adhesion’ and
the ‘cholesterol biosynthetic pathway’. KEGG pathway analysis
demonstrated that the differentially expressed genes were mainly
involved in the ‘complement and coagulation cascades’ reaction,
‘biosynthesis of antibiotics’ pathway, ‘cGMP-PKG signalling
pathway’, cAMP pathway and steroid biosynthesis pathway. To explore
the role of core genes in the process of MAGEA6 function, all
possible associated differential genes were analysed using
Cytoscape (26). A total of 13 core
regulatory genes, including MSMO1, IRS1, DDTI3
and GADD45A, were identified. These results suggest that
these genes play a key role in the function of MAGEA6.
Among these 13 core regulatory genes, MSMO1
was one of 14 genes exhibiting a significant difference. It was
therefore hypothesised that it serves a notable role in the
function of MAGEA6. It was first verified to reveal that MAGEA6 had
a significant positive regulatory relationship with MSMO1. With the
increase of MAGEA6, MSMO1 gene was also significantly increased,
and the migration, invasion and proliferation were significantly
improved, suggesting that MAGEA6 functions by increasing the
expression level of MSMO1. MSMO1 serves an important role in lipid
biosynthesis by regulating human energy metabolism, obesity and
dyslipidaemia, which in turn plays a regulatory role in cell
proliferation and immune regulation (27,28).
At present, research on MSMO1 has mainly focused on cholesterol
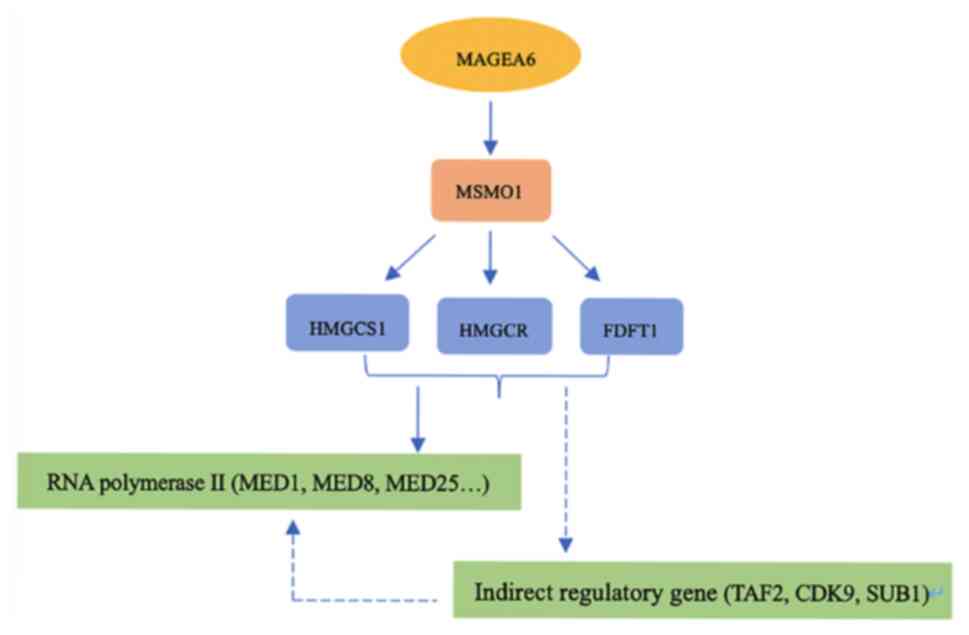
synthesis and fat metabolism (29).
This may represent a new signalling pathway involved in regulation
of the function of MAGEA6. It is hypothesized that MAGEA6 may
indirectly affect RNA polymerase II by influencing multiple genes
by regulating genes such as MSMO1, which provides a novel direction
to reveal the function of and signal pathways associated with
MAGEA6 with ESCC (Fig. 12).
In conclusion, MAGEA6 can enhance the migratory
ability of ESCC cells. Invasion experiments on three kinds of
cells, namely Eca109-MAGEA6-3.1, Eca109-3.1 and Eca109-MAGEA6-siRNA
revealed that the MAGEA6 overexpression increased the
invasive potential of Eca109 cells. MAGEA6 overexpression in cells
affected both cell migration and invasion. The migration rate of
cells with high MAGEA6 expression was significantly increased,
while that of cells with low MAGEA6 expression was significantly
reduced. After obtaining the differential genes closely associated
with the upregulation of MAGEA6 expression, transcriptome analysis
identified a series of core genes closely associated with the
regulation of MAGEA6 expression, especially MSMO1. This
suggests that MAGEA6 positively regulates MSMO1 expression, where
it may serve an important role in ESCC cells. MAGEA6 could
therefore be a multifunctional protein that can affect cell
metabolism and proliferation.
Acknowledgements
The authors would like to thank Mr. Li Jintao
(Beijing Key Laboratory of Environmental and Viral Oncology,
College of Life Science and Bio-Engineering, Beijing University of
Technology, Beijing, P.R. China) for providing bioinformatics
correlation analysis software (FastQC Software; V0.11.2) to
complete the analysis of the experimental results.
Funding
Funding: Funding was provided by The Scientific Research Project
of Beijing Educational Committee (grant no. KM201910005004), The
Beijing Natural Science Foundation (grant no. 5162003) and The
Beijing University of Technology Foundation (grant no.
015000514314004).
Availability of data and materials
The high-throughput sequencing datasets generated
and/or analysed during the current study are available in the NCBI
database (accession no. PRJNA693685; https://www.ncbi.nlm.nih.gov).
Authors' contributions
ML wrote the manuscript and designed the RT-qPCR
primers. YW helped perform the RT-qPCR experiment. CL helped
perform the western blotting. ML, MW and YY designed the gene
sequencing, and analysed the sequencing data. JL completed the
bioinformatics analysis, literature retrieval and statistical
analysis. ML and JL confirm the authenticity of all the raw data.
MG revised the manuscript, and participated in the analysis of
bioinformatics data, as well as the experimental conception. All
authors have read and approved the final manuscript.
Ethics approval and consent to
participate
Not applicable.
Patient consent for publication
Not applicable.
Competing interests
The authors declare that they have no competing
interests.
References
|
1
|
Montelli A, Dowdeswell JA, Ottesen D and
Johansen SE: 3D seismic evidence of buried iceberg ploughmarks from
the mid-Norwegian continental margin reveals largely persistent
North Atlantic current through the quaternary. Mar Geol. 399:66–83.
2018.PubMed/NCBI View Article : Google Scholar
|
|
2
|
Kirkin AF, Dzhandzhugazyan KN and Zeuthen
J: Cancer/testis antigens: Structural and immunobiological
properties. Cancer Invest. 20:222–236. 2002.PubMed/NCBI View Article : Google Scholar
|
|
3
|
Kumar N, Sood D, Gupta A, Jha NK, Jain P
and Chandra R: Cytotoxic T-lymphocyte elicited therapeutic vaccine
candidate targeting cancer against MAGE-A11 carcinogenic protein.
Biosci Rep. 40(BSR20202349)2020.PubMed/NCBI View Article : Google Scholar
|
|
4
|
Kuldkepp A, Karakai M, Toomsoo E, Reinsalu
O and Kurg R: Cancer-testis antigens MAGEA proteins are
incorporated into extracellular vesicles released by cells.
Oncotarget. 10:3694–3708. 2019.PubMed/NCBI View Article : Google Scholar
|
|
5
|
Gao X, Li Q, Chen G, He H and Ma Y: MAGEA3
promotes proliferation and suppresses apoptosis in cervical cancer
cells by inhibiting the KAP1/p53 signaling pathway. Am J Transl
Res. 12:3596–3612. 2020.PubMed/NCBI
|
|
6
|
Pan SJ, Ren J, Jiang H, Liu W, Hu LY, Pan
YX, Sun B, Sun QF and Bian LG: MAGEA6 promotes human glioma cell
survival via targeting AMPKα1. Cancer Lett. 412:21–29.
2018.PubMed/NCBI View Article : Google Scholar
|
|
7
|
Pineda CT and Potts PR: Oncogenic
MAGEA-TRIM28 ubiquitin ligase downregulates autophagy by
ubiquitinating and degrading AMPK in cancer. Autophagy. 11:844–846.
2015.PubMed/NCBI View Article : Google Scholar
|
|
8
|
Shukla SA, Bachireddy P, Schilling B,
Galonska C, Zhan Q, Bango C, Langer R, Lee PC, Gusenleitner D,
Keskin DB, et al: Cancer-germline antigen expression discriminates
clinical outcome to CTLA-4 blockade. Cell. 173:624–633.e8.
2018.PubMed/NCBI View Article : Google Scholar
|
|
9
|
Wong PP, Yeoh CC, Ahmad AS, Chelala C,
Gillett C, Speirs V, Jones JL and Hurst HC: Identification of MAGEA
antigens as causal players in the development of
tamoxifen-resistant breast cancer. Oncogene. 33:4579–4588.
2014.PubMed/NCBI View Article : Google Scholar
|
|
10
|
Schooten E, Di Maggio A, van Bergen En
Henegouwen PMP and Kijanka MM: MAGE-A antigens as targets for
cancer immunotherapy. Cancer Treat Rev. 67:54–62. 2018.PubMed/NCBI View Article : Google Scholar
|
|
11
|
Morgan RA, Chinnasamy N, Abate-Daga D,
Gros A, Robbins PF, Zheng Z, Dudley ME, Feldman SA, Yang JC, Sherry
RM, et al: Cancer regression and neurological toxicity following
anti-MAGE-A3 TCR gene therapy. J Immunother. 36:133–151.
2013.PubMed/NCBI View Article : Google Scholar
|
|
12
|
Hao J, Li S, Li J, Jiang Z, Ghaffar M,
Wang M, Jia R, Chen S, Wang Y and Zeng Y: Investigation into the
expression levels of MAGEA6 in esophageal squamous cell carcinoma
and esophageal adenocarcinoma tissues. Exp Ther Med. 18:1816–1822.
2019.PubMed/NCBI View Article : Google Scholar
|
|
13
|
Fon Tacer K, Montoya MC, Oatley MJ, Lord
T, Oatley JM, Klein J, Ravichandran R, Tillman H, Kim M, Connelly
JP, et al: MAGE cancer-testis antigens protect the mammalian
germline under environmental stress. Sci Adv.
5(eaav4832)2019.PubMed/NCBI View Article : Google Scholar
|
|
14
|
Zhang Y, Zhang Y and Zhang L: Expression
of cancer-testis antigens in esophageal cancer and their progress
in immunotherapy. J Cancer Res Clin Oncol. 145:281–291.
2019.PubMed/NCBI View Article : Google Scholar
|
|
15
|
Sang M, Meng L, Sang Y, Liu S, Ding P, Ju
Y, Liu F, Gu L, Lian Y, Li J, et al: Circular RNA ciRS-7
accelerates ESCC progression through acting as a miR-876-5p sponge
to enhance MAGE-A family expression. Cancer Lett. 426:37–46.
2018.PubMed/NCBI View Article : Google Scholar
|
|
16
|
Lee TB, Lim SC, Moon YS and Choi CH:
Melanoma antigen gene family A as a molecular marker of gastric and
colorectal cancers. Oncol Rep. 30:234–238. 2013.PubMed/NCBI View Article : Google Scholar
|
|
17
|
Guo JC, Yang YJ, Zhang JQ, Guo M, Xiang L,
Yu SF, Ping H and Zhuo L: microRNA-448 inhibits stemness
maintenance and self-renewal of hepatocellular carcinoma stem cells
through the MAGEA6-mediated AMPK signaling pathway. J Cell Physiol.
234:23461–23474. 2019.PubMed/NCBI View Article : Google Scholar
|
|
18
|
Shannon P, Markiel A, Ozier O, Baliga NS,
Wang JT, Ramage D, Amin N, Schwikowski B and Ideker T: Cytoscape: A
software environment for integrated models of biomolecular
interaction networks. Genome Res. 13:2498–2504. 2003.PubMed/NCBI View Article : Google Scholar
|
|
19
|
Jurisic V: Multiomic analysis of cytokines
in immuno-oncology. Expert Rev Proteomics. 17:663–674.
2020.PubMed/NCBI View Article : Google Scholar
|
|
20
|
Zou C, Shen J, Tang Q, Yang Z, Yin J, Li
Z, Xie X, Huang G, Lev D and Wang J: Cancer-testis antigens
expressed in osteosarcoma identified by gene microarray correlate
with a poor patient prognosis. Cancer. 118:1845–1855.
2012.PubMed/NCBI View Article : Google Scholar
|
|
21
|
Hilal NR, Novikov DV, Novikov VV and
Karaulov AV: Cancer-testis genes in colon cancer. Ter Arkh.
89:113–117. 2017.PubMed/NCBI View Article : Google Scholar : (In Russian).
|
|
22
|
Bredenbeck A, Hollstein VM, Trefzer U,
Sterry W, Walden P and Losch FO: Coordinated expression of
clustered cancer/testis genes encoded in a large inverted repeat
DNA structure. Gene. 415:68–73. 2008.PubMed/NCBI View Article : Google Scholar
|
|
23
|
Atanackovic D, Hildebrandt Y, Jadczak A,
Cao Y, Luetkens T, Meyer S, Kobold S, Bartels K, Pabst C, Lajmi N,
et al: Cancer-testis antigens MAGE-C1/CT7 and MAGE-A3 promote the
survival of multiple myeloma cells. Haematologica. 95:785–793.
2010.PubMed/NCBI View Article : Google Scholar
|
|
24
|
Zajac P, Schultz-Thater E, Tornillo L,
Sadowski C, Trella E, Mengus C, Iezzi G and Spagnoli GC: MAGE-A
antigens and cancer immunotherapy. Front Med (Lausanne).
4(18)2017.PubMed/NCBI View Article : Google Scholar
|
|
25
|
Willett CS and Wilson EM: Evolution of
melanoma antigen-A11 (MAGEA11) during primate phylogeny. J Mol
Evol. 86:240–253. 2018.PubMed/NCBI View Article : Google Scholar
|
|
26
|
Tang WW, Liu ZH, Yang TX, Wang HJ and Cao
XF: Upregulation of MAGEA4 correlates with poor prognosis in
patients with early stage of esophageal squamous cell carcinoma.
Onco Targets Ther. 9:4289–4293. 2016.PubMed/NCBI View Article : Google Scholar
|
|
27
|
Meek DW and Marcar L: MAGE-A antigens as
targets in tumour therapy. Cancer Lett. 324:126–132.
2012.PubMed/NCBI View Article : Google Scholar
|
|
28
|
Laiseca JE, Ladelfa MF, Cotignola J, Peche
LY, Pascucci FA, Castaño BA, Galigniana MD, Schneider C and Monte
M: Functional interaction between co-expressed MAGE-A proteins.
PLoS One. 12(e0178370)2017.PubMed/NCBI View Article : Google Scholar
|
|
29
|
Yang P, Huo Z, Liao H and Zhou Q:
Cancer/testis antigens trigger epithelial-mesenchymal transition
and genesis of cancer stem-like cells. Curr Pharm Des.
21:1292–1300. 2015.PubMed/NCBI View Article : Google Scholar
|
|
30
|
Tauber C, Schultheiss M, Luca R, Buettner
N, Llewellyn-Lacey S, Emmerich F, Zehe S, Price DA,
Neumann-Haefelin C, Schmitt-Graeff A, et al: Inefficient induction
of circulating TAA-specific CD8+ T-cell responses in hepatocellular
carcinoma. Oncotarget. 10:5194–5206. 2019.PubMed/NCBI View Article : Google Scholar
|
|
31
|
Baran CA, Agaimy A, Wehrhan F, Weber M,
Hille V, Brunner K, Wickenhauser C, Siebolts U, Nkenke E, Kesting M
and Ries J: MAGE-A expression in oral and laryngeal leukoplakia
predicts malignant transformation. Mod Pathol. 32:1068–1081.
2019.PubMed/NCBI View Article : Google Scholar
|
|
32
|
Chen X, Cai S, Wang L, Zhang X, Li W and
Cao X: Analysis of the function of MAGE-A in esophageal carcinoma
by bioinformatics. Medicine (Baltimore). 98(e15774)2019.PubMed/NCBI View Article : Google Scholar
|
|
33
|
Ervin JM, Schütz LF and Spicer LJ: Current
status of the role of endothelins in regulating ovarian follicular
function: A review. Anim Reprod Sci. 186:1–10. 2017.PubMed/NCBI View Article : Google Scholar
|
|
34
|
Brancaccio M, Natale F, Falco G and
Angrisano T: Cell-free DNA methylation: The new frontiers of
pancreatic cancer biomarkers' discovery. Genes (Basel).
11(14)2019.PubMed/NCBI View Article : Google Scholar
|
|
35
|
Wiszniewski W, Hunter JV, Hanchard NA,
Willer JR, Shaw C, Tian Q, Illner A, Wang X, Cheung SW, Patel A, et
al: TM4SF20 ancestral deletion and susceptibility to a pediatric
disorder of early language delay and cerebral white matter
hyperintensities. Am J Hum Genet. 93:197–210. 2013.PubMed/NCBI View Article : Google Scholar
|
|
36
|
Puissant MM, Muere C, Levchenko V, Manis
AD, Martino P, Forster HV, Palygin O, Staruschenko A and Hodges MR:
Genetic mutation of Kcnj16 identifies Kir5.1-containing channels as
key regulators of acute and chronic pH homeostasis. FASEB J.
33:5067–5075. 2019.PubMed/NCBI View Article : Google Scholar
|
|
37
|
Jabara HH, Boyden SE, Chou J, Ramesh N,
Massaad MJ, Benson H, Bainter W, Fraulino D, Rahimov F, Sieff C, et
al: A missense mutation in TFRC, encoding transferrin receptor 1,
causes combined immunodeficiency. Nat Genet. 48:74–78.
2016.PubMed/NCBI View Article : Google Scholar
|
|
38
|
Sato Y, Inokuchi M, Takagi Y and Kojima K:
IGFBP1 is a predictive factor for haematogenous metastasis in
patients with gastric cancer. Anticancer Res. 39:2829–2837.
2019.PubMed/NCBI View Article : Google Scholar
|
|
39
|
Andrew M, Liao L, Fujimoto M, Khoury J,
Hwa V and Dauber A: PAPPA2 as a therapeutic modulator of IGF-I
bioavailability: In vivo and in vitro evidence. J Endocr Soc.
2:646–656. 2018.PubMed/NCBI View Article : Google Scholar
|
|
40
|
Wu K, Li L, Li L and Wang D: Long
non-coding RNA HAL suppresses the migration and invasion of serous
ovarian cancer by inhibiting EMT signaling pathway. Biosci Rep.
40(BSR20194496)2020.PubMed/NCBI View Article : Google Scholar
|
|
41
|
Jiang H, Liu Y, Qian Y, Shen Z, He Y, Gao
R, Shen M, Chen S, Fu Q and Yang T: CHL1 promotes insulin secretion
and negatively regulates the proliferation of pancreatic β cells.
Biochem Biophys Res Commun. 525:1095–1102. 2020.PubMed/NCBI View Article : Google Scholar
|