Introduction
Vestibular schwannoma (VS), also known as vestibular
Schwann cell tumor or acoustic neuroma (AN), is a type of primary
tumor in the nerve sheath of the junction between the cranial nerve
Ⅷ vestibular branch center and peripheral nerves (1). VS is a common intracranial tumor,
accounting for ~90% of cerebellopontine angle tumors (2).
The vast majority of VS are benign tumors, while
malignant tumors or malignant transformation are rarely seen. The
type of VS varies, but in most cases the tumor grows slowly at an
annual rate of ~1-2 mm (3).
Furthermore, a part of the tumor would stop growing when it reaches
a certain size, or undergoes auto-atrophy and become smaller
(3). However, large tumors may
still remain in the brain stem and cause compression or
intracranial hypertension, which threaten patient's life when the
symptoms are severe. VS is mostly disseminated unilateral lesion,
though some are family genetic bilateral lesions. For different
sizes and types of the VS, the current treatment methods include
surgical resection, stereotactic radiotherapy and long-term
follow-up observation (4).
Nevertheless, patients are always at risk of serious intracranial
complications after surgery or radiotherapy. Accordingly, such
treatment outcome effect is unsatisfactory for both patients and
doctors. Thus, there is an urgent need for a comprehensive and
specific method to reduce the risk of postoperative complications
and to improve the situation.
In recent years, accumulating evidence has suggested
that various types of genes and cellular pathways contribute to the
occurrence and development of VS. A study by Martini et al
(5), which was conducted on YAP,
TAZ and AREG expression in eighth cranial nerve schwannoma, proved
that there was a significant direct correlation between TAZ
expression and vestibular schwannoma volumes. In addition, Zhang
et al (6) reported on a cDNA
microarray analysis on VS and solid vestibular schwannoma models,
which demonstrates a mutation spectrum and differential gene
expression in cystic and solid vestibular schwannoma, which could
provide useful insights into the molecular mechanism. However, few
current studies had expounded a comprehensive and precise molecular
mechanism related to VS progression and pathogenesis; nevertheless,
the current understanding of VS is still limited, superficial and
provincial. Therefore, there is a need for comprehensive research
to improve the present situation.
Microarray technology combined with bioinformatics
made it possible to analyze the genetic alteration and molecular
mechanisms in the development and progression of VS, which may
provide a theoretical basis for target prevention in VS. In the
present study, gene expression profiles of VS tissues and the
normal tissues were analyzed to identify the discrepancy, in order
to define differentially expressed genes (DEGs). Subsequently, Gene
Ontology (GO), Kyoto Encyclopedia of Genes and Genomes (KEGG)
pathway enrichment analysis and protein-protein interaction (PPI)
network analysis were conducted, as well as reverse
transcription-quantitative (RT-q)PCR analysis. The aim of the
present study was to provide data to determine the comprehensive
and profound mechanism of VS, biomarkers for diagnosis and
prognosis of VS, and novel targets for treatment of patients with
VS.
Materials and methods
Microarray data
The expression profiles of GSE54934 (https://www.ncbi.nlm.nih.gov/geo/query/acc.cgi?acc=GSE54934),
GSE39645 (https://www.ncbi.nlm.nih.gov/geo/query/acc.cgi?acc=GSE39645)
and GSE56597 (https://www.ncbi.nlm.nih.gov/geo/query/acc.cgi?acc=GSE56597)
were obtained from Gene Expression Omnibus (GEO, http://www.ncbi.nlm.nih.gov/geo) database of
National Center of Biotechnology Information (NCBI) (http://www.ncbi.nlm.nih.gov/). The array data of
GSE54934 contained 31 VS samples and 9 normal nerve samples.
GSE39645 includes 31 VS samples and 9 normal nerve samples.
GSE56597 contains 31 VS samples and 9 normal nerve samples
(7-9).
Data preprocessing and identification
of DEGs
After obtaining the data, the GeneSpring software
(version 11.5; Agilent Technologies, Inc.) was used to analyze the
DEGs that were identified. The data of every series was categorized
into two groups (VS and normal). Hierarchical clustering analysis
and principle component analysis (PCA) were applied to determined
probe quality control in GeneSpring. Probes, where intensity values
below 20th percentile were filtered out with ‘Filter ProbeSets by
Expression’ option. Within series, unpaired t-test was used to
identify DEGs with a change >2.0 fold and defined a P-value
cutoff of <0.05 to be considered as statistically significant.
Then, Venn plot and analysis were conducted using website tools
(http://bioinformatics.psb.ugent.be/webtools/Venn/).
Functional and pathway enrichment
analysis
The Database for Annotation, Visualization and
Integrated Discovery (DAVID; http://david.abcc.ncifcrf.gov/) is an online program
applied to provide a comprehensive set of functional annotation
tools to perceive biological meaning underlying a group of genes.
GO (http://www.geneontology.org/) enrichment
analysis is a method to analyze biological process, molecular
function and cell component. KEGG pathway enrichment analysis was
used to identify DEGs using the DAVID database. P<0.05 was
considered to indicate a statistically significant difference.
PPI network and module analysis
Search Tools for Retrieval of Interacting Genes
(STRING; http://string.embl.de/) database and
Cytoscape (v 3.8.2) software (The Cytoscape Consortium) were used
to construct the protein-protein interaction (PPI) network of DEGs
(10,11). Subsequently, the Molecular Complex
Detection (MCODE) was performed to screen hub genes and modules.
P<0.05 was considered to indicate a statistically significant
difference. Subsequently, the function and pathway enrichment
analysis were performed for DEGs with DAVID.
Cell lines
XY-H350 (human Schwann cell line), HEI193 cell line
and RT4-D6P2T cell line (schwannoma cell line) were obtained from
the American Type Culture Collection. All cell lines were cultured
in Dulbecco's modified Eagle's medium (HyClone; Cytvia)
supplemented with 10% fetal bovine serum (Gibco; Thermo Fisher
Scientific, Inc.). An atmosphere of 5% CO2 and 95% air
at 37˚C was maintained for the cultivation of the cell lines.
RT-qPCR
In order to confirm the expression of BCL2, AGT, IL6
and ITGA2 in the human Schwann cell line and schwannoma cell lines,
RT-qPCR was performed in triplicate in a CFX96 Real-Time System
(Bio-Rad Laboratories, Inc.) with a FastStart Universal SYBR Green
Master (ROX) (Roche Diagnostics) according to the manufacturer's
instructions and expression levels were normalized to
glyceraldehyde-3-phosphate dehydrogenase (GAPDH).
TRIzol® reagent (Thermo Fisher Scientific, Inc.) was
utilized to isolate RNA from tissues and cells, as per the
guidelines provided by the manufacturer. The PrimeScript RT-qPCR
kit (Takara Bio, Inc.) was utilized for reverse transcription to
obtain cDNA. To quantify gene expression, two-Step RT-qPCR was
performed with hot start Taq at 95˚C (15 sec), with annealing and
extension at 60˚C (60 sec) for 40 cycles, followed by a melting
curve analysis. All RT-qPCR data were analyzed using the
2-∆∆Cq method (12).
Primers (Shanghai GenePharma Co., Ltd.) were designed through
Primer Bank (https://pga.mgh.harvard.edu/primerbank/) and were
re-checked by NCBI Primer-Blast (http://www.ncbi.nlm.nih.gov/tools/primer-blast/). The
following gene-specific primers were used: BCL2 sense,
5'-GGTGGGGTCATGTGTGTGG-3'; BCL2 anti-sense,
5'-CGGTTCAGGTACTCAGTCATCC-3'; AGT sense, CCCCAGTCTGAGATGGCTC; AGT
anti-sense, GACGAGGTGGAAGGGGTGTA; IL6 sense,
ACTCACCTCTTCAGAACGAATTG; IL6 anti-sense, CCATCTTTGGAAGGTTCAGGTTG;
and ITGA2 sense, CCTACAATGTTGGTCTCCCAGA; and ITGA2 anti-sense,
AGTAACCAGTTGCCTTTTGGATT and GAPDH sense, GGAGCGAGATCCCTCCAAAAT.
Western blot analysis
Western blot analysis was performed to further
verify the expression of BCL2, AGT, IL6 and ITGA2 in human Schwann
cell line and schwannoma cell lines. Total protein extracts of
tissues were obtained using RIPA buffer (Pierce; Thermo Fisher
Scientific, Inc.). Protein concentration was determined using the
Bradford method (Bio-Rad Laboratories, Inc.). Protein samples were
separated using 10% SDS-PAGE and transferred to PVDF membranes
(Roche Applied Science). The membranes were preincubated with 5%
skim milk in Tris-buffered saline (TBS) for 2 h at room
temperature.
All cell lines were cultured in the same growth
media. The protein samples from cultures were separated through
electrophoresis. The target proteins in membranes were detected
using primary antibodies to BCL2, AGT, IL6 and ITGA2, and incubated
with the selected secondary antibodies. The following primary
antibodies (EASYBIO) were diluted 1:1,000 in 1X TBS with 0.1%
Tween-20 (TBST), and the samples were incubated overnight at 4˚C:
Plant GST rabbit polyclonal (cat. no. be3158-50), phosphotyrosine
mouse monoclonal (cat. no. be3431) transferrin rabbit polyclonal
(cat. no. be3357-100), ubiquitin mouse monoclonal (cat. no. be3601)
and SPB (cat. no. wrab-48604) antibodies. The membranes were washed
four times with TBST, horseradish peroxidase (HRP)-conjugated
secondary antibodies, goat anti-rabbit IgG-HRP; cat. no. sc-2004;
Santa Cruz Biotechnology, Inc.) were added, and the membranes were
incubated for 1 h at room temperature. The samples were diluted
1:1,000 in TBST, and the hybridized bands were detected with an ECL
detection kit (Thermo Fisher Scientific, Inc.) and Chemidoc XR
image analyzer (Bio-Rad Laboratories, Inc.).
Following that, the membranes were visualized with
an enhanced chemiluminescence detection system (Pierce; Thermo
Fisher Scientific, Inc.). Western blot band intensities were
analyzed with the National Institutes of Health Image 1.63 program
(developed at the US National Institutes of Health; available at
http://rsb.info.nih.gov/nih-image/).
Statistics
All statistic data were entered into SPSS 18.0 (SPSS
Inc.) for analysis. ANOVA was used to analyze multiple comparison
of RT-qPCR and Western blot analysis. Dunnett's t-test was
performed as post hoc analysis. P<0.05 was considered to
indicate a statistically significant difference.
Results
Identification of DEGs
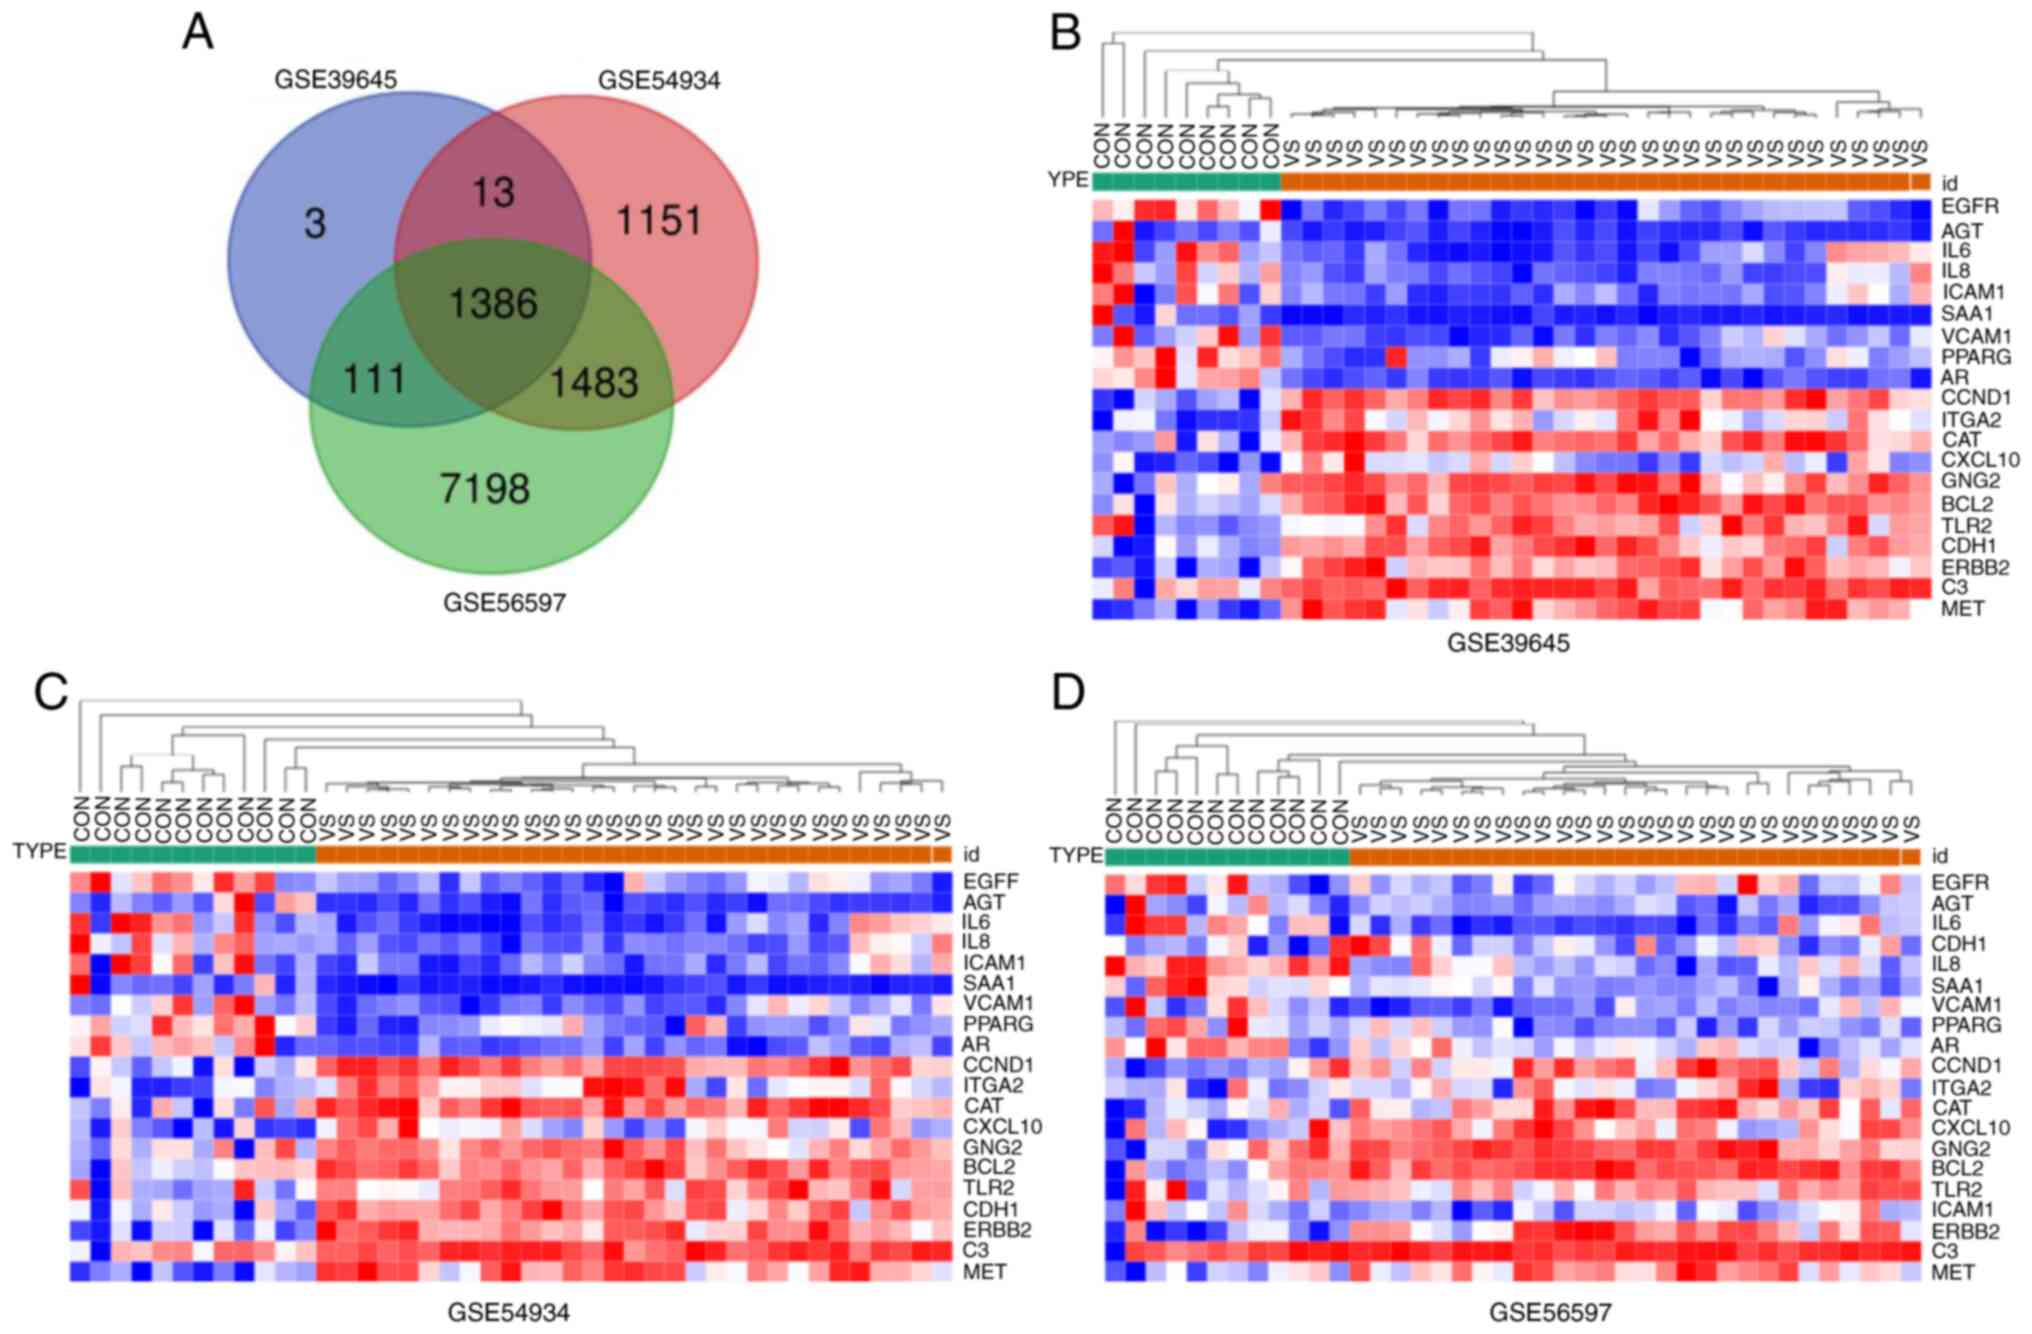
The series of data were analyzed separately by
GeneSpring software, and DEGs were finally identified. A total of
4,025, 11,291 and 1,513 DEGs were identified from GSE54934,
GSE56597 and GSE39645 datasets. In GSE54934, there were 1,225
upregulated and 2,800 downregulated DEGs; in GSE56597, the numbers
of up- and downregulated DEGs were 7,687 and 3,604, respectively;
in GSE39645, 1,101 genes were upregulated and 412 were
downregulated. The results of Venn plot screened 1386 mutual DEGs,
as presented in Fig. 1A and
Table S1, and heatmap of DEGs are
shown in Fig. 1B-D.
Functional and pathway enrichment
analysis
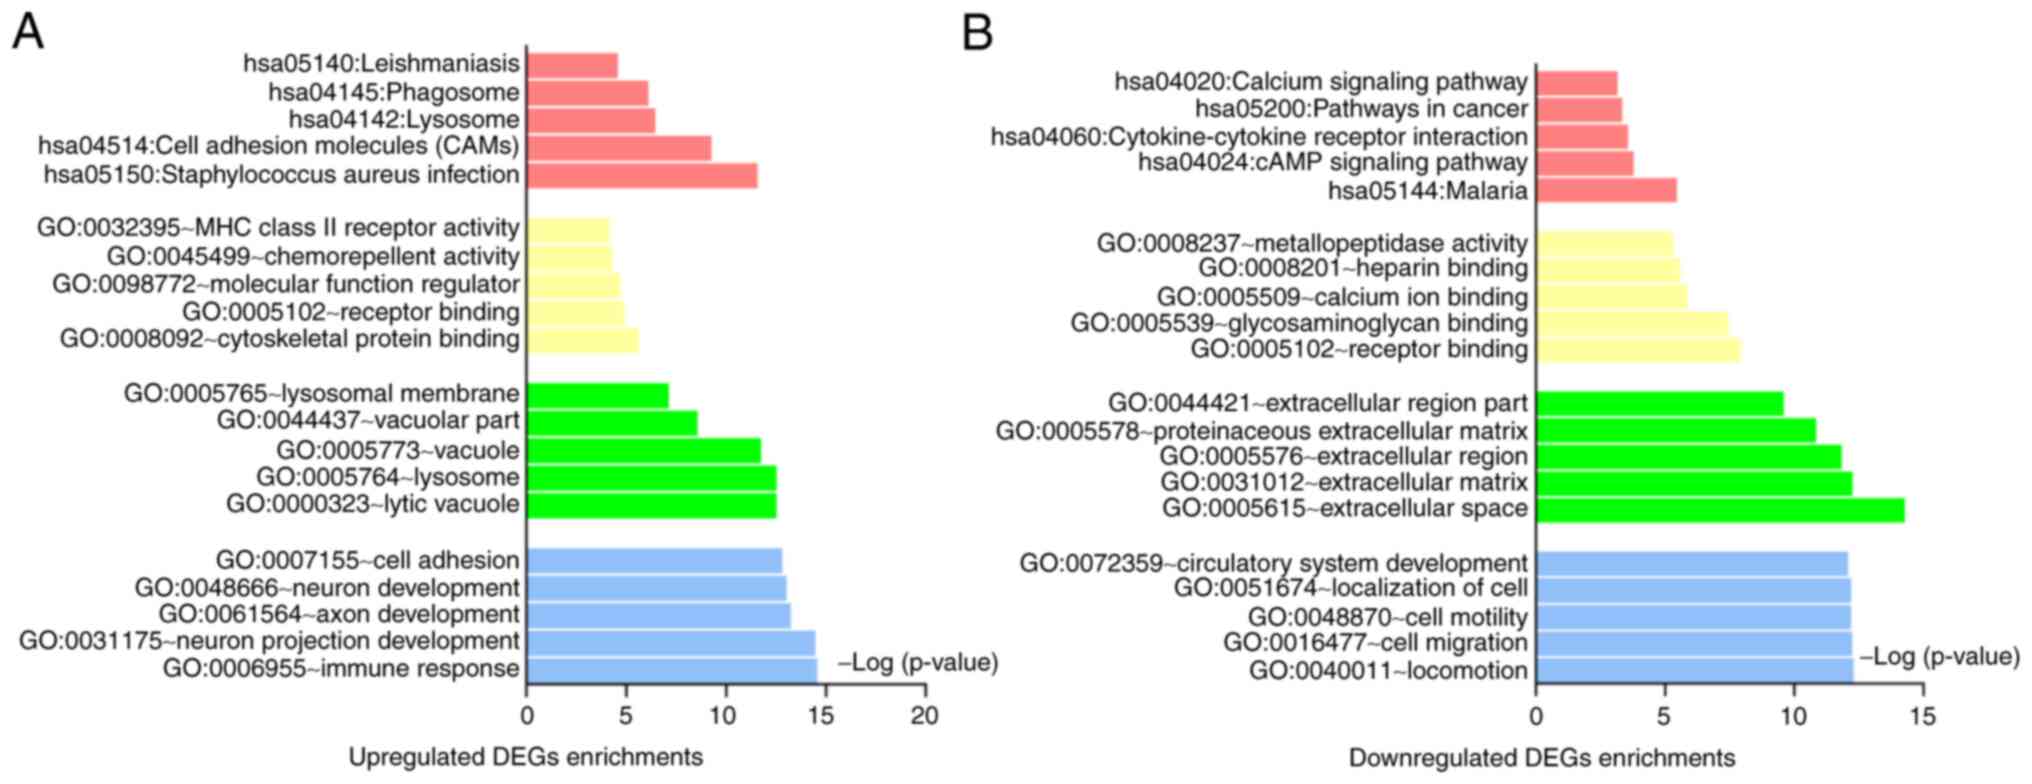
To gain further insight into the molecular mechanism
of VA, the mutual DEGs were further explored for functional and
pathway enrichment analysis, which are shown in Table I and Fig. 2A and B. In biological processes (BP), the
upregulated genes were mainly enriched in immune response, cell
adhesion and neuron development, while downregulated genes were
involved in locomotion, extracellular space, cell motility,
localization of cell and circulatory system development. For cell
component (CC), the upregulated genes were mainly associated with
lysosome, lysosomal membrane and vacuolar part, whereas the
downregulated genes were associated with extracellular space,
extracellular matrix and extracellular region. In molecular
function (MF), the upregulated genes were mainly enriched in
cytoskeletal protein binding, receptor binding and chemorepellent
activity, while the downregulated in receptor binding, calcium ion
binding and heparin binding. Moreover, as shown in Fig. 3A, several KEGG pathways were
overrepresented, which are cell adhesion molecules (CAMs),
phagosome, lysosome, simultaneously, malaria and cAMP signaling
pathway.
 | Table IFunctional and pathway enrichment
analysis of upregulated and downregulated genes among three
datasets. |
Table I
Functional and pathway enrichment
analysis of upregulated and downregulated genes among three
datasets.
| | Category | Term | Count | % | P-value |
|---|
| Upregulated | GOTERM_BP_FAT | GO:0006955-immune
response | 155 | 15.78 |
2.77x10⁻¹⁵ |
| | GOTERM_BP_FAT | GO:0031175-neuron
projection development | 100 | 10.18 |
3.35x10⁻¹⁵ |
| | GOTERM_BP_FAT | GO:0061564-axon
development | 66 | 6.72 |
5.55x10⁻¹⁴ |
| | GOTERM_BP_FAT | GO:0048666-neuron
development | 108 | 11.00 |
9.34x10⁻¹⁴ |
| | GOTERM_BP_FAT | GO:0007155-cell
adhesion | 160 | 16.29 |
1.54x10⁻¹³ |
| | GOTERM_CC_FAT | GO:0000323-lytic
vacuole | 77 | 7.84 |
2.99x10⁻¹³ |
| | GOTERM_CC_FAT |
GO:0005764-lysosome | 77 | 7.84 |
2.99x10⁻¹³ |
| | GOTERM_CC_FAT |
GO:0005773-vacuole | 130 | 13.24 |
1.74x10⁻¹² |
| | GOTERM_CC_FAT | GO:0044437-vacuolar
part | 82 | 8.35 |
2.71x10⁻⁹ |
| | GOTERM_CC_FAT |
GO:0005765-lysosomal membrane | 42 | 4.28 |
7.37x10⁻⁸ |
| | GOTERM_MF_FAT |
GO:0008092-cytoskeletal protein
binding | 77 | 7.84 |
2.27x10⁻⁶ |
| | GOTERM_MF_FAT | GO:0005102-receptor
binding | 114 | 11.61 |
1.23x10⁻⁵ |
| | GOTERM_MF_FAT |
GO:0098772-molecular function
regulator | 109 | 11.10 |
1.94x10⁻⁵ |
| | GOTERM_MF_FAT |
GO:0045499-chemorepellent activity | 9 | 0.92 |
4.91x10⁻⁵ |
| | GOTERM_MF_FAT | GO:0032395-MHC
class II receptor activity | 7 | 0.71 |
6.67x10⁻⁵ |
| | KEGG_PATHWAY |
hsa05150-Staphylococcus aureus
infection | 22 | 2.24 |
2.69x10⁻¹² |
| | KEGG_PATHWAY | hsa04514-cell
adhesion molecules (CAMs) | 32 | 3.26 |
5.4x10⁻¹⁰ |
| | KEGG_PATHWAY |
hsa04142-lysosome | 25 | 2.55 |
3.45x10⁻⁷ |
| | KEGG_PATHWAY |
hsa04145-phagosome | 28 | 2.85 |
7.55x10⁻⁷ |
| | KEGG_PATHWAY |
hsa05140-leishmaniasis | 16 | 1.63 |
2.57x10⁻⁵ |
| Downregulated | GOTERM_BP_FAT |
GO:0040011-locomotion | 81 | 20.10 |
4.96x10⁻¹³ |
| | GOTERM_BP_FAT | GO:0016477-cell
migration | 69 | 17.12 |
5.67x10⁻¹³ |
| | GOTERM_BP_FAT | GO:0048870-cell
motility | 74 | 18.36 |
6.35x10⁻¹³ |
| | GOTERM_BP_FAT |
GO:0051674-localization of cell | 74 | 18.36 |
6.35x10⁻¹³ |
| | GOTERM_BP_FAT |
GO:0072359-circulatory system
development | 60 | 14.89 |
8.12x10⁻¹³ |
| | GOTERM_CC_FAT |
GO:0005615-extracellular space | 83 | 20.60 |
5.27x10⁻¹⁵ |
| | GOTERM_CC_FAT |
GO:0031012-extracellular matrix | 44 | 10.92 |
5.55x10⁻¹³ |
| | GOTERM_CC_FAT |
GO:0005576-extracellular region | 169 | 41.94 |
1.45x10⁻¹² |
| | GOTERM_CC_FAT |
GO:0005578-proteinaceous extracellular
matrix | 34 | 8.44 |
1.42x10⁻¹¹ |
| | GOTERM_CC_FAT |
GO:0044421-extracellular region part | 143 | 35.48 |
2.47x10⁻¹⁰ |
| | GOTERM_MF_FAT | GO:0005102-receptor
binding | 67 | 16.63 |
1.15x10⁻⁸ |
| | GOTERM_MF_FAT |
GO:0005539~glycosaminoglycan binding | 21 | 5.21 |
3.56x10⁻⁸ |
| | GOTERM_MF_FAT | GO:0005509-calcium
ion binding | 38 | 9.43 |
1.35x10⁻⁶ |
| | GOTERM_MF_FAT | GO:0008201-heparin
binding | 16 | 3.97 |
2.57x10⁻⁶ |
| | GOTERM_MF_FAT |
GO:0008237-metallopeptidase activity | 17 | 4.22 |
4.86x10⁻⁶ |
| | KEGG_PATHWAY |
hsa05144-malaria | 10 | 2.48 |
3.45x10⁻⁶ |
| | KEGG_PATHWAY | hsa04024-cAMP
signaling pathway | 16 | 3.97 |
1.65x10⁻⁴ |
| | KEGG_PATHWAY |
hsa04060-cytokine-cytokine receptor
interaction | 17 | 4.22 |
2.68x10⁻⁴ |
| | KEGG_PATHWAY | hsa05200-pathways
in cancer | 23 | 5.71 |
4.45x10⁻⁴ |
| | KEGG_PATHWAY | hsa04020-calcium
signaling pathway | 14 | 3.47 |
6.81x10⁻⁴ |
Module screening from the PPI
network
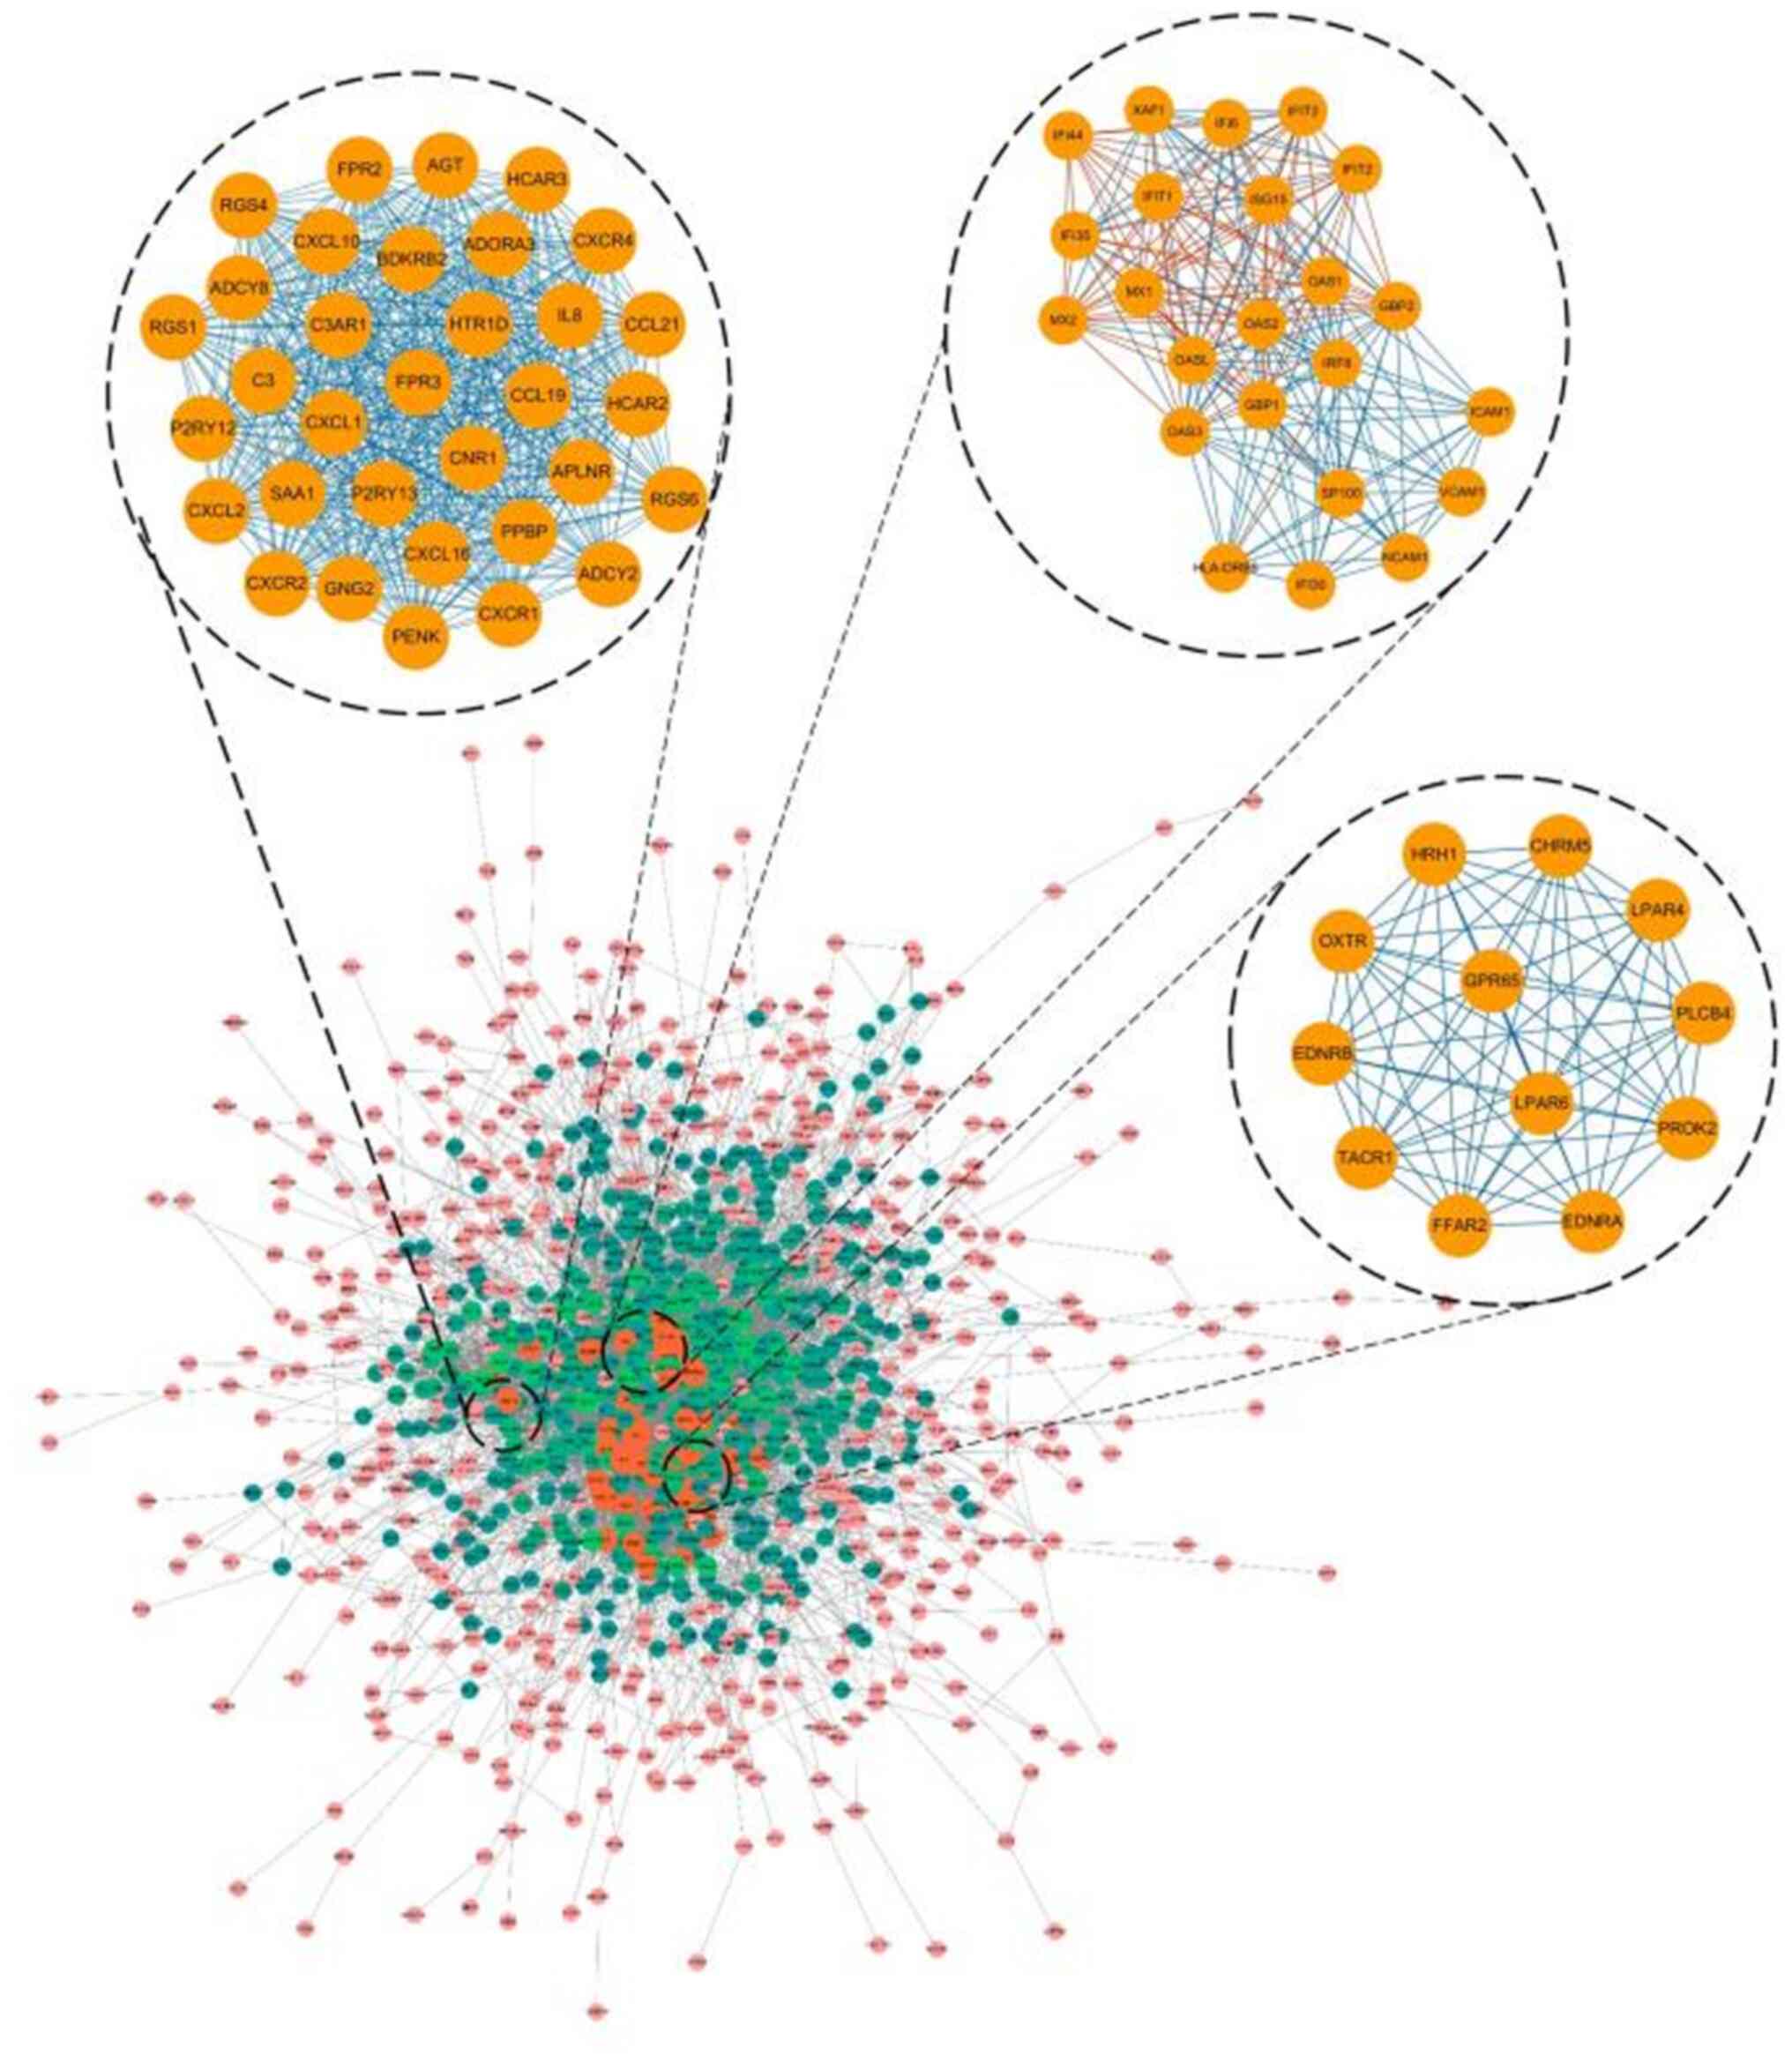
The previous 1386 mutual DEGs among the three
datasets were analyzed using PPI network, and the hub genes were
screened with degrees ≥50 based on the STRING database. Altogether,
20 genes were identified as hub genes, which were listed in
Table II, including EGFR, ITGA2,
AGT, IL6, CDH1, BCL2, IL8, ICAM1, ERBB2, CCND1, MET, CAT, CXCL10,
GNG2, SAA1, VCAM1, PPARG, ARC3 and TLR2. Among the aforementioned
genes, EGFR showed the highest degree, which was 120. The top three
significant modules were selected and shown in Fig. 4. Functional annotation of the module
genes is shown in Table III. The
genes of module 1 were associated with cellular structure,
including G-protein coupled with receptor signaling pathway,
inflammatory response and chemokine-mediated signaling pathway.
Genes of module 2 were associated with type I interferon signaling
pathway, interferon-γ-mediated signaling pathway and defense
response to virus. Genes of module 3 were associated with type I
interferon signaling pathway, interferon-γ-mediated signaling
pathway and defense response to virus.
| Table IIDetailed information of the hub genes
among three datasets. |
Table II
Detailed information of the hub genes
among three datasets.
| Gene symbol | Degree | Betweenness
Centrality |
|---|
| EGFR | 120 | 0.10487979 |
| ITGA2 | 104 | 0.08396193 |
| AGT | 89 | 0.040633 |
| IL6 | 84 | 0.04045457 |
| CDH1 | 80 | 0.04385459 |
| BCL2 | 80 | 0.04821594 |
| IL8 | 79 | 0.0255738 |
| ICAM1 | 78 | 0.02813842 |
| ERBB2 | 71 | 0.02459344 |
| CCND1 | 65 | 0.03077167 |
| MET | 60 | 0.03282732 |
| CAT | 55 | 0.04106918 |
| CXCL10 | 54 | 0.00806233 |
| GNG2 | 53 | 0.00652289 |
| SAA1 | 53 | 0.00540032 |
| VCAM1 | 52 | 0.01110284 |
| PPARG | 51 | 0.02454711 |
| AR | 50 | 0.02629149 |
| C3 | 50 | 0.01353721 |
| TLR2 | 50 | 0.01524084 |
| Table IIIFunctional and pathway enrichment
analysis of the module's genes. |
Table III
Functional and pathway enrichment
analysis of the module's genes.
| Modules | Term | Count | % | P-value | Genes |
|---|
| 1 | G-protein coupled
receptor signaling pathway (BP) | 20 | 62.50 |
4.31x10⁻¹⁷ | CXCL1, C3AR1, C3,
CXCL2, CXCR1, CCL19, FPR2, BDKRB2, CXCL10, P2RY12, APLNR, RGS1,
PPBP, CXCR4, CCL21, AGT, RGS6, GNG2, HCAR3, HCAR2 |
| | Inflammatory
response (BP) | 14 | 43.75 |
4.60x10⁻¹⁴ | CXCL1, C3AR1, C3,
CXCL2, CXCR1, CCL19, CXCR2, FPR3, BDKRB2, FPR2, CXCL10, PPBP,
CCL21, CXCR4 |
| | Chemokine-mediated
signaling pathway (BP) | 9 | 28.12 |
4.97x10⁻¹³ | CXCL1, PPBP, CXCR4,
CCL21, CXCL2, CXCR1, CCL19, CXCR2, CXCL10 |
| 2 | Type I interferon
signaling pathway (BP) | 16 | 69.56 |
1.47x10⁻³² | SP100, OAS3, OAS1,
OAS2, IFI35, IFIT3, IFIT2, OASL, IFIT1, ISG15, IRF8, XAF1, MX1,
MX2, GBP2, IFI6 |
| |
Interferon-γ-mediated signaling pathway
(BP) | 13 | 56.52 |
7.65x10⁻²⁴ | NCAM1, VCAM1,
ICAM1, OASL, SP100, IRF8, OAS3, HLA-DRB5, IFI30, OAS1, OAS2, GBP2,
GBP1 |
| | Defense response to
virus (BP) | 11 | 47.82 |
3.69x10⁻¹⁵ | IFIT3, IFIT2,
IFIT1, OASL, ISG15, OAS3, OAS1, OAS2, MX1, MX2, GBP1 |
| 3 | Type I interferon
signaling pathway (BP) | 16 | 69.56 |
1.47x10⁻³² | SP100, OAS3, OAS1,
OAS2, IFI35, IFIT3, IFIT2, OASL, IFIT1, ISG15, IRF8, XAF1, MX1,
MX2, GBP2, IFI6 |
| |
Interferon-γ-mediated signaling pathway
(BP) | 13 | 56.52 |
7.65x10⁻²⁴ | NCAM1, VCAM1,
ICAM1, OASL, SP100, IRF8, OAS3, HLA-DRB5, IFI30, OAS1, OAS2, GBP2,
GBP1 |
| | Defense response to
virus (BP) | 11 | 47.82 |
3.69x10⁻¹⁵ | IFIT3, IFIT2,
IFIT1, OASL, ISG15, OAS3, OAS1, OAS2, MX1, MX2, GBP1 |
Validation of common hub genes by
RT-qPCR
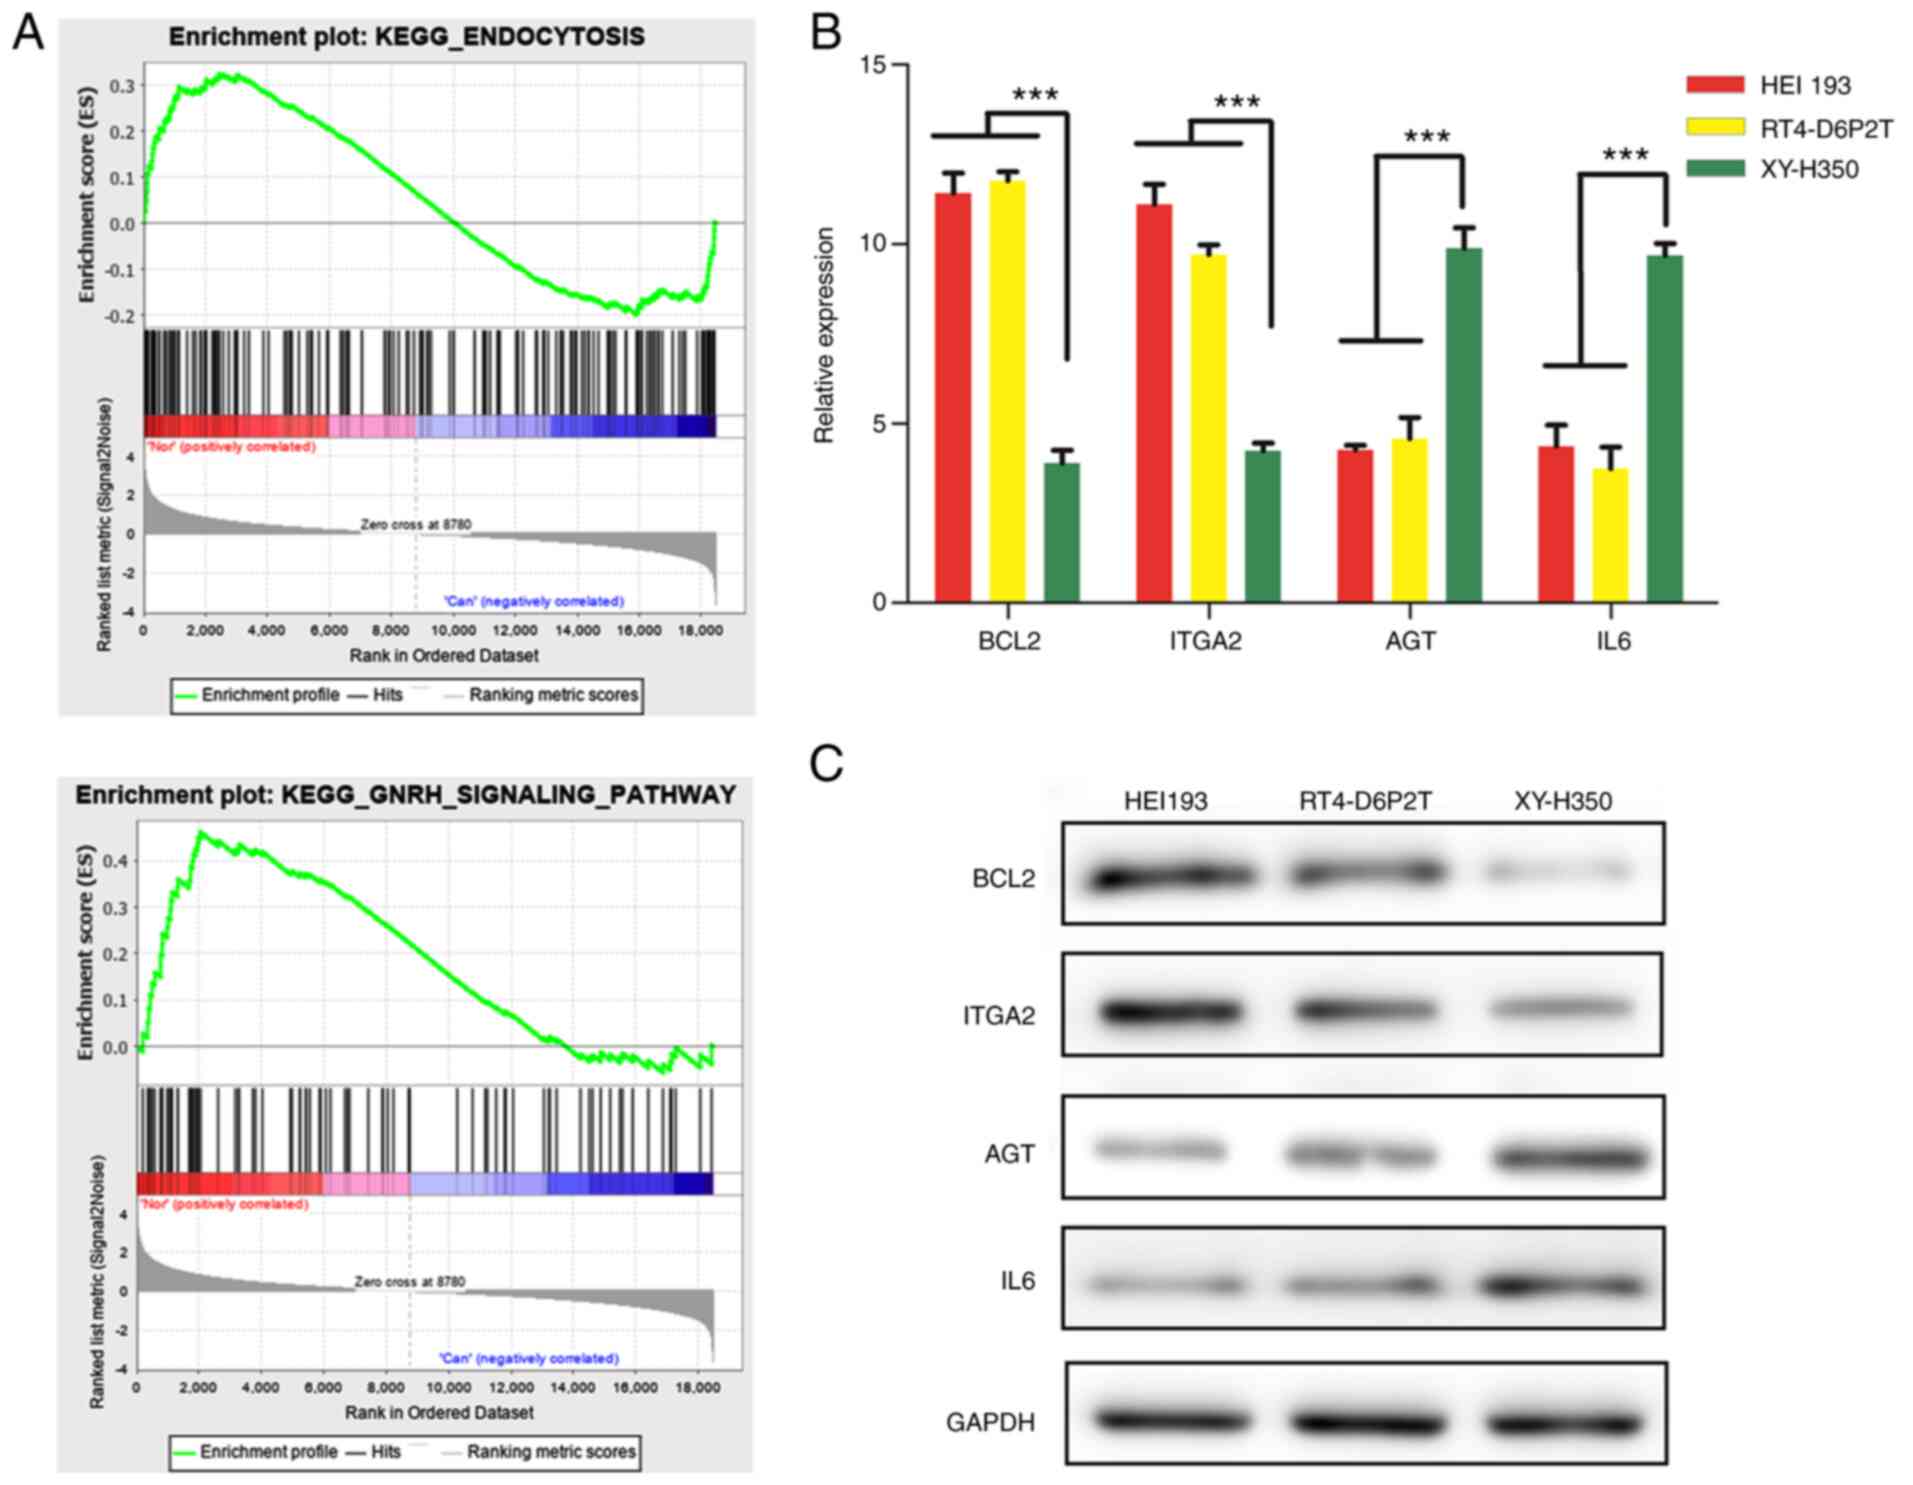
To validate the expression of BCL2, AGT, IL6, and
ITGA2 in human schwannoma cells, RT-qPCR was performed. Fig. 3B showed significant differences in
the expression levels of these genes among human Schwann cells,
RT4-D6P2T cell line and HEI193 cell line. BCL2 and ITGA2 genes were
consistently expressed higher in RT4-D6P2T cells and HEI193 cells
compared with normal Schwann cells (P<0.05). AGT and IL6, on the
contrary, showed lower expression in schwannoma cell lines with
human Schwann cells. Moreover, among the schwannoma cell lines, the
levels of expression of the BCL2, AGT, IL6, and ITGA2 genes were
slightly different.
Further confirmation of common hub
genes by western blotting
Western blot analysis was conducted to verify the
expression of BCL2, AGT, IL6 and ITGA2 in human Schwann cells,
RT4-D6P2T cell line and HEI193 cell line. As presented in Fig. 3C, the protein levels of BCL2 and
ITGA2 was distinctly expressed higher in RT4-D6P2T cells and HEI193
cells compared with normal Schwann cells, while AGT and IL6 had
lower expression in schwannoma cell lines compared with human
Schwann cells. The result of western blotting analysis was
consistent with the RT-qPCR result.
Discussion
VS is a product of the cumulative genetic,
epigenetic, somatic and endocrine aberrations. Despite advances in
treatment methods, including surgical resection, stereotactic
radiotherapy and long-term follow-up observation, the prognosis of
VS remained poor over the past decades, mainly due to the lack of
effective diagnosis and therapy (13). Therefore, to comprehensively
perceive the molecular mechanisms, etiological factors and
pathogenesis of VS is vital for the improvement of diagnosis,
therapy and prognosis. Recently, microarray technology has been
developed rapidly and widely used to reveal the general genetic
alteration in the progression of disease, which enables the
identification of targets for diagnosis, therapeutic and prognosis
of tumors.
In the present study, 49 VS samples and 31 formal
samples were extracted from mRNA microarray dataset GSE39645,
GSE454934 and GSE56597 for gene expression data. A total of 1,088
DEGs, 1,744 DEGs and 983 DEGs were identified respectively. A total
of 1,386 mutual DEGs among the three datasets were identified by
Venn plot. Cumulative evidences proved that these DEGs were
expressed abnormally and, significantly, and played an important
role in the pathogenesis of VS, which could be used as diagnosis,
treatment and prognosis markers in the future. In order to better
perceive the interactions of DEGs, GO and KEGG pathway analysis
were further performed.
Based on GO analysis of abnormal expression genes,
the upregulated genes were mainly associated with hyperplasia,
including axon development, cell adhesion, cytoskeletal protein
binding, molecular function regulator and MHC class II receptor
activity, which were associated with cancer. The downregulated
genes were primarily enriched in biological information transfer,
such as cell migration, cell motility, circulatory system
development, calcium ion binding and extracellular region part. The
communication between cells and its surrounding environment is
bidirectional.
Microenvironments have been shown to be important
for normal tissue homeostasis and tumor tissue growth. The
interaction of Schwann cells and axons with the surrounding cells
is one of the key factors in schwannoma, which is consistent with
the result of the GO analysis. In addition, schwannoma is closely
associated with the abnormity of macrophage, indicating that
anti-inflammatory therapy may be with potential curative effect of
schwannoma (14).
Furthermore, the results of KEGG analysis revealed
that the mutual up- and downregulated DEGs were mainly enriched in
cell adhesion molecules (CAMs), phagosome and cAMP signaling
pathway. CAMs not only play an important role in normal tissue
growth and development, participating in proliferation and
differentiation, signal transduction of cells, but also in the
biological behavior of tumor tissues, participating in the
occurrence, invasion and metastasis of tumor. Neural cell adhesion
molecule (NCAM) is a marker of Schwann cells. Some studies have
shown that NCAM was overexpressed in Schwann cells of patients with
VS. The degree of CAM expression can help us distinguish between
benign and malignant schwannomas (15). E-cadherin is a calcium-dependent
CAM, which is an essential protein for metastasis of multiple
models of breast cancer and a lack of E-cadherin can induce
apoptosis of cells (16).
E-cadherin is expressed in some schwannomas, especially in VS
(14). Therefore, it was speculated
that E-cadherin is closely associated with the metastasis of tumor
cells in VS, and molecular strategies to inhibit
E-cadherin-mediated tumor cell metastasis may have potential effect
in the treatment of VS. Phagosome promotes immunosuppression
through induction of macrophages with increasing expression of
PD-L1(17). A study has shown that
PD-L1 is highly expressed in cells of VS, and adaptive resistance
to cellular immunity plays an important role in tumor immune
microenvironment of schwannoma (18). Therefore, it is postulated that
immunotherapy is expected to be a new treatment method for VS.
Aims to screen hub genes among DEGs were identified
in previous studies, therefore, mutual DEGs were analyzed with PPI
network based on the STRING database, and 20 genes were selected
with high degrees, such as BCL2, AGT, IL6 and ITGA2.
BCL2, an apoptosis regulator, located in chromosome
1q42.2, the epigenetic inactivation of which was caused by promoter
hypermethylation may lead to mutations in K-ras and p53, a critical
process that initiates tumorigenesis (19). A study by Ni et al (20) proved that co-overexpression of VEGF
and Bcl-2 inhibits the oxygen and glucose deprivation, inducing the
apoptosis of mesenchymal stem cells. Edison et al (21) reported that the mutation of BCL2
increased stability and was more potent in the protection against
apoptosis. It has also been reported that BCL2 is associated with
certain malignancies including gastrin, hepatocellular carcinoma,
salivary adenoid cystic carcinoma, and diffuse large B cell
lymphoma (22). In addition, it was
demonstrated that BCL2 is associated with the migration and
invasion of human osteosarcoma and breast cancer, therefore, this
could be a significant marker for tumor aggressiveness (12,23-26).
Furthermore, it has been reported that bufalin synergized with AKT
inhibitor LY294002 to induce the apoptosis of lung cancer A549
cells, which was associated with the upregulation of the
downregulation of BCL2, which indicates that BCL2 is a potential
therapeutic target for VS, and bufalin may be a potential treatment
regimen (27).
AGT, encoding angiotensinogen and
angiotensin-(1-7)
plays a role in metabolic pathways associated with cell death and
cell survival in human endothelial cells. As a vital progenitor,
the augmented AGT accelerated vascular remodeling. It is
universally known that the circulation via blood vessels is a
significant process in tumor metastasis (28-30).
AGT is markedly associated with the initiation and progression of
brain, lung, ovary and renal cell cancer (31,32).
In addition, the serum AGT is also associated with the prognosis of
metastatic colorectal cancer (33).
IL6, located on chromosome 7p15.3, as a pleiotropic
cytokine, plays an important role in immune regulation,
hematopoiesis, inflammation and oncogenesis, and controls the
survival, growth, differentiation and effector function of tissues
and cells, and functions in inflammation and maturation of B cells.
It was reported that Il-6 is associated with various malignancies
including melanoma, breast cancer, gastric cancer, colorectal
cancer and prostate cancer (34).
IL6 enhances tumorigenesis, promotes melanoma progression and
strengthens tumorigenic capabilities (35-39).
Furthermore, it is a diagnostic biomarker for gastric cancer and a
prognostic biomarker in metastatic colorectal cancer (40). In addition, the biological
mechanisms of IL-6 in acoustic neuroma were reported to be
associated with the stimulation of cellular proliferation, and may
be the potential therapeutic targets in VS (41,42).
ITGA2 is located on chromosome 5q11.2. As a part of
cell-matrix adhesion, ITGA2 interacts selectively and
non-covalently with amyloid-β peptide/protein and/or its precursor.
ITGA2 is the attachment for a cell, either to another cell or to an
underlying substrate such as the extracellular matrix, via an
integrin, a heterodimeric adhesion receptor formed by the
non-covalent association of particular α and β subunits. It is
known that the movement of normal cells is also controlled by
contact inhibition, which largely depends on adhesion molecules
such as integrins that prevents aberrant cell migration (43). ITGA2 has been pointed that it is
associated with the occurrence, development and metastasis of
breast cancer, nasopharyngeal carcinoma, primary colon tumors,
cervical cancer and liver cancer. It also has been reported that it
might be a therapeutic target for gastric cancer and osteosarcoma.
Besides, ITGA2 may be a prognosis biomarker for breast cancer
patients. All types of evidence suggest that in the early process
of cancer metastasis, ITGA2 reduction helps cancer cells to detach
the primary cancer and in late phase cancer, ITGA2 recovery helps
cancer cells to locate in lymph node and distant organs (44-48).
Aiming to verify the results of bioinformatics
analysis, RT-qPCR and western blot analysis of the aforementioned
hub genes were performed. The results indicated that expression
levels of BCL2 and ITGA2 in schwannoma samples were significantly
higher compared with normal Schwann cells (P<0.05), while AGT
and IL6 were expressed lower in schwannoma cell lines compared with
normal Schwann cells, which is consistent with DEG identification
and heatmaps. In addition BCL2, AGT, IL6 and ITGA2 were revealed in
VS for the first time, which provides verification of the
associations among these genes and VS for further investigations.
The other hub genes also mean precise diagnosis biomarkers,
potential treatment targets, and prognosis markers for patients
with VS, as well as DEGs.
The functional annotation and enrichment of module
genes were also performed, and enriched function analysis and it
revealed that genes in module 1 were primarily associated with
inflammatory response, chemokine-mediated signaling pathway and
G-protein coupled with receptor signaling pathway. Inflammatory
response is closely associated with tumor, studies have proved that
inflammatory environment affects gastric cancer initiation and
metastasis via epithelial-mesenchymal transition (49). Tumor-associated inflammation can
promote tumorigenesis and metastasis through angiogenesis and
metastasis, which also turn reduced the sensitivity of tumor to
chemotherapy drugs. The genes of modules 2 and 3 were associated
with type I interferon signaling pathway, interferon-γ-mediated
signaling pathway and defense response to virus. Type I interferon
is significant for defense against viruses via the induction of
antiviral effector molecules that are encoded by IFN-stimulated
genes (50). Due to the
immunosuppressive state of patients with schwannoma (51), T-lymphocytes-secreted interferon is
decreased, which is conducive to the growth and reproduction of
tumor cells and reduces the resistance to virus (52). Insufficient secretion of interferon
is highly susceptible to virus infection (53).
Conclusion. A total of 4,025, 11,291 and
1,513 DEGs were identified from GSE54934, GSE56597 and GSE39645
datasets, respectively, and there are 1,386 mutual DEGs among these
three datasets. The GO and KEGG analysis showed that enriched
functions and pathways in upregulated genes are mainly associated
with cell division, mitotic nuclear division, transition of mitotic
cell cycle, microtubule, and microtubule motor activity, while
downregulated genes tend to enrich in biological information
transfer, including chemical synaptic transmission,
neurotransmitter transport, synaptic vesicle membrane, GABA-A
receptor activity and calcium ion binding. BCL2, AGT, IL6 and ITGA2
were screened as main hub genes, among which BCL2 and ITGA2 were
significantly higher expressed in VS cells compared with human
normal glial cells, while the expression of AGT and IL6 was lower
in VS cells compared with human normal glial cells. In addition,
the present study provided the mechanisms and molecules that were
involved in the interaction between tumor microenvironment and
inflammatory response, which may be targets for anticancer
interventions.
Supplementary Material
Venn plot analysis results of
differentially expressed genes amongst three datasets.
Acknowledgements
Not applicable.
Funding
Funding: This study was supported by grants from the National
Natural Science Foundation of China (grant nos. 81672505 and
81772684), the S&T Development Planning Program of Jilin
Province (grant nos. 20160101086JC, 20160312017ZG and
20180101152JC), the Jilin Provincial Education Department ‘13th
Five-Year’ Science and Technology Project (grant no.
JJKH20180191KJ) and the Interdisciplinary Innovation Project of The
First Hospital of Jilin University (grant no. JDYYJC001).
Availability of data and materials
The datasets generated and/or analyzed during the
current study are available in the Gene Ontology (GO), Kyoto
Encyclopedia of Genes and Genomes (KEGG), protein-protein
interaction (PPI) repository, Gene Expression Omnibus (GEO,
http://www.ncbi.nlm.nih.gov/geo)
database of National Center of Biotechnology Information (NCBI)
(http://www.ncbi.nlm.nih.gov/geo/) and
The Database for Annotation, Visualization and Integrated Discovery
(DAVID; http://david.abcc.ncifcrf.gov/). Specific datasets
were obtainted from GEO (GSE54934, https://www.ncbi.nlm.nih.gov/geo/query/acc.cgi?acc=GSE54934;
GSE39645, https://www.ncbi.nlm.nih.gov/geo/query/acc.cgi?acc=GSE39645;
GSE56597, https://www.ncbi.nlm.nih.gov/geo/query/acc.cgi?acc=GSE56597).
Authors' contributions
BW and GD designed the experiments, planned the
experiment flow and revised the manuscript. YZ and JW wrote the
manuscript, consulted literature, screened the raw data and
performed the Venn diagram analysis. JR and XW performed GO and
KEGG analysis. SJ and SZ conducted heat map analysis and PPI
network analysis. ZZ, CS and JL analyzed the data and collated the
data into figures and tables. GZ analyzed sequencing data. LZ
revised the manuscript, tables and figures, and performed western
blot analysis and revised it critically for important intellectual
content. All authors read and approved the final manuscript. YZ and
JW confirm the authenticity of all the raw data.
Ethics approval and consent to
participate
Not applicable.
Patient consent for publication
Not applicable.
Competing interests
The authors declare that they have no competing
interests.
References
|
1
|
Ramaswamy AT and Golub JS: Management of
vestibular schwannomas for the radiologist. Neuroimaging Clin N Am.
29:173–182. 2019.PubMed/NCBI View Article : Google Scholar
|
|
2
|
Mahaley MS Jr, Mettlin C, Natarajan N,
Laws ER Jr and Peace BB: Analysis of patterns of care of brain
tumor patients in the United States: A study of the brain tumor
section of the AANS and the CNS and the commission on cancer of the
ACS. Clin Neurosurg. 36:347–352. 1990.PubMed/NCBI
|
|
3
|
Basu S, Youngs R and Mitchell-Innes A:
Screening for vestibular schwannoma in the context of an ageing
population. J Laryngol Otol. 133:640–649. 2019.PubMed/NCBI View Article : Google Scholar
|
|
4
|
Kaul V and Cosetti MK: Management of
vestibular schwannoma (Including NF2): Facial nerve considerations.
Otolaryng Clin North Am. 51:1193–1212. 2018.PubMed/NCBI View Article : Google Scholar
|
|
5
|
Martini A, Marioni G, Zanoletti E,
Cappellesso R, Stramare R, Fasanaro E, Faccioli C, Giacomelli L,
Denaro L, D'Avella D, et al: YAP, TAZ and AREG expression in eighth
cranial nerve schwannoma. Int J Biol Markers. 32:e319–e324.
2017.PubMed/NCBI View Article : Google Scholar
|
|
6
|
Zhang Z, Wang Z, Sun L, Li X, Huang Q,
Yang T and Wu H: Mutation spectrum and differential gene expression
in cystic and solid vestibular schwannoma. Genet Med. 16:264–270.
2014.PubMed/NCBI View Article : Google Scholar
|
|
7
|
Torres-Martin M, Lassaletta L, Isla A, De
Campos JM, Pinto GR, Burbano RR, Castresana JS, Melendez B and Rey
JA: Global expression profile in low grade meningiomas and
schwannomas shows upregulation of PDGFD, CDH1 and SLIT2 compared to
their healthy tissue. Oncol Rep. 32:2327–2334. 2014.PubMed/NCBI View Article : Google Scholar
|
|
8
|
Torres-Martin M, Lassaletta L,
San-Roman-Montero J, De Campos JM, Isla A, Gavilan J, Melendez B,
Pinto GR, Burbano RR, Castresana JS and Rey JA: Microarray analysis
of gene expression in vestibular schwannomas reveals SPP1/MET
signaling pathway and androgen receptor deregulation. Int J Oncol.
42:848–862. 2013.PubMed/NCBI View Article : Google Scholar
|
|
9
|
Torres-Martín M, Lassaletta L, de Campos
JM, Isla A, Pinto GR, Burbano RR, Melendez B, Castresana JS and Rey
JA: Genome-wide methylation analysis in vestibular schwannomas
shows putative mechanisms of gene expression modulation and global
hypomethylation at the HOX gene cluster. Genes Chromosomes Cancer.
54:197–209. 2015.PubMed/NCBI View Article : Google Scholar
|
|
10
|
Shannon P, Markiel A, Ozier O, Baliga NS,
Wang JT, Ramage D, Amin N, Schwikowski B and Ideker T: Cytoscape: A
software environment for integrated models of biomolecular
interaction networks. Genome Res. 13:2498–2504. 2003.PubMed/NCBI View Article : Google Scholar
|
|
11
|
Otasek D, Morris JH, Bouças J, Pico AR and
Demchak B: Cytoscape automation: Empowering workflow-based network
analysis. Genome Biol. 20(185)2019.PubMed/NCBI View Article : Google Scholar
|
|
12
|
Leng J, Song Q, Zhao Y and Wang Z: miR-15a
represses cancer cell migration and invasion under conditions of
hypoxia by targeting and downregulating Bcl2 expression in human
osteosarcoma cells. Int J Oncol. 52:1095–1104. 2018.PubMed/NCBI View Article : Google Scholar
|
|
13
|
Mehrian-Shai R, Freedman S, Shams S,
Doherty J, Slattery W, Hsu NY, Reichardt JK, Andalibi A and Toren
A: Schwannomas exhibit distinct size-dependent gene-expression
patterns. Future Oncol. 11:1751–1758. 2015.PubMed/NCBI View Article : Google Scholar
|
|
14
|
Schulz A, Büttner R, Hagel C, Baader SL,
Kluwe L, Salamon J, Mautner VF, Mindos T, Parkinson DB, Gehlhausen
JR, et al: The importance of nerve microenvironment for schwannoma
development. Acta Neuropathol. 132:289–307. 2016.PubMed/NCBI View Article : Google Scholar
|
|
15
|
Roche PH, Figarella-Branger D, Daniel L,
Bianco N, Pellet W and Pellissier JF: Expression of cell adhesion
molecules in normal nerves, chronic axonal neuropathies and Schwann
cell tumors. J Neurol Sci. 151:127–133. 1997.PubMed/NCBI View Article : Google Scholar
|
|
16
|
Padmanaban V, Krol I, Suhail Y, Szczerba
BM, Aceto N, Bader JS and Ewald AJ: E-cadherin is required for
metastasis in multiple models of breast cancer. Nature.
573:439–444. 2019.PubMed/NCBI View Article : Google Scholar
|
|
17
|
Wen ZF, Liu H, Gao R, Zhou M, Ma J, Zhang
Y, Zhao J, Chen Y, Zhang T, Huang F, et al: Tumor cell-released
autophagosomes (TRAPs) promote immunosuppression through induction
of M2-like macrophages with increased expression of PD-L1. J
Immunother Cancer. 6(151)2018.PubMed/NCBI View Article : Google Scholar
|
|
18
|
Wang S, Liechty B, Patel S, Weber JS,
Hollmann TJ, Snuderl M and Karajannis MA: Programmed death ligand 1
expression and tumor infiltrating lymphocytes in neurofibromatosi
type 1 and 2 associated tumors. J Neurooncol. 138:183–190.
2018.PubMed/NCBI View Article : Google Scholar
|
|
19
|
Liang B, Li C and Zhao J: Identification
of key pathways and genes in colorectal cancer using bioinformatics
analysis. Med Oncol. 33(111)2016.PubMed/NCBI View Article : Google Scholar
|
|
20
|
Ni X, Ou C, Guo J, Liu B, Zhang J, Wu Z,
Li H and Chen M: Lentiviral vector-mediated co-overexpression of
VEGF and Bcl-2 improves mesenchymal stem cell survival and enhances
paracrine effects in vitro. Int J Mol Med. 40:418–426.
2017.PubMed/NCBI View Article : Google Scholar
|
|
21
|
Edison N, Curtz Y, Paland N, Mamriev D,
Chorubczyk N, Haviv-Reingewertz T, Kfir N, Morgenstern D,
Kupervaser M, Kagan J, et al: Degradation of Bcl-2 by XIAP and ARTS
promotes apoptosis. Cell Rep. 21:442–454. 2017.PubMed/NCBI View Article : Google Scholar
|
|
22
|
Ozretic P, Alvir I, Sarcevic B, Vujaskovic
Z, Rendic-Miocevic Z, Roguljic A and Beketic-Oreskovic L: Apoptosis
regulator Bcl-2 is an independent prognostic marker for worse
overall survival in triple-negative breast cancer patients. Int J
Biol Markers. 33:109–115. 2018.PubMed/NCBI View Article : Google Scholar
|
|
23
|
Yan F, Wang C, Li T, Cai W and Sun J: Role
of miR-21 in the growth and metastasis of human salivary adenoid
cystic carcinoma. Mol Med Rep. 17:4237–4244. 2018.PubMed/NCBI View Article : Google Scholar
|
|
24
|
Butler MJ and Aguiar RCT: Biology informs
treatment choices in diffuse large B cell lymphoma. Trends Cancer.
3:871–882. 2017.PubMed/NCBI View Article : Google Scholar
|
|
25
|
Feng L, Zhu J, Sun W, Zhao J and Liu Y:
Expressions of gastrin and apoptosis-associated proteins involved
in mitochondrial pathway in gastric cancer tissues and the clinical
significance. Xi Bao Yu Fen Zi Mian Yi Xue Za Zhi. 33:1557–1561.
2017.PubMed/NCBI(In Chinese).
|
|
26
|
You ML, Chen YJ, Chong QY, Wu MM, Pandey
V, Chen RM, Liu L, Ma L, Wu ZS, Zhu T and Lobie PE: Trefoil factor
3 mediation of oncogenicity and chemoresistance in hepatocellular
carcinoma is AKT-BCL-2 dependent. Oncotarget. 8:39323–39344.
2017.PubMed/NCBI View Article : Google Scholar
|
|
27
|
Liu F, Tong D, Li H, Liu M, Li J, Wang Z
and Cheng X: Bufalin enhances antitumor effect of paclitaxel on
cervical tumorigenesis via inhibiting the integrin α2/β5/FAK
signaling pathway. Oncotarget. 7:8896–8907. 2016.PubMed/NCBI View Article : Google Scholar
|
|
28
|
Sato Y, Kubo T, Morimoto K, Yanagihara K
and Seyama T: High mannose-binding Pseudomonas fluorescens lectin
(PFL) downregulates cell surface integrin/EGFR and induces
autophagy in gastric cancer cells. BMC Cancer.
16(63)2016.PubMed/NCBI View Article : Google Scholar
|
|
29
|
Wu SJ, Soulez M, Yang YH, Chu CS, Shih SC,
Hebert MJ, Kuo MC and Hsieh YJ: Local augmented angiotensinogen
secreted from apoptotic vascular endothelial cells is a vital
mediator of vascular remodelling. PLoS One.
10(e0132583)2015.PubMed/NCBI View Article : Google Scholar
|
|
30
|
Meinert C, Gembardt F, Bohme I, Tetzner A,
Wieland T, Greenberg B and Walther T: Identification of
intracellular proteins and signaling pathways in human endothelial
cells regulated by angiotensin-(1-7). J Proteomics. 130:129–139.
2016.PubMed/NCBI View Article : Google Scholar
|
|
31
|
Citron M, Decker R, Chen S, Schneider S,
Graver M, Kleynerman L, Kahn LB, White A, Schoenhaus M and Yarosh
D: O6-methylguanine-DNA methyltransferase in human normal and tumor
tissue from brain, lung, and ovary. Cancer Res. 51:4131–4134.
1991.PubMed/NCBI
|
|
32
|
Deckers IA, van den Brandt PA, van
Engeland M, van Schooten FJ, Godschalk RW, Keszei AP and Schouten
LJ: Polymorphisms in genes of the renin-angiotensin-aldosterone
system and renal cell cancer risk: Interplay with hypertension and
intakes of sodium, potassium and fluid. Int J Cancer.
136:1104–1116. 2015.PubMed/NCBI View Article : Google Scholar
|
|
33
|
Martin P, Noonan S, Mullen MP, Scaife C,
Tosetto M, Nolan B, Wynne K, Hyland J, Sheahan K, Elia G, et al:
Predicting response to vascular endothelial growth factor inhibitor
and chemotherapy in metastatic colorectal cancer. BMC Cancer.
14(887)2014.PubMed/NCBI View Article : Google Scholar
|
|
34
|
Deng G, Kakar S, Okudiara K, Choi E,
Sleisenger MH and Kim YS: Unique methylation pattern of oncostatin
m receptor gene in cancers of colorectum and other digestive
organs. Clin Cancer Res. 15:1519–1526. 2009.PubMed/NCBI View Article : Google Scholar
|
|
35
|
Sameni M, Cavallo-Medved D, Franco OE,
Chalasani A, Ji K, Aggarwal N, Anbalagan A, Chen X, Mattingly RR,
Hayward SW and Sloane BF: Pathomimetic avatars reveal divergent
roles of microenvironment in invasive transition of ductal
carcinoma in situ. Breast Cancer Res. 19(56)2017.PubMed/NCBI View Article : Google Scholar
|
|
36
|
Chen C and Zhang X: IRE1α-XBP1 pathway
promotes melanoma progression by regulating IL-6/STAT3 signaling. J
Transl Med. 15(42)2017.PubMed/NCBI View Article : Google Scholar
|
|
37
|
Ortiz-Montero P, Londono-Vallejo A and
Vernot JP: Senescence-associated IL-6 and IL-8 cytokines induce a
self- and cross-reinforced senescence/inflammatory milieu
strengthening tumorigenic capabilities in the MCF-7 breast cancer
cell line. Cell Commun Signal. 15(17)2017.PubMed/NCBI View Article : Google Scholar
|
|
38
|
Zhou J, Zhang C, Pan J, Chen L and Qi ST:
Interleukin6 induces an epithelialmesenchymal transition phenotype
in human adamantinomatous craniopharyngioma cells and promotes
tumor cell migration. Mol Med Rep. 15:4123–4131. 2017.PubMed/NCBI View Article : Google Scholar
|
|
39
|
Albino D, Civenni G, Rossi S, Mitra A,
Catapano CV and Carbone GM: The ETS factor ESE3/EHF represses IL-6
preventing STAT3 activation and expansion of the prostate cancer
stem-like compartment. Oncotarget. 7:76756–76768. 2016.PubMed/NCBI View Article : Google Scholar
|
|
40
|
Thomsen M, Kersten C, Sorbye H, Skovlund
E, Glimelius B, Pfeiffer P, Johansen JS, Kure EH, Ikdahl T, Tveit
KM, et al: Interleukin-6 and C-reactive protein as prognostic
biomarkers in metastatic colorectal cancer. Oncotarget.
7:75013–75022. 2016.PubMed/NCBI View Article : Google Scholar
|
|
41
|
Adams EF, Rafferty B, Mower J, Ward H,
Petersen B and Fahlbusch R: Human acoustic neuromas secrete
interleukin-6 in cell culture: Possible autocrine regulation of
cell proliferation. Neurosurgery. 35:434–438. 1994.PubMed/NCBI View Article : Google Scholar
|
|
42
|
Taurone S, Bianchi E, Attanasio G, Di
Gioia C, Ierinó R, Carubbi C, Galli D, Pastore FS, Giangaspero F,
Filipo R, et al: Immunohistochemical profile of cytokines and
growth factors expressed in vestibular schwannoma and in normal
vestibular nerve tissue. Mol Med Rep. 12:737–745. 2015.PubMed/NCBI View Article : Google Scholar
|
|
43
|
Ferraro A, Boni T and Pintzas A: EZH2
regulates cofilin activity and colon cancer cell migration by
targeting ITGA2 gene. PLoS One. 9(e115276)2014.PubMed/NCBI View Article : Google Scholar
|
|
44
|
Yang Q, Bavi P, Wang JY and Roehrl MH:
Immuno-proteomic discovery of tumor tissue autoantigens identifies
olfactomedin 4, CD11b, and integrin alpha-2 as markers of
colorectal cancer with liver metastases. J Proteomics. 168:53–65.
2017.PubMed/NCBI View Article : Google Scholar
|
|
45
|
Dong J, Wang R, Ren G, Li X, Wang J, Sun
Y, Liang J, Nie Y, Wu K, Feng B, et al: HMGA2-FOXL2 axis regulates
metastases and epithelial-to-mesenchymal transition of
chemoresistant gastric cancer. Clin Cancer Res. 23:3461–3473.
2017.PubMed/NCBI View Article : Google Scholar
|
|
46
|
Ban EZ, Lye MS, Chong PP, Yap YY, Lim SYC
and Abdul Rahman H: Haplotype CGC from XPD, hOGG1 and ITGA2
polymorphisms increases the risk of nasopharyngeal carcinoma in
Malaysia. PLoS One. 12(e0187200)2017.PubMed/NCBI View Article : Google Scholar
|
|
47
|
Liu X, Liang Z, Gao K, Li H, Zhao G, Wang
S and Fang J: MicroRNA-128 inhibits EMT of human osteosarcoma cells
by directly targeting integrin α2. Tumour Biol. 37:7951–7957.
2016.PubMed/NCBI View Article : Google Scholar
|
|
48
|
Ding W, Fan XL, Xu X, Huang JZ, Xu SH,
Geng Q, Li R, Chen D and Yan GR: Epigenetic silencing of ITGA2 by
MiR-373 promotes cell migration in breast cancer. PLoS One.
10(e0135128)2015.PubMed/NCBI View Article : Google Scholar
|
|
49
|
Ma HY, Liu XZ and Liang CM: Inflammatory
microenvironment contributes to epithelial-mesenchymal transition
in gastric cancer. World J Gastroenterol. 22:6619–6628.
2016.PubMed/NCBI View Article : Google Scholar
|
|
50
|
McNab F, Mayer-Barber K, Sher A, Wack A
and O'Garra A: Type I interferons in infectious disease. Nat Rev
Immunol. 15:87–103. 2015.PubMed/NCBI View Article : Google Scholar
|
|
51
|
Wang Y, Li P, Wang B, Wang S and Liu P:
Identification of myeloid-derived suppressor cells that have an
immunosuppressive function in NF2 patients. J Cancer Res Clin
Oncol. 145:523–533. 2019.PubMed/NCBI View Article : Google Scholar
|
|
52
|
Bonetti B, Valdo P, Ossi G, De Toni L,
Masotto B, Marconi S, Rizzuto N, Nardelli E and Moretto G: T-cell
cytotoxicity of human Schwann cells: TNFalpha promotes
fasL-mediated apoptosis and IFN gamma perforin-mediated lysis.
Glia. 43:141–148. 2003.PubMed/NCBI View Article : Google Scholar
|
|
53
|
Cao L, Yang G, Gao S, Jing C, Montgomery
RR, Yin Y, Wang P, Fikrig E and You F: HIPK2 is necessary for type
I interferon-mediated antiviral immunity. Sci Signal.
12(eaau4604)2019.PubMed/NCBI View Article : Google Scholar
|