Introduction
Hyperlipidemia, a recognized risk factor for
atherosclerosis, is closely related to insulin resistance and these
two factors promote one another for the occurrence and development
of diabetes (1).
In recent years, the incidence rate of
hyperlipidemia has been increasing. In a survey on Chinese people
aged >18 years, the total prevalence of hyperlipidemia was 40.4%
(2). The study also found a
considerable proportion of people with abnormal glucose metabolism
who had not been diagnosed and treated in a timely manner among
people with hyperlipidemia who had not yet experienced
cardiovascular events, indicating that lipotoxicity is an important
factor related to insulin resistance (3).
The mechanism for insulin resistance and glucose
metabolism disorders in people with hyperlipidemia is not fully
understood. mTOR is a key component of the mTOR signaling pathway
that regulates cell growth and nutrient metabolism and is also
involved in insulin resistance, adipose tissue physiological
functions and body energy balance (4). Meanwhile, DNA damage inducible
transcript 4 (DDIT4), an mTOR inhibitor (5), has roles in insulin signal
transduction, hypoxic stress response, regulation of development
and DNA damage (6-8),
as well as a role in body metabolism. However, the relationships
between DDIT4 and mTOR expression levels and hyperlipidemia and
insulin resistance remain to be elucidated.
Several inflammatory markers are known to be related
to blood lipid levels, atherosclerosis and insulin resistance,
including IL-6, IL-1β, CRP, TNF-α, monocyte chemoattractant protein
(MCP)-1, serum amyloid A, sCD40, adhesion molecules, chemokine-16,
insulin-like growth factor, lipoprotein-associated phospholipase A2
and galectin-3, but their roles in hyperlipidemia and
atherosclerosis are not well established (9,10).
Inflammatory markers can act as independent risk factors for the
development of diabetes and have a causal relationship with insulin
resistance (11). Recent study has
shown that Stem cell growth factor-beta (SCGF-β) levels were linked
to insulin resistance and severity hepatic steatosis with the
mediation role of CRP (12).
Prediction of homeostatic model assessment (HOMA) values by SCGF-β
levels, likely mediated by markers of inflammation, sheds some
light on mechanisms inducing/worsening insulin resistance of male
patients with obesity-related nonalcoholic fatty liver disease
(NAFLD) (12). However, no studies
have clarified the relationships between the expression levels of
DDIT4 and mTOR and hyperlipidemia and the expression levels of
inflammatory factors and insulin resistance.
The present study aimed to determine the changes in
DDIT4, mTOR, inflammatory markers, circulating lipid profiles and
insulin sensitivity in subjects with hyperlipidemia and heathy
control subjects. It further sought to elucidate the relationships
among DDIT4, mTOR, blood lipids, inflammation and insulin
sensitivity and to clarify their contributions to metabolic risk
using a factor analysis.
Materials and methods
Selection of subjects
Clinical samples were obtained from the Hebei
Provincial Physical Examination Center and 55 subjects with
elevated blood lipids in the physical examination population
between May 2021 and October 2021 were randomly selected as the
hyperlipidemia group (HL group; 29 men, 26 women; age: 46.25±11.75
years). A further 55 healthy subjects matched for age and sex with
the subjects in the HL group were randomly selected as the normal
control group (CON group; 28 men, 27 women; age: 45.47±12.45
years).
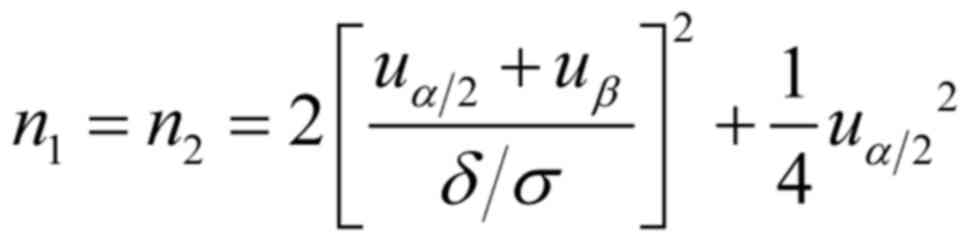
Selection basis of sample size was according to the
method of sample size estimation in the experimental design of the
comparison of two population means (the outcome indicator is
quantitative) in the simple random sampling study:
Set double test level α=0.05, β=0.15, 1-β= 0.85,
δ/σ=0.05, 55 cases in each group.
The inclusion criteria for the HL group were:
Hyperlipidemia diagnosed in accordance with the 2016 Guidelines for
the Prevention and Treatment of Dyslipidemia in Chinese Adults
(2) by elevated blood lipids
meeting at least one of total cholesterol (TC) ≥6.2 mmol/l,
triglyceride (TG) ≥2.3 mmol/l, low-density lipoprotein cholesterol
(LDL-C) ≥4.1 mmol/l or high-density lipoprotein cholesterol (HDL-C)
<1.0 mmol/l (13).
The inclusion criteria for the CON group were: No
history of chronic diseases such as hypertension and diabetes; body
mass index (BMI) 18.5-24 kg/m2; blood glucose 3.9-6.1
mmol/l; blood lipids comprising TC <5.2 mmol/l, TG <1.7
mmol/l, LDL-C <3.4 mmol/l.
The exclusion criteria were: Dysfunction or
abnormality of the heart, liver, kidney, or thyroid, combined with
hypertension, diabetes, blood system diseases, mental diseases,
acute and chronic infectious diseases, autoimmune diseases and
tumor history; receipt of drugs, hormones and immunosuppressants
that affect insulin sensitivity, or hypoglycemic, lipid-lowering
and antihypertensive drugs within previous six months; pregnancy,
lactation, or long-term oral contraceptive use; and recent surgical
history.
Physical examination, specimen
collection and ethics statement
All subjects filled out a questionnaire to collect
data on their age, sex, history of present illness, medication
history, allergy history, tobacco and alcohol history and family
history. The subjects underwent a physical examination that
included measurements of height, weight, waist circumference (WC),
systolic blood pressure (SBP) and diastolic blood pressure (DBP)
and calculation of BMI as weight (kg)/height squared
(m2). Overnight-fasting peripheral blood samples were
obtained from all subjects. All subjects signed informed consent
and the personal information was withheld. The study was approved
by Hebei General Hospital Ethics Committee (approval no. 2021057;
Shijiazhuang, China).
Biochemical index detection
An automatic biochemical analyzer [PML-AU5821;
Beckman Coulter Commercial Enterprise (China) Co., Ltd.] was used
to detect fasting blood glucose (FBG), fasting insulin (FINS), TC,
TG, HDL-C and LDL-C. FBG (cat. no. AUZ8807), TC (cat. no. AUZ8916),
TG (cat. no. AUZ8708), HDL-C (cat. no. AUZ8826) and LDL-C (cat. no.
AUZ8744) were measured using kits from the Beckman Coulter
Laboratory Systems (Suzhou) Co., Ltd. FINS (cat. no. 47675203) was
measured using kits from Roche Diagnostics (Shanghai) Co., Ltd. The
islet function evaluation index was calculated as follows:
Homeostatic model assessment of insulin resistance (HOMA-IR)=FBG
(mmol/l) x FINS (mIU/l)/22.5(14).
HOMA-IR ≥2.69 was set as the cut-off point for insulin resistance
(15).
The serum concentrations of DDIT4 (cat. no.
CSB-EL006590HU) and mTOR (cat. no. CSB-E09038h) were measured using
ELISA kits from Cusabio according to manufacturer's protocol. The
serum concentrations of CRP (cat. no. CHE0104), IL-6 (cat. no.
CHE0009), TNF-α (cat. no. CHE0019) and MCP-1 (cat. no. CHE0103)
were measured using ELISA kits from 4A Biotech Co., Ltd. in
accordance with the manufacturer's instructions.
Statistical methods
All statistical analyses were performed using SPSS
22.0 software (IBM Corp.). Continuous variables were expressed as
the mean ± standard deviation. For comparisons between the groups,
unpaired Student's t-test was used for normally distributed data
and the Mann-Whitney U test was used for non-normally distributed
data. Correlations between parameters were evaluated by Pearson
product moment correlation analysis. P<0.05 was considered to
indicate a statistically significant difference.
A factor analysis was conducted using the principal
component method with a Varimax rotation to examine whether insulin
resistance was clustered with clinical characteristics, metabolic
parameters and inflammatory variables. WC, weight, BMI, height,
FBG, FINS, HOMA-IR, TG, TC, HDL-C, LDL-C, DDIT4, mTOR, IL-6, CRP,
TNF-α and MCP-1 were included as variables in the factor analysis.
Factor loading with an absolute value ≥±0.5 or was used as the
cut-off value for data interpretation. The total variance explained
by each factor was presented to indicate the individual effect of
the factor in the analysis.
Results
Clinical characteristics and metabolic
parameters of the study subjects
The study cohort comprised 55 subjects in the normal
control group (CON group) and 55 subjects in the hyperlipidemia
group (HL group). As shown in Table
I, there were no significant differences between the two groups
for male-to-female ratio, age and height (P>0.05). However,
compared with the CON group, the HL group had significantly
increased systolic blood pressure, diastolic blood pressure, waist
circumference, weight and BMI (P<0.05).
 | Table IComparisons of clinical
characteristics and metabolic parameters between the two
groups. |
Table I
Comparisons of clinical
characteristics and metabolic parameters between the two
groups.
| Clinical
characteristics and metabolic parameters | CON group | HL group | t-value | P-value |
|---|
| n | 55 | 55 | | |
| Male/female | 28/27 | 29/26 | -0.190 | 0.849 |
| Age (years) | 45.47±12.45 | 46.25±11.75 | -0.339 | 0.735 |
| SBP (mmHg) | 114.42±11.83 |
129.49±15.40a | -5.756 | <0.001 |
| DBP (mmHg) | 73.65±8.25 |
86.76±10.97a | -7.085 | <0.001 |
| WC (cm) | 78.4±6.58 |
91.49±11.63a | -7.264 | <0.001 |
| Height (cm) | 167.27±8.00 | 168.05±8.27 | -0.504 | 0.615 |
| Weight (kg) | 61.78±7.40 |
76.24±14.91a | -6.439 | <0.001 |
| BMI
(kg/m2) | 22.03±1.50 |
26.83±3.79a | -8.748 | <0.001 |
| TG (mmol/l) | 0.96±0.30 |
3.98±2.15a | -10.291 | <0.001 |
| TC (mmol/l) | 4.33±0.64 |
6.91±0.67a | -20.677 | <0.001 |
| HDL-C (mmol/l) | 1.35±0.27 | 1.27±0.24 | 1.673 | 0.097 |
| LDL-C (mmol/l) | 2.63±0.45 |
4.43±0.72a | -15.763 | <0.001 |
| FBG (mmol/l) | 5.26±0.41 |
5.94±1.28a | -3.770 | <0.001 |
| FINS (mIU/l) | 7.04±3.51 |
13.89±8.73a | -5.407 | <0.001 |
| HOMA-IR | 1.67±0.89 |
3.75±2.72a | -5.402 | <0.001 |
The metabolic parameters are also shown in Table I. Compared with the CON group, the
HL group had significantly increased plasma TC, TG and LDL-C levels
(P<0.05). Meanwhile, the HL group had lower HDL-C than the CON
group (P>0.05), but the difference was not significant.
The HL group had significantly increased FBG, FINS
and HOMA-IR compared with the CON group. These data indicate a
significant degree of insulin resistance in the HL group compared
with the CON group. The clinical characteristics and metabolic
parameters of the participants are summarized in Table I.
Levels of DDIT4, mTOR and inflammatory
parameters
Compared with the CON group, the HL group had
increased mTOR and decreased DDIT4 (P<0.05). The HL group also
had significantly higher CRP, IL-6, TNF-α and MCP-1 compared with
the CON group (Table II).
| Table IIComparisons of DDIT4, mTOR, and
inflammatory factors between the two groups. |
Table II
Comparisons of DDIT4, mTOR, and
inflammatory factors between the two groups.
| Factor | CON group | HL group | t-value | P-value |
|---|
| DDIT4 (ng/ml) | 1.05±0.40 |
0.51±0.06a | 9.734 | <0.001 |
| mTOR (ng/ml) | 5.22±1.74 |
15.35±6.08a | 11.879 | <0.001 |
| CRP (mg/l) | 6.14±0.98 |
10.55±1.24a | 20.693 | <0.001 |
| IL-6 (pg/ml) | 8.21±0.93 |
16.93±1.82a | 31.641 | <0.001 |
| TNF-α (pg/ml) | 7.85±1.15 |
15.28±1.98a | 24.065 | <0.001 |
| MCP-1 (pg/ml) | 79.87±9.16 |
122.80±12.76a | 20.269 | <0.001 |
Correlations among clinical data,
metabolic markers and inflammatory markers
A correlation analysis was performed for all lipid
profiles, metabolic markers and inflammatory markers (Table III). The insulin resistance
indexes (FINS, HOMA-IR) were found to be positively correlated with
SBP, DBP, WC, weight, BMI, mTOR, lipid profiles (TG, TC, LDL-C) and
inflammatory markers (CRP, IL-6, TNF-α, MCP-1), but negatively
correlated with HDL-C and DDIT4 (P<0.05). Meanwhile, the lipid
profiles (TG, TC, LDL-C) were found to be positively correlated
with WC, weight, BMI, mTOR and inflammatory markers (CRP, IL-6,
TNF-α, MCP-1), but negatively correlated with DDIT4 (P<0.05).
HDL-C was negatively correlated with WC, weight, BMI and DDIT4, but
positively correlated with mTOR. DDIT4 was negatively correlated
with mTOR and inflammatory markers, while mTOR was positively
correlated with inflammatory markers.
| Table IIICorrelations among clinical data and
metabolic and inflammatory parameters. |
Table III
Correlations among clinical data and
metabolic and inflammatory parameters.
| P-value/r | Age | SBP | DBP | WC | Height | Weight | BMI | TG | TC | HDL-C | LDL-C | FBG | FINS | HOMA-IR | DDIT4 | mTOR | CRP | IL-6 | TNF-α | MCP-1 |
|---|
| Age | - | 0.088a | -0.095a | -0.236a | -0.534b | -0.377b | -0.149a | 0.057a | 0.144a | 0.262b | 0.079a | 0.168a | -0.277a | -0.215a | -0.235b | 0.133b | 0.125a | 0.091a | 0.107a | 0.135a |
| SBP | 0.360a | - | 0.820b | 0.537b | 0.202a | 0.464b | 0.461b | 0.373b | 0.441b | -0.203a | 0.413a | 0.115a | 0.287b | 0.277b | -0.332a | 0.360b | 0.417b | 0.447b | 0.433b | 0.414a |
| DBP | 0.323a | 0.000b | - | 0.615b | 0.202a | 0.572b | 0.589b | 0.410b | 0.504b | -0.234a | 0.497a | 0.050b | 0.424a | 0.370b | -0.417a | 0.386b | 0.483b | 0.514b | 0.494b | 0.483a |
| WC | 0.013a | 0.000b | 0.000b | - | 0.460b | 0.924b | 0.888b | 0.355b | 0.474b | -0.263b | 0.491a | 0.154b | 0.585b | 0.54a | -0.396b | 0.344b | 0.461b | 0.504b | 0.480b | 0.456a |
| Height | 0.000b | 0.034a | 0.034a | 0.000b | - | 0.625b | 0.178a | 0.018a | -0.039a | -0.218a | -0.004b | -0.154a | 0.164a | 0.111b | 0.129a | -0.033b | -0.038a | -0.003a | -0.016a | -0.039b |
| Weight | 0.000b | 0.000b | 0.000b | 0.000b | 0.000b | - | 0.875b | 0.323b | 0.403b | -0.287b | 0.427b | 0.099b | 0.628b | 0.568b | -0.320b | 0.276a | 0.403b | 0.447b | 0.424b | 0.393b |
| BMI | 0.120a | 0.000b | 0.000b | 0.000b | 0.062a | 0.000b | - | 0.404b | 0.536b | -0.247b | 0.549a | 0.229b | 0.694b | 0.653b | -0.479a | 0.372b | 0.536a | 0.573b | 0.551b | 0.525a |
| TG | 0.553a | 0.000b | 0.000b | 0.000b | 0.852a | 0.001b | 0.000b | - | 0.606b | -0.356b | 0.461a | 0.302b | 0.437b | 0.444b | -0.475a | 0.485b | 0.598b | 0.645a | 0.620b | 0.593a |
| TC | 0.133a | 0.000b | 0.000b | 0.000b | 0.685a | 0.000b | 0.000b | 0.000b | - | 0.075a | 0.943a | 0.310b | 0.410b | 0.405b | -0.861a | 0.923b | 0.979b | 0.967b | 0.974a | 0.972a |
| HDL-C | 0.006b | 0.034a | 0.014a | 0.005b | 0.022a | 0.002b | 0.009b | 0.000b | 0.435a | - | -0.026b | -0.145a | -0.326a | -0.325b | -0.211a | 0.131b | 0.066b | -0.020b | 0.024a | 0.071b |
| LDL-C | 0.412a | 0.000a | 0.000a | 0.000a | 0.968b | 0.000b | 0.000a | 0.000a | 0.000a | 0.788b | - | 0.269b | 0.410b | 0.393b | -0.794a | 0.882b | 0.925b | 0.913b | 0.921b | 0.916a |
| FBG | 0.080a | 0.230a | 0.605b | 0.108b | 0.107a | 0.306b | 0.016b | 0.001b | 0.001b | 0.130a | 0.004b | - | 0.318a | 0.543a | -0.289a | 0.237a | 0.303a | 0.309b | 0.303b | 0.286a |
| FINS | 0.003a | 0.002b | 0.000a | 0.000b | 0.087a | 0.000b | 0.000b | 0.000b | 0.000b | 0.001a | 0.000b | 0.001a | - | 0.956b | -0.358a | 0.307b | 0.408b | 0.423b | 0.412b | 0.389b |
| HOMA-IR | 0.024a | 0.003b | 0.000b | 0.000a | 0.248b | 0.000b | 0.000b | 0.000b | 0.000b | 0.001b | 0.000b | 0.000a | 0.000b | - | -0.35a | 0.305b | 0.402b | 0.418b | 0.407b | 0.383a |
| DDIT4 | 0.014b | 0.000a | 0.000a | 0.000b | 0.178a | 0.001b | 0.000a | 0.000a | 0.000a | 0.027a | 0.000a | 0.002a | 0.000a | 0.000a | - | -0.708b | -0.833b | -0.774b | -0.799b | -0.825a |
| mTOR | 0.165b | 0.000b | 0.000b | 0.000b | 0.728b | 0.004a | 0.000b | 0.000b | 0.000b | 0.174b | 0.000b | 0.013a | 0.001b | 0.001b | 0.000b | - | 0.917b | 0.899b | 0.916b | 0.919a |
| CRP | 0.194a | 0.000b | 0.000b | 0.000b | 0.693a | 0.000b | 0.000a | 0.000b | 0.000b | 0.495b | 0.000b | 0.001a | 0.000b | 0.000b | 0.000b | 0.000 b | - | 0.984b | 0.994b | 0.995a |
| IL-6 | 0.346a | 0.000b | 0.000b | 0.000b | 0.978a | 0.000b | 0.000b | 0.000a | 0.000b | 0.838b | 0.000b | 0.001b | 0.000b | 0.000b | 0.000b | 0.000b | 0.000b | - | 0.994b | 0.984a |
| TNF-α | 0.264a | 0.000b | 0.000b | 0.000b | 0.870a | 0.000b | 0.000b | 0.000b | 0.000a | 0.804a | 0.000b | 0.001b | 0.000b | 0.000b | 0.000b | 0.000b | 0.000b | 0.000b | - | 0.994a |
| MCP-1 | 0.161a | 0.000a | 0.000a | 0.000a | 0.687b | 0.000b | 0.000a | 0.000a | 0.000a | 0.464b | 0.000a | 0.002a | 0.000b | 0.000a | 0.000a | 0.000a | 0.000a | 0.000a | 0.000a | - |
The present study conducted a factor analysis using
the principal component method with a Varimax rotation to examine
whether fasting insulin level was clustered with clinical data and
metabolic risk factors among subjects with hyperlipidemia. The
variables included in the factor analysis were WC, weight, BMI,
height, FBG, FINS, HOMA-IR, TG, TC, HDL-C, LDL-C, DDIT4, mTOR,
IL-6, CRP, TNF-α and MCP-1 (Table
IV). In total, four domains were identified that could explain
84.629% of the total variance (domain 1: 44.429%; domain 2:
21.695%; domain 3: 11.782%; domain 4: 6.723%). The first domain was
designated the inflammation-lipid 1 domain, in which IL-6, CRP,
TNF-α, MCP-1, mTOR, TC and LDL-C were positively loaded and DDIT4
was negatively loaded. The second domain was denoted the overweight
domain, in which weight, WC and BMI were positively loaded. The
third domain was termed the insulin sensitivity domain, in which
FBG, FINS and HOMA-IR were positively loaded. The fourth domain was
called the lipid 2 domain, in which TG was positively loaded and
HDL-C was negatively loaded.
| Table IVResults of the principal component
factor analysis with a Varimax rotation among subjects with
hyperlipidemia. |
Table IV
Results of the principal component
factor analysis with a Varimax rotation among subjects with
hyperlipidemia.
| Variable | Factor 1 | Factor 2 | Factor 3 | Factor 4 |
|---|
| IL-6 | 0.970a | -0.099 | -0.069 | -0.048 |
| CRP | 0.969a | -0.078 | -0.045 | -0.040 |
| TNF-α | 0.965a | -0.084 | -0.052 | -0.039 |
| DDIT4 | -0.960a | 0.036 | 0.015 | 0.036 |
| MCP-1 | 0.949a | -0.098 | -0.087 | -0.047 |
| mTOR | 0.947a | -0.119 | -0.036 | -0.063 |
| TC | 0.925a | -0.090 | -0.039 | -0.072 |
| LDL-C | 0.716a | 0.060 | 0.065 | -0.341 |
| Weight | -0.122 | 0.978a | 0.023 | -0.020 |
| WC | -0.119 | 0.924a | 0.055 | -0.083 |
| BMI | -0.177 | 0.843a | 0.297 | -0.124 |
| Height | 0.014 | 0.711a | -0.389 | 0.140 |
| HOMA-IR | 0.009 | 0.468 | 0.805a | 0.237 |
| FBG | -0.089 | -0.221 | 0.768a | -0.015 |
| FINS | 0.028 | 0.593 | 0.638a | 0.267 |
| TG | -0.081 | -0.107 | 0.048 | 0.936a |
| HDL-C | 0.371 | -0.133 | -0.355 | -0.566a |
| % Total variance
(%) | 44.429 | 21.695 | 11.782 | 6.723 |
| % Cumulative
variance | 44.429 | 66.124 | 77.906 | 84.629 |
Discussion
Insulin resistance is prevalent in people with
hyperlipidemia (16) and is a
common risk factor for diabetes and cardiovascular disease. Insulin
resistance increases the risk of hyperlipidemia, leading to
increased incidence of atherosclerosis, coronary heart disease and
stroke (17,18) and the interaction of the two
factors aggravates the occurrence of metabolic syndrome.
mTOR is a highly conserved serine/threonine kinase
that can integrate growth-, stress- and nutrition-related signals
and coordinate cell growth, proliferation and metabolism (19,20).
Previous studies show that the mTOR signaling pathway functions by
controlling downstream p70 ribosomal protein S6 kinase (p70S6K) and
eukaryotic initiation factor phospho-eI F4E-binding protein 1
(p-4EBP1) (21) and participates
in a variety of human diseases, including cancer, diabetes, obesity
and neurodegenerative diseases (20). Other studies confirmed that mTOR is
a key signaling component for regulation of insulin metabolism
(22,23), in which mTOR and its downstream
regulator p70S6K phosphorylate insulin receptor substrate (IRS)-1
on serine residues to block the activation of phosphatidylinositol
3-kinase (PI3K) (22,24), while inhibition of the mTOR pathway
can improve glucose and lipid metabolism disorders. The present
study confirmed that serum mTOR was significantly higher in the HL
group compared with the CON group and that high mTOR expression was
positively correlated with blood glucose, blood lipids, insulin
resistance and inflammatory markers, indicating that mTOR may have
roles in glucose and lipid metabolism disorders, insulin resistance
and inflammation, consistent with the related reports. In animal
experiments, mTOR phosphorylation is found to be increased in obese
mice fed a high-fat and high-sugar diet (25). Furthermore, when the mTOR pathway
is negatively regulated, it promotes hepatocyte autophagy and
improves lipid metabolism disorders in obese mice (25). Meanwhile, mTOR expression is
increased in a rat model of NAFLD and a corn silk aqueous extract
alleviates high-fat diet-induced NAFLD and its mechanism of action
may be related to inhibition of PI3K/Akt/mTOR pathway activation
(26).
DDIT4, also known as RTP801/Dig2/REDD1, negatively
regulates mTOR activity and serves important roles in oxidative
metabolism and insulin-stimulated signaling (6-8,27).
Dungan and Williamson (28,29)
and other researchers (30)
demonstrate that DDIT4 knockout or deletion decreased
insulin-stimulated tyrosine phosphorylation of IRS-1, leading to
the development of insulin resistance. Regazzetti et al
(30) report that reduced DDIT4
levels following gene knockdown limits insulin-stimulated
activation of IRS-1 and Akt. Decreased DDIT4 protein expression
overactivates basal mTORC1 signaling, which produces negative
feedback and inhibits IRS-1, thereby suppressing signaling
responses to insulin (31). In
DDIT4 KO mice, inhibition of mTORC1 signaling following rapamycin
treatment limits negative feedback on IRS-1 and mitogen-activated
protein kinase kinases (MEK) 1/2 activation, thereby enhancing
signaling responses to insulin (28,31).
In the present study, serum DDIT4 was significantly lower than in
the HL group compared with the CON group and DDIT4 was negatively
correlated with blood glucose, blood lipids, insulin resistance and
inflammatory markers, indicating that DDIT4 overexpression may be
beneficial for alleviation of glucose and lipid metabolism, insulin
resistance and inflammation. The present results are basically
consistent with the findings of Wang et al (32) and Yang et al (33). These researchers demonstrated that
DDIT4 expression is decreased in cells cultured in the presence of
high glucose, suggesting that the occurrence and development of
diabetic nephropathy may be related to DDIT4 and DNA damage. It is
also reported that DDIT4 expression is reduced in rat renal tubular
epithelial cells cultured under high glucose conditions, while
overexpressed DDIT4 can alleviate DNA damage caused by
hyperglycemia (34).
Some studies found that certain drugs interfere with
the DDIT4/mTOR pathway to improve adverse metabolic responses to
high sugar, high fat, or stress (35-38),
which inspired the present study. A study confirmed that
salidroside is able to protect human umbilical vein endothelial
cells against H2O2-induced apoptosis by
activating the PI3K/Akt/mTOR-dependent pathway and inhibiting ROS
through activation of DDIT4(35).
Other studies found that increased expression of activator of
transcription 4 (ATF4) is sufficient to promote DDIT4
transcription, thereby inhibiting expression of mTORC1 and
alleviating endoplasmic reticulum stress (36,37).
These antioxidant and anti-stress effects of DDIT4 may serve
synergistic roles in insulin resistance in people with
hyperlipidemia. Meanwhile, 1,25-dihydroxyvitamin D3 inhibits high
glucose-induced rat mesangial cell proliferation through the
DDIT4/mTOR signaling pathway, thereby exerting a renoprotective
effect in diabetes (38).
Therefore, the role of the DDIT4/mTOR pathway in insulin resistance
caused by high glucose and high fat is worthy of further
investigation.
Hyperlipidemia is a known risk factor for
atherosclerosis (39). Studies
have demonstrated that inflammatory responses can be triggered by
the formation, development and even complications of hyperlipidemia
and that the activity and expression of various inflammatory
factors, such as CRP, MCP-1, TNF-α and IL-6, are simultaneously
enhanced (9,40). Another study showed that increased
blood CRP levels can lead to glucose and lipid metabolism disorders
and promote the occurrence of atherosclerosis (41). A change in the CRP index level is
more meaningful than a change in LDL-C in cardiovascular diseases.
The present study found that the inflammatory state and insulin
resistance were significantly increased in the HL group compared
with the CON group. The correlation analysis further revealed that
insulin resistance (fasting insulin level and HOMA-IR) was
positively correlated with blood pressure, BMI, blood lipids (TG,
TC and LDL-C), inflammatory markers (CRP, IL-6, MCP-1 and TNF-α)
and mTOR, but negatively correlated with HDL-C and DDIT4. In
addition, inflammatory markers were positively correlated with
blood lipids (TG, TC and LDL-C), BMI and mTOR, but negatively
correlated with DDIT4. These findings reflected a higher incidence
of metabolic syndrome, inflammation and excess body weight in the
subjects in the HL group.
We have attempted to build a model that can be
applied to clinical events from experimental data, but we have not
found significant linear or non-linear correlations between the
data. We consulted the references and a factor analysis was
conducted to help with understanding of the metabolic, inflammatory
and lipid variables in metabolic syndrome, which are influenced by
disease, participant characteristics and other specific variables
(42). A previous study assessed
the risk domains in metabolic syndrome and cardiovascular events by
factor analysis (43). Other
studies confirmed that elevated blood lipids were associated with
coronary heart disease morbidity and mortality (44), while elevated serum IL-6 and CRP
levels were associated with development of type 2 diabetes
(45). Among the variables, the
present study attempted to elucidate the contributions of insulin
sensitivity, blood lipids, body mass index and inflammatory factors
in hyperlipidemia and conducted a factor analysis to determine the
factor structures of these variables in hyperlipidemia. The results
identified four domains that could explain 84.629% of the total
variance among the subjects with hyperlipidemia: inflammation-lipid
1 domain, overweight domain, insulin sensitivity domain and lipid 2
domain. TC and TG belonged to different domains, indicating that
the effects of these indicators were different and not fully
synergistic in hyperlipidemia. The major strength of the present
study is its comprehensive analysis of the contributions of various
physiological indexes in hyperlipidemia by the factor analysis.
Further dimensionality reduction analysis of these variables could
be applied to future predictions and analyses of diseases, such as
diabetes, coronary heart disease and atherosclerosis, in people
with hyperlipidemia. However, the smaller sample size is a
limitation of the present study. Future research will continue to
increase the number of enrolled cases and improve the data to
support the results demonstrated.
In conclusion, blood lipid levels in adults warrant
special early attention because insulin resistance, inflammation,
blood lipids and abnormal body weight can increase the risk of
cardiovascular disease and diabetes in adults. Serum DDIT4 and mTOR
levels are closely related to blood lipid levels, insulin
resistance and inflammatory status and may be potential predictors
of hyperlipidemia. The present study also found that
inflammatory-lipid 1, insulin sensitivity, overweight and lipid 2
domains predominantly exist in the data of people with
hyperlipidemia. These domains may be useful to predict the outcomes
of diabetes and cardiovascular diseases in the future.
Acknowledgements
Not applicable.
Funding
Funding: No funding was received.
Availability of data and materials
The datasets used and/or analyzed during the current
study are available from the corresponding author on reasonable
request.
Authors' contributions
XP and GS conceived and designed the study. XP, ZZ,
CL, MZ, XW, JZ and CW acquired and analyzed the data. XP, CW and GS
confirm the authenticity of the raw data. XP prepared the draft of
the manuscript. All authors have read and approved the final
manuscript.
Ethics approval and consent to
participate
All subjects provided signed informed consent. The
study was approved by Hebei General Hospital Ethics Committee
(approval no. 2021057).
Patient consent for publication
Not applicable.
Competing interests
The authors declare that they have no competing
interests.
References
|
1
|
Tomlinson B, Chan P and Lam CW:
Postprandial hyperlipidemia as a risk factor in patients with type
2 diabetes. Expert Rev Endocrinol Metab. 15:147–157.
2020.PubMed/NCBI View Article : Google Scholar
|
|
2
|
Zhu JR, Gao RL and Zhao SP: Guidelines for
the prevention and treatment of dyslipidemia in Chinese adults
(Revised edition 2016). Chinese Circulation Journal. 31:937–953.
2016.(in Chinese).
|
|
3
|
Wang L, Lu MY, Ren JY and Chen H:
Correlation study on different dyslipidemia classification and
glucose metabolism in patients with hyperlipidemia. Beijing Da Xue
Xue Bao Yi Xue Ban. 43:427–431. 2011.PubMed/NCBI(In Chinese).
|
|
4
|
Koundouros N and Blenis J: Targeting mTOR
in the context of diet and whole-body metabolism. Endocrinology.
163(bqac041)2022.PubMed/NCBI View Article : Google Scholar
|
|
5
|
Dennis MD, Coleman CS, Berg A, Jefferson
LS and Kimball SR: REDD1 enhances protein phosphatase 2A-mediated
dephosphorylation of Akt to repress mTORC1 signaling. Sci Signal.
7(ra68)2014.PubMed/NCBI View Article : Google Scholar
|
|
6
|
Ellisen LW, Ramsayer KD, Johannessen CM,
Yang A, Beppu H, Minda K, Oliner JD, McKeon F and Haber DA: REDD1,
a developmentally regulated transcriptional target of p63 and p53,
links p63 to regulation of reactive oxygen species. Mol Cell.
10:995–1005. 2002.PubMed/NCBI View Article : Google Scholar
|
|
7
|
Kimball SR, Do AN, Kutzler L, Cavener DR
and Jefferson LS: Jefferson LS rapid turnover of the mTOR complex 1
(mTORC1) repressor REDD1 and activation of mTORC1 signaling
following inhibition of protein synthesis. Biol Chem.
283:3465–3475. 2008.PubMed/NCBI View Article : Google Scholar
|
|
8
|
Katiyar S, Liu E, Knutzen CA, Lang ES,
Lombardo CR, Sankar S, Toth JI, Petroski MD, Ronai Z and Chiang GG:
REDD1, an inhibitor of mTOR signalling, is regulated by the
CUL4A-DDB1 ubiquitin ligase. EMBO Rep. 10:866–872. 2009.PubMed/NCBI View Article : Google Scholar
|
|
9
|
Papapanagiotou A, Siasos G, Kassi E,
Gargalionis AN and Papavassiliou AG: Novel inflammatory markers in
hyperlipidemia: Clinical implications. Curr Med Chem. 22:2727–2743.
2015.PubMed/NCBI View Article : Google Scholar
|
|
10
|
Siasos G, Tousoulis D, Oikonomou E,
Zaromitidou M, Stefanadis C and Papavassiliou AG: Inflammatory
markers in hyperlipidemia: From experimental models to clinical
practice. Curr Pharm Des. 17:4132–4146. 2011.PubMed/NCBI View Article : Google Scholar
|
|
11
|
Butani L, Dharmar M, Devaraj S and Jialal
I: Preliminary report of inflammatory markers, oxidative stress,
and insulin resistance in adolescents of different ethnicities.
Metab Syndr Relat Disord. 14:182–186. 2016.PubMed/NCBI View Article : Google Scholar
|
|
12
|
Tarantino G, Citro V, Balsano C and Capone
D: Could SCGF-beta levels be associated with inflammation markers
and insulin resistance in male patients suffering from
obesity-related NAFLD? Diagnostics (Basel). 10(395)2020.PubMed/NCBI View Article : Google Scholar
|
|
13
|
Chinese Adult Dyslipidemia Prevention and
Treatment Guidelines Revision Joint Committee: Guidelines for the
prevention and treatment of dyslipidemia in Chinese adults (Revised
edition 2016). Chinese Journal of General Practitioners 16: 15-35,
2017 (in Chinese).
|
|
14
|
Sun J, Du Q and Wang GP: Research on β
cell function and insulin resistance in patients with type 2
diabetes mellitus. Chin J Diabetes. 23:592–594. 2015.
|
|
15
|
Xiao-Yan X, Wen-Ying Y and Zhao-Jun Y: The
diagnostic significance of homeostasis model assessment of insulin
resistance in metabolic syndrome among subjects with different
glucose tolerance. Chinese J Diabetes Mellitus. 2004:31–35.
2004.
|
|
16
|
Yuan H and Yuan F: Study on the
relationship between pure hyperlipidemia and insulin resistance
index. Chinese Journal of Practical Internal Medicine. 27:246–247.
2007.(in Chinese).
|
|
17
|
Qiu LQ: Comparison of clinical effects of
two statins in the treatment of primary hyperlipidemia. Guide of
China Medicine. 9:85–86. 2011.(in Chinese).
|
|
18
|
Wang XG and Zhao X: Research progress of
pathogenesis and treatment of hyperlipidemia. Journal of Liaoning
University of Traditional Chinese Medicine. 22:196–200. 2020.(in
Chinese).
|
|
19
|
Schmelzle T and Hall MN: TOR, a central
controller of cell growth. Cell. 103:253–262. 2000.PubMed/NCBI View Article : Google Scholar
|
|
20
|
Sudarsanam S and Johnson DE: Functional
consequences of mTOR inhibition. Curr Opin Drug Discov Devel.
13:31–40. 2010.PubMed/NCBI
|
|
21
|
Laplante M and Sabatini DM: mTOR signaling
in growth control and disease. Cell. 149:274–293. 2012.PubMed/NCBI View Article : Google Scholar
|
|
22
|
Carlson CJ, White MF and Rondinone CM:
Mammalian target of rapamycin regulates IRS-1 serine 307
phosphorylation. Biochem Biophys Res Commun. 316:533–539.
2004.PubMed/NCBI View Article : Google Scholar
|
|
23
|
Sarbassov DD, Ali SM and Sabatini DM:
Growing roles for the mTOR pathway. Curr Opin Cell Biol.
17:596–603. 2005.PubMed/NCBI View Article : Google Scholar
|
|
24
|
Ozes ON, Akca H, Mayo LD, Gustin JA,
Maehama T, Dixon JE and Donner DB: A phosphatidylinositol
3-kinase/Akt/mTOR pathway mediates and PTEN antagonizes tumor
necrosis factor inhibition of insulin signaling through insulin
receptor substrate-1. Proc Natl Acad Sci USA. 98:4640–4645.
2001.PubMed/NCBI View Article : Google Scholar
|
|
25
|
Ting H, Zhen-Zhen L, Yang B and Hui-Shuang
L: Probiotics improve lipid metabolism of obese mice induced by
high-fat and high-sucrose diet. Basic Clin Med. 41:1260–1265.
2021.
|
|
26
|
Ding L and Liu YC: Study on improving
nonalcoholic fatty liver disease of high fat diet induced rats by
corn silk aqueous extract. China Food Additives. 32:51–57. 2021.(in
Chinese).
|
|
27
|
Gordon BS, Williamson DL, Lang CH,
Jefferson LS and Kimball SR: Nutrient-induced stimulation of
protein synthesis in mouse skeletal muscle is limited by the mTORC1
repressor REDD1. J Nutr. 145:708–713. 2015.PubMed/NCBI View Article : Google Scholar
|
|
28
|
Dungan CM and Williamson DL: Regulation of
skeletal muscle insulin-stimulated signaling through the
MEK-REDD1-mTOR axis. Biochem Biophys Res Commun. 482:1067–1072.
2017.PubMed/NCBI View Article : Google Scholar
|
|
29
|
Dungan CM, Wright DC and Williamson DL:
Lack of REDD1 reduces whole body glucose and insulin tolerance, and
impairs skeletal muscle insulin signaling. Biochem Biophys Res
Commun. 453:778–783. 2014.PubMed/NCBI View Article : Google Scholar
|
|
30
|
Regazzetti C, Dumas K, Marchand-Brustel
YL, Peraldi P, Tanti JF and Giorgetti-Peraldi S: Regulated in
development and DNA damage responses -1 (REDD1) protein contributes
to insulin signaling pathway in adipocytes. PLoS One.
7(e52154)2012.PubMed/NCBI View Article : Google Scholar
|
|
31
|
Sarbassov DD, Ali SM, Sengupta S, Sheen
JH, Hsu PP, Bagley AF, Markhard AL and Sabatini DM: Prolonged
rapamycin treatment inhibits mTORC2 assembly and Akt/PKB. Mol Cell.
22:159–168. 2006.PubMed/NCBI View Article : Google Scholar
|
|
32
|
Wang H, Wang JM, Qu H, Wei H, Ji B, Yang
Z, Wu J, He Q, Luo Y, Liu D, et al: In vitro and in vivo inhibition
of mTOR by 1,25-dihydroxyvitamin D3 to improve early diabetic
nephropathy via the DDIT4/TSC2/mTOR pathway. Endocrine. 54:348–359.
2016.PubMed/NCBI View Article : Google Scholar
|
|
33
|
Yang Z, Liu F, Qu H, Wang H, Xiao X and
Deng H: 1,25(OH)2D3 protects cell against high
glucose-induced apoptosis through mTOR suppressing. Mol Cell
Endocrinol. 414:111–119. 2015.PubMed/NCBI View Article : Google Scholar
|
|
34
|
Liang D, Zhao SQ, Li ZY, Xiao YW, Ding J,
Xiao Y and Guo B: miR-22 promotes DNA damage of renal tubular
epithelial cells with diabetic kidney disease by inhibiting DDIT4.
Chin J Pathophysiol. 37:1933–1941. 2021.(In Chinese).
|
|
35
|
Xu MC, Shi HM, Wang H and Gao XF:
Salidroside protects against hydrogen peroxide-induced injury in
HUVECs via the regulation of REDD1 and mTOR activation. Mol Med
Rep. 8:147–153. 2013.PubMed/NCBI View Article : Google Scholar
|
|
36
|
Jin HO, Seo SK, Woo SH, Kim ES, Lee HC,
Yoo DH, An S, Choe TB, Lee SJ, Hong SI, et al: Activating
transcription factor 4 and CCAAT/enhancer-binding protein-beta
negatively regulate the mammalian target of rapamycin via Redd1
expression in response to oxidative and endoplasmic reticulum
stress. Free Radic Biol Med. 46:1158–1167. 2009.PubMed/NCBI View Article : Google Scholar
|
|
37
|
Whitney ML, Jefferson LS and Kimball SR:
ATF4 is necessary and sufficient for ER stress-induced upregulation
of REDD1 expression. Biochem Biophys Res Commun. 379:451–455.
2009.PubMed/NCBI View Article : Google Scholar
|
|
38
|
Chen DP, Ma YP, Zhuo L, Zhang Z, Zou GM,
Yang Y, Gao HM and Li WG: 1,25-Dihydroxyvitamin D3 inhibits the
proliferation of rat mesangial cells induced by high glucose via
DDIT4. Oncotarget. 9:418–427. 2018.PubMed/NCBI View Article : Google Scholar
|
|
39
|
Chen H, Chen Y, Wu W, Chen Z, Cai Z, Ch Z,
Yan X and Wu S: Prolonged hyperlipidemia exposure increases the
risk of arterial stiffness in young adults: A cross-sectional study
in a cohort of Chinese. BMC Public Health. 20:1091–1099.
2020.PubMed/NCBI View Article : Google Scholar
|
|
40
|
Miao J, Zang X, Cui X and Zhang J:
Autophagy, hyperlipidemia, and atherosclerosis. Adv Exp Med Biol.
1207:237–264. 2020.PubMed/NCBI View Article : Google Scholar
|
|
41
|
López-Mejías R, Genre F, Remuzgo-Martínez
S, González-Juanatey C, Robustillo-Villarino M, Llorca J, Corrales
A, Vicente E, Miranda-Filloy JA, Magro C, et al: Influence of
elevated-CRP level-related polymorphisms in non-rheumatic
Caucasians on the risk of subclinical atherosclerosis and
cardiovascular disease in rheumatoid arthritis. Sci Rep.
6(31979)2016.PubMed/NCBI View Article : Google Scholar
|
|
42
|
Chang CJ, Jian DY, Lin MW, Zhao JZ, Ho LT
and Juan CC: Evidence in obese children: contribution of
hyperlipidemia, obesity-inflammation, and insulin sensitivity. PLoS
One. 10(e0125935)2015.PubMed/NCBI View Article : Google Scholar
|
|
43
|
Lin MW, Hwu CM, Huang YH, Sheu WH, Shih
KC, Chiang FT, Olshen R, Chen YD, Curb JD, Rodriguez B, et al:
Directly measured insulin resistance and the assessment of
clustered cardiovascular risks in hypertension. Am J Hypertens.
19:1118–1124. 2006.PubMed/NCBI View Article : Google Scholar
|
|
44
|
Ding D, Li X, Qiu J, Li R, Zhang Y, Su D,
Li Z, Wang M, Lv X and Wang D: , et al: Serum lipids,
apolipoproteins, and mortality among coronary artery disease
patients. Biomed Res Int. 2014(709756)2014.PubMed/NCBI View Article : Google Scholar
|
|
45
|
Wang X, Bao W, Liu J, Ouyang YY, Wang D,
Rong S, Xiao X, Shan ZL, Zhang Y, Yao P and Liu LG: Inflammatory
markers and risk of type 2 diabetes: A systematic review and
meta-analysis. Diabetes Care. 36:166–175. 2013.PubMed/NCBI View Article : Google Scholar
|