Introduction
Ischemic stroke (IS) is a common disease among
middle-aged and elderly individuals, typically caused by cerebral
ischemic injury. IS has high morbidity and mortality worldwide,
causing severe disability and negatively affecting quality of life
(1). The majority of patients
generally receive conservative treatment or interventional
therapies, such as thrombolytics (2). New treatment strategies are urgently
needed to reduce the mortality and morbidity of patients with IS,
and therefore improve patient prognosis and quality of life. Thus,
the present study may provide novel directions in which to explore
the physiological and pathological mechanisms for IS.
Long non-coding RNAs (lncRNAs), microRNAs
(miRNAs/miRs) and circular RNAs (circRNAs) are types of non-coding
RNAs (ncRNAs) that play important roles at the biomolecular level,
such as transcriptional regulation, post-transcriptional regulation
and epigenetics (3). Previous
studies have revealed that stroke is influenced by genetic factors
and that miRNAs and lncRNAs are specifically linked to IS (4,5). For
example, some miRNAs, such as miR-155, miR-125a/b-5p and miR-22,
can influence patient recovery during IS therapy by regulating
blood pressure (6). High
expression of the hyperglycemia-related FAS gene and miRNA
has-let-7b-5p are associated with a poor outcome in IS (7). Some abnormal lncRNAs have been shown
to have a role in IS, such as metastasis associated lung
adenocarcinoma transcript 1(8),
maternally expressed 3(9) and
H19(10). However, evidence also
indicates that lncRNAs may not directly cause these effects, but
instead establish vigorous modulatory crosstalk networks through
interactions with other ncRNAs by competitively combining with
certain ncRNAs. This is known as the ceRNA network theory (11). Studies have stressed the key
importance of the ceRNA network; however, there are also reports
that a lncRNA-miRNA-mRNA net is an important mechanism for
regulating post-transcriptional gene translation (12). Therefore, the present study aimed
to build a complete ceRNA network that could improve understanding
of cerebral ischemic injury disease treatments.
A previous study demonstrated a relationship between
stroke and programmed cell death, which indicated that a
strong/dysregulated inflammatory response may aggravate programmed
cell death after a stroke t (13).
A recent study explored a lncRNA-miRNA-mRNA regulatory network in
IS (14). After IS, the disrupted
blood-brain barrier infiltrates and initiates the innate phase of
the immune response which rapidly activates the immune cells. The
release of brain antigens results in the rapid infiltration of
dendritic cell precursors into the brain after the innate stage;
these cells persist in the brain and are said to determine the
outcome of programmed cell death by influencing long-term T cell
responses (15). Since the immune
system is closely related to programmed cell death, the present
study considered whether there is a connection between the ceRNA
network and programmed cell death in IS. However, to the best of
our knowledge, there have been only a few bioinformatics-related
studies on the mechanism of programmed cell death and ceRNA
networks (16,17), and therefore it is important to
explore the relationship between programmed cell death and the
ceRNA network in IS.
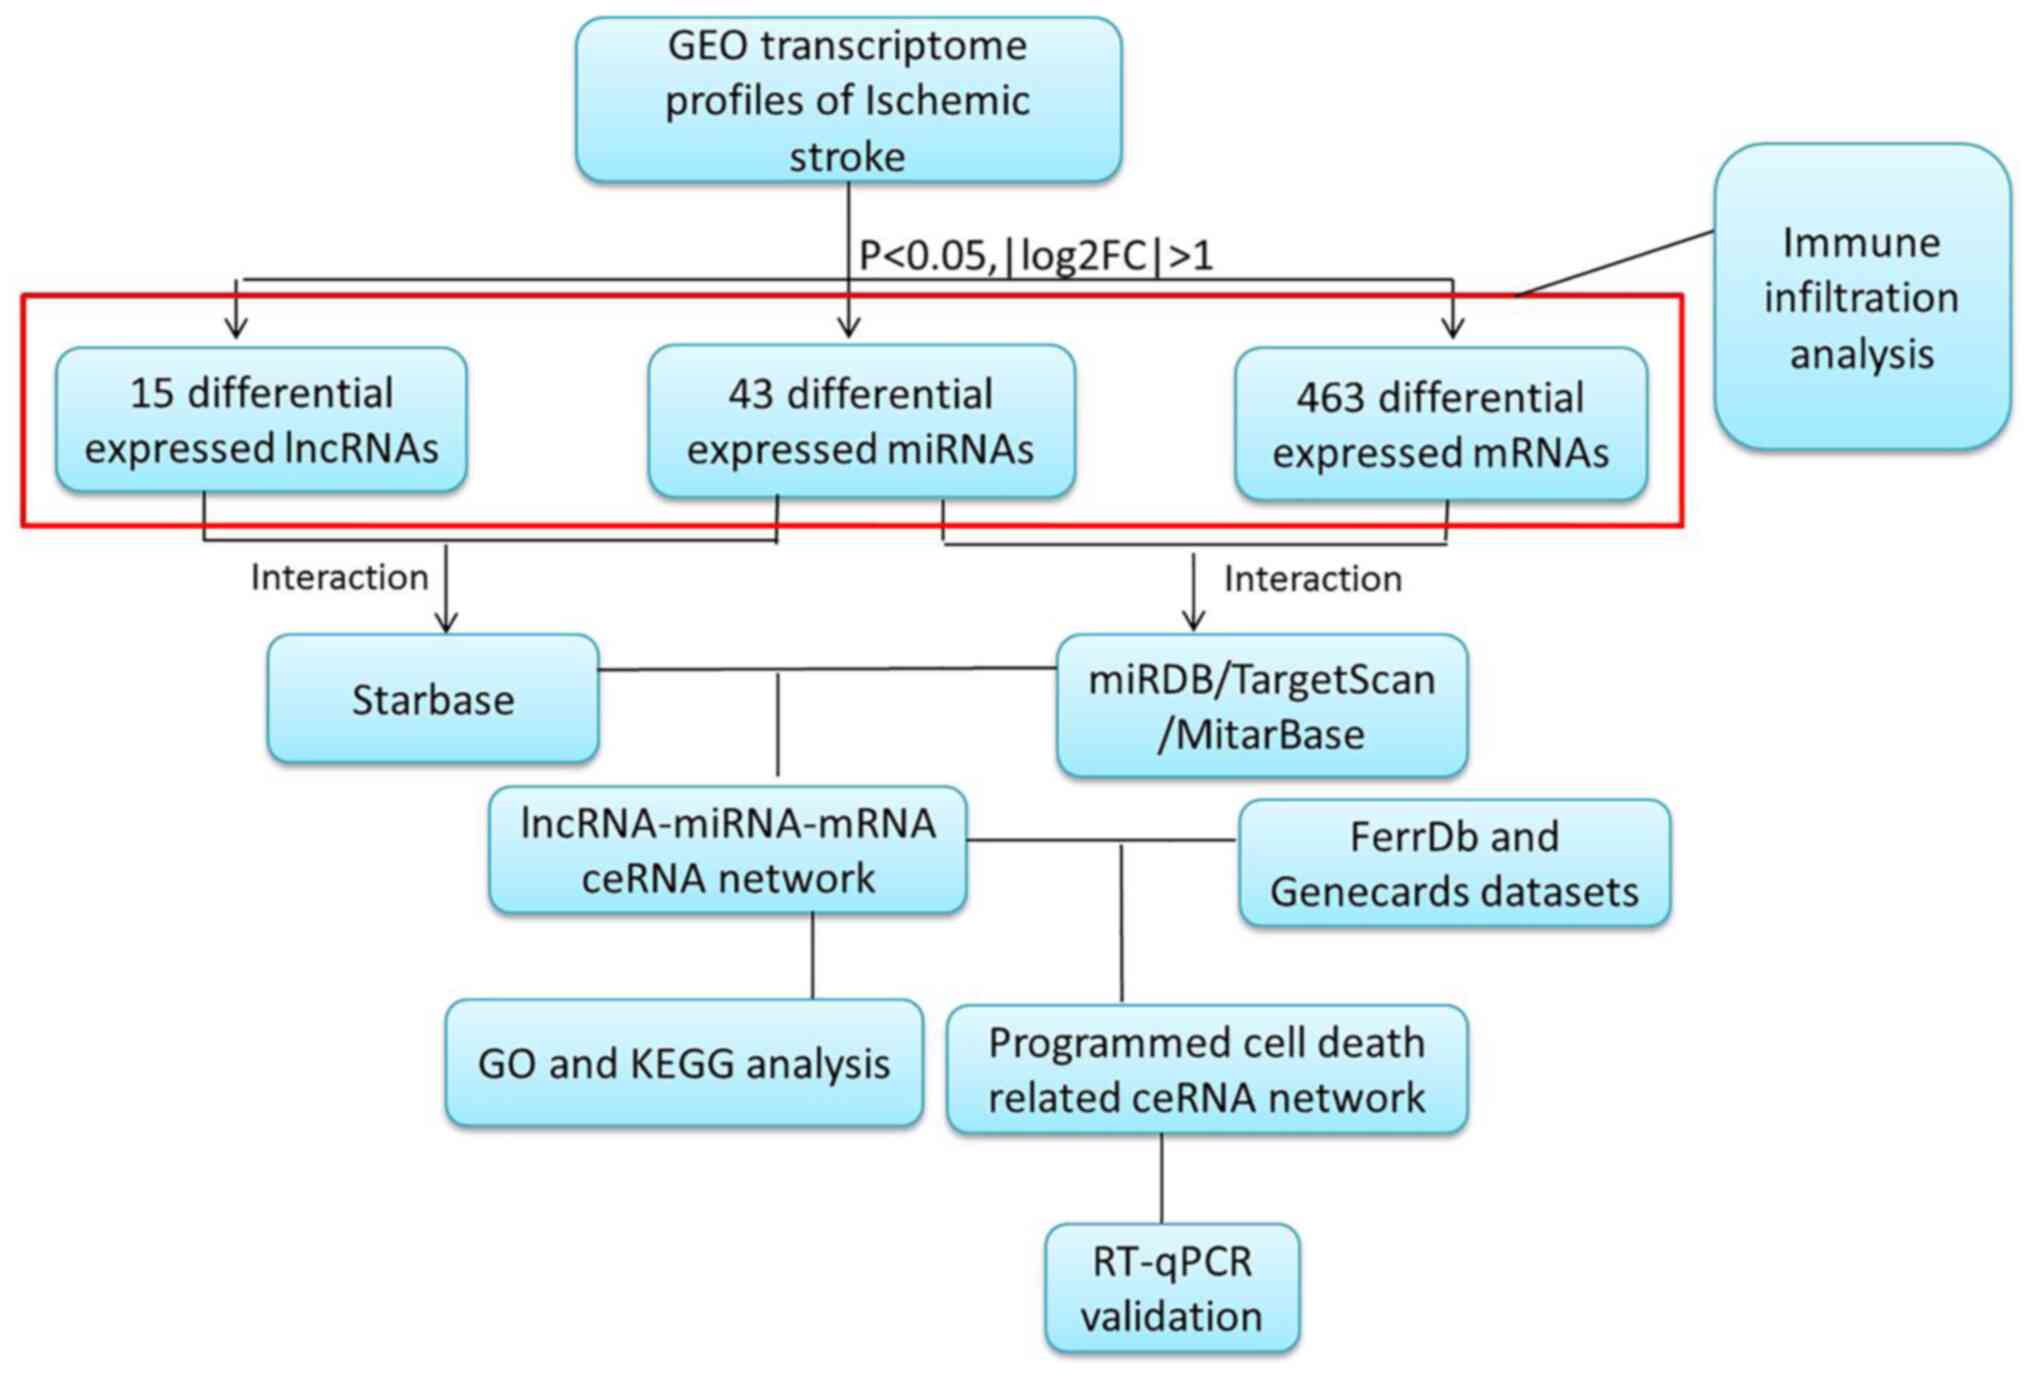
The present study focused on constructing a global
lncRNA-miRNA-mRNA network based on NCBI GEO datasets for lncRNA,
miRNA and mRNA expression profiles. Driving endonuclease genes
(DEGs) between patients with IS and healthy controls were extracted
and analyzed. The lncRNA-miRNA and miRNA-mRNA pairs were
identified, then the lncRNA-miRNA-mRNA network was constructed. The
differentially expressed mRNAs in the ceRNA network were analyzed
using Gene Ontology (GO) and Kyoto Encyclopedia of Genes and
Genomes (KEGG) functional enrichment analyses. Next, the genes
related to programmed cell death from specific source datasets were
intersected with the DEGs in the ceRNA network. These regulatory
pathways were then verified using reverse
transcription-quantitative PCR (RT-qPCR). Immune infiltration
analysis was also performed to characterize the immune environment
resulting from IS (Fig. 1).
Materials and methods
Dataset collection
Two expression profile datasets were downloaded from
the NCBI GEO database (https://www.ncbi.nlm.nih.gov/geo/). The lncRNA and
mRNA dataset GSE58294 was based on the GPL570 platform
[(HG-U133_Plus_2) Affymetrix Human Genome U133 Plus 2.0 Array]
(18), and included 69
cardioembolic stroke samples and 23 healthy control samples. The
miRNA array dataset GSE55937 was obtained using the GPL16384
platform [(miRNA-3) Affymetrix Multispecies miRNA-3 Array]
(19), and contained data for 24
patients with IS and 24 healthy controls.
Differential expression analysis
The limma package (version 3.52.2) (20) in R software (version 4.1.1,
http://www.R-project.org/) (21) was used for differential expression
analysis of lncRNAs, miRNAs and mRNAs between patients with IS and
healthy controls. The selection standard was set to P<0.05 and
|log2 fold change (FC)|>1 as threshold values. The ggplot2
(https://github.com/tidyverse/ggplot2,
version 3.3.6) and pheatmap packages (https://www.rdocumentation.org/packages/pheatmap/versions/1.0.12)
in R software were used for drawing heat maps and volcano maps,
respectively (22).
Immune infiltration analysis
CIBERSORT (https://cibersort.stanford.edu/, version 1.03) was
used for immune cell infiltration analysis. The difference in
immune cell infiltration between IS and control tissues was
analyzed using the corrplot package (https://github.com/taiyun/corrplot, version 0.92) in R
software. The barplot and vioplot were produced by pheatmap and
vioplot (https://github.com/TomKellyGenetics/vioplot, version
0.3.7) packages in R software, respectively, for visualization.
Establishment of the lncRNA-miRNA-mRNA
network
miRNA-lncRNA pairs were identified using the
StarBase database, and miRNA-mRNAs interaction pairs were also
identified using miRDB, TargetScan (https://www.targetscan.org/vert_80/, version 8.0) and
miRTarBase databases (23-28).
Pairs were selected according to whether both the lncRNA and mRNA
were targeted or co-expressed with a common miRNA in the
lncRNA-miRNA-mRNA network. These lncRNA-miRNA-mRNA groups were
recognized as co-expression competing triplets, and the
corresponding ceRNA regulatory network was constructed. Cytoscape
3.9.0 was employed to visualize the ceRNA regulatory networks
(29).
Functional enrichment analysis
GO functional (http://geneontology.org/, version 1.17) annotation and
KEGG (https://www.kegg.jp/, version 100.0)
analyses were performed, and the clusterprofiler package in R
software was applied to predict potential biological functions of
the mRNAs underlying the ceRNA network (30). Gene sets with P<0.05 were
considered greatly enriched, and bar plots and bubble charts, which
were generated using R software, were used to visualize the
results.
Programmed cell death-related gene
identification in the ceRNA network
The differentially expressed mRNAs in the ceRNA
network were compared with the programmed cell death-related genes
from GeneCards (https://www.genecards.org/, version 5.6), and with the
genes related to apoptosis and ferroptosis. A Venn diagram was
generated using R software to visually show the genes common to
each set.
Middle cerebral artery occlusion
(MCAO) model
Adult male Sprague-Dawley rats (2 months old) were
purchased from Qingdao Peng Yue Animal Husbandry Co., Ltd and were
raised at the Experimental Animal Center of Qingdao University.
Experiments were implemented on the rats (n=12; weight, 220±10 g),
which were maintained in a controlled environment (22±2˚C room
temperature, 50-60% humidity and dark/light cycle 12 h/12 h) with
water and chow ad libitum. Animals were randomized into the
following two groups: i) IS rats (n=6), which received MCAO
surgery; and ii) sham rats (n=6), which underwent surgery without
IS. A MCAO model was established according to Zea Longa's method to
evaluate neural function after 24 h (31). Rats were fixed in the supine
position and anesthetized using intraperitoneal injection of 10%
chloral hydrate solution (350 mg/kg) (32). None of the experiment animals
exhibited signs of peritonitis, pain or discomfort. The internal
and external carotid arteries of the common carotid were carefully
isolated, and the proximal common carotid and distal external
carotid arteries were ligated. A nylon bolt was slowly inserted
into the internal carotid artery and secured with a fixation wire.
After 90 min of blood flow occlusion, the bolts were opened, and
reperfusion was performed for 3, 5 and 24 h. Eventually, the wounds
were sutured layer by layer, during which the ambient temperature
was maintained at 37˚C±0.5˚C, and the mice were monitored for
rectal temperature, respiratory rate and heart rate. This animal
experiment was reviewed and approved by the Ethics Committee of
Qingdao Affiliated Hospital (approval no.
20210125SD3620211228015).
RT-qPCR Assay
Following ischemia-reperfusion, the infarct core
area and corresponding cortex were obtained from rats. For RT-qPCR
testing of programmed cell death-related ceRNA network mRNA
expression, total RNA from each sample was extracted using
PureLink™ RNA Mini kit (Invitrogen, Thermo Fisher
Scientific, Inc.). RNA purity was tested using a NanoDrop
ONEc (Thermo Fisher Scientific, Inc.). The total RNA
used Evo M-MLV RT Mix kit with gDNA Clean for qPCR (Hunan Aikerui
Biological Engineering Co., Ltd.) for reverse transcription
reactions; cDNA synthesis was conducted for 15 min at 37˚C and the
reaction was terminated by heating at 85˚C for 5 sec. Subsequently,
the pre-amplified cDNA samples were mixed with SYBR Green Premix
Pro Taq HS qPCR Kit (Hunan Aikerui Biological Engineering Co.,
Ltd.), for which the following thermocycling conditions were
required: One cycle at 95˚C for 30 sec, 40 cycles at 95˚C for 5 sec
and 60˚C for 30 sec. The reaction was conducted on a Quant
Studio™ 3 Real-Time PCR Instrument (Thermo Fisher
Scientific, Inc.). Experiments were repeated in triplicate. GAPDH
was used as an internal reference and the relative expression level
was calculated using the 2-ΔΔCq method (Table I) (33).
 | Table IPrimer sequences of RNAs for reverse
transcription-quantitative PCR. |
Table I
Primer sequences of RNAs for reverse
transcription-quantitative PCR.
| Primer | Species | Primer sequence
(5'-3') |
|---|
| GAPDH | Rat | F'
GCATCTTCTTGTGCAGTGCC |
| | | R'
ACCAGCTTCCCATTCTCAGC |
| BACH1 | Rat | F'
GACTGTGAGGTGAAACTGCCTTT |
| | | R'
GCAGCGATCCTGTTCTTGCT |
| SUOX | Rat | F'
GACTCACTTAAGCCGCAGCAT |
| | | R'
TCCGTGGTGACTCCTGAGAAG |
| ZNF354B | Rat | F'
CATGGATGCTCCTCTCTTGGA |
| | | R'
GTCAGGTCTGCAGGATTTTCCT |
| TGFBR3 | Rat | F'
AGCGCTTCAGCTTCCTGTTC |
| | | R'
TGGTGGCATCGAGAGAAGTG |
| ZBTB5 | Rat | F'
ACTTTCCCAGGTCTGGTTTGG |
| | | R'
CAGAGATCTGTGAGCTCCTGACA |
| RRM2 | Rat | F'
GCATTGAGGAAGAGCCGTTACT |
| | | R'
AGTGCTGAATATCCTTGGAAAGGT |
Statistical analysis
GraphPad Prism 9.0 (GraphPad Software, Inc.)
software was used for graphing and performing statistical analyses.
All data were repeated three times and are presented as the mean ±
standard deviation. Both datasets were analyzed for differentially
expressed genes using one-way ANOVA with Tukey's post hoc test.
P<0.05 was considered to indicate a statistically significant
difference.
Results
Differential expression analysis
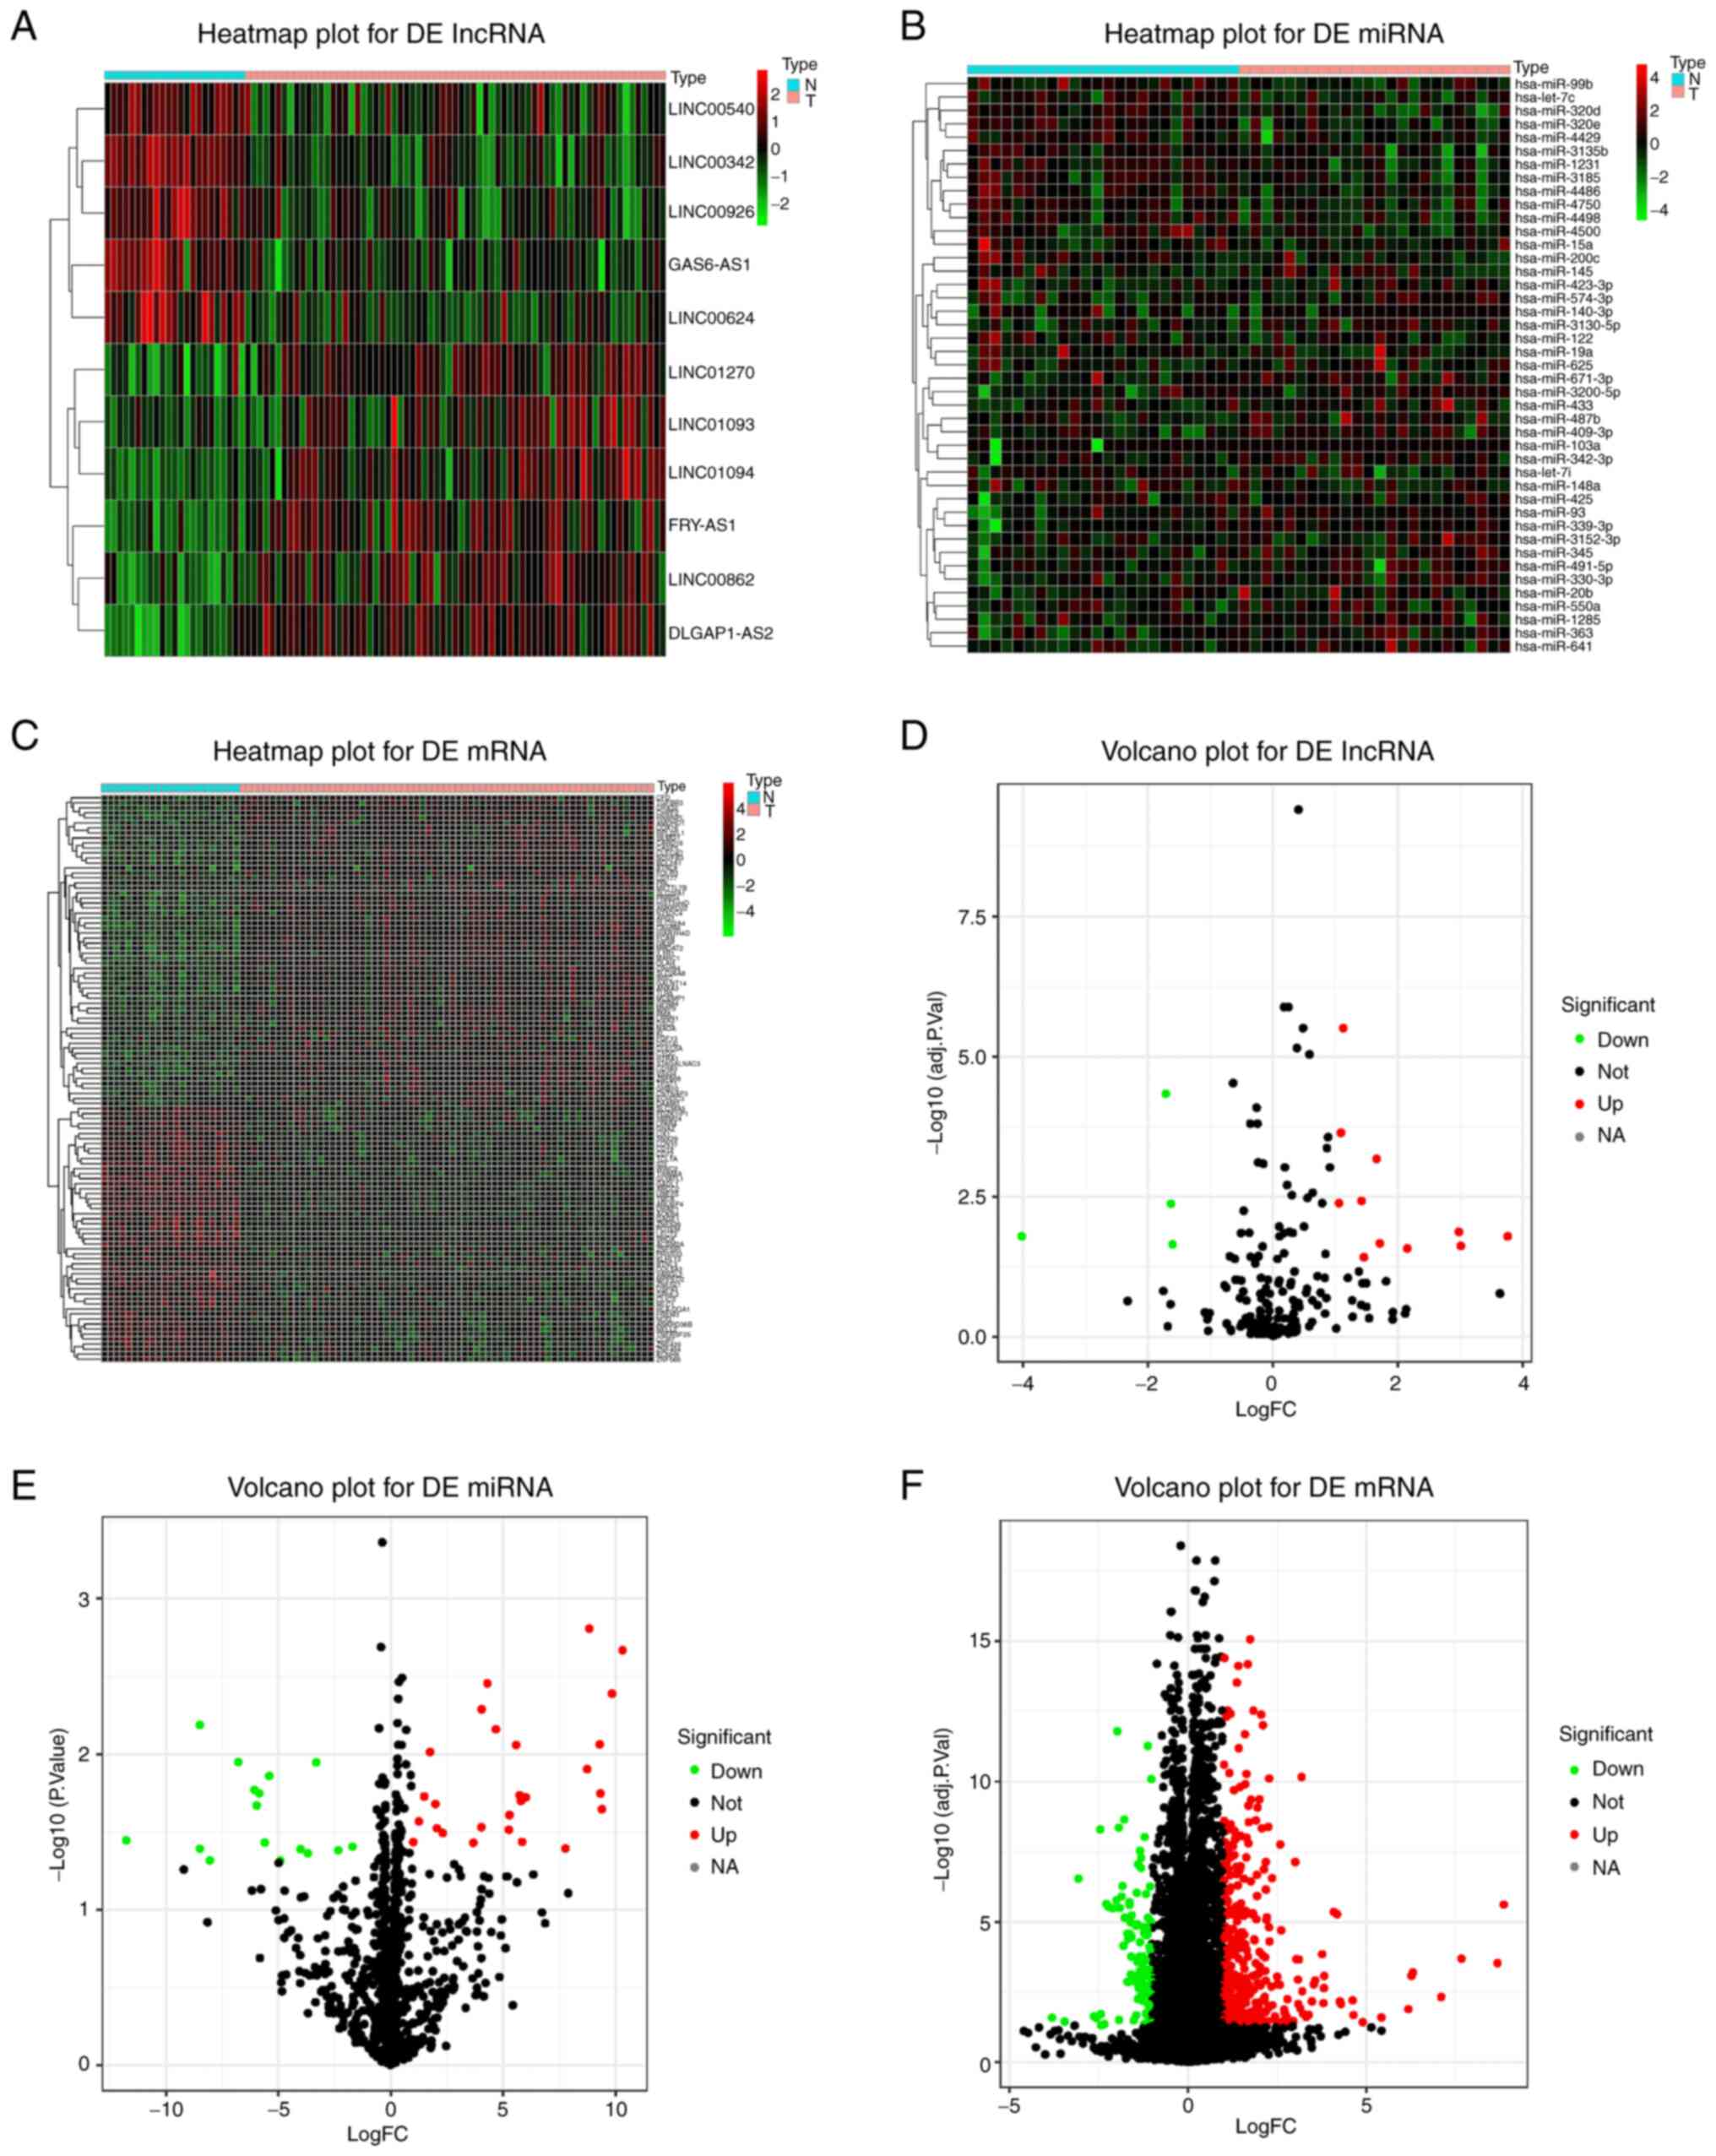
Volcano plots and heat maps of lncRNAs, miRNAs and
mRNAs with differential expression were obtained based on the
comparative analysis of lncRNA, miRNA and mRNA expression profiles
between patients with IS and healthy controls (Fig. 2). Plot criteria of P<0.05 and
|log2 FC|>1 were used as thresholds for significant differential
expression. Altogether, 15 lncRNAs (11 upregulated and four
downregulated), 43 miRNAs (27 upregulated and 16 downregulated) and
463 mRNAs (347 upregulated and 116 downregulated) were identified
as genes differentially expressed between patients with IS and
healthy controls (Table II,
Table III and Table IV; top 30 mRNAs are listed in
Table IV).
| Table IIIdentification of differentially
expressed lncRNA in ischemic stroke. |
Table II
Identification of differentially
expressed lncRNA in ischemic stroke.
| A, Upregulated
differentially expressed lncRNA |
|---|
| lncRNA | logFC | P-value |
|---|
| ASAP1-IT2 | 1.114 | <0.001 |
| THUMPD3-AS1 | 1.097 | <0.001 |
| LINC00266-1 | 1.668 | <0.001 |
| DLEU2L | 1.428 | <0.001 |
| IQCH-AS1 | 1.066 | <0.001 |
| ERVK13-1 | 2.985 | 0.002 |
| ATP1A1-AS1 | 3.766 | 0.003 |
| LINC00189 | 3.016 | 0.005 |
| HYMAI | 1.721 | 0.004 |
| C20orf197 | 2.158 | 0.006 |
| SNRK-AS1 | 1.465 | 0.011 |
| B, Downregulated
differentially expressed lncRNA |
| IncRNAs | logFC | P-value |
| LINC00342 | -1.706 | <0.001 |
| HOXB-AS1 | -1.622 | <0.001 |
| LINC00565 | -1.598 | 0.004 |
| LINC00920 | -4.013 | 0.003 |
| Table IIIIdentification of differentially
expressed miRNA in ischemic stroke. |
Table III
Identification of differentially
expressed miRNA in ischemic stroke.
| A, Upregulated
differentially expressed miRNA |
|---|
| miRNA | logFC | P-value |
|---|
| hsa-miR-140-3p | 8.843 | 0.002 |
| hsa-miR-145 | 10.319 | 0.002 |
|
hsa-miR-3130-5p | 4.309 | 0.004 |
| hsa-miR-99b | 9.857 | 0.004 |
| hsa-miR-330-3p | 4.053 | 0.005 |
| hsa-miR-425 | 4.690 | 0.007 |
| hsa-miR-409-3p | 9.304 | 0.009 |
| hsa-miR-550a | 5.588 | 0.009 |
| hsa-miR-363 | 1.761 | 0.010 |
| hsa-miR-339-3p | 8.747 | 0.013 |
| hsa-miR-93 | 9.339 | 0.018 |
| hsa-miR-625 | 5.741 | 0.018 |
| hsa-miR-641 | 1.500 | 0.019 |
| hsa-miR-574-3p | 6.021 | 0.019 |
| hsa-miR-103a | 5.800 | 0.020 |
| hsa-miR-671-3p | 1.998 | 0.021 |
| hsa-miR-342-3p | 9.402 | 0.023 |
| hsa-miR-1285 | 5.294 | 0.025 |
| hsa-miR-433 | 1.264 | 0.027 |
| hsa-miR-491-5p | 4.041 | 0.030 |
| hsa-miR-20b | 2.064 | 0.030 |
|
hsa-miR-3200-5p | 5.262 | 0.031 |
| hsa-miR487b | 2.319 | 0.032 |
| hsa-miR345 | 5.854 | 0.037 |
|
hsa-miR-3152-3p | 1.011 | 0.037 |
| hsa-miR-200c | 3.685 | 0.037 |
| hsa-miR-423-3p | 7.780 | 0.041 |
| B, Downregulated
differentially expressed miRNA |
| miRNA | logFC | P-value |
| hsa-miR-3135b | -8.480 | 0.007 |
| hsa-miR-320d | -6.770 | 0.011 |
| hsa-miR-148a | -3.303 | 0.011 |
| hsa-miR-320e | -5.395 | 0.014 |
| hsa-miR-1231 | -6.055 | 0.017 |
| hsa-miR-122 | -5.834 | 0.018 |
| hsa-miR-4429 | -5.949 | 0.021 |
| hsa-let-7i | -11.751 | 0.036 |
| hsa-miR-3185 | -5.591 | 0.037 |
| hsa-miR-4500 | -1.691 | 0.039 |
| hsa-miR-15a | -8.475 | 0.041 |
| hsa-miR-4486 | -3.999 | 0.041 |
| hsa-miR-4498 | -2.322 | 0.042 |
| hsa-miR-19a | -3.672 | 0.044 |
| hsa-let-7c | -8.036 | 0.048 |
| hsa-miR-4750 | -4.902 | 0.049 |
| Table IVIdentification of differentially
expressed mRNA (Top 30) in ischemic stroke. |
Table IV
Identification of differentially
expressed mRNA (Top 30) in ischemic stroke.
| A, Upregulated
differentially expressed mRNA |
|---|
| mRNA | logFC | P-value |
|---|
| MAF | 8.870 | <0.001 |
| BACH1 | 8.691 | <0.001 |
| HTRA1 | 7.681 | <0.001 |
| ZNF354B | 7.114 | 0.001 |
| PTX3 | 6.322 | <0.001 |
| ZSWIM3 | 6.281 | <0.001 |
| NCAPG | 6.193 | 0.004 |
| ZNF174 | 5.434 | 0.010 |
| SPR | 4.914 | 0.016 |
| PLB1 | 4.653 | 0.008 |
| REX02 | 4.626 | 0.002 |
| TGFA | 4.298 | 0.003 |
| GASP2 | 4.270 | 0.002 |
| PPFIA1 | 4.193 | <0.001 |
| SLC39A6 | 4.100 | <0.001 |
| FUT7 | 3.832 | <0.001 |
| AMDHD1 | 3.822 | <0.001 |
| TFRC | 3.811 | 0.002 |
| ITPKC | 3.775 | <0.001 |
| C8orf58 | 3.578 | <0.001 |
| TSPAN7 | 3.538 | <0.001 |
| C9orf84 | 3.488 | 0.002 |
| OSBPL1A | 3.399 | 0.008 |
| RBM41 | 3.328 | 0.009 |
| COPS8 | 3.239 | 0.007 |
| CCDC88A | 3.217 | <0.001 |
| PRR3 | 3.197 | <0.001 |
| SCAMP1 | 3.161 | 0.004 |
| KIF11 | 3.123 | <0.001 |
| TRNT1 | 3.104 | 0.003 |
| B, Downregulated
differentially expressed mRNA |
| mRNA | logFC | P-value |
| ABL1 | -1.004 | 0.016 |
| MYH3 | -1.005 | 0.001 |
| MFSD12 | -1.007 | <0.001 |
| ZC3H8 | -1.008 | <0.001 |
| TUT1 | -1.016 | <0.001 |
| BACH2 | -1.018 | 0.001 |
| HBQ1 | -1.026 | <0.001 |
| SNX29 | -1.029 | 0.006 |
| NIPSNAP1 | -1.033 | <0.001 |
| IL11RA | -1.049 | <0.001 |
| NOG | -1.051 | <0.001 |
| ELP5 | -1.053 | <0.001 |
| SURF2 | -1.057 | <0.001 |
| HPS4 | -1.058 | <0.001 |
| KANK3 | -1.064 | 0.005 |
| PPIL1 | -1.065 | <0.001 |
| ZBTB5 | -1.071 | <0.001 |
| MAP2K2 | -1.077 | <0.001 |
| KAT2A | -1.081 | 0.014 |
| CCDC85C | -1.081 | <0.001 |
| KCNN4 | -1.089 | <0.001 |
| GGA2 | -1.089 | 0.003 |
| BANK1 | -1.102 | <0.001 |
| ABCA3 | -1.104 | 0.021 |
| SPSB2 | -1.104 | 0.003 |
| CBFA2T2 | -1.110 | <0.001 |
| PASK | -1.113 | 0.020 |
| WDR46 | -1.114 | <0.001 |
| BCL2L12 | -1.115 | 0.007 |
| GTF3C1 | -1.116 | <0.001 |
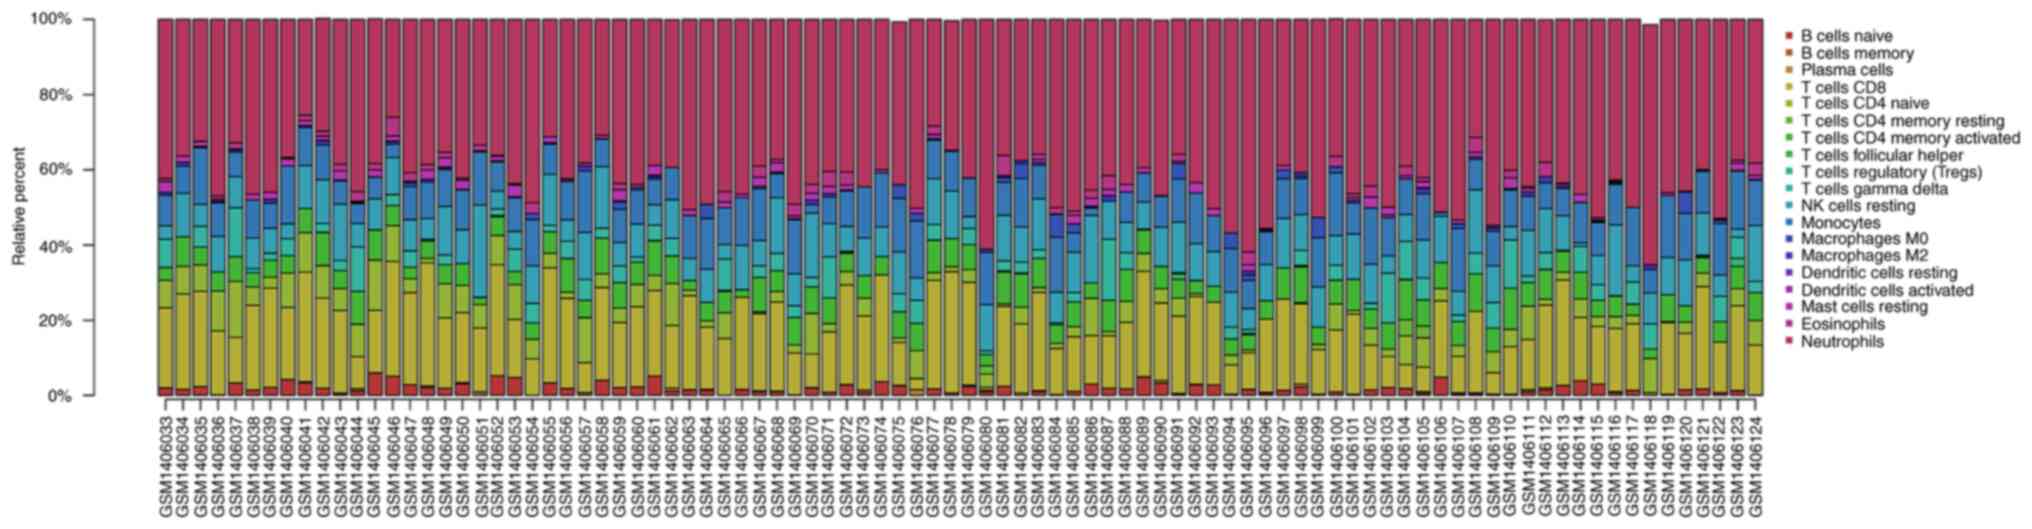
Analysis of infiltrated immune cells
in ischemic stroke tissues from the GEO expression array
dataset
The proportion of infiltrating immune cells in IS
tissue was investigated using GEO expression array data. A total of
92 samples were analyzed using CIBERSORT (P<0.05). As presented
in Fig. 3, there were 19
subpopulations of immune cells in 69 stroke samples and 23 healthy
control samples. Different colors represent different types of
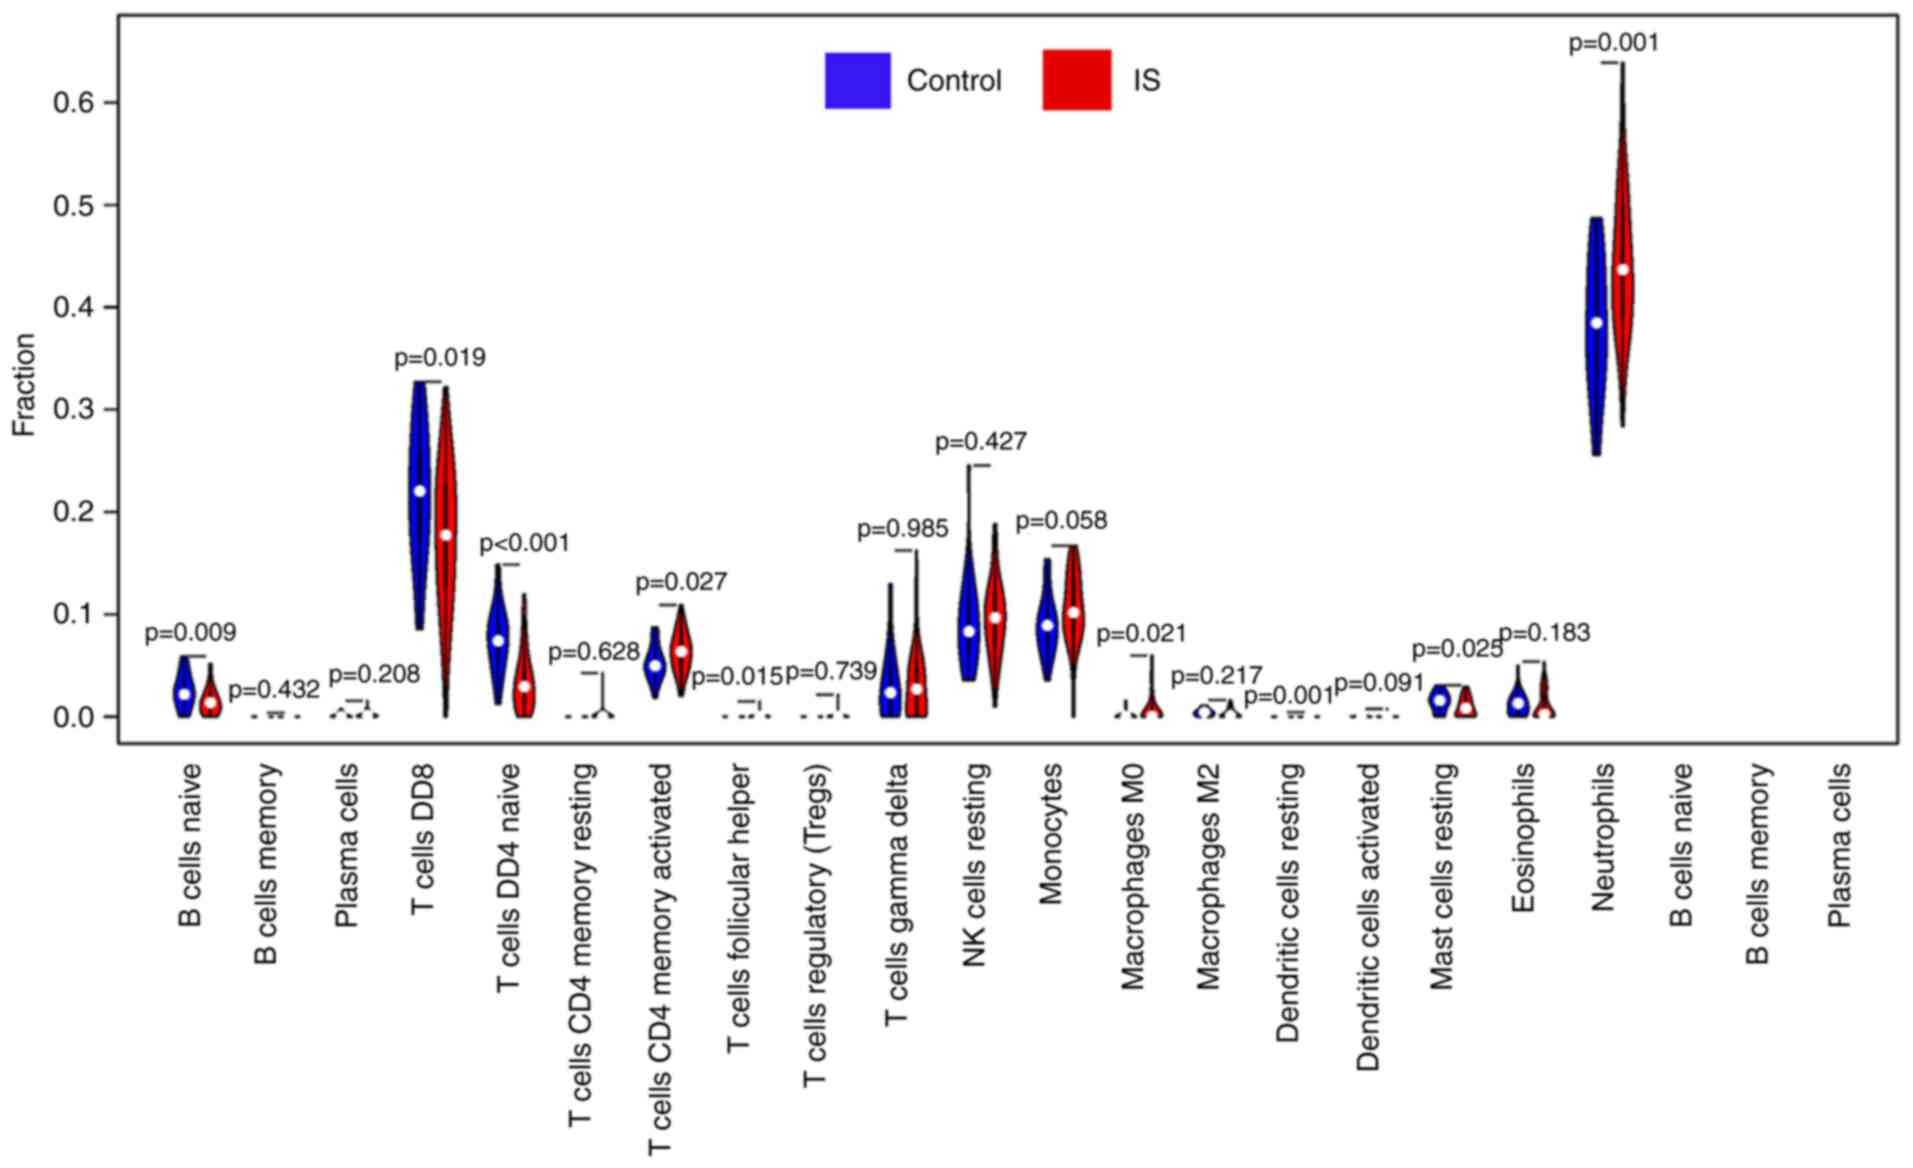
immune cells. Compared with normal tissue, the violin plot of the
immune cells demonstrated that ‘T cells CD4 memory-activated’, ‘T
cells follicular helper’, ‘macrophages M0’ and ‘neutrophils’
infiltrated statistically more, while ‘B cells naive’, ‘T cells
CD8’, ‘T cells CD4 naive’ and ‘mast cells resting’ infiltrated
statistically less in IS tissue compared with control tissue
(Fig. 4).
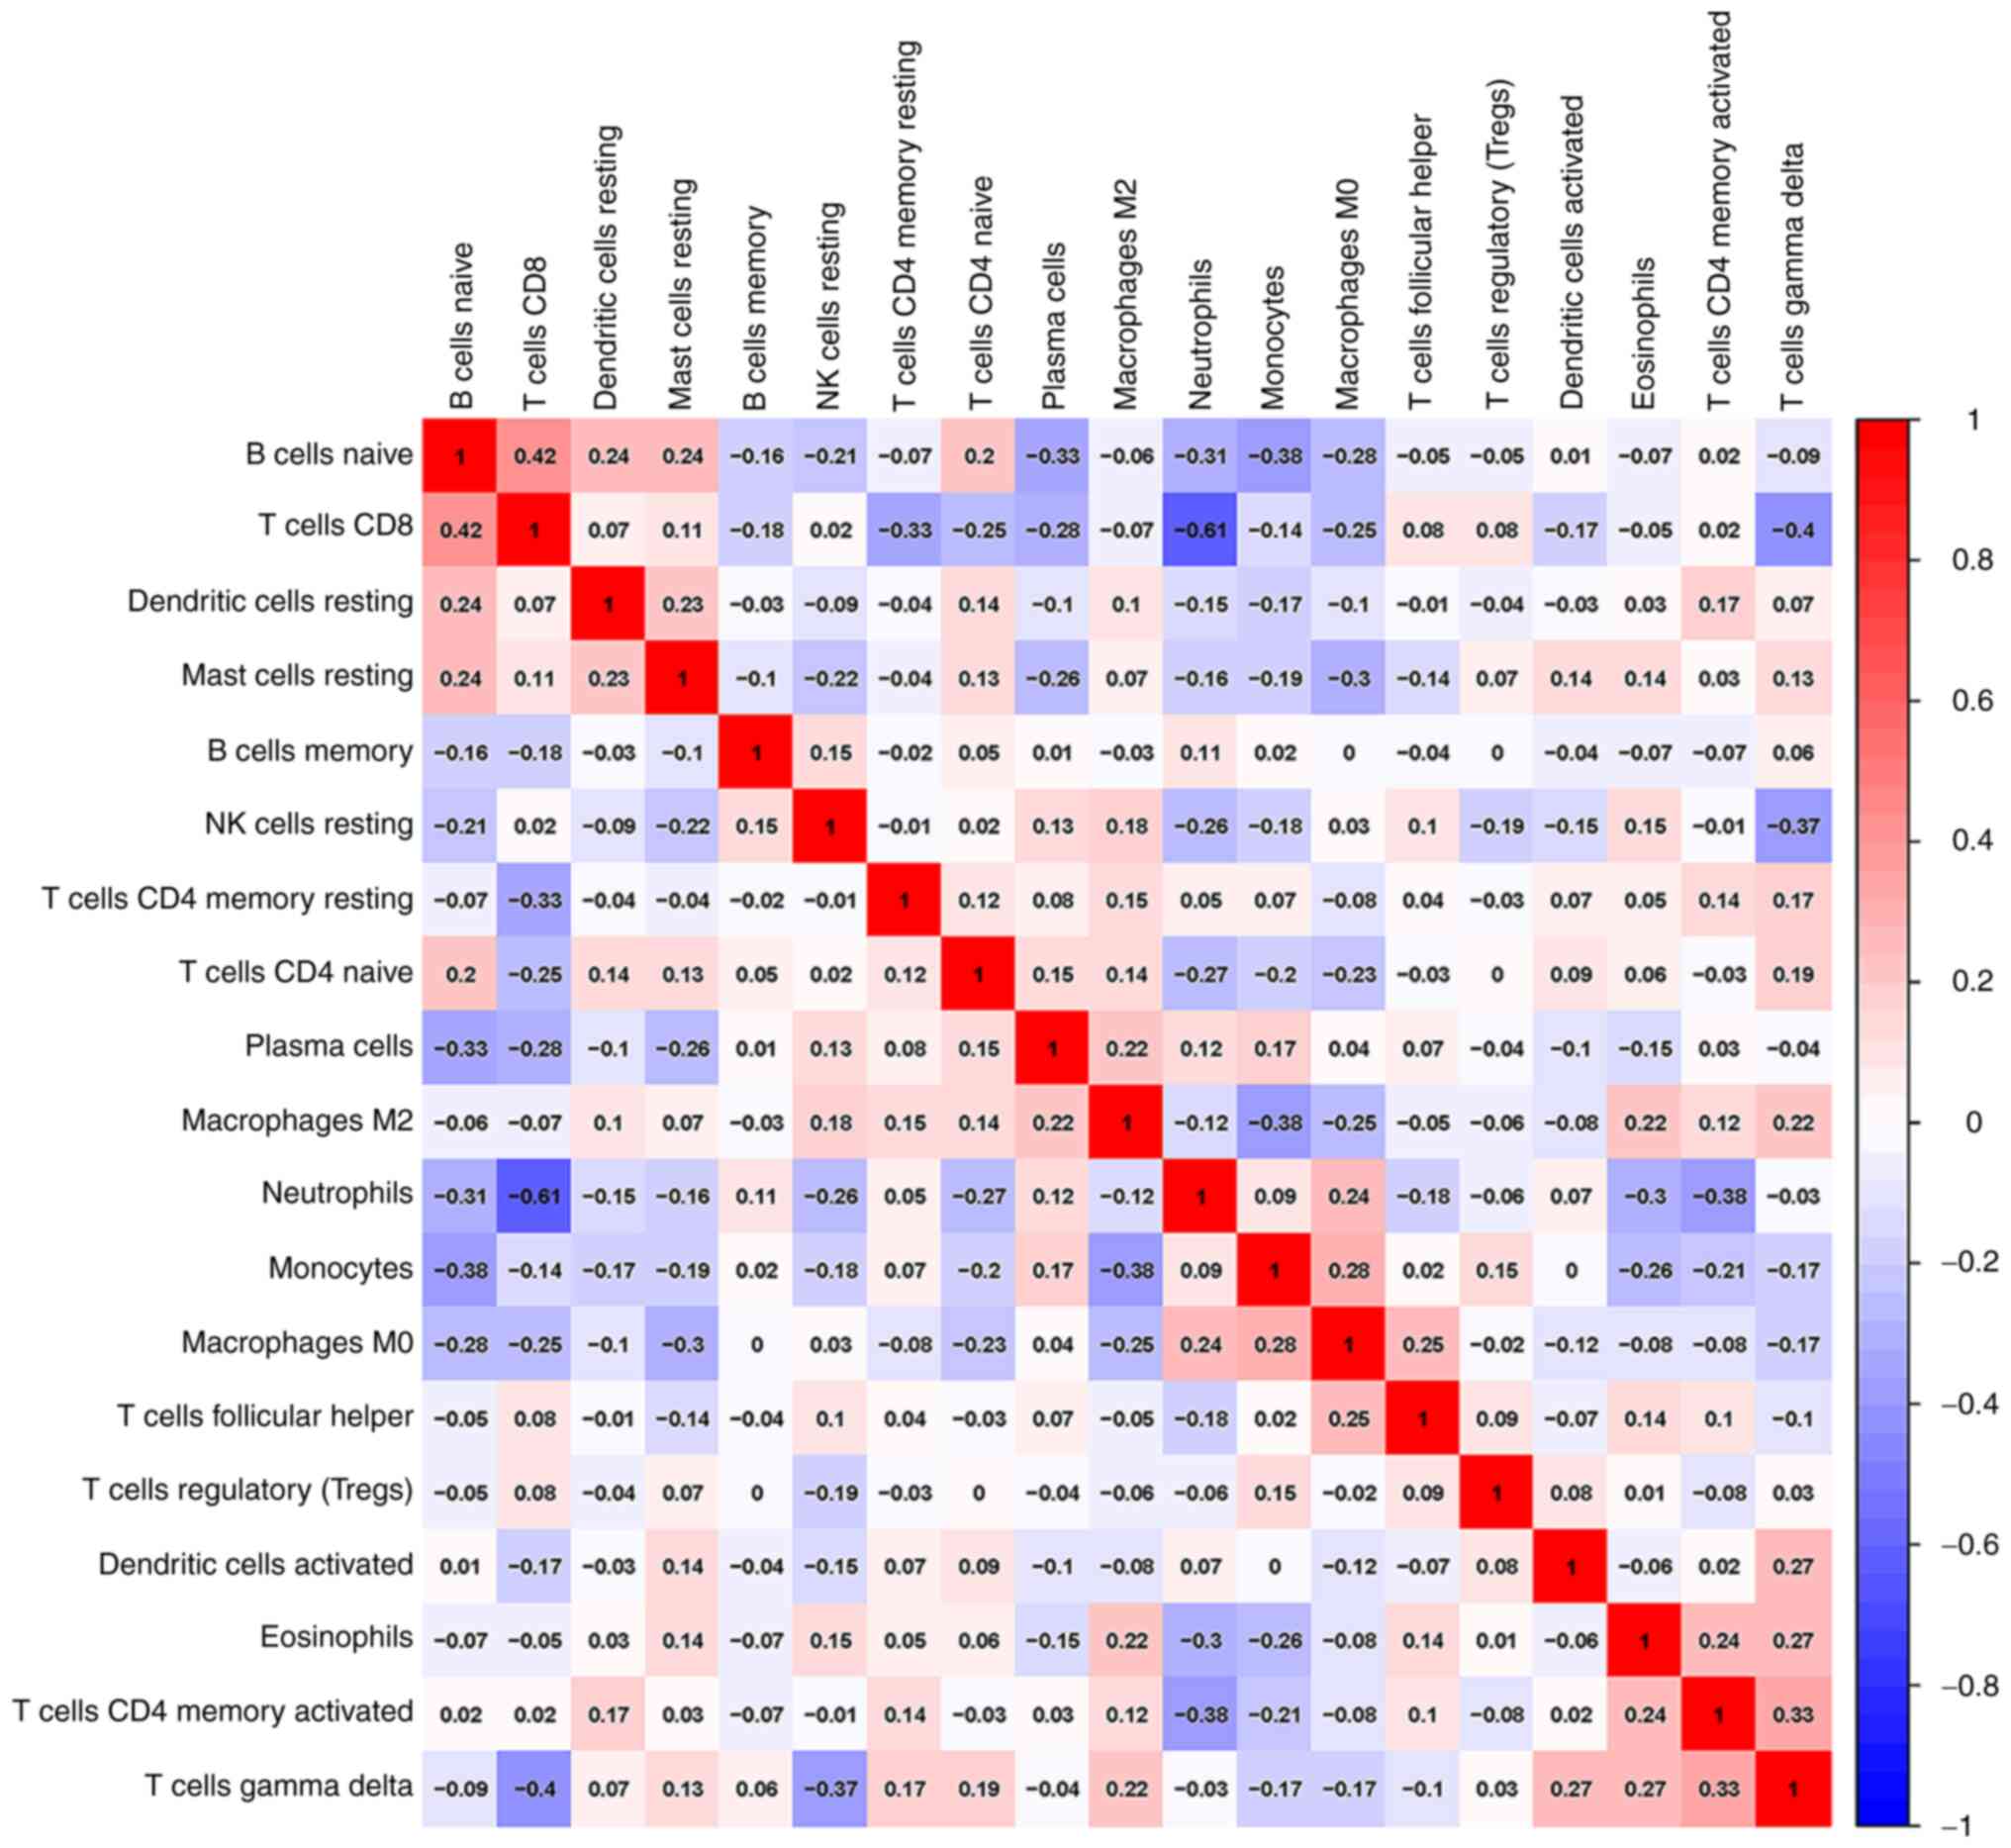
In addition, a correlation analysis of immune cells
infiltrating IS revealed multiple pairs of immune cells that were
either positively or negatively correlated (Fig. 5). The score indicated the degree of
relevance: The bigger size of the numbers statistics data
represented the more positive or negative the correlation. This
result suggested that CD8 T cells and naive B cells had a positive
correlation (value=0.42). Conversely, CD8 T cells and neutrophils
indicated a significant correlation (value=-0.61).
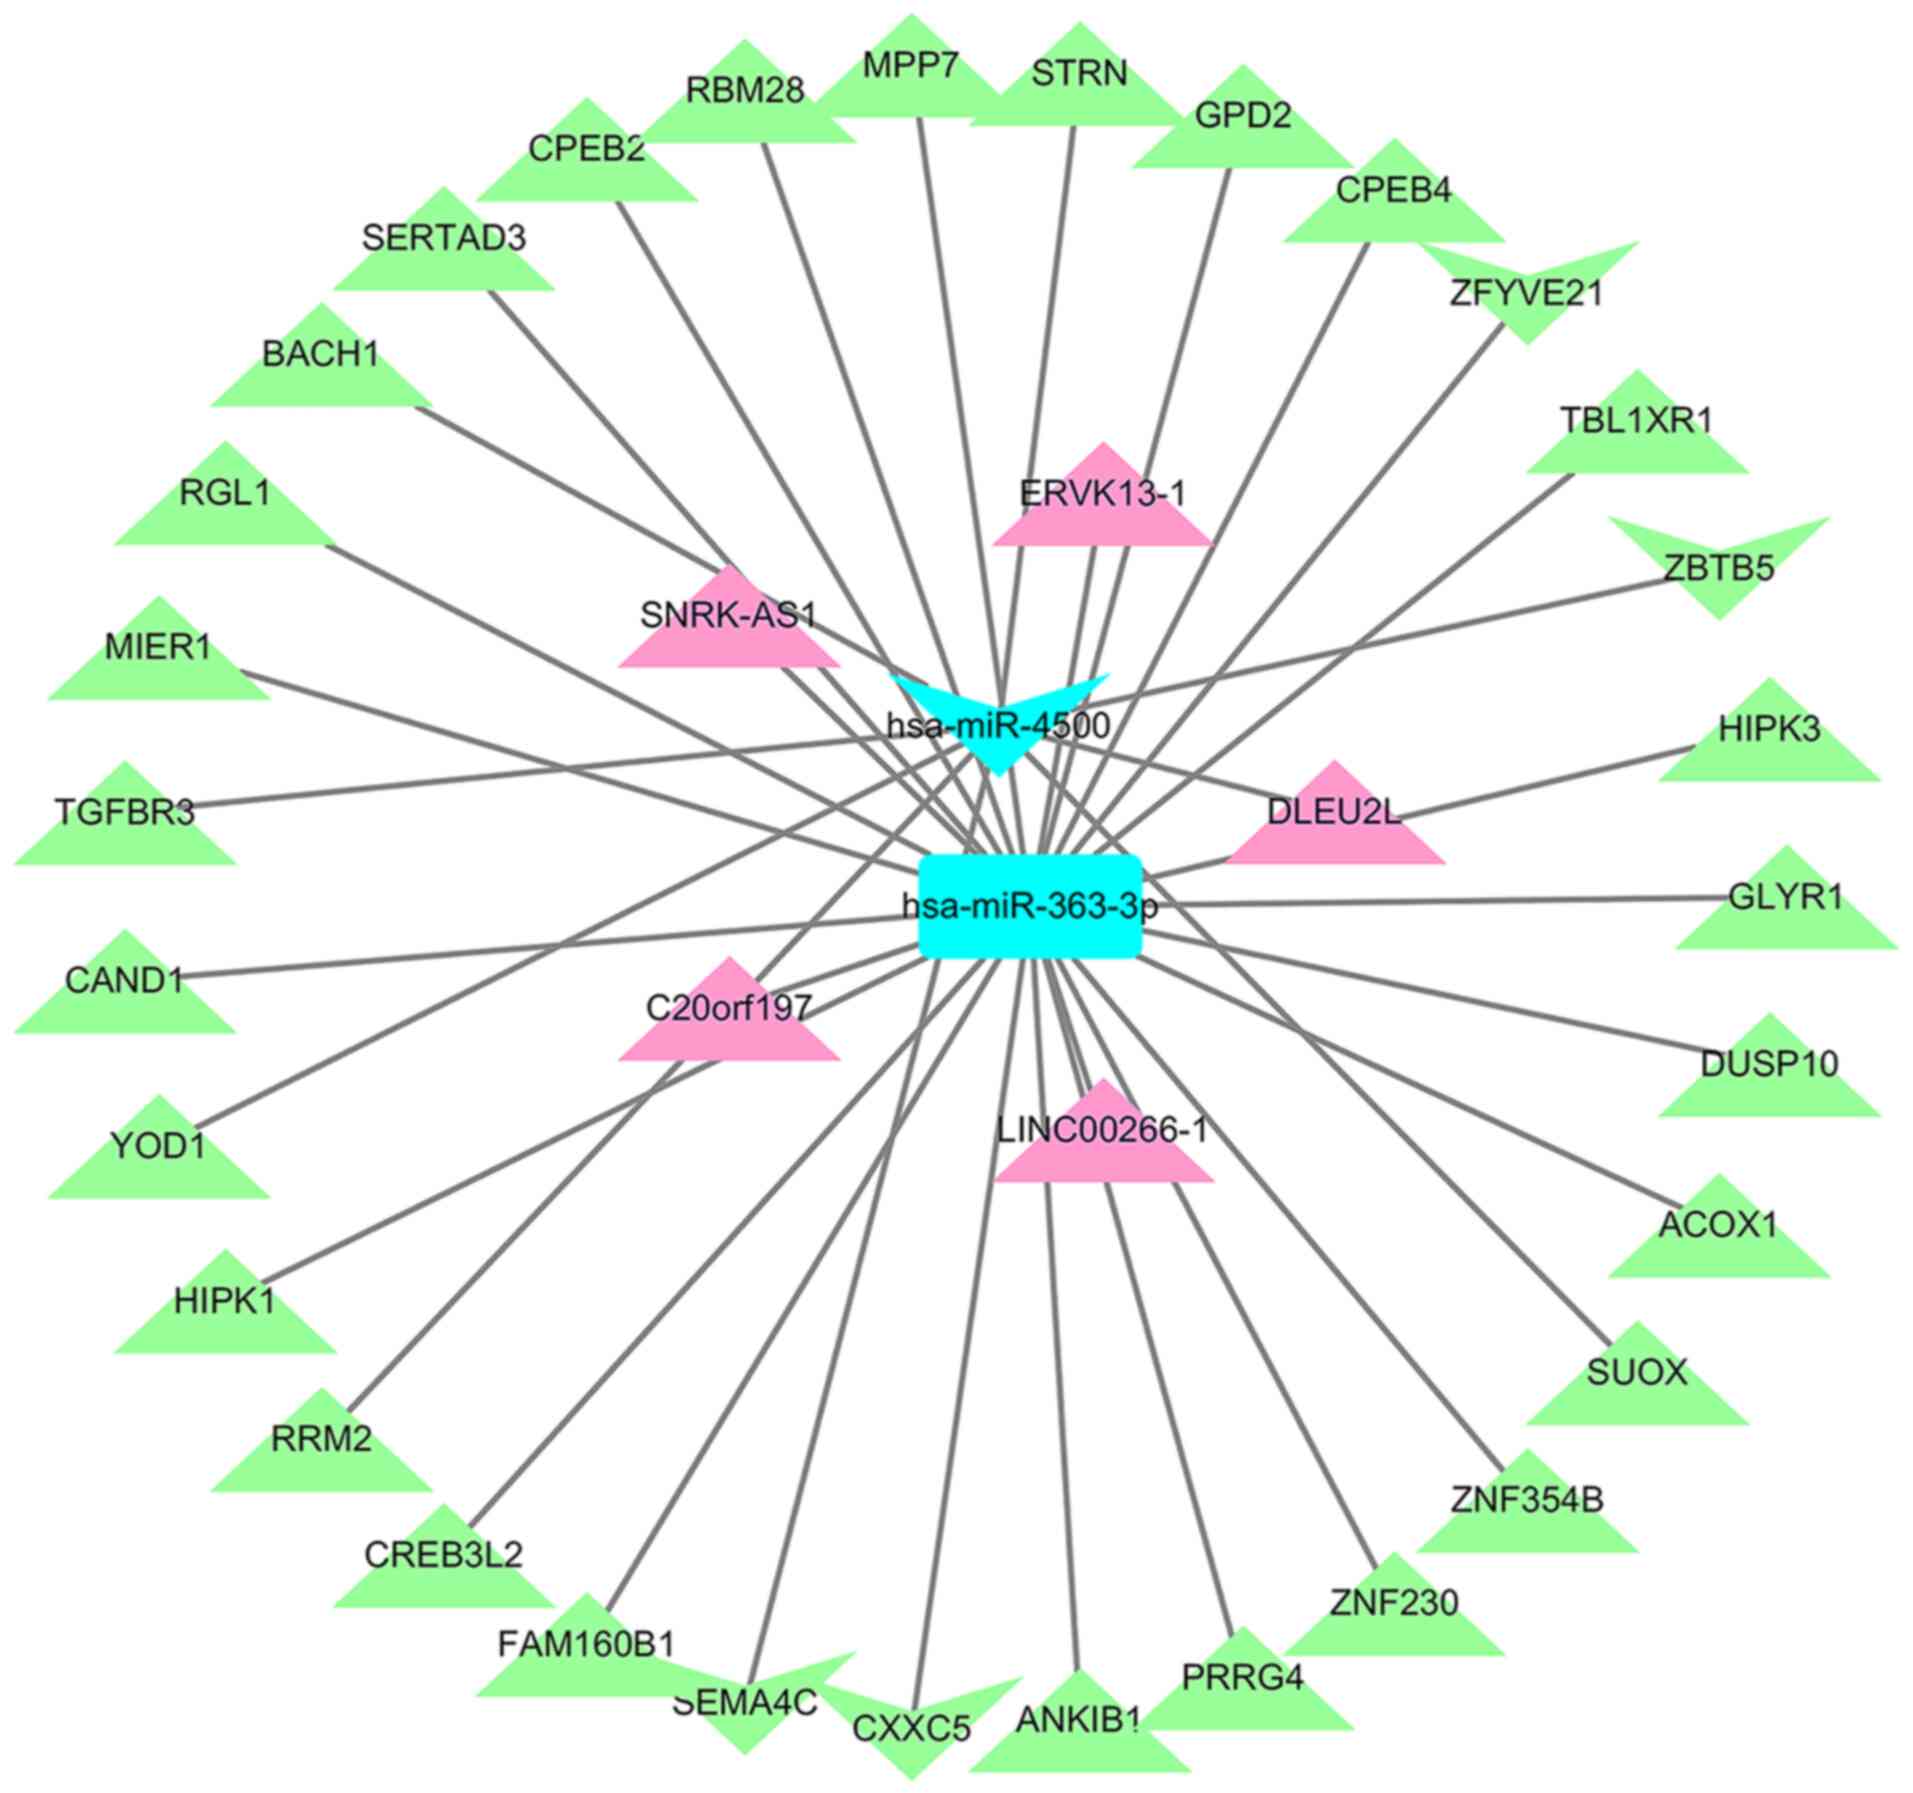
LncRNA-miRNA-mRNA ceRNA network
construction
Based on interacting elements, five miRNA-lncRNA
pairs and 31 miRNA-mRNA pairs were identified in the ceRNA network.
After predicting lncRNA-miRNA and miRNA-mRNA pairs, the
interactions were visualized using Cytoscape. This established the
lncRNA-miRNA-mRNA ceRNA network, with lncRNA DLEU2L linked to one
differentially expressed microRNA (DEmiR) and eight DEGs, and
lncRNA LINC00266-1 linked to one DEmiR and 23 DEGs (Fig. 6).
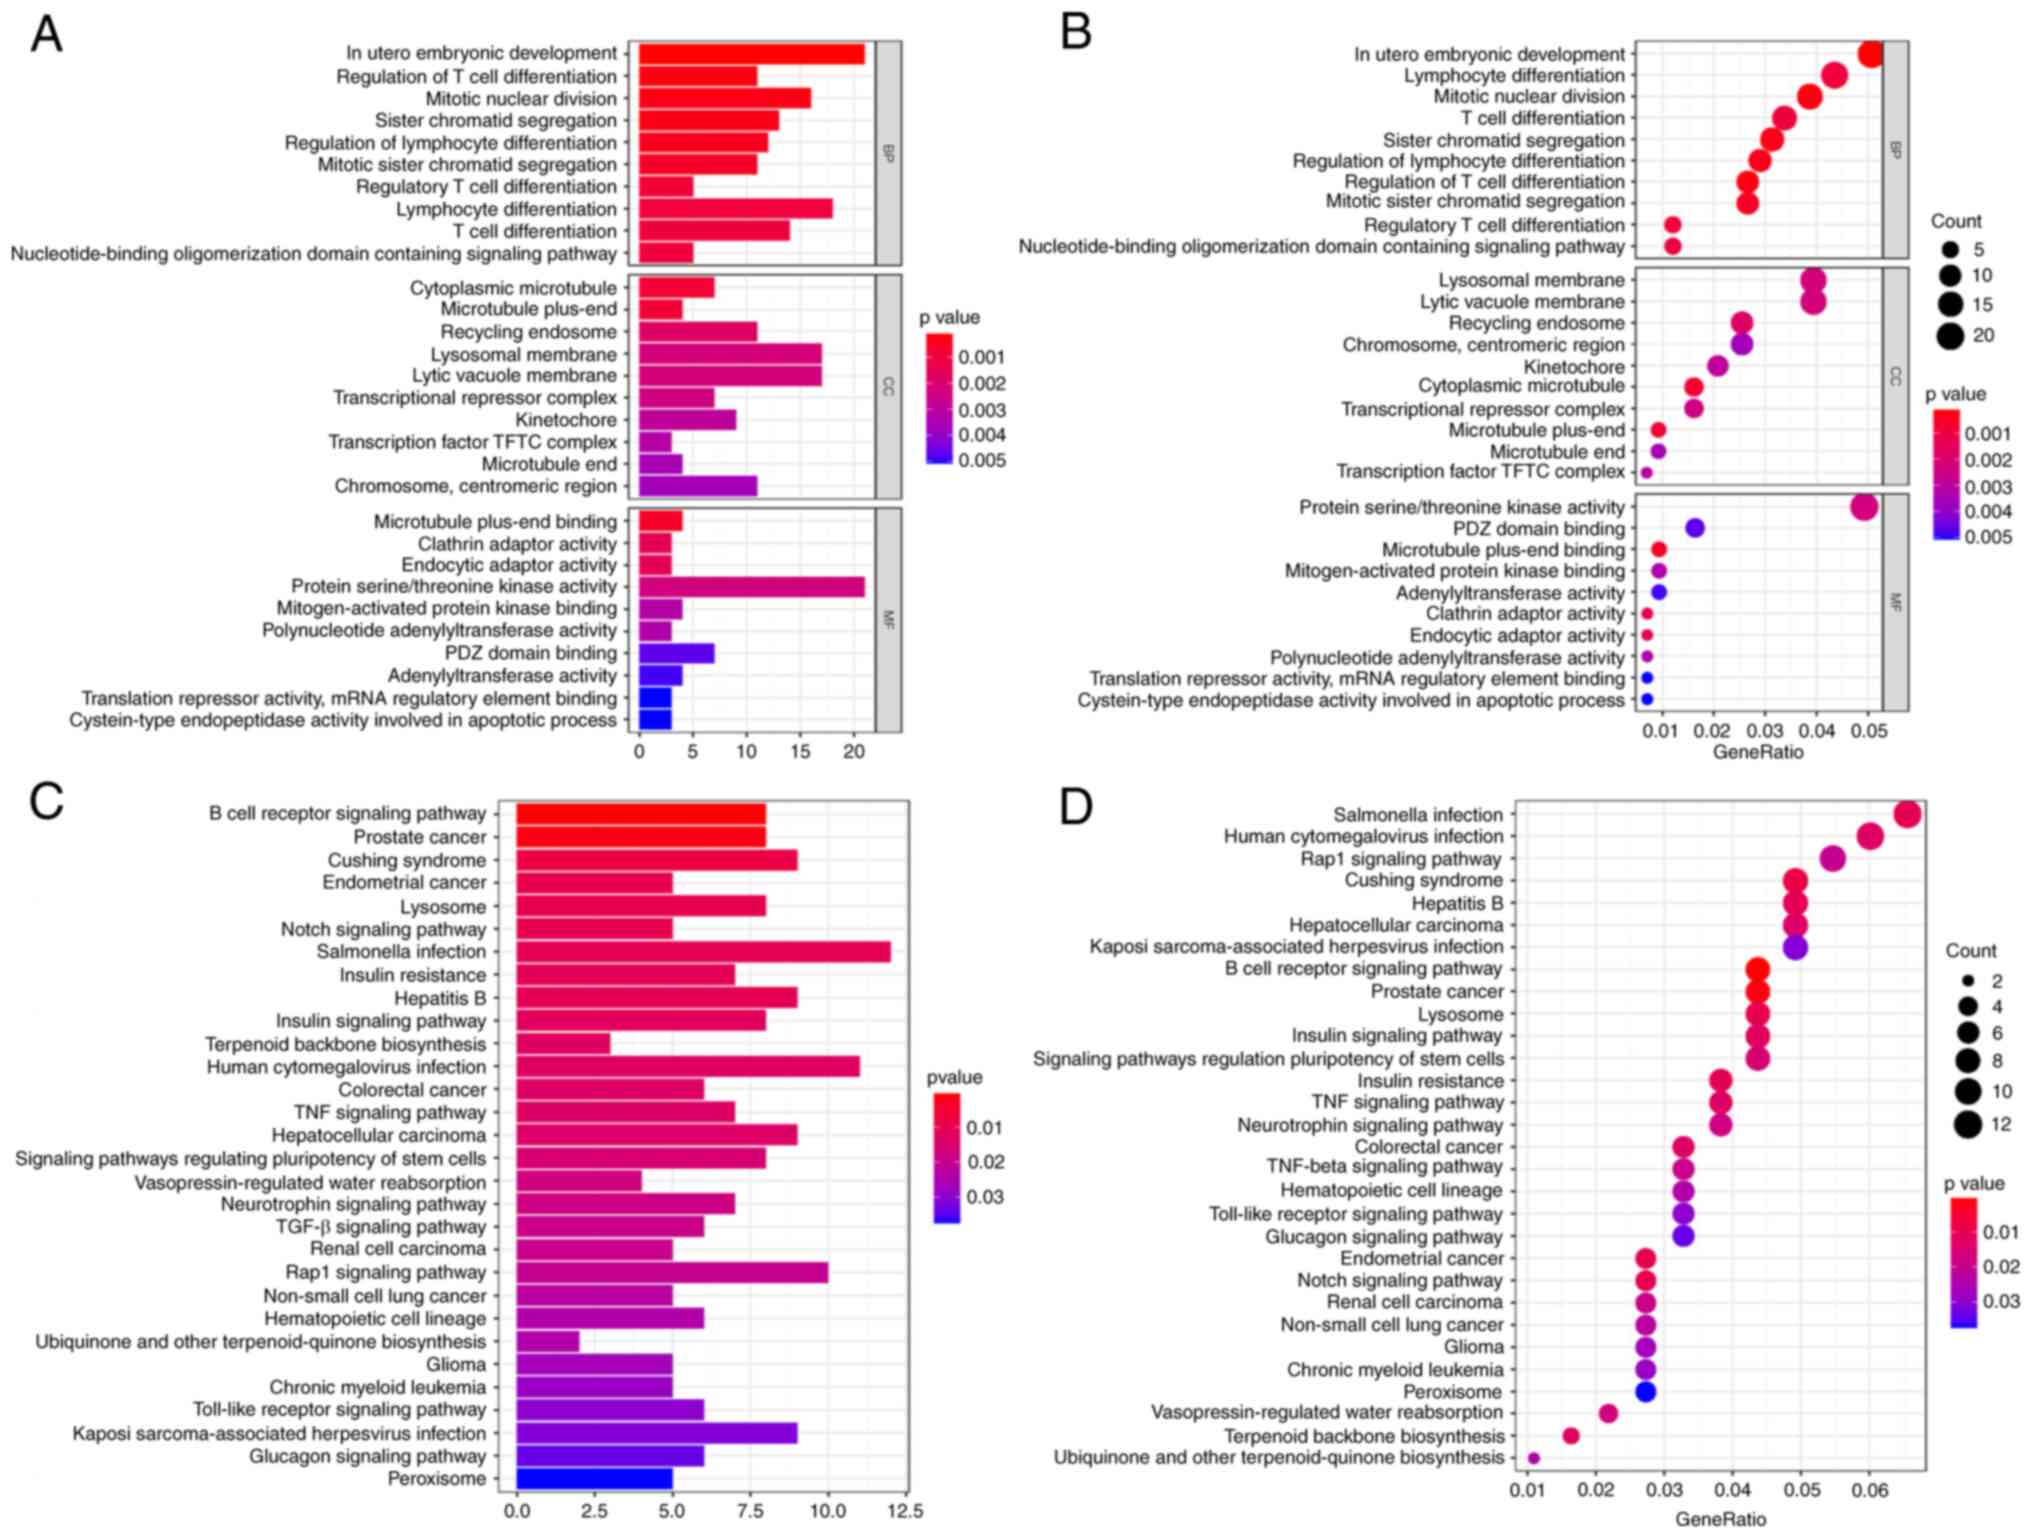
GO and KEGG functional enrichment
analysis
The clusterprofiler package in the R software was
adopted for functional enrichment analysis to improve the
exploration of the potential biological functions genes expressed
in the ceRNA network. The results indicated that differentially
expressed mRNAs were partly enriched in the following categories:
‘In utero embryonic development’ (biological process), ‘lysosomal
membrane’ (cellular component), ‘lytic vacuole membrane’ (cellular
component), ‘protein serine/threonine kinase activity’ (molecular
function) and mRNA interactions of the ceRNA network (Fig. 7A and B). Furthermore, KEGG pathways revealed
that differentially expressed mRNAs were associated with
‘salmonella infection’, ‘human cytomegalovirus infection’ and the
‘Ras-proximate-1 signaling pathway’ in the ceRNA network (Fig. 7C and D).
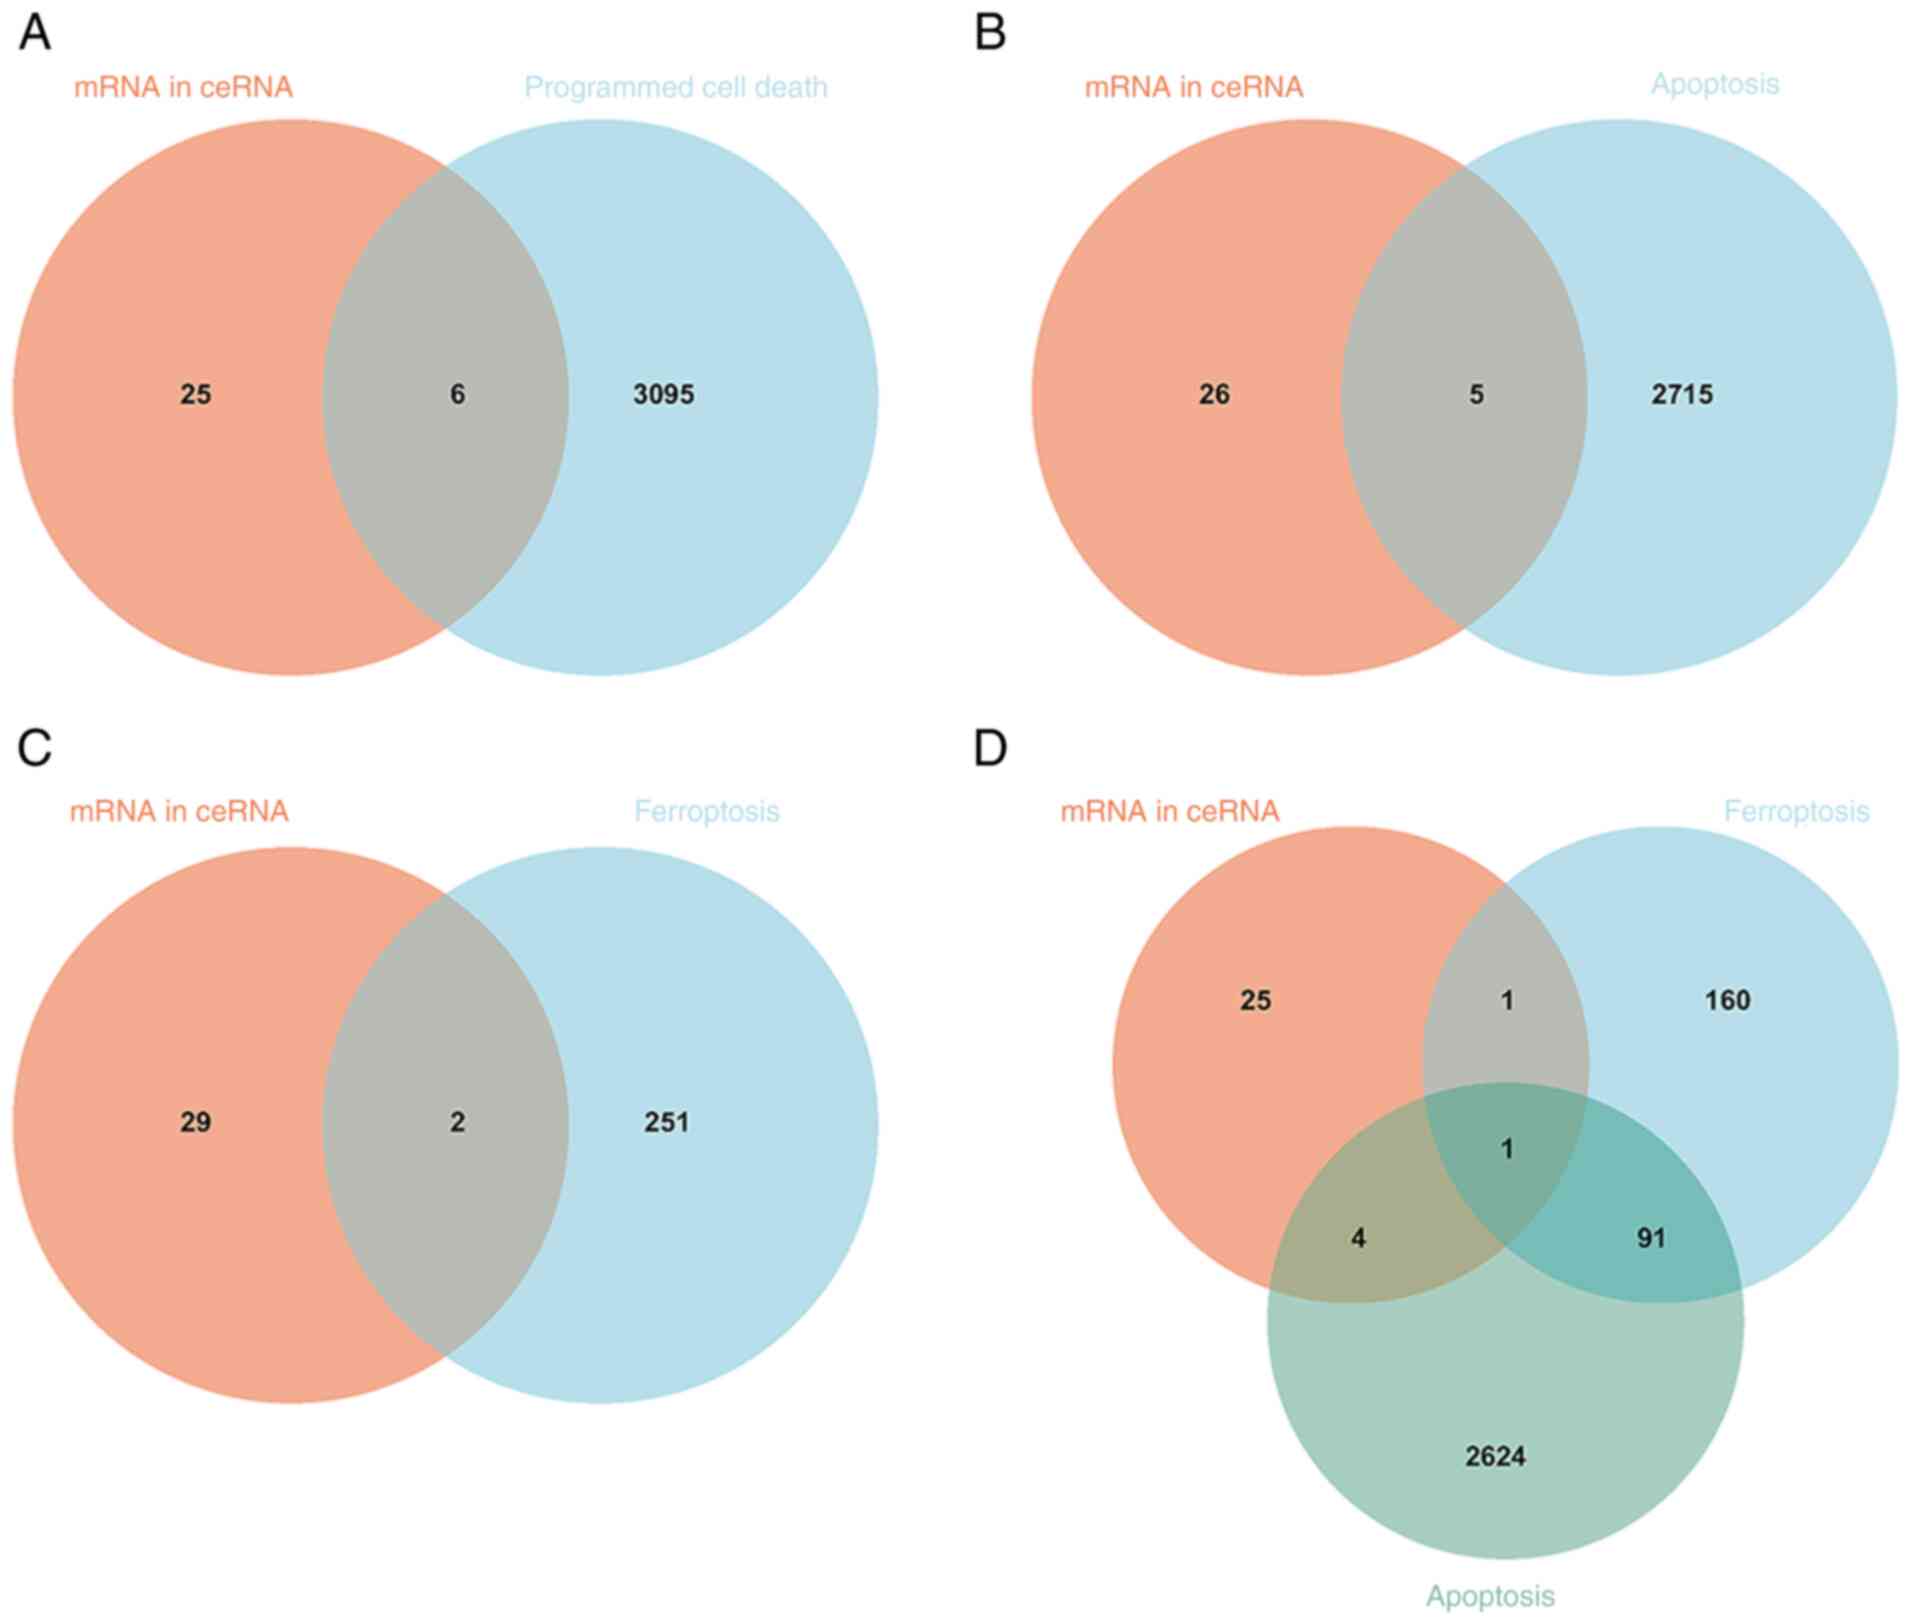
Programmed cell death-related genes in
the ceRNA network
In the ceRNA network, 31 differentially expressed
mRNAs were intersected with 3,101 programmed cell death-related
genes from GeneCards, resulting in six common genes (Fig. 8A; Table V. Next, 31 differentially expressed
mRNAs in the ceRNA network interacted with 2,720 apoptosis-related
genes in GeneCards and five common genes were obtained (Fig. 8B; Table V). A similar analysis for
ferroptosis identified two common genes in the ceRNA network
(Fig. 8C; Table V). A common gene was obtained
through interacting with 31 differentially expressed mRNAs in the
ceRNA network, 2,720 apoptosis-related genes and 253
ferroptosis-related genes (Fig.
8D; Table V).
| Table VIdentified lncRNA-mediated ceRNAs and
the intersection between programmed cell death related genes and
mRNA in the ceRNA networks. |
Table V
Identified lncRNA-mediated ceRNAs and
the intersection between programmed cell death related genes and
mRNA in the ceRNA networks.
| lncRNA | miRNA | mRNA | Programmed cell
death | Apoptosis | Ferroptosis |
|---|
| DLEU2L | hsa-miR-4500 | SUOX | X | X | |
| DLEU2L | hsa-miR-4500 | SEMA4C | | | |
| DLEU2L | hsa-miR-4500 | RRM2 | X | | X |
| DLEU2L | hsa-miR-4500 | YOD1 | | | |
| DLEU2L | hsa-miR-4500 | TGFBR3 | X | X | |
| DLEU2L | hsa-miR-4500 | BACH1 | X | X | X |
| DLEU2L | hsa-miR-4500 | STRN | | | |
| DLEU2L | hsa-miR-4500 | ZBTB5 | X | X | |
| LINC00266-1 | hsa-miR-363-3p | GLYR1 | | | |
| LINC00266-1 | hsa-miR-363-3p | DUSP10 | | | |
| LINC00266-1 | hsa-miR-363-3p | ACOX1 | | | |
| LINC00266-1 | hsa-miR-363-3p | ZNF354B | X | X | |
| LINC00266-1 | hsa-miR-363-3p | ZNF230 | | | |
| LINC00266-1 | hsa-miR-363-3p | PRRG4 | | | |
| LINC00266-1 | hsa-miR-363-3p | ANKIB1 | | | |
| LINC00266-1 | hsa-miR-363-3p | CXXC5 | | | |
| LINC00266-1 | hsa-miR-363-3p | FAM160B1 | | | |
| LINC00266-1 | hsa-miR-363-3p | CREB3L2 | | | |
| LINC00266-1 | hsa-miR-363-3p | HIPK1 | | | |
| LINC00266-1 | hsa-miR-363-3p | CAND1 | | | |
| LINC00266-1 | hsa-miR-363-3p | MIER1 | | | |
| LINC00266-1 | hsa-miR-363-3p | RGL1 | | | |
| LINC00266-1 | hsa-miR-363-3p | SERTAD3 | | | |
| LINC00266-1 | hsa-miR-363-3p | CPEB2 | | | |
| LINC00266-1 | hsa-miR-363-3p | RBM28 | | | |
| LINC00266-1 | hsa-miR-363-3p | MPP7 | | | |
| LINC00266-1 | hsa-miR-363-3p | GPD2 | | | |
| LINC00266-1 | hsa-miR-363-3p | CPEB4 | | | |
| LINC00266-1 | hsa-miR-363-3p | ZFYVE21 | | | |
| LINC00266-1 | hsa-miR-363-3p | TBL1XR1 | | | |
| LINC00266-1 | hsa-miR-363-3p | HIPK3 | | | |
| C20orf197 | hsa-miR-363-3p | | | | |
| SNRK-AS1 | hsa-miR-363-3p | | | | |
| ERVK13-1 | hsa-miR-363-3p | | | | |
Potential biomarker expression genes
in the programmed cell death regulatory pathways by RT-qPCR
A total of six genes were selected for RT-qPCR
testing to validate the programmed cell death-related genes. This
included the upregulated and downregulated mRNAs in the present
study's ceRNA network as follows: Five common apoptosis-related
genes (ZBTB5, BACH1, SUOX, ZNF354B and TGFBR3); and two
ferroptosis-related mRNAs (BACH1 and RRM2). Comparing IS from rats'
MCAO models with healthy normal controls, RT-qPCR results showed
that the ferroptosis-related genes BACH1 and RRM2 were confirmed to
be differentially upregulated in IS, significantly after 24 h of
ischemia-reperfusion (Fig. 9).
These results also showed that the apoptosis-related genes BACH1,
SUOX, ZNF354B, and TGFBR3 were also markedly upregulated compared
with the sham group, while ZBTB5 was significantly downregulated in
IS.
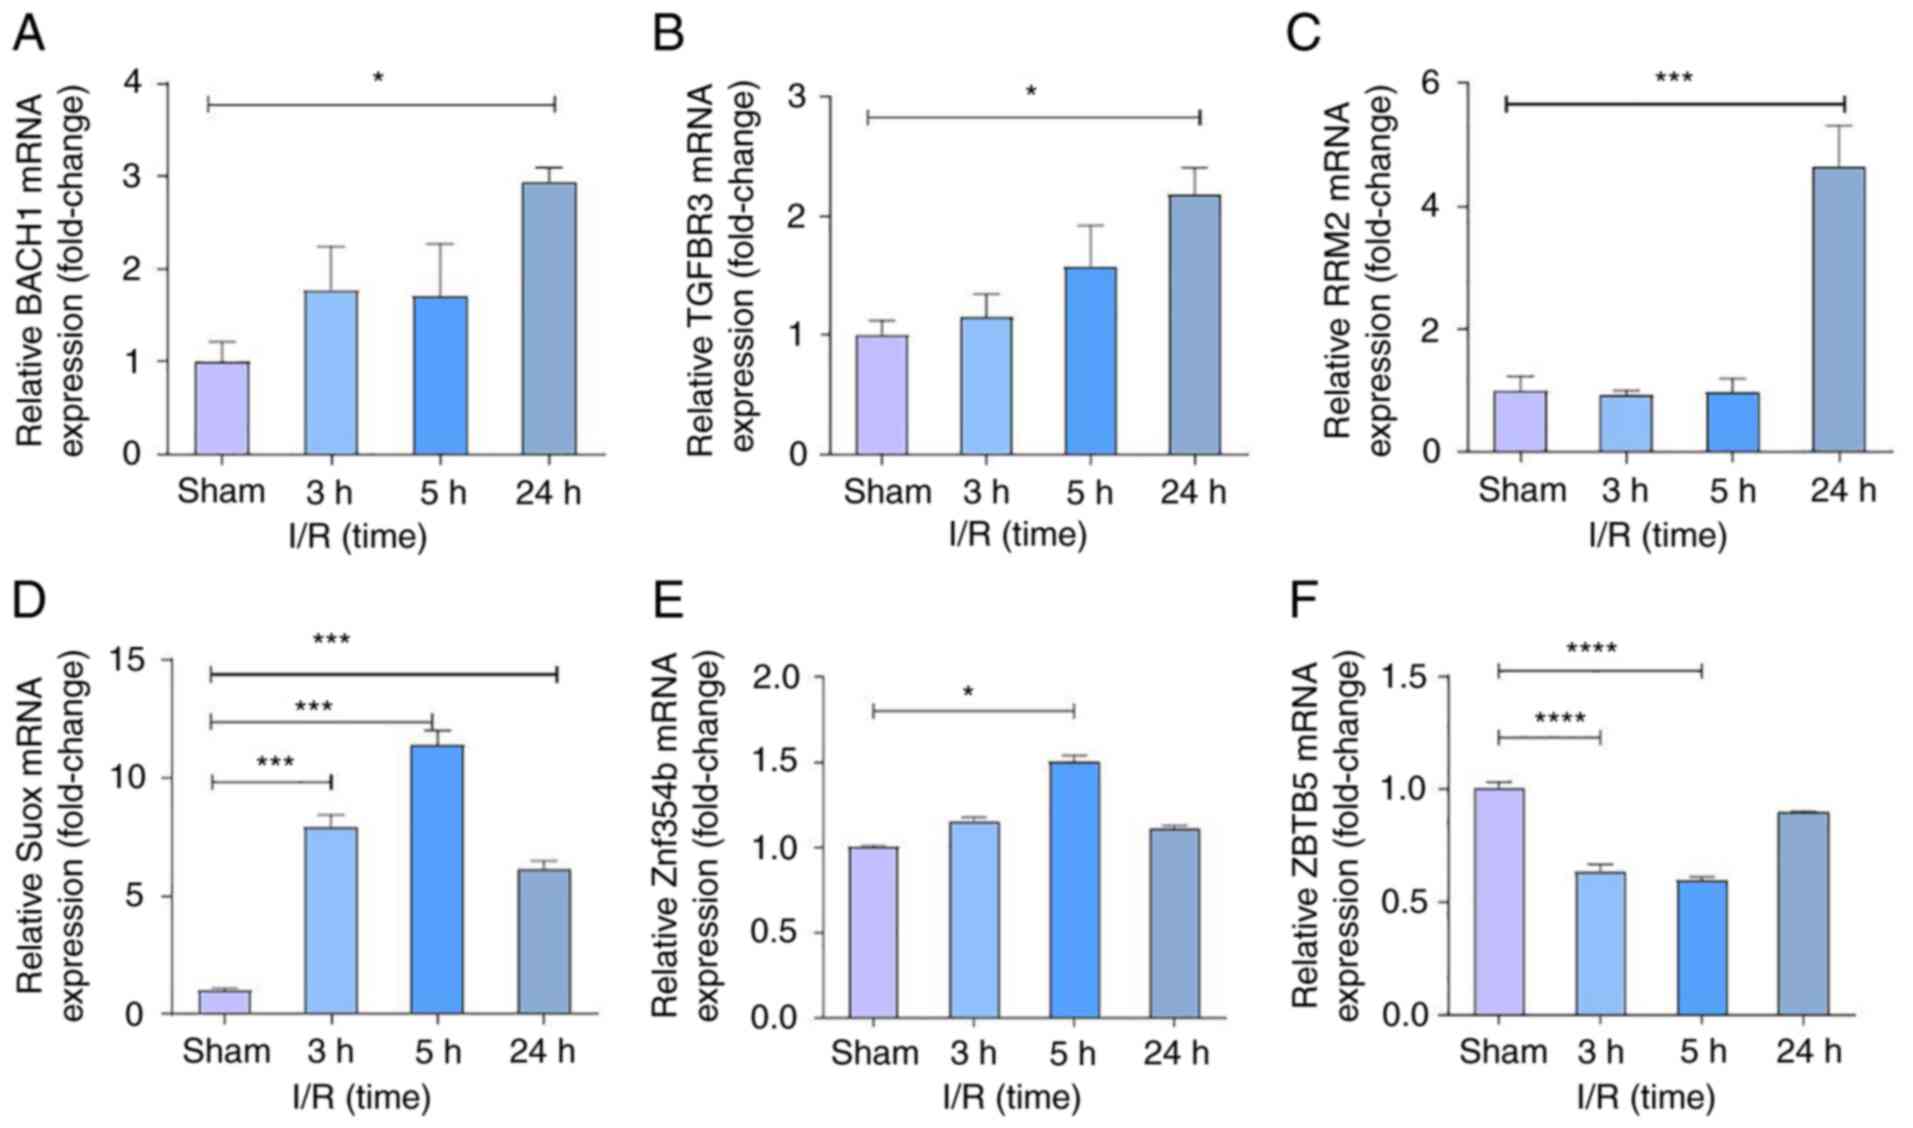 | Figure 9Gene validation in programmed cell
death regulatory pathways. Expression of the following mRNAs in the
ceRNA network; (A) BACH1, (B) TGFBR3, (C) RRM2, (D) SUOX, (E)
ZNF354B and (F) ZBTB5. *P<0.05,
***P<0.001 and ****P<0.0001. ceRNA,
competing endogenous RNA; I/R, ischemia/reperfusion; BACH1, BTB and
CNC homology 1; TGFBR3, transforming growth factor beta receptor
III; RRM2, ribonucleotide reductase regulatory subunit M2; SUOX,
sulfite oxidase; ZNF354B, zinc finger protein 354B; ZBTB5, zinc
finger and BTB domain containing 5. |
Discussion
In the present study, a lncRNA-miRNA-mRNA ceRNA
regulatory network was constructed based on GEO datasets for IS. GO
and KEGG enrichment analysis revealed that mRNAs with differential
expression in the ceRNA network were particularly enriched in the
‘in utero embryonic development’ (biological process) and
‘lysosomal membrane’ (cellular component) functions. After the
ceRNA network was compared with programmed cell death-related
genes, six mRNAs (ZBTB5, BACH1, SUOX, ZNF354B, TGFBR3 and RRM2)
were identified. Finally, RT-qPCR testing revealed that several
ceRNA regulatory pathways are closely related to programmed cell
death in IS pathophysiology. LncRNAs are a special type of
transcript family without protein coding functions (34). LncRNAs likely play a ‘bridge’ role
in regulating genes levels in the ceRNA network (35). LncRNAs act as natural sponges; they
compete with each other to adsorb specific miRNAs, thereby reducing
the binding of miRNAs to corresponding target genes and altering
the expression of miRNA target genes (36). Research has indicated that certain
lncRNAs target miRNAs to regulate signaling pathways that alleviate
apoptosis and inflammation. For example, lncRNA GAS5 may regulate
IS as a competing endogenous RNA to miR-137 to, in turn, regulate
the Notch1 signaling pathway (37), and lncRNA SNHG1 reduces apoptosis
and inflammation during an IS by targeting miR-376a and modulating
the cystathionine-β-synthase (CBS)/H2S pathway (38). However, it is unclear at the time
of IS occurrence whether abnormal lncRNAs act as ceRNAs of specific
miRNAs to regulate the expression of target mRNAs, and whether this
has specific effects on the arterial wall.
In the present study's comprehensive bioinformatic
analysis, lncRNA DLEU2L and lINC00266-1 were two key nodes of the
ceRNA network associated with miRNA and mRNA. LncRNA DLEU2L is
usually regarded as a prognostic biomarker for cancer cells
(39). A recent study showed that
DLEU2L can target miR-210-3p to construct a ceRNA aimed at
suppressing the proliferation, migration and infiltration of
pancreatic cancer cells while promoting apoptosis (39). Additionally, the expression of
lncRNA LINC00266-1 and LINC00266-1 encoded miR-548c-3p in
osteosarcoma cells suppress the proliferative and metastatic
abilities of the cells and promote apoptosis, significantly
reducing the growth of osteosarcoma cells in vivo (40). However, the mechanism of lncRNAs in
IS is still uncertain. Consequently, there is reason to consider
that the present study's ceRNA regulatory network may arise during
or post IS.
In addition to the lncRNAs, miRNAs may also play a
role in the ceRNA regulatory network of IS. To further explore the
biological functions of differentially expressed mRNAs in IS, the
present study performed GO and KEGG pathway analyses on the 31
differentially expressed mRNAs in the ceRNA network. These mRNAs
were significantly enriched in the ‘in utero embryonic development’
(biological process), especially in the regulation of immune cells.
However, how the extracellular matrix organization regulates the
regulation of immune cells remains to be further investigated.
This is consistent with the view that cerebral and
peripheral immune responses induced by cerebral ischemic injury are
involved in the regulation of neural repair after stroke (15). Therefore, it is reasonable to
hypothesize that the present study's newly established ceRNA
network might play a role in immune infiltration in patients with
IS. The combined effects of inflammatory alternative pathways and
ceRNA networks may be potential targets for IS pathogenesis.
Programmed cell death is also a biological function
extracted from the analysis of the GO and KEGG pathways and is
considered essential in the regulation of cerebral injury in IS
(41). Programmed cell death,
including apoptosis and ferroptosis, represent the primary means by
which organisms coordinate the elimination of damaged cells that
either present a risk of tumor transformation or are hijacked by
microorganisms for pathogen replication (42).
Interactions between significantly differentially
expressed mRNAs were identified in the ceRNA network with
programmed cell death-related genes. In this network, six mRNAs
associated with these two subtypes of programmed cell death were
obtained. BACH1, SUOX, ZNF354B, TGFBR3 and ZBTB5 are related to
apoptosis and, among these, BACH1 was the most representative gene.
BACH1, known as a transcription factor, can negatively regulate
various antioxidant genes, such as heme oxygenase-1, that are
involved in oxidative stress (43). The circRNA HIPK3, which is enriched
in the heart, is associated with oxidative stress-induced
ischemia/reperfusion damage (44).
However, the impact of dynamic regulatory crosstalk
networks, including the hub nodes on the paths of the IS regulatory
network, has not been fully studied. The newly identified ceRNA
network not only regulated apoptosis but also programmed cell death
of all subtypes, potentially affecting the pathophysiological
process of IS. Nonetheless, the detailed mechanism of each step
needs further verification.
Furthermore, the present study revealed that BACH1
and RRM2 were related to ferroptosis, which has gained recent
attention (44). It is an
iron-dependent regulation of cell death characterized by the
accumulation of lipid peroxides to lethal levels, resulting in
oxidative damage to the cell membrane. A recent study tentatively
confirmed the link between ferroptosis and cardiovascular disease
(45). Previous studies have shown
that ferroptosis is associated with IS, but few studies have
thoroughly explored the regulatory mechanisms of ferroptosis in IS
(46-48).
In the present study, DLEU2L/has-miR-4500/RRM2 and
DLEU2L/has-miR-4500/BACH1 may have been involved in ferroptosis.
Unfortunately, the ferroptosis-related hub nodes detected in the
present study have previously been explored only in non-IS
diseases. For example, RRM2 exerts an anti-ferroptotic effect on
liver cancer cells by maintaining GSH synthesis (49). This may be used as a biomarker in
serum to evaluate the degree of ferroptosis suppression and improve
the diagnostic efficiency of liver cancer (49). BACH1 can repress genes that combat
labile iron-induced oxidative stress, and ferroptosis is stimulated
at the transcriptional level by BACH1 upon disruption of the
balance between the transcriptional induction of protective genes
and accumulation of iron-mediated damage (50).
Evidence of crosstalk between ceRNA network-mediated
BACH1 regulation and ferroptosis has been reported only in cancer,
and not in IS (51,52). Nonetheless, these promising results
provide potential research points and information on IS for linking
ferroptosis and ceRNA regulatory networks, supporting further
exploration of functional variations and specific interactions
between ferroptosis and ceRNA regulatory networks.
The present study was based on genetic information
downloaded from the GEO database, and it is recommended to
additionally perform sequence analysis (such as DNA-seq and
RNA-seq) on samples obtained from humans or animals. It is also
recommended to use expanded human cohorts or well-designed animal
studies to validate these observations and explore integrative
mechanisms. Furthermore, the potential binding affinities between
the identified lncRNAs, miRNAs and mRNAs require further
experimental studies, and the protein expression levels of BACH1,
ZBTB5, SUOX, ZNF354B and TGFBR3 could be verified at future
studies. Finally, if any of the newly proposed ceRNA regulatory
networks for programmed cell death are further validated, the
clinical diagnosis and treatment of IS could be improved.
In the present study, a ceRNA regulatory network was
built based on bioinformatic analysis. In addition to the
biological functions extracted from GO and KEGG enrichment
analyses, six newly discovered lncRNA-mediated ceRNA regulatory
pathways were identified and validated. These pathways influenced
programmed cell death, including apoptosis (lncRNA
DLEU2L/miR-4500/SOUX, lncRNA DLEU2L/miR-4500/TGFBR3, lncRNA
DLEU2L/miR-4500/BACH1, lncRNA DLEU2L/miR-4500/ZBTB5 and lncRNA
LINC00266-1/miR-363-3p/ZNF354B) and ferroptosis (lncRNA
DLEU2L/miR-4500/RRM2 and lncRNA DLEU2L/miR-4500/BACH1). The present
study's results provided novel insights and potential research
options for regarding link between programmed cell death, immune
infiltration, and ceRNA regulatory networks in IS.
Acknowledgements
Not applicable.
Funding
Funding: This study was supported by the Natural Science
Foundation of Shandong Province (grant nos. ZR2020MH282 and
ZR2021QH143).
Availability of data and materials
The datasets generated during and/or analyzed during
the current study are available in the Gene Expression Omnibus
(GEO) datasets (GSE58294 and GSE55937; http://www.ncbi.nlm.nih.gov/geo/). All other datasets
used and/or analyzed during the current study are available from
the corresponding author on reasonable request.
Authors' contributions
PPM and QW were responsible for the design of all
experiments and revised the manuscript writing. YTC and YYW
participated in the conception and design, provision of study
material, collection and assembly of data, data analysis and
interpretation and manuscript writing. XZ, SSD and ZWW were
responsible for animal models, data analysis and RT-qPCR. TYL, XML
and YTC were responsible for the provision of study material and
analyzing data. All authors have read and approved the final
version of the manuscript. YYW and QW confirm the authenticity of
all the raw data.
Ethics approval and consent to
participate
In this study, the rights and interests of rats were
fully protected, which met the requirements of the Laboratory
Animal Welfare Ethics Committee of Qingdao University (approval no.
20210125SD3620211228015).
Patient consent for publication
Not applicable.
Competing interests
The authors declare that they have no competing
interests.
References
|
1
|
Feske SK: Ischemic stroke. Am J Med.
134:1457–1464. 2021.PubMed/NCBI View Article : Google Scholar
|
|
2
|
Blakeley JO and Llinas RH: Thrombolytic
therapy for acute ischemic stroke. J Neurol Sci. 261:55–62.
2007.PubMed/NCBI View Article : Google Scholar
|
|
3
|
Kyzar EJ, Bohnsack JP and Pandey SC:
Current and future perspectives of noncoding RNAs in brain function
and neuropsychiatric disease. Biol Psychiatry. 91:183–193.
2022.PubMed/NCBI View Article : Google Scholar
|
|
4
|
Kimura T, Horikoshi Y, Kuriyagawa C and
Niiyama Y: Rho/ROCK pathway and noncoding RNAs: Implications in
ischemic stroke and spinal cord injury. Int J Mol Sci.
22(11573)2021.PubMed/NCBI View Article : Google Scholar
|
|
5
|
Gugliandolo A, Silvestro S, Sindona C,
Bramanti P and Mazzon E: MiRNA: Involvement of the MAPK pathway in
ischemic stroke. A promising therapeutic target. Medicina (Kaunas).
57(1053)2021.PubMed/NCBI View Article : Google Scholar
|
|
6
|
Bulygin KV, Beeraka NM, Saitgareeva AR,
Nikolenko VN, Gareev I, Beylerli O, Akhmadeeva LR, Mikhaleva LM,
Torres Solis LF, Solís Herrera A, et al: Can miRNAs be considered
as diagnostic and therapeutic molecules in ischemic stroke
pathogenesis?-Current status. Int J Mol Sci.
21(6728)2020.PubMed/NCBI View Article : Google Scholar
|
|
7
|
Chi NF, Chiou HY, Chou SY, Hu CJ, Chen KY,
Chang CF and Hsieh YC: Hyperglycemia-related FAS gene and
hsa-let-7b-5p as markers of poor outcomes for ischaemic stroke. Eur
J Neurol. 27:1647–1655. 2020.PubMed/NCBI View Article : Google Scholar
|
|
8
|
Zhang X, Tang X, Liu K, Hamblin MH and Yin
KJ: Long noncoding RNA Malat1 regulates cerebrovascular pathologies
in ischemic stroke. J Neurosci. 37:1797–1806. 2017.PubMed/NCBI View Article : Google Scholar
|
|
9
|
Yan H, Yuan J, Gao L, Rao J and Hu J: Long
noncoding RNA MEG3 activation of p53 mediates ischemic neuronal
death in stroke. Neuroscience. 337:191–199. 2016.PubMed/NCBI View Article : Google Scholar
|
|
10
|
Wang J, Zhao H, Fan Z, Li G, Ma Q, Tao Z,
Wang R, Feng J and Luo Y: Long noncoding RNA H19 promotes
neuroinflammation in ischemic stroke by driving histone deacetylase
1-dependent M1 microglial polarization. Stroke. 48:2211–2221.
2017.PubMed/NCBI View Article : Google Scholar
|
|
11
|
Tay Y, Rinn J and Pandolfi PP: The
multilayered complexity of ceRNA crosstalk and competition. Nature.
505:344–352. 2014.PubMed/NCBI View Article : Google Scholar
|
|
12
|
Sen R, Ghosal S, Das S, Balti S and
Chakrabarti J: Competing endogenous RNA: The key to
posttranscriptional regulation. ScientificWorldJournal.
2014(896206)2014.PubMed/NCBI View Article : Google Scholar
|
|
13
|
Duris K, Splichal Z and Jurajda M: The
role of inflammatory response in stroke associated programmed cell
death. Curr Neuropharmacol. 16:1365–1374. 2018.PubMed/NCBI View Article : Google Scholar
|
|
14
|
Sun Y, Wang J, Han B, Meng K, Han Y and
Ding Y: Elucidating the molecular mechanism of ischemic stroke
using integrated analysis of miRNA, mRNA, and lncRNA expression
profiles. Front Integr Neurosci. 15(638114)2021.PubMed/NCBI View Article : Google Scholar
|
|
15
|
Liu F, Cheng X, Zhong S, Liu C, Jolkkonen
J, Zhang X, Liang Y, Liu Z and Zhao C: Communications between
peripheral and the brain-resident immune system in neuronal
regeneration after stroke. Front Immunol. 11(1931)2020.PubMed/NCBI View Article : Google Scholar
|
|
16
|
Zheng Y, Zhang Y, Zhang X, Dang Y, Cheng
Y, Hua W, Teng M, Wang S and Lu X: Novel lncRNA-miRNA-mRNA
competing endogenous RNA triple networks associated programmed cell
death in heart failure. Front Cardiovasc Med.
8(747449)2021.PubMed/NCBI View Article : Google Scholar
|
|
17
|
Zhang L, Liu B, Han J, Wang T and Han L:
Competing endogenous RNA network analysis for screening
inflammation-related long non-coding RNAs for acute ischemic
stroke. Mol Med Rep. 22:3081–3094. 2020.PubMed/NCBI View Article : Google Scholar
|
|
18
|
Stamova B, Jickling GC, Ander BP, Zhan X,
Liu D, Turner R, Ho C, Khoury JC, Bushnell C, Pancioli A, et al:
Gene expression in peripheral immune cells following cardioembolic
stroke is sexually dimorphic. PLoS One. 9(e102550)2014.PubMed/NCBI View Article : Google Scholar
|
|
19
|
Jickling GC, Ander BP, Zhan X, Noblett D,
Stamova B and Liu D: microRNA expression in peripheral blood cells
following acute ischemic stroke and their predicted gene targets.
PLoS One. 9(e99283)2014.PubMed/NCBI View Article : Google Scholar
|
|
20
|
Ritchie ME, Phipson B, Wu D, Hu Y, Law CW,
Shi W and Smyth GK: limma powers differential expression analyses
for RNA-sequencing and microarray studies. Nucleic Acids Res.
43(e47)2015.PubMed/NCBI View Article : Google Scholar
|
|
21
|
R Core Team: R: A language and environment
for statistical computing. R Foundation for Statistical Computing,
Vienna, Austria. ISBN 3-900051-07-0, 2012.
|
|
22
|
Zou JB, Chai HB, Zhang XF, Guo DY, Tai J,
Wang Y, Liang YL, Wang F, Cheng JX, Wang J and Shi YJ:
Reconstruction of the lncRNA-miRNA-mRNA network based on
competitive endogenous RNA reveal functional lncRNAs in Cerebral
Infarction. Sci Rep. 9(12176)2019.PubMed/NCBI View Article : Google Scholar
|
|
23
|
Vejnar CE and Zdobnov EM: MiRmap:
Comprehensive prediction of microRNA target repression strength.
Nucleic Acids Res. 40:11673–11683. 2012.PubMed/NCBI View Article : Google Scholar
|
|
24
|
Betel D, Wilson M, Gabow A, Marks DS and
Sander C: The microRNA.org resource. Targets and
expression. Nucleic Acids Res. 36 (Database Issue):D149–D153.
2008.
|
|
25
|
Wong N and Wang X: miRDB: An online
resource for microRNA target prediction and functional annotations.
Nucleic Acids Res. 43 (Database Issue):D146–D152. 2015.PubMed/NCBI View Article : Google Scholar
|
|
26
|
Agarwal V, Bell GW, Nam JW and Bartel DP:
Predicting effective microRNA target sites in mammalian mRNAs.
Elife. 4(e05005)2015.PubMed/NCBI View Article : Google Scholar
|
|
27
|
Chou CH, Shrestha S, Yang CD, Chang NW,
Lin YL, Liao KW, Huang WC, Sun TH, Tu SJ, Lee WH, et al: miRTarBase
update 2018: A resource for experimentally validated
microRNA-target interactions. Nucleic Acids Res. 46 (D1):D296–D302.
2018.PubMed/NCBI View Article : Google Scholar
|
|
28
|
Li JH, Liu S, Zhou H, Qu LH and Yang JH:
starBase v2.0: Decoding miRNA-ceRNA, miRNA-ncRNA and protein-RNA
interaction networks from large-scale CLIP-Seq data. Nucleic Acids
Res. 42 (Database Issue):D92–D97. 2014.PubMed/NCBI View Article : Google Scholar
|
|
29
|
Shannon P, Markiel A, Ozier O, Baliga NS,
Wang JT, Ramage D, Amin N, Schwikowski B and Ideker T: Cytoscape: A
software environment for integrated models of biomolecular
interaction networks. Genome Res. 13:2498–2504. 2003.PubMed/NCBI View Article : Google Scholar
|
|
30
|
Yu G, Wang LG, Han Y and He QY:
clusterProfiler: An R package for comparing biological themes among
gene clusters. OMICS. 16:284–287. 2012.PubMed/NCBI View Article : Google Scholar
|
|
31
|
Longa EZ, Weinstein PR, Carlson S and
Cummins R: Reversible middle cerebral artery occlusion without
craniectomy in rats. Stroke. 20:84–91. 1998.PubMed/NCBI View Article : Google Scholar
|
|
32
|
Uematsu M, Takasawa M, Hosoi R and Inoue
O: Uncoupling of flow and metabolism by chloral hydrate: A rat
in-vivo autoradiographic study. Neuroreport. 20:219–222.
2009.PubMed/NCBI View Article : Google Scholar
|
|
33
|
Livak KJ and Schmittgen TD: Analysis of
relative gene expression data using real-time quantitative PCR and
the 2(-Delta Delta C(T)) method. Methods. 25:402–408.
2001.PubMed/NCBI View Article : Google Scholar
|
|
34
|
Wang K, Liu CY, Zhou LY, Wang JX, Wang M,
Zhao B, Zhao WK, Xu SJ, Fan LH, Zhang XJ, et al: APF lncRNA
regulates autophagy and myocardial infarction by targeting
miR-188-3p. Nat Commun. 6(6779)2015.PubMed/NCBI View Article : Google Scholar
|
|
35
|
Huang Y: The novel regulatory role of
lncRNA-miRNA-mRNA axis in cardiovascular diseases. J Cell Mol Med.
22:5768–5775. 2018.PubMed/NCBI View Article : Google Scholar
|
|
36
|
Schmitz SU, Grote P and Herrmann BG:
Mechanisms of long noncoding RNA function in development and
disease. Cell Mol Life Sci. 73:2491–2509. 2016.PubMed/NCBI View Article : Google Scholar
|
|
37
|
Chen F, Zhang L, Wang E, Zhang C and Li X:
LncRNA GAS5 regulates ischemic stroke as a competing endogenous RNA
for miR-137 to regulate the Notch1 signaling pathway. Biochem
Biophys Res Commun. 496:184–190. 2018.PubMed/NCBI View Article : Google Scholar
|
|
38
|
Lv L, Xi HP, Huang JC and Zhou XY: LncRNA
SNHG1 alleviated apoptosis and inflammation during ischemic stroke
by targeting miR-376a and modulating CBS/H2S pathway.
Int J Neurosci. 131:1162–1172. 2021.PubMed/NCBI View Article : Google Scholar
|
|
39
|
Xu F, Wu H, Xiong J and Peng T: Long
non-coding RNA DLEU2L targets miR-210-3p to suppress gemcitabine
resistance in pancreatic cancer cells via BRCA2 regulation. Front
Mol Biosci. 8(645365)2021.PubMed/NCBI View Article : Google Scholar
|
|
40
|
Zheng S, Wan L, Ge D, Jiang F, Qian Z,
Tang J, Yang J, Yao Y, Yan J, Zhao L, et al:
LINC00266-1/miR-548c-3p/SMAD2 feedback loop stimulates the
development of osteosarcoma. Cell Death Dis. 11(576)2020.PubMed/NCBI View Article : Google Scholar
|
|
41
|
Datta A, Sarmah D, Mounica L, Kaur H,
Kesharwani R, Verma G, Veeresh P, Kotian V, Kalia K, Borah A, et
al: Cell death pathways in ischemic stroke and targeted
pharmacotherapy. Transl Stroke Res. 11:1185–1202. 2020.PubMed/NCBI View Article : Google Scholar
|
|
42
|
Bedoui S, Herold MJ and Strasser A:
Emerging connectivity of programmed cell death pathways and its
physiological implications. Nat Rev Mol Cell Biol. 21:678–695.
2020.PubMed/NCBI View Article : Google Scholar
|
|
43
|
Yu S, Zhai J, Yu J, Yang Q and Yang J:
Downregulation of BACH1 Protects AGAINST cerebral
ischemia/reperfusion injury through the functions of HO-1 and NQO1.
Neuroscience. 436:154–166. 2020.PubMed/NCBI View Article : Google Scholar
|
|
44
|
Wang Y, Zhao R, Liu W, Wang Z, Rong J,
Long X, Liu Z, Ge J and Shi B: Exosomal circHIPK3 released from
hypoxia-pretreated cardiomyocytes regulates oxidative damage in
cardiac microvascular endothelial cells via the miR-29a/IGF-1
pathway. Oxid Med Cell Longev. 2019(7954657)2019.PubMed/NCBI View Article : Google Scholar
|
|
45
|
Wu X, Li Y, Zhang S and Zhou X:
Ferroptosis as a novel therapeutic target for cardiovascular
disease. Theranostics. 11:3052–3059. 2021.PubMed/NCBI View Article : Google Scholar
|
|
46
|
Ren JX, Li C, Yan XL, Qu Y, Yang Y and Guo
ZN: Crosstalk between oxidative stress and ferroptosis/oxytosis in
ischemic stroke: Possible targets and molecular mechanisms. Oxid
Med Cell Longev. 2021(6643382)2021.PubMed/NCBI View Article : Google Scholar
|
|
47
|
Liu Y, Fang Y, Zhang Z, Luo Y, Zhang A,
Lenahan C and Chen S: Ferroptosis: An emerging therapeutic target
in stroke. J Neurochem. 160:64–73. 2021.PubMed/NCBI View Article : Google Scholar
|
|
48
|
Weiland A, Wang Y, Wu W, Lan X, Han X, Li
Q and Wang J: Ferroptosis and its role in diverse brain diseases.
Mol Neurobiol. 56:4880–4893. 2019.PubMed/NCBI View Article : Google Scholar
|
|
49
|
Yang Y, Lin J, Guo S, Xue X, Wang Y, Qiu
S, Cui J, Ma L, Zhang X and Wang J: RRM2 protects against
ferroptosis and is a tumor biomarker for liver cancer. Cancer Cell
Int. 20(587)2020.PubMed/NCBI View Article : Google Scholar
|
|
50
|
Nishizawa H, Matsumoto M, Shindo T,
Saigusa D, Kato H, Suzuki K, Sato M, Ishii Y, Shimokawa H and
Igarashi K: Ferroptosis is controlled by the coordinated
transcriptional regulation of glutathione and labile iron
metabolism by the transcription factor BACH1. J Biol Chem.
295:69–82. 2020.PubMed/NCBI View Article : Google Scholar
|
|
51
|
Igarashi K, Nishizawa H, Saiki Y and
Matsumoto M: The transcription factor BACH1 at the crossroads of
cancer biology: From epithelial-mesenchymal transition to
ferroptosis. J Biol Chem. 297(101032)2021.PubMed/NCBI View Article : Google Scholar
|
|
52
|
Yu Z, He H, Chen Y, Ji Q and Sun M: A
novel ferroptosis related gene signature is associated with
prognosis in patients with ovarian serous cystadenocarcinoma. Sci
Rep. 11(11486)2021.PubMed/NCBI View Article : Google Scholar
|