Introduction
The diagnosis rate of pulmonary ground-glass opacity
(GGO) has increased significantly with the application of
high-resolution chest computed tomography (CT) (1,2).
Previous studies have demonstrated that 63-92.6% of persistent GGOs
are precancerous lesions or early stage adenocarcinoma (3,4).
According to the Internal Association for the Study of Lung Cancer
and the American Thoracic Society and European Respiratory Society
classification in 2011, adenocarcinoma is classified as atypical
adenomatous hyperplasia (AAH), adenocarcinoma in situ (AIS),
minimally invasive adenocarcinoma (MIA) and invasive adenocarcinoma
(IA) (5). Generally, preinvasive
GGOs consist of AAH and AIS, whereas MIA and IA are categorized as
invasive lesions (6). To date, the
treatment of pulmonary GGOs has often been based on CT
manifestations and clinical experience. AAH and AIS are pure GGOs
(pGGOs) or mixed GGOs featuring a few solid components on chest CT
(7,8), and this type of preinvasive nodule
often needs close follow-up or limited resection (9,10).
Mixed GGOs with more solid components tend to be invasive lesions
and often require segmentectomy or lobectomy with lymph node
dissection. Following appropriate surgery, compared with the 100%
5-year disease-free survival (DFS) rate associated with AAH and AIS
and the ~100% 5-year DFS rate associated with MIA (11), the 5-year DFS rate of patients with
IA remains poor, with previous studies reporting values of
70.5-88.0% (12-16).
Therefore, the identification of invasiveness of pulmonary GGOs is
important for assessing prognosis and for the decision-making
process regarding the choice of the optimal clinical treatment.
Radiomics refers to extrapolation of quantitative
clinical features from radiology images (17). In oncology, tumour radiomic
features measured by analysing imaging data, including nodal shape
and volume, as well as intensity and a series of ‘texture’
features, can be used to investigate the correlation among the
diagnosis, prediction and prognosis of patients with cancer
(18-20).
The purpose of the present study was to determine the invasiveness
of GGOs on the basis of the clinical and radiomic features from
chest CT.
Patients and methods
Patient selection and grouping
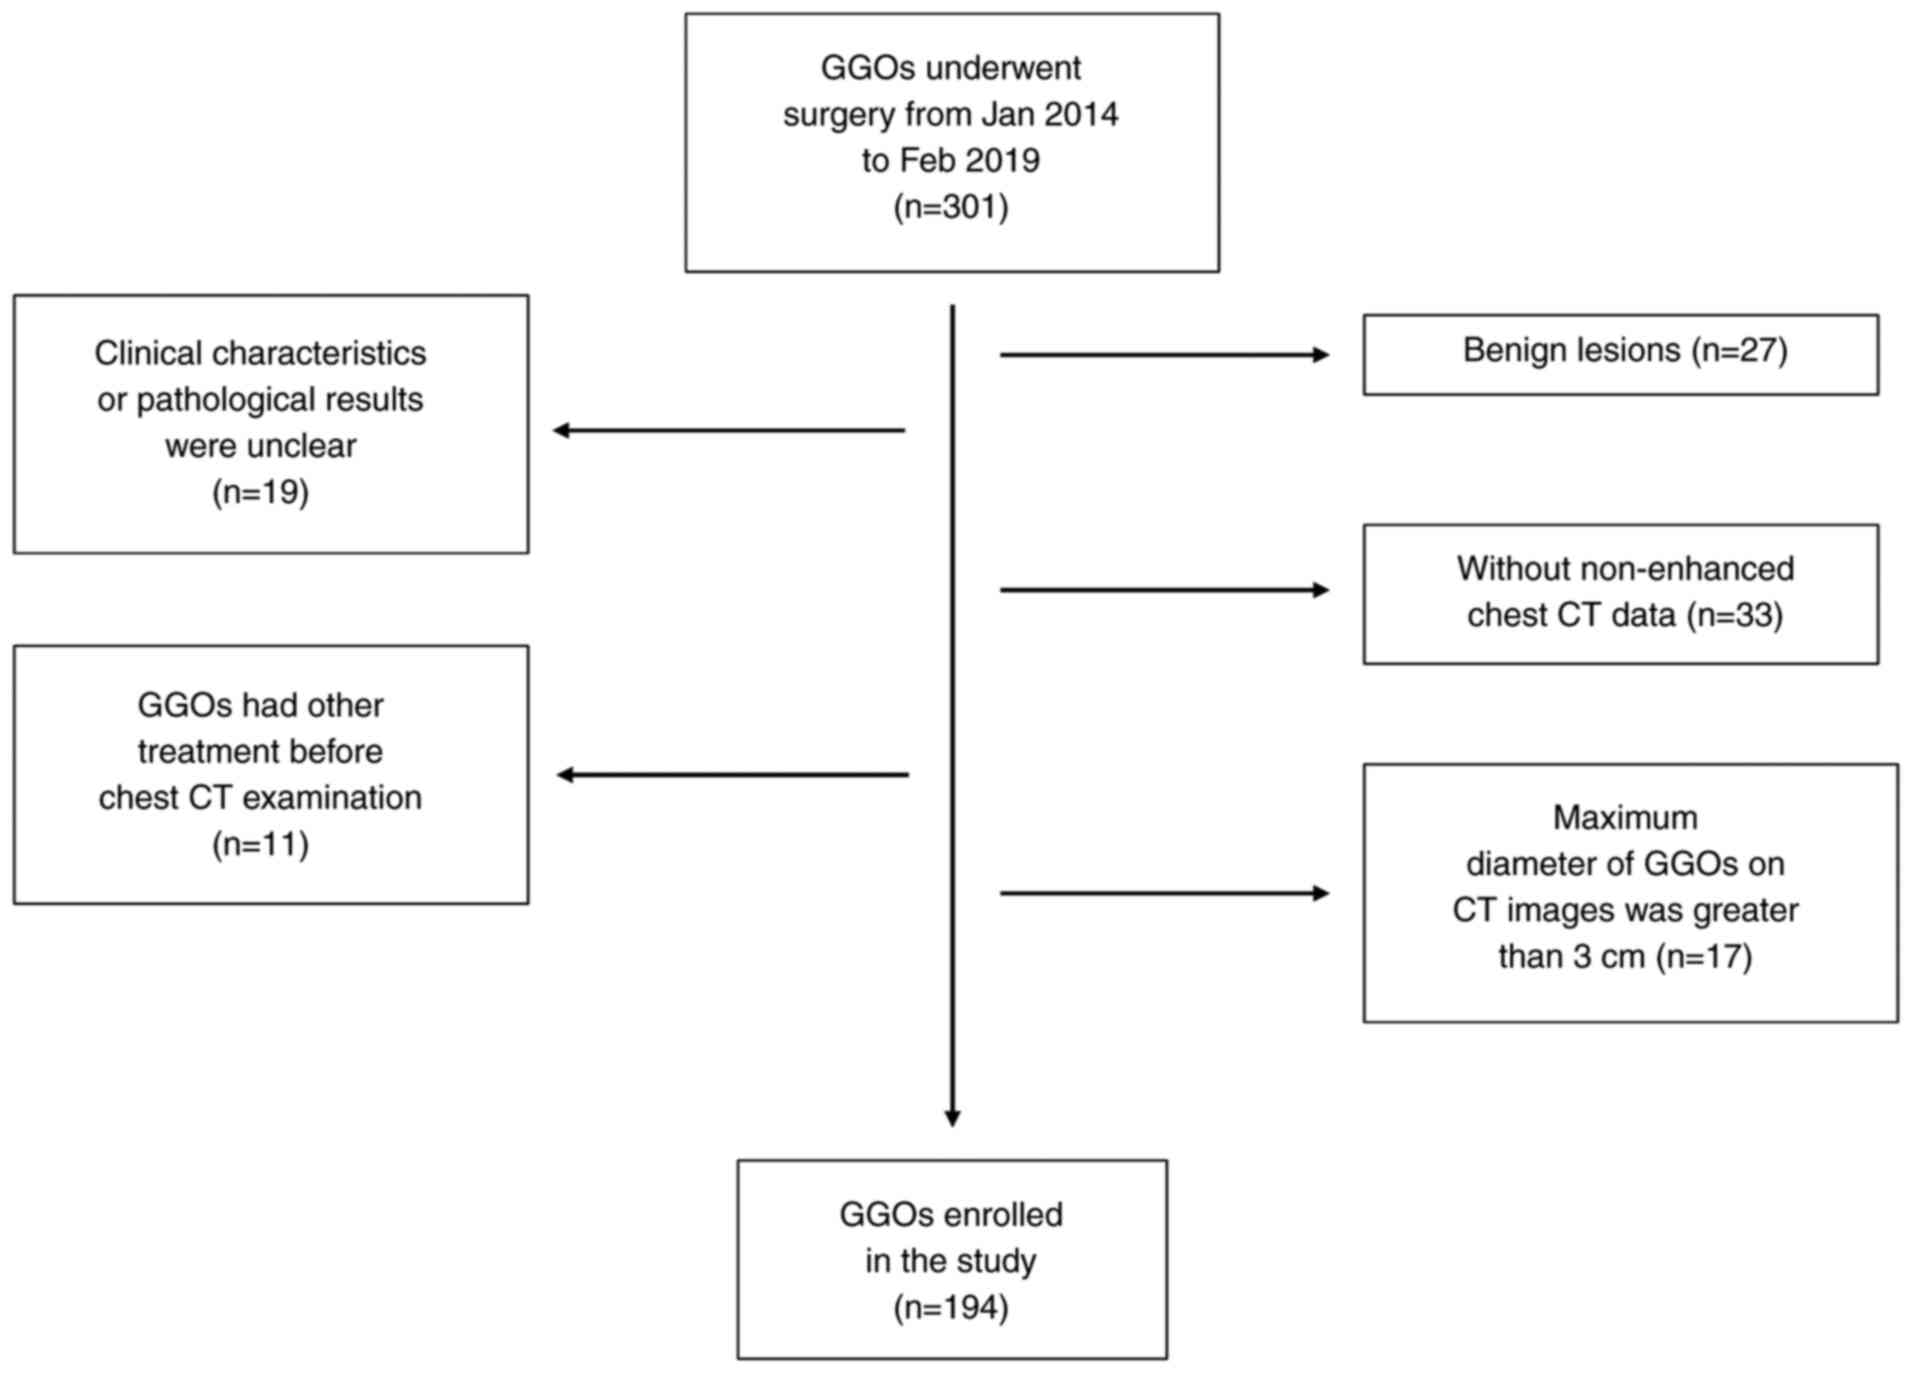
The present study considered for inclusion a total
of 268 patients who underwent surgery for pulmonary GGOs at Xuanwu
Hospital (Capital Medical University, Beijing, China) between
January 2014 and February 2019 (301 GGOs in total; 2 patients had
three GGOs and 29 had two GGOs, while the rest had one GGO). The
inclusion criteria were as follows: i) Complete records of the
patient clinical characteristics, including sex, age, smoking
history, family history of lung cancer and pathological type; ii)
complete non-enhanced chest CT data within 2 months of the
operation; and iii) final pathology results indicating malignant
lesions, including AAH, AIS, MIA and IA. The exclusion criteria
were as follows: i) Patients had undergone puncture biopsy,
radiotherapy, radiofrequency ablation or other treatment of GGOs
before the chest CT examination; and ii) the maximum diameter of
GGOs on CT images was >3 cm. After evaluation against the
inclusion and exclusion criteria, a total of 184 patients with 194
GGOs were included in the present study.
According to the pathology results, the patients who
were ultimately included were divided into two groups: i) The
preinvasive GGO group, composed of patients with preinvasive
lesions, including AAH and AIS; and ii) the invasive GGO group,
composed of patients with invasive lesions, including MIA and
IA.
Ethics approval and consent to
participate
The present study was approved by the Medical
Research Ethics Committee of Shijingshan Hospital of Beijing City
(Beijing, China; approval no. 2020-12). All the procedures
involving human participants were performed in accordance with the
ethical standards of both institutional and national research
committees. Written informed consent was obtained before surgery
from either the patients or their representatives.
Clinical feature selection
A review of the relevant literature was performed to
select clinical predictors of GGO invasiveness. The predictors
included age, sex, smoking history, family history [positive family
history of lung cancer was defined as having a first-degree
relative (parent, sibling or child) with lung cancer], nodule
location, pathological type, the maximum diameter of the GGO in the
three-dimensional (3D) image [the value of the maximum diameter was
consistent with the value of ‘original_shape_Maximum3DDiameter’,
which is a shape-based radiomic feature extracted by 3D Slicer
software (version 4.6.2; http://www.slicer.org) and the GGO consolidation
(defined as the maximum dimensions of the area of increased
opacification that completely obscured the underlying vascular
markings). Subsequently, a 2-round Delphi study (21) was performed using online surveys,
and age, sex, smoking history, family history and GGO consolidation
were ultimately selected as independent predictors.
Chest CT examination and general
imaging feature acquisition
All the preoperative chest CT scans were
non-enhanced and performed with one of two machines (Sensation
Cardiac 64 or Somatom Definition Flash; Siemens Healthineers). All
the CT examinations were performed using the following parameters:
120 kVp; pitch, 1.2; 100-200 mAsec; and collimation, 5.0 mm. The
chest CT images of the patients were analysed by two radiologists.
The largest diameter of the tumour and consolidation components
were separately measured on the lung and mediastinal windows. The
final result was determined by averaging the results reported by
the two radiologists.
CT texture analysis (TA) Radiomic
feature extraction
CT data in DICOM format were imported into 3D-Slicer
software. The volume of interest (VOI) was obtained by
semiautomatic segmentation using the Segment Editor function. The
VOI was then normalized by the NormalizeImageFilter function.
Before performing the radiomic feature extraction with
SlicerRadiomics (version 2.1.0; https://www.slicer.org/wiki/Documentation/Nightly/Extensions/Radiomics),
grey-level discretization and voxel resampling were performed. All
the features were calculated with a fixed bin width of 25 HU, and
resampling to a voxel size of 0.6x0.6x5.0 mm3 was
applied. The radiomic characteristics were divided into the
following 107 original features: i) Shape-based (14 features); ii)
grey-level dependence matrix (14 features); iii) first-order
statistics (18 features); iv) grey-level co-occurrence matrix (24
features); v) grey-level run-length matrix (16 features); vi)
grey-level size zone matrix (16 features); and vii) neighbouring
grey tone difference matrix (five features). In addition, eight
groups of wavelet features were calculated based on the intensity
and texture features of the original image using a wavelet filter.
Wavelet features are obtained by transforming domain
representations of tumor intensity and textural features. These
features were applied as either a high (H) or low pass (L) filter
in each of the three dimensions (x-axis, from left to right;
y-axis, from posterior to anterior; z-axis, from inferior to
superior): Wavelet-LHL, wavelet-LHH, wavelet-HLL, wavelet-LLH,
wavelet-HLH, wavelet-HHH, wavelet-HHL and wavelet-LLL (22). Each intensity or texture feature
extracted from the volume of interest is subjected to eight ways of
wavelet transform, and finally eight sets of wavelet transform
features (a total of 744 features) are obtained (23). Therefore, the features are
concentrated in different frequency ranges within the tumour
volume. The process of radiomic feature extraction was consistent
with the methods previously described (24).
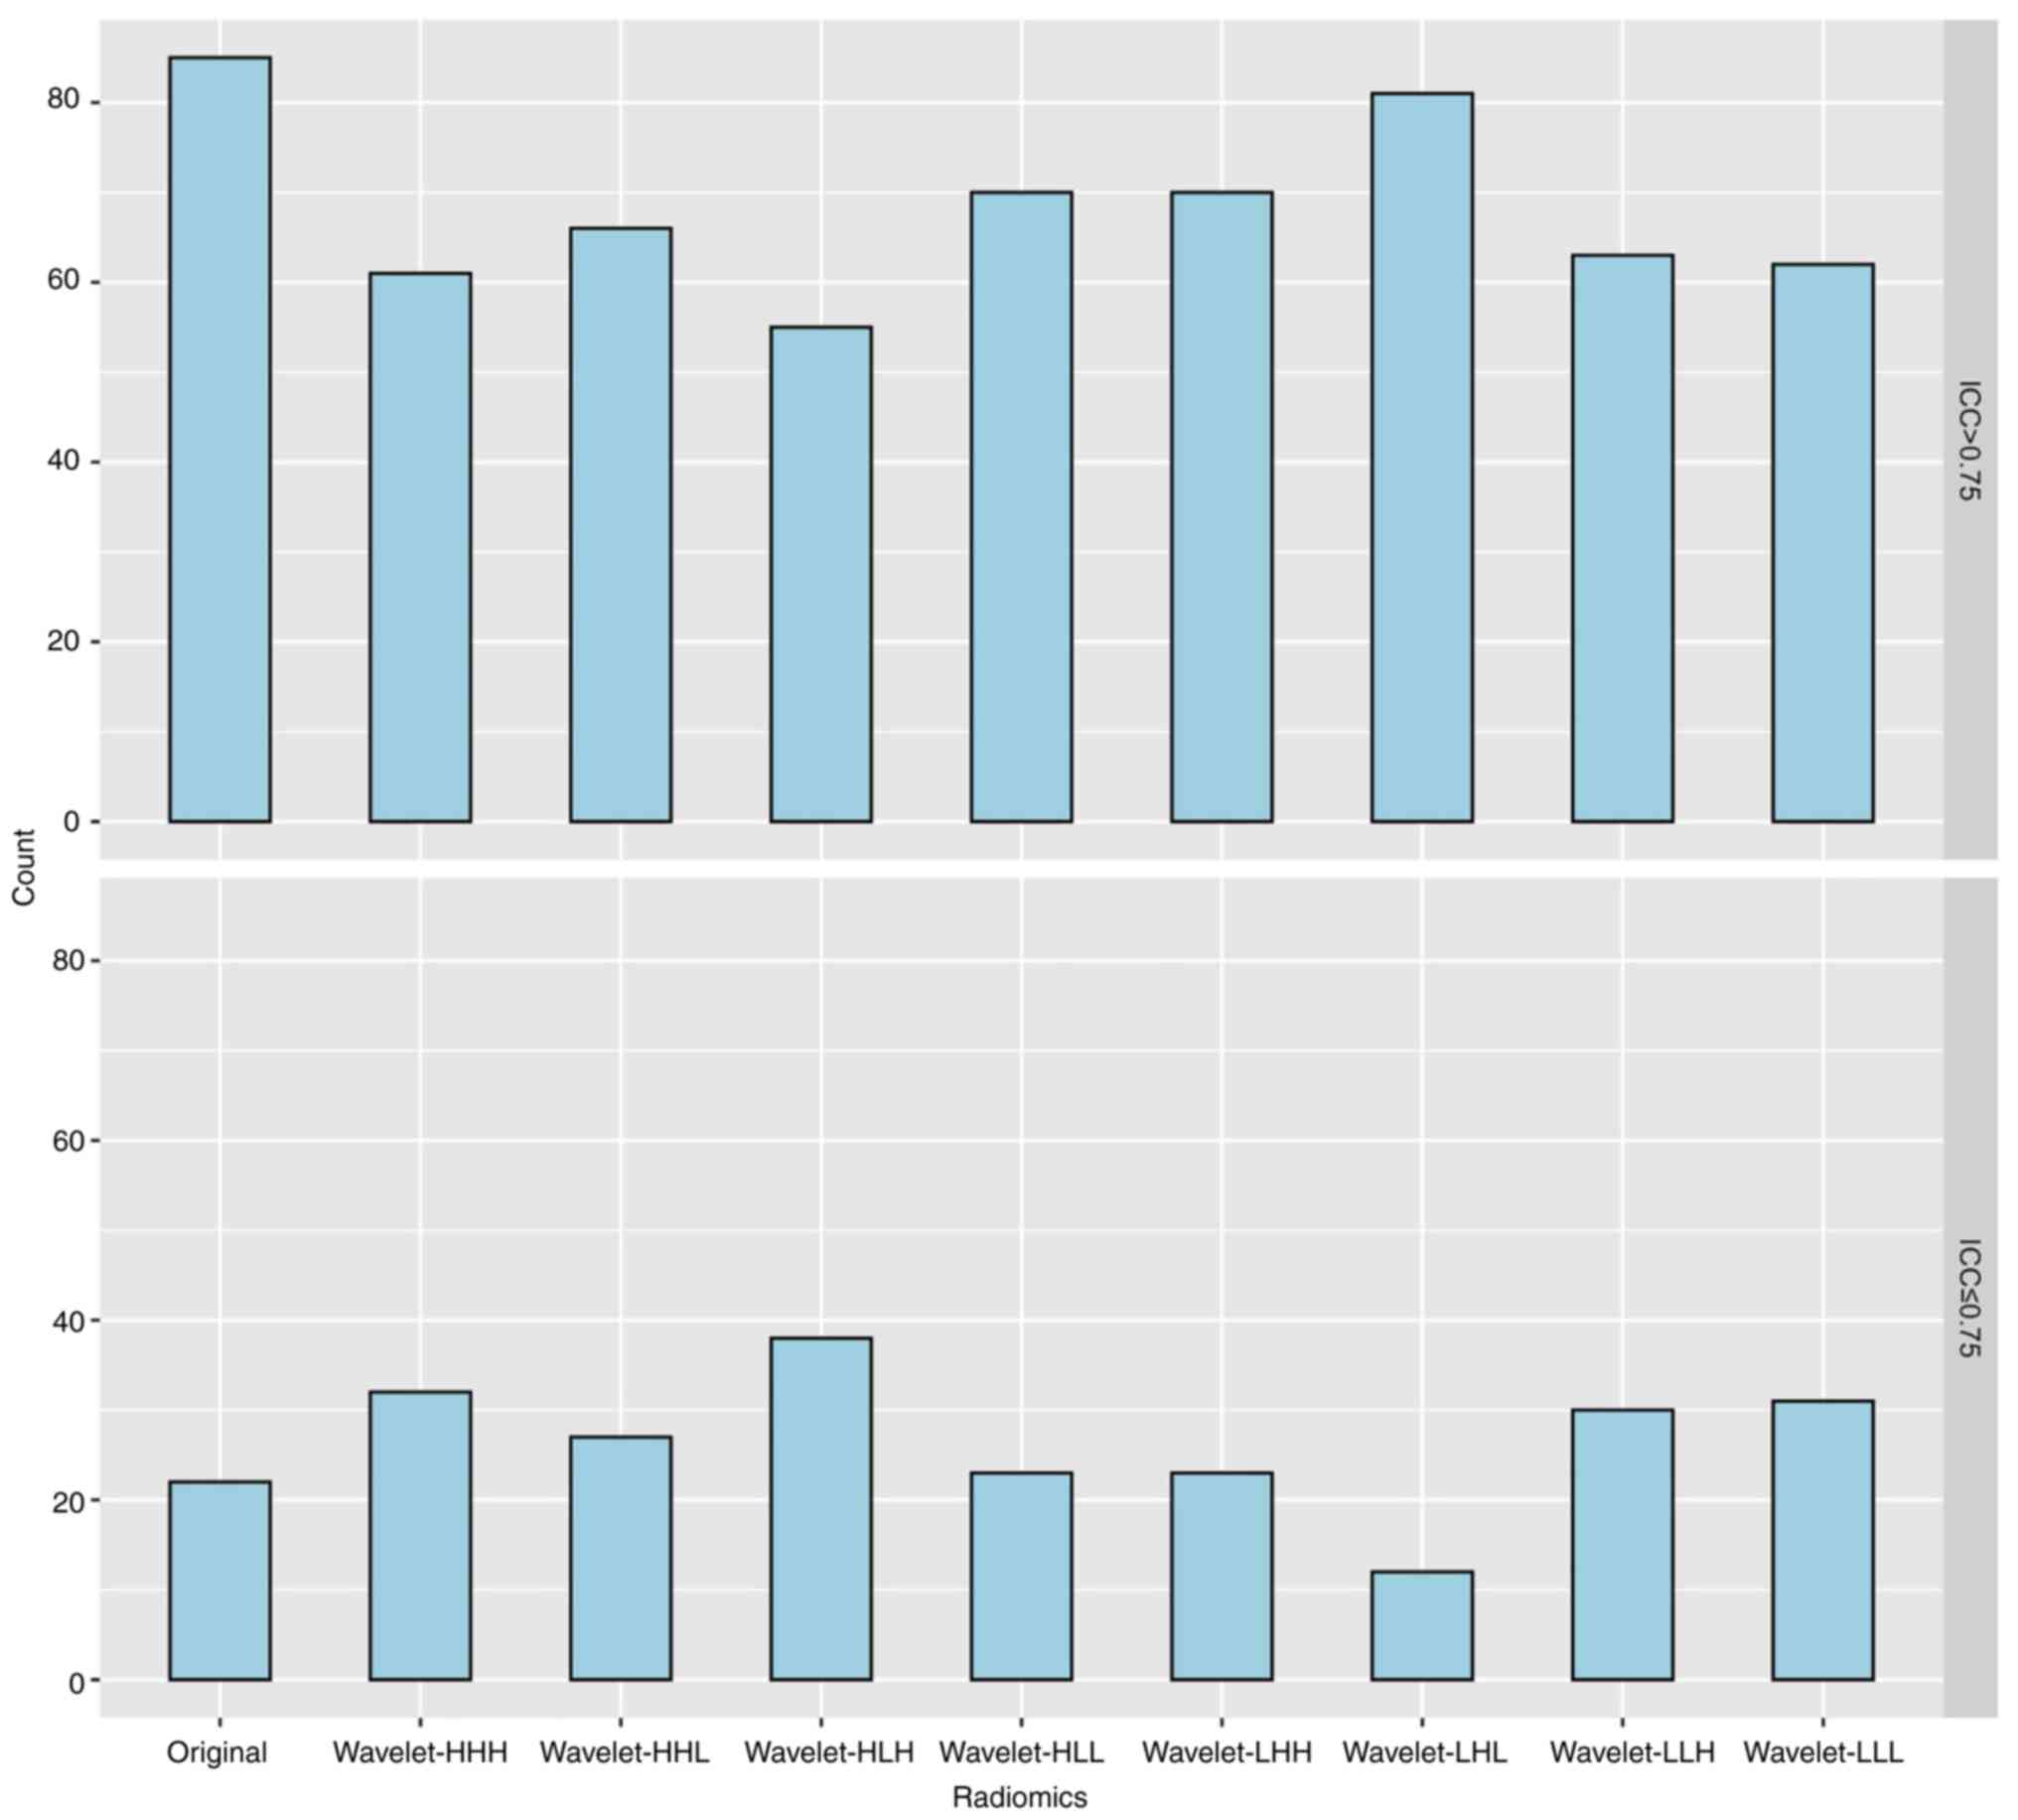
Stable radiomic feature selection
To obtain stable radiomic features, each image data
point was subjected twice to VOI segmentation and radiomic feature
extraction. The intraclass correlation coefficient (ICC) for each
radiomic feature was calculated and the stable radiomic features
were selected as ICC >0.75.
Selection of prediction factors and
establishment of prediction model
The patients enrolled in the present study were
divided into training and validation cohorts. Multivariate logistic
regression analysis with the backwards method (25) was used to select independent
predictors from clinical features, including consolidation, age,
family history, sex and smoking history, in the training cohort,
and receiver operating characteristic (ROC) curves were plotted.
Area under the ROC curve (AUC) values represent the predictive
ability of the clinical prediction model. For radiomic features,
the minimax concave penalty least absolute shrinkage and selection
operator (MCP-LASSO) algorithm and 10-fold cross-validation were
used to identify independent predictors for distinguishing the two
pathological subtypes in the training cohort. Next, ROC curves
representing the radiomic prediction model were plotted and the AUC
values were calculated. Finally, all the meaningful predictors were
used to build a combined prediction model, which was compared with
the clinical prediction and radiomic prediction models. Moreover,
the validation cohort was used to demonstrate the prediction
ability of the prediction models. A nomogram was constructed to
predict the invasiveness of individual GGOs, and a decision curve
analysis (DCA) was performed and plotted.
Statistical analysis
The means of continuous variables were compared
using the independent Student's t-test (normally distributed data)
or Mann-Whitney U test (non-normally distributed data) and the
Pearson χ2 test was used to analyse differences between
categorical variables in two groups using SPSS (version 22.0; IBM
Corp.). R software (version 3.5.2; http://www.R-project.org) was also used for data
analysis. ICC was calculated using the ‘psych’ package (version
1.9.12.31; https://personality-project.org/r/psych) in R. The
‘MASS’ package (version 7.3-51.4; http://cran.stat.auckland.ac.nz/web/packages/MASS/)
was used for logistic regression in the clinical features group.
MCP-LASSO regression analysis was performed for radiomic features
and combined predictors selection using the ‘ncvreg’ package
(version 3.11.2; http://pbreheny.github.io/ncvreg) in R. The ROC curves
were built using the ‘pROC’ (version 1.16.1; http://expasy.org/tools/pROC/) and ‘ggplot2’ (version
3.2.1; http://ggplot2.tidyverse.org)
packages in R. The ‘OptimalCutpoints’ package (version 1.1-5;
http://cran.stat.auckland.ac.nz/web/packages/OptimalCutpoints/)
was used for cut-off calculation in R software. A nomogram was
formulated using the package ‘rms’ (version 6.1-1; https://hbiostat.org/R/rms/) in R software. The
concordance index (C-index), which represents the performance of
the nomogram, was calculated with the ‘rcorrcens’ function present
in the ‘Hmisc’ package (version 4.3-1; https://github.com/harrelfe/Hmisc) in R software. The
ROC curves of the training cohort and validation cohort were
compared by DeLong's test. P<0.05 was considered to indicate a
statistically significant difference. The related computerized
programs with R are listed in Appendix S1.
Results
Clinical features
A total of 184 patients were included in the present
study (Fig. 1). Among these 184
patients, 10 presented two GGOs, while the remaining patients
presented a single GGO, for a total of 194 GGOs. Of these 194 GGOs,
72 (including 21 AAH and 51 AIS) were in the preinvasive GGO group
and 122 (including 31 MIA and 91 IA) were in the invasive GGO
group. The clinical features of the two groups of patients were
analysed (Table I) and there were
no significant differences with regard to sex (P=0.757), age
(P=0.364), smoking history (P=0.725), family history (P=0.266) or
nodule location (P=0.585) between the preinvasive GGO and invasive
GGO groups. However, there were significant differences in the
maximum diameter (P<0.001) and consolidation (P<0.001)
between the two groups. All the GGOs were divided into two groups:
i) The clinical training group, which included 136 patients who
were hospitalized between January 2014 and January 2018, with 144
GGOs; and ii) the clinical validation cohort, which included 48
patients who were hospitalized between February 2018 and February
2019, with 50 GGOs.
 | Table IClinical features of all
patients. |
Table I
Clinical features of all
patients.
|
Characteristics | Preinvasive
GGO | Invasive GGO | Total |
P-valuea |
|---|
| Number of
patients | 72 | 122 | 194 | |
| Sex, n (%) | | | | 0.757 |
|
Male | 24 (35.3) | 44 (64.7) | 68 | |
|
Female | 48 (38.1) | 78 (61.9) | 126 | |
| Age,
yearsb | 59.1±1.05 | 60.31±8.19 | | 0.364 |
| Smoking history, n
(%) | | | | 0.725 |
|
Non-smokers | 54 (36.2) | 95 (63.8) | 149 | |
|
Smokers | 18 (40.0) | 27 (60.0) | 45 | |
| Family history, n
(%) | | | | 0.266 |
|
No | 61 (39.4) | 94 (60.6) | 155 | |
|
Yes | 11 (28.2) | 28 (71.8) | 39 | |
| Maximum_diameter,
cmb | 0.97±0.42 | 1.43±0.63 | | <0.001 |
|
Consolidationb | 0.13±0.03 | 0.65±0.50 | | <0.001 |
| Location, n
(%) | | | | 0.585 |
|
Right
upper | 27 (37.5) | 45 (62.5) | 72 | |
|
Right
middle | 6 (54.5) | 5 (45.5) | 11 | |
|
Right
low | 9 (29.0) | 22 (71.0) | 31 | |
|
Left
upper | 21 (40.4) | 31 (59.6) | 52 | |
|
Left
low | 9 (32.1) | 19 (67.9) | 28 | |
Radiomic feature selection
Through TA of each patient's chest CT images, 851
radiomic features were obtained, including 107 original features
and eight groups of wavelet features (each group contained 93
wavelet feature factors) obtained by decomposition of the original
features (with the exception of 14 shape features). With an ICC
>0.75 as the threshold, 613 stable radiomic features were
identified, including 528 wavelet features and 85 original features
(Fig. 2).
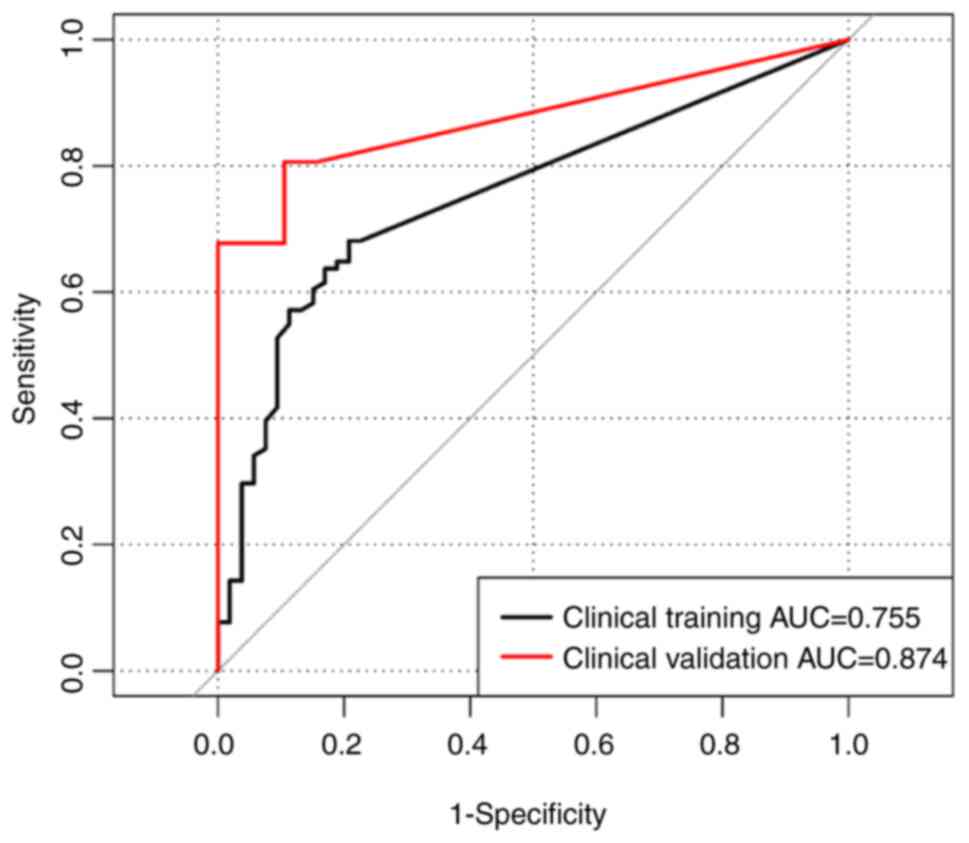
Clinical prediction model
The logistic regression analysis results revealed
that consolidation was an independent predictor of invasiveness in
the training cohort of 144 GGOs (P<0.001; Fig. 3). The ROC curve based on these
plots was used to represent the clinical prediction model (clinical
training cohort) of clinical features for the invasiveness of GGO.
The cut-off value of consolidation was 0.23 cm (sensitivity, 0.681;
specificity, 0.792; positive predictive value, 0.849; negative
predictive value, 0.592; Fig. 3).
The formula for calculating the clinical prediction model score was
as follows: Clinical-score=-0.312+2.588 x consolidation.
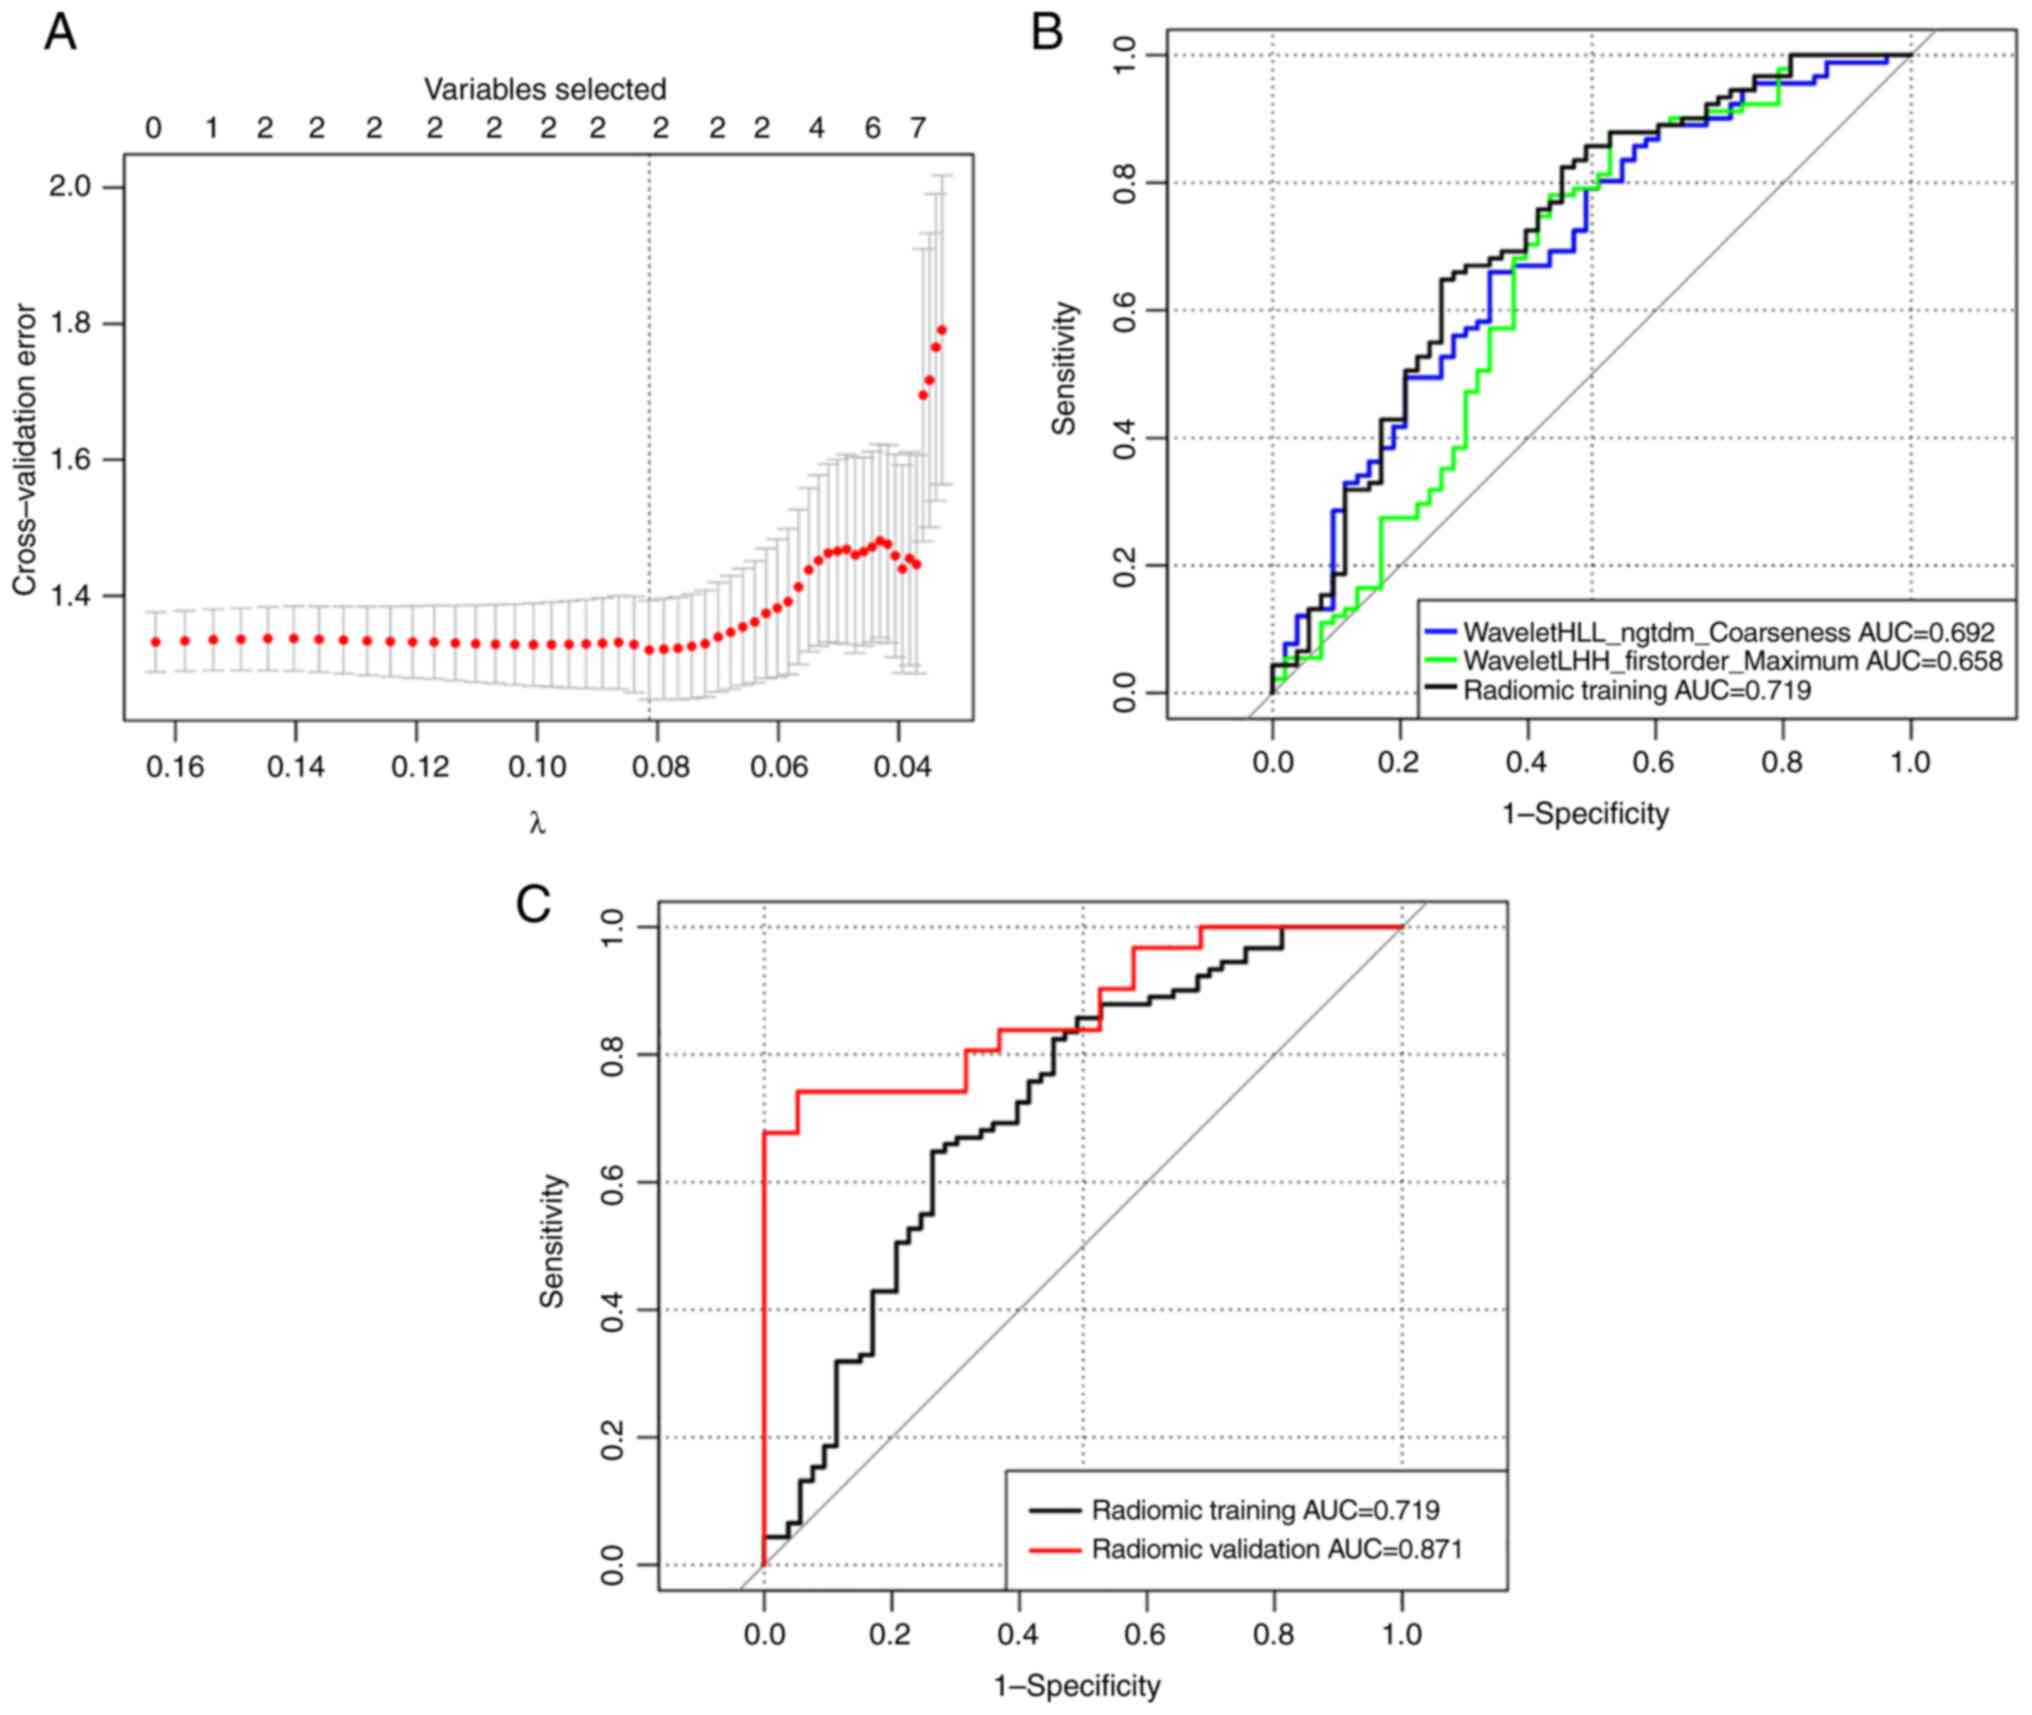
Radiomic prediction model
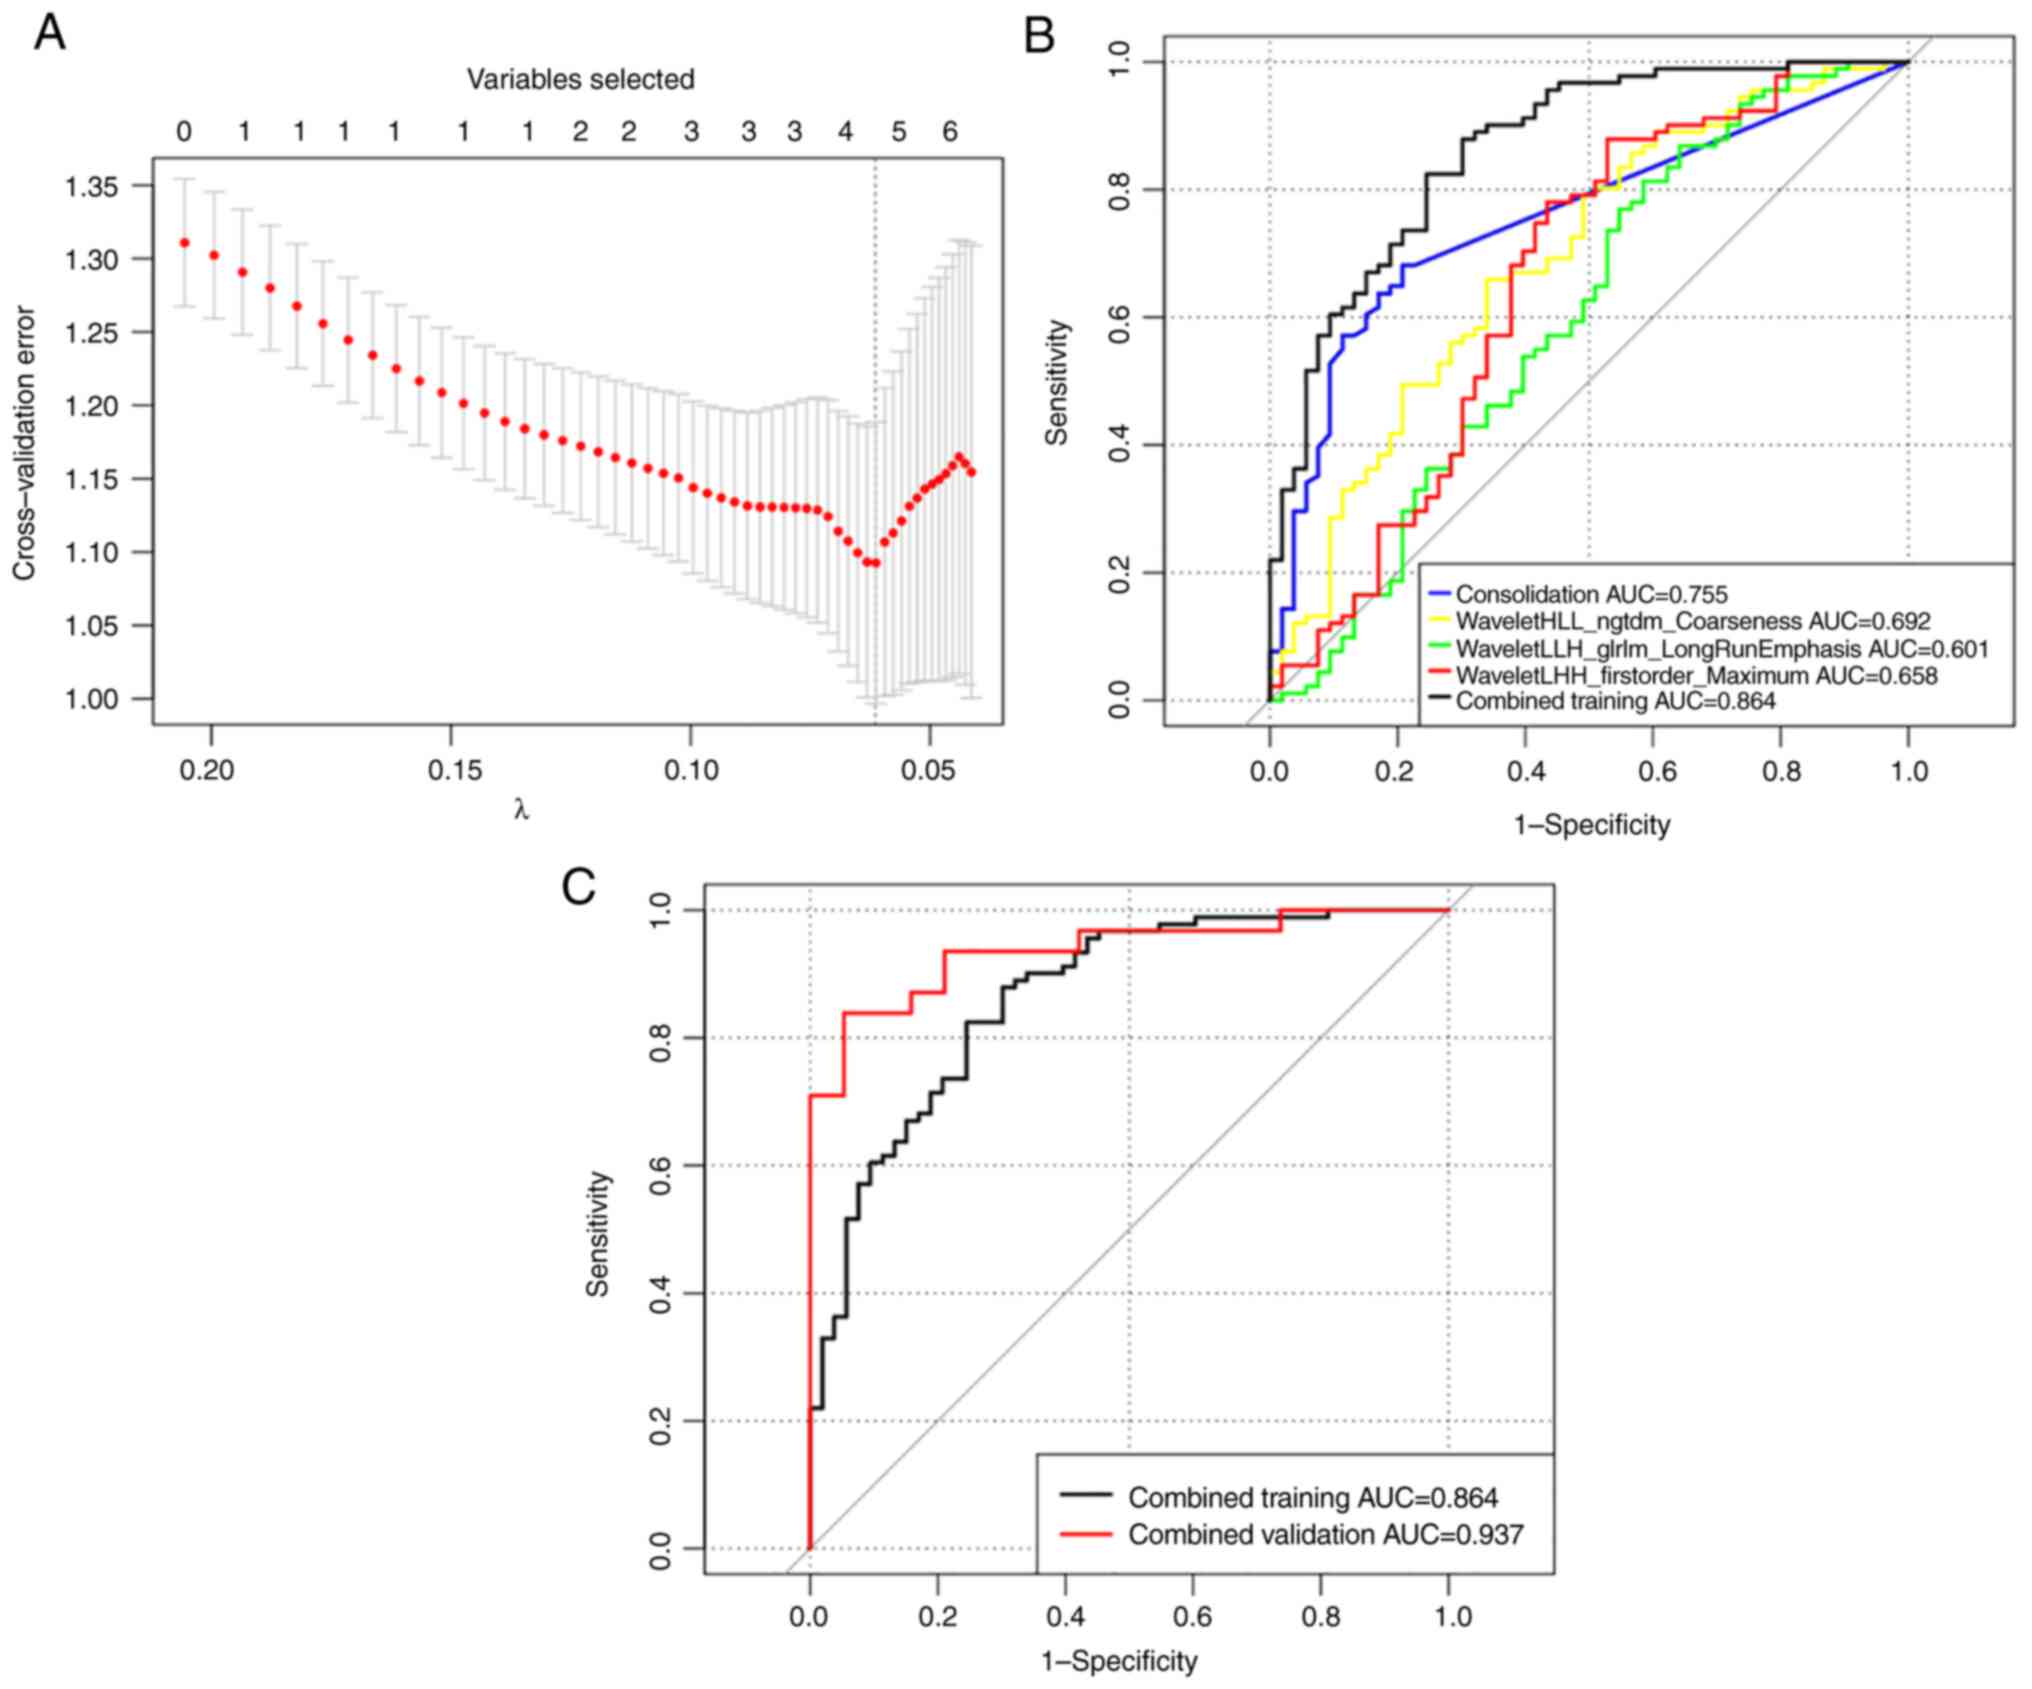
After MCP-LASSO regression analysis and 10-fold
cross-validation of 613 radiomic features in the clinical training
cohort of 144 GGOs, two radiomic features,
waveletHLL_ngtdm_Coarseness (P<0.01) and
waveletLHH_firstorder_Maximum (P=0.01), were identified as
independent predictors of invasiveness. ROC curves were drawn based
on these radiomic features. In the prediction model, the AUCs of
the texture features waveletHLL_ngtdm_Coarseness and
waveletLHH_firstorder_Maximum were 0.692 (95% CI, 0.60-0.783) and
0.658 (95% CI, 0.557-0.758), respectively. The ability of a single
texture feature to predict GGO invasiveness was poor. The combined
predictive ability of all the texture features, radiomic training,
was 0.719 (95% CI, 0.628-0.81), indicating improved predictive
ability (Fig. 4). The formula for
calculating the radiomic prediction model score was as follows:
Radiomic-score=2.422-23.616 x waveletHLL_ngtdm_Coarseness-0.007 x
waveletLHH_firstorder_Maximum.
Combined prediction model
Consolidation, waveletHLL_ngtdm_Coarseness,
waveletLLH_glrlm_LongRunEmphasis and waveletLHH_firstorder_Maximum
were selected from all the clinical and radiomic features by
MCP-LASSO regression analysis and 10-fold cross-validation to
construct the combined prediction model. The ROC curves are shown
in Fig. 5. The combined prediction
model score was calculated as follows: Combined-score=4.508+3.11 x
consolidation-waveletHLL_ngtdm_Coarseness-0.827 x
waveletHLL_glrlm_LongRunEmphasis-0.015 x
waveletLHH_firstorder_Maximum.
The sensitivity, specificity, positive predictive
value, negative predictive value, accuracy, AUC and 95% CI of each
prediction model in the training cohort and validation cohort were
calculated to show the predictive ability (Table II). The predictive ability of the
combined prediction model (AUC, 0.864; 95% CI, 0.802-0.926) was
improved compared with that of any single prediction model
developed with clinical (AUC, 0.755; 95% CI, 0.682-0.827) or
radiomic (AUC, 0.719; 95% CI, 0.628-0.81) features.
| Table IIDiagnostic accuracy and AUC of
prediction models. |
Table II
Diagnostic accuracy and AUC of
prediction models.
| Groups | Cohort | SEN, % | SPE, % | PPV, % | NPV, % | Accuracy, % | AUC | 95% CI | P-value |
|---|
| Clinical | Training | 68.1 | 79.2 | 84.9 | 59.2 | 72.2 | 0.755 | 0.682-0.827 | 0.04 |
| | Validation | 80.6 | 89.5 | 92.6 | 68.8 | 73.9 | 0.84 | 0.787-0.961 | |
| Radiomic | Training | 64.8 | 73.6 | 80.8 | 54.9 | 68.1 | 0.719 | 0.628-0.81 | 0.025 |
| | Validation | 74.2 | 94.7 | 95.8 | 69.2 | 82.0 | 0.871 | 0.776-0.966 | |
| Combined | Training | 82.4 | 75.5 | 85.2 | 71.4 | 79.9 | 0.864 | 0.802-0.926 | 0.109 |
| | Validation | 83.9 | 94.7 | 96.3 | 78.3 | 88.0 | 0.937 | 0.873-1.0 | |
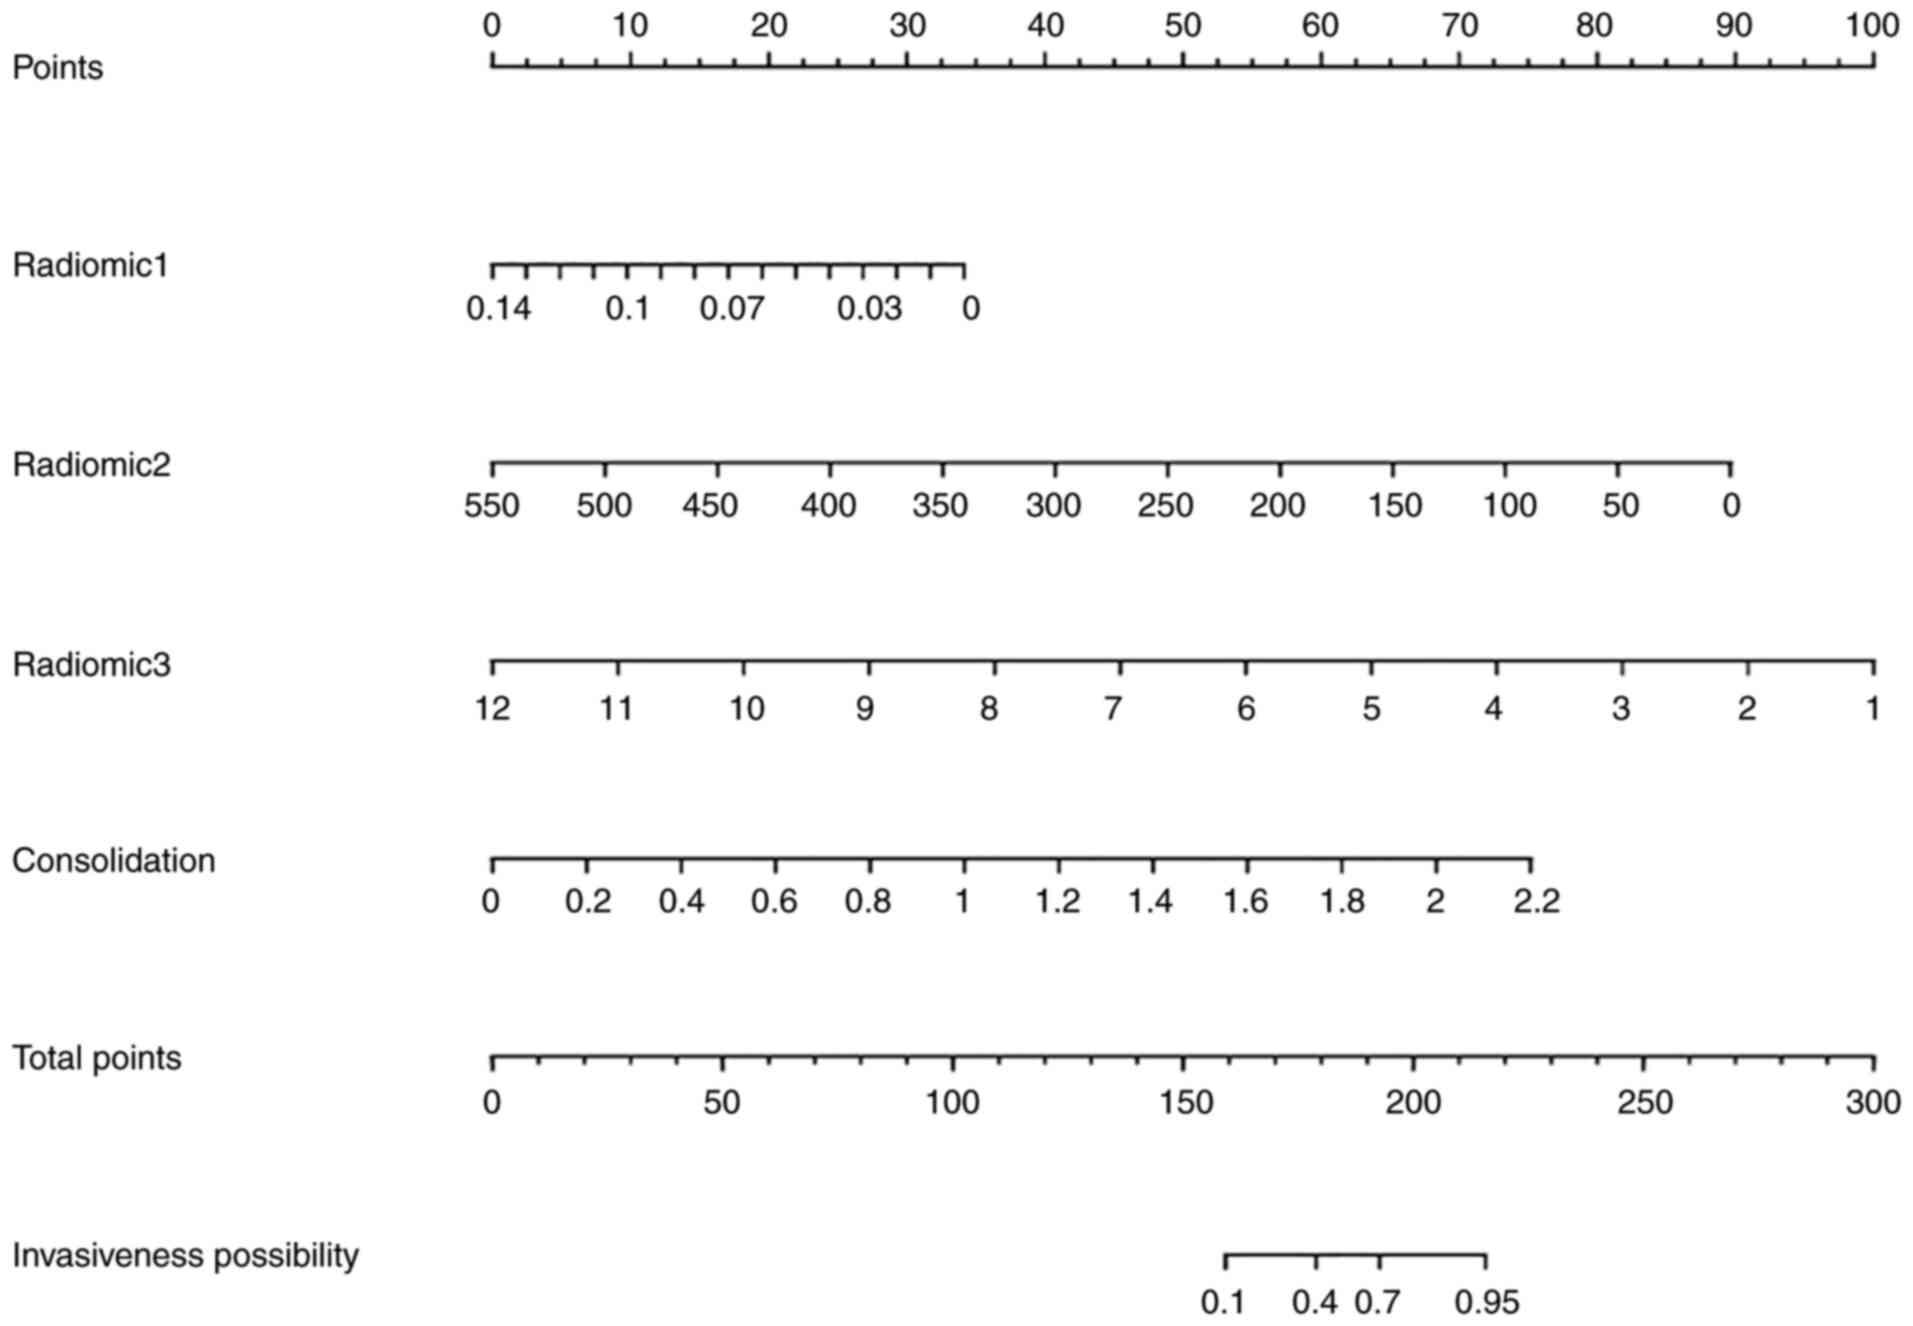
Nomogram establishment and
validation
Based on the four predictors selected in the
combined model, a nomogram was constructed to predict the
individual invasiveness of GGOs (Fig.
6). In the training cohort, the C-index of the invasion
prediction nomogram was 0.864 (95% CI, 0.833-0.895), while it was
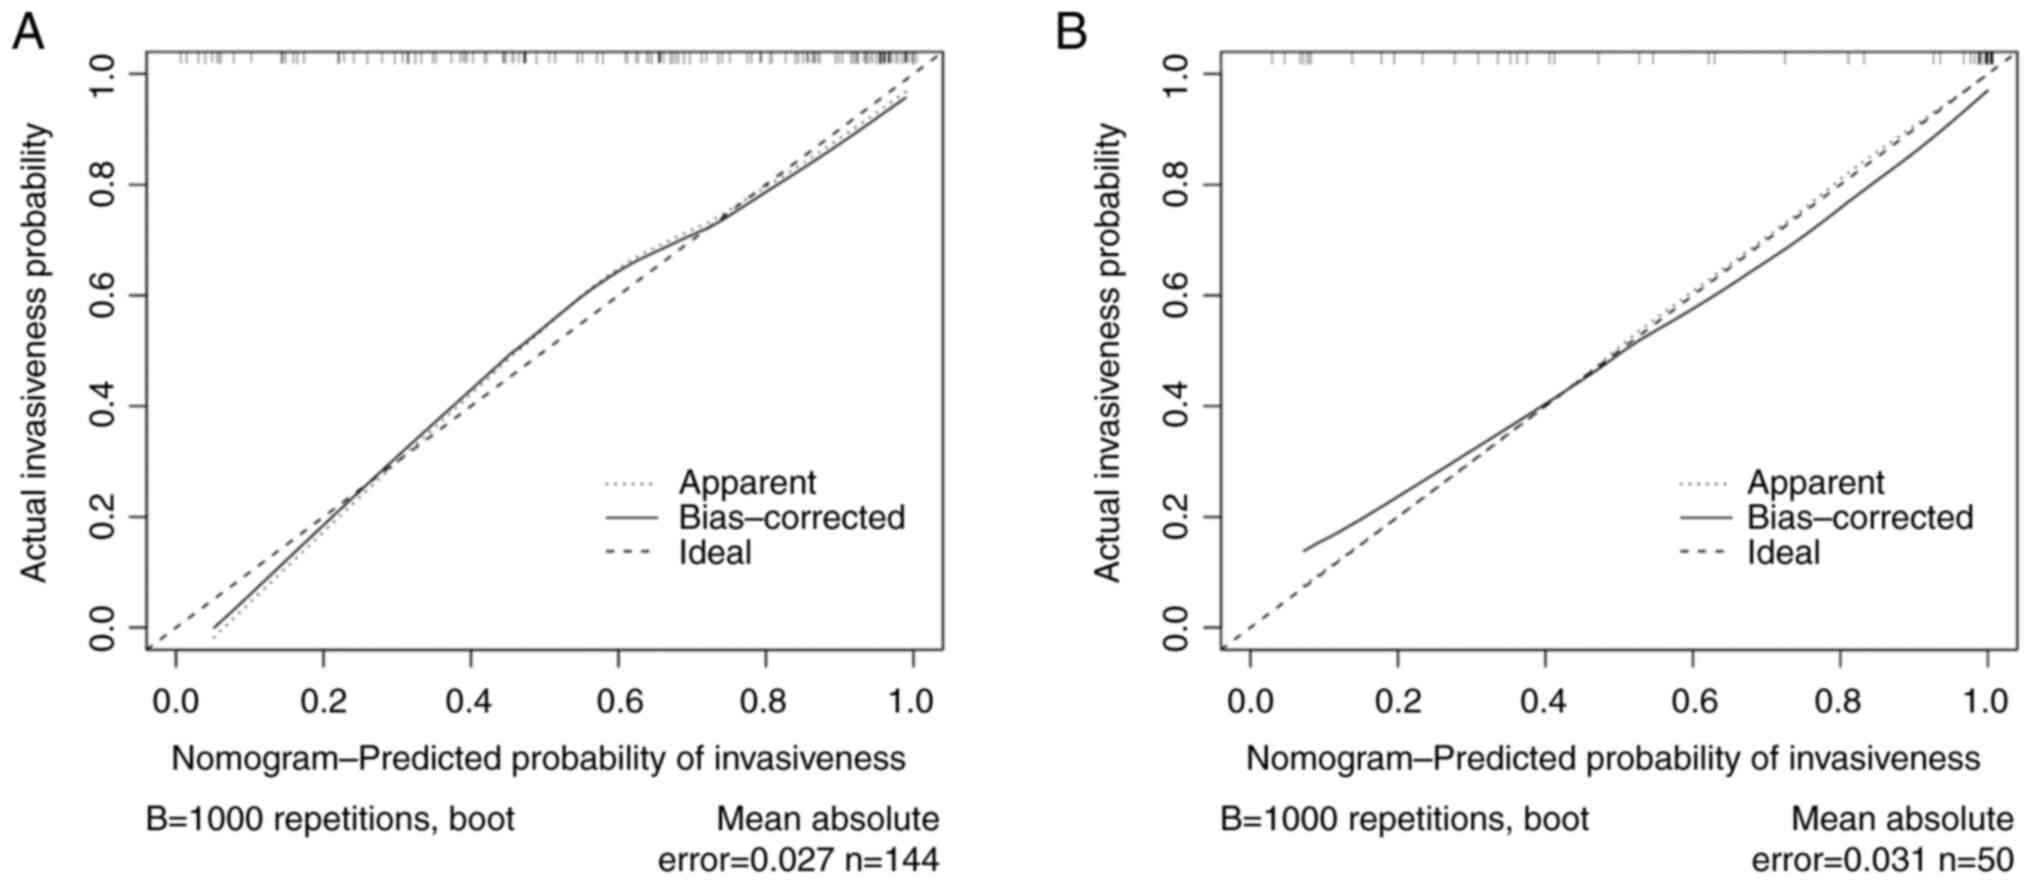
0.815 (95% CI, 0.905-0.969) in the verification cohort. The
nomogram was subjected to 1,000 bootstrap resamples for internal
validation and the calibration curve was plotted (Fig. 7). The mean absolute errors of the
calibration curves were 0.027 in the training cohort and 0.031 in
the validation cohort.
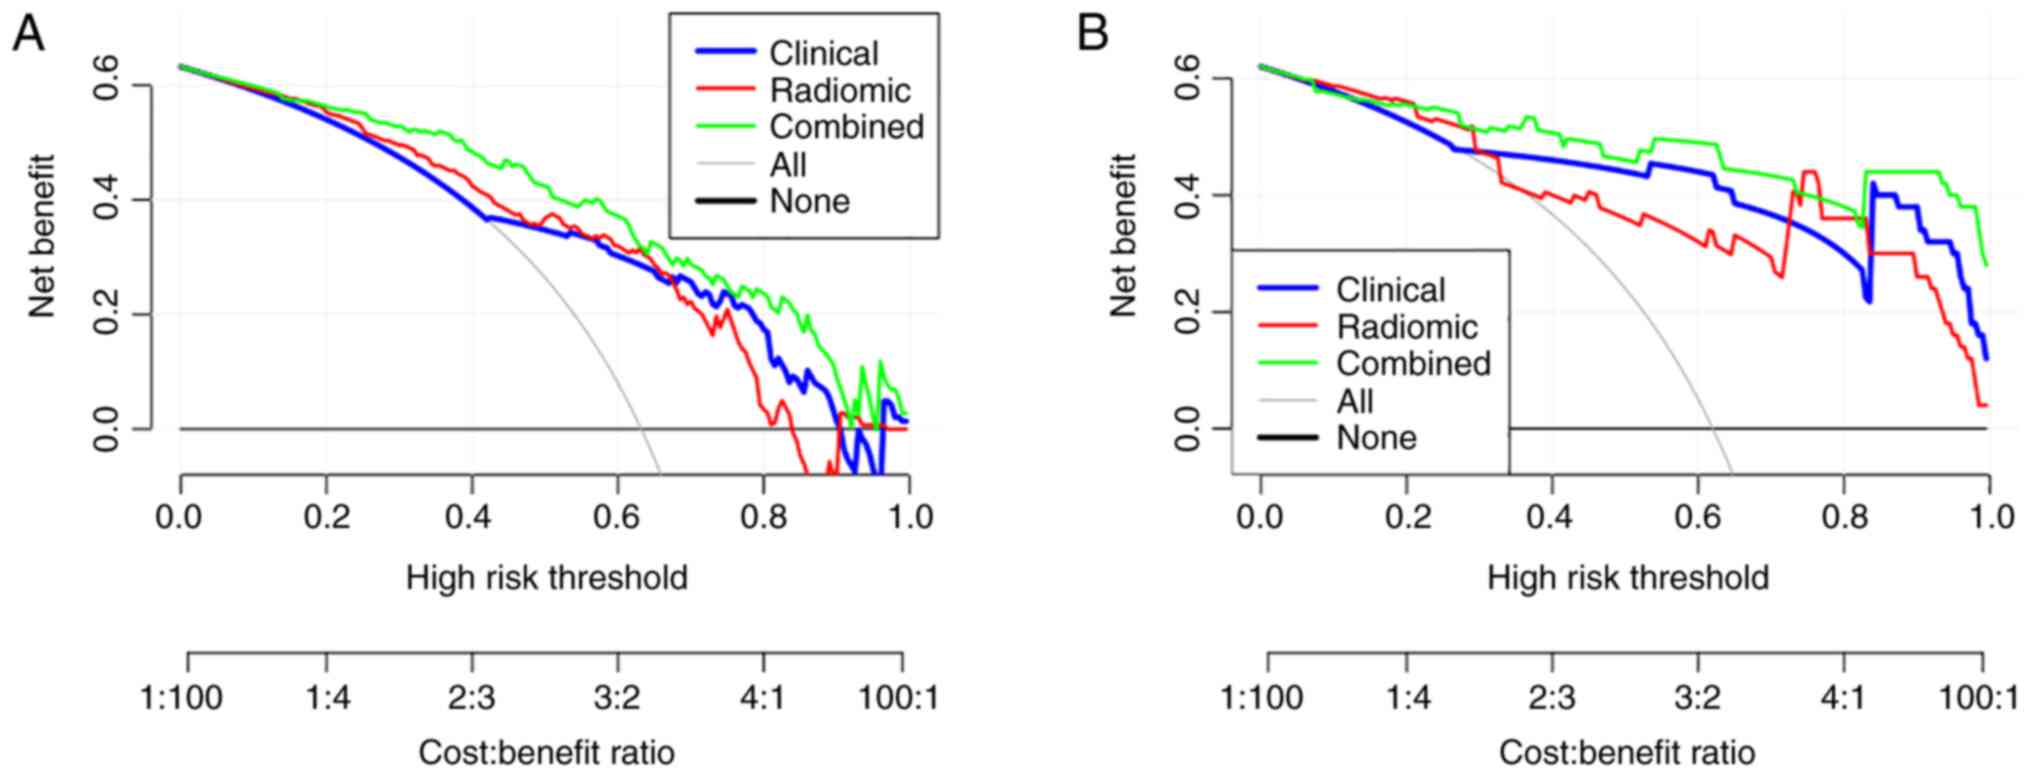
DCA
DCA is a method used to evaluate prediction models
(26). The clinical decision curve
was analysed based on the selected predictors (Fig. 8). A total of three predictive
models of GGO invasiveness, namely the clinical, radiomic and
combined models, were used in the training and verification groups.
The results are presented in Fig.
8A and B, where the x-axis
shows the threshold probability (Pt) and the y-axis shows the net
benefit, which was calculated by adding the advantages
(true-positive) and subtracting the disadvantages (false-positive).
Within a large range of Pt values (20-90%; Fig. 8), the combined model has a greater
net benefit than the clinical and radiomic models. For example,
when the threshold probability was 45%, the net benefit rate was
46.7% in the combined model, 36.2% in the clinical model and 38.1%
in the radiomic model. Therefore, the combined model has more
clinical significance in predicting the invasiveness of GGOs.
Discussion
To date, it is still a challenge for thoracic
surgeons to select the best treatment for pulmonary GGOs. The main
reason is that it is difficult to classify GGOs before surgery,
although a new classification of pulmonary adenocarcinoma was
defined in 2011(27). Preoperative
percutaneous CT-guided fine-needle aspiration biopsy, endobronchial
ultrasonography images and virtual bronchoscopy have been used for
the pathological diagnosis of GGOs, but the diagnostic yield
remains lower for smaller pGGOs (28,29).
An increasing number of studies have focused on identifying imaging
biomarkers for GGO classification through chest CT, especially for
the identification of invasive GGO lesions (30-40).
On chest CT, preinvasive GGOs often appear as pGGOs,
while invasive GGOs more often appear as larger, mixed GGOs
(29-32).
Eguchi et al (33) reported
that if the diameter of a pGGO is >11 mm, it is likely to be
invasive. Li et al (34)
reported a cut-off diameter of 13.5 mm for evaluating the
invasiveness of GGO nodules. In 2013, Lee et al (16) reported that the cut-off diameter
for invasive GGOs was 14 mm. Another study published in 2019
reported that in the partly solid group of GGOs, a diameter >1
cm was a significant factor for predicting invasiveness (35). A study performed on 232 patients
and published in 2015 found that the solid component sizes with
lung window setting (SCLW) and whole tumour sizes with mediastinal
window setting (WTMV) were significantly correlated with tumour
pathological invasion (36). The
ROC curve analysis showed that for all subjects, the predictability
of invasive results based on solid component size (such as SCLW and
WTMV) was improved compared with that based on the whole tumour
size (the maximum diameter of lung window tumour). This conclusion
is in agreement with the results of the present study. However, the
maximum tumour diameter was not an independent predictor of GGO
invasion, while consolidation was an independent predictor of GGO
invasion.
TA is an important type of medical image processing
that can measure the tissue heterogeneity characteristics otherwise
not observable by naked eyes, and can quantitatively display subtle
changes in the image pixel values and arrangement (17). To the best of our knowledge, only a
few studies have introduced TA and radiomic features of chest CT to
the differentiation of invasive pulmonary GGOs. Chae et al
(37) demonstrated that in
part-solid GGOs, higher kurtosis and a smaller mass could
significantly differentiate preinvasive lesions from invasive
pulmonary adenocarcinomas (IPAs). Li et al (38) found that the voxel count and the
correlation feature [correlation is a value between 0
(uncorrelated) and 1 (perfectly correlated) showing the linear
dependency of gray level values to their respective voxels in the
GLCM] were significant differentiators of preinvasive lesions from
IPAs and MIAs. Another study in 2018 found that pGGOs or mixed
lesions and fractal dimension were predictors of IAs that appear as
GGOs (39). In another study, a
support vector machine trained on all the heterogeneity indicators
showed high accuracy (88.1%) in differentiating between indolent
and invasive lesions (40). In
these studies, only 2D or 3D original texture features were used
and wavelet transform features were excluded. To the best of our
knowledge, the present study is the first that enrolled 107
original features and eight groups of wavelet features (each group
containing 93 wavelet feature factors) for radiomic predictor
selection to differentiate the invasiveness of GGOs. For
high-dimensional data, to avoid overfitting in the prediction,
MCP-LASSO regression and 10-fold cross-validation analysis were
used to identify relevant variables for the subsequent
establishment of the radiomic prediction model. Finally,
waveletHLL_ngtdm_Coarseness and waveletLHH_firstorder_Maximum were
selected as independent predictors of invasiveness.
Ngtdm_Coarseness is a measure of the average difference between the
centre voxel and its neighbourhood, and is an indicator of the
spatial change rate (41,42). A higher value indicates a lower
spatial rate of change and a more uniform local texture. In the
present study, the regression coefficient of
waveletHLL_ngtdm_coarseness was -23.616, which indicated that the
more uniform GGO the lower the probability of invasiveness.
Firstorder_Maximum is the maximum grey intensity in the region of
interest (43). The regression
coefficient of waveletLHH_firstorder_Maximum was -0.007, which
indicated that the smaller the maximum grey intensity of GGO the
higher the probability of invasiveness. The AUCs of
waveletHLL_ngtdm_Coarseness and waveletLHH_firstorder_Maximum were
0.692 (95% CI, 0.60-0.783) and 0.658 (95% CI, 0.557-0.758),
respectively. However, the combination of the two radiomic
predictors showed improved predictive ability for GGO invasion
(training group: AUC, 0.719; 95% CI, 0.628-0.81; validation group:
AUC, 0.87; 95% CI, 0.776-0.966).
In the combined prediction model for differentiating
the invasiveness of GGOs, predictors were selected from all six
clinical features and 613 stable radiomic features. Consolidation,
waveletHLL_ngtdm_Coarseness, waveletLHH_firstorder_ Maximum and
waveletLLH_glrlm_LongRunEmphasis were considered.
Glrlm_LongRunEmphais is a measure of the distribution of long run
lengths, and it can reflect the distribution or adjacent
relationships of pixels in the images (44). The regression coefficient of
waveletLLH_ glrlm_Longrunemphasis was -0.827, which indicated that
GGOs with shorter long-range lengths and finer textures are more
likely to be invasive. The predictive ability of the combined
prediction model was improved compared with that of any single
prediction model developed with clinical or radiomic features. The
nomogram for the individual prediction model was constructed with
the four predictors. Each GGO has a corresponding value of
consolidation, waveletHLL_ngtdm_Coarseness,
waveletLLH_glrlm_LongRunEmphasis and waveletLHH_firstorder_Maximum
and the total score was calculated. In clinical application, the
probability of the invasiveness of GGO with a total score >220
is >95% (Fig S1). Clinically,
for such nodules, radical surgery such as lobectomy or segmental
resection and lymph node dissection are preferred. For nodules with
a total score <160, the probability of invasiveness is <10%
(Fig S1). Clinically, regular
observation or localized resection are the main methods. The cutoff
point of the nomogram is 0.5 and the corresponding total score is
185. The GGO can be diagnosed as having invasive potential GGO when
the total score is >185. The C-index (training cohort: 0.864;
95% CI, 0.833-0.895; and validation cohort: 0.937; 95% CI,
0.905-0.969) and the calibration curve showed that the nomogram
used in the present study had good prediction ability.
Traditional diagnostic test indicators, such as
sensitivity, specificity and AUC, only measure the diagnostic
accuracy of the prediction model, but fail to consider the clinical
utility of a specific model. The advantage of DCA is that it
integrates the preferences of patients or decision makers into the
analysis (26). In the present
study, three predictive models of GGO invasiveness were analysed
using DCA, and the combined model showed more clinical significance
in predicting the invasiveness of GGOs.
The present study has some limitations. Due to the
small sample size, the pGGO group was not analysed individually.
Although we hypothesized that the maximum diameter and some
radiomic features might show a good prediction ability for
invasiveness in the pGGO group, this hypothesis needs to be
confirmed by studies with larger sample sizes in the future.
In conclusion, the combined prediction model
constructed with clinical and radiomic predictors showed a good
ability to predict invasiveness in GGOs. The present study may help
thoracic surgeons select the optimal treatment for patients with
pulmonary GGOs.
Supplementary Material
Related computerized programs for
statistical analysis with R
The distribution of the scores in the
training set and validation set.
Acknowledgements
Not applicable.
Funding
Funding: This study was supported by the Beijing Municipal
Administration of Hospital Clinical Medicine Development of Special
Funding Support (grant no. XMLX201702).
Availability of data and materials
The datasets used and/or analysed during the current
study are available from the corresponding author on reasonable
request. All codes used with R are available in Appendix S1.
Authors' contributions
YD was responsible for conceiving and designing the
study, data analysis, writing of the manuscript and all manuscript
revisions. RW and KQ were responsible for patient data collection
and analysis. JL was responsible for CT data collection and editing
of the manuscript. YZ was responsible for project
conceptualization, manuscript revisions and editing of the
manuscript. YD and YZ confirm the authenticity of all the raw data.
All authors read and approved the final manuscript.
Ethics approval and consent to
participate
The present study was approved by the Medical
Research Ethics Committee of Shijingshan Hospital of Beijing City
(Beijing, China; approval no. 2020-12). All the procedures
involving human participants were performed in accordance with the
ethical standards of both institutional and national research
committees. Written informed consent was obtained before surgery
from either the patients or their representatives.
Patient consent for publication
Not applicable.
Competing interests
The authors declare that they have no competing
interests.
References
|
1
|
Tsutsui S, Ashizawa K, Minami K, Tagawa T,
Nagayasu T, Hayashi T and Uetani M: Multiple focal pure
ground-glass opacities on high-resolution CT images: Clinical
significance in patients with lung cancer. AJR Am J Roentgenol.
195:W131–W138. 2010.PubMed/NCBI View Article : Google Scholar
|
|
2
|
Miller A, Markowitz S, Manowitz A and
Miller JA: Lung cancer screening using low-dose high-resolution CT
scanning in a high-risk workforce: 3500 nuclear fuel workers in
three US states. Chest. 125 (Suppl 5):152S–153S. 2004.PubMed/NCBI
|
|
3
|
Migliore M, Fornito M, Palazzolo M,
Criscione A, Gangemi M, Borrata F, Vigneri P, Nardini M and Dunning
J: Ground glass opacities management in the lung cancer screening
era. Ann Transl Med. 6(90)2018.PubMed/NCBI View Article : Google Scholar
|
|
4
|
Ye T, Deng L, Xiang J, Zhang Y, Hu H, Sun
Y, Li Y, Shen L, Wang S, Xie L and Chen H: Predictors of pathologic
tumor invasion and prognosis for ground glass opacity featured lung
adenocarcinoma. Ann Thorac Surg. 106:1682–1690. 2018.PubMed/NCBI View Article : Google Scholar
|
|
5
|
Travis WD, Brambilla E, Noguchi M,
Nicholson AG, Geisinger KR, Yatabe Y, Beer DG, Powell CA, Riely GJ,
Van Schil PE, et al: International association for the study of
lung cancer/American thoracic society/European respiratory society
international multidisciplinary classification of lung
adenocarcinoma. J Thorac Oncol. 6:244–285. 2011.PubMed/NCBI View Article : Google Scholar
|
|
6
|
Dai J, Yu G and Yu J: Can CT imaging
features of ground-glass opacity predict invasiveness? A
meta-analysis. Thorac Cancer. 9:452–458. 2018.PubMed/NCBI View Article : Google Scholar
|
|
7
|
Park CM, Goo JM, Lee HJ, Lee CH, Kim HC,
Chung DH and Im JG: CT findings of atypical adenomatous hyperplasia
in the lung. Korean J Radiol. 7:80–86. 2006.PubMed/NCBI View Article : Google Scholar
|
|
8
|
Nagao M, Murase K, Yasuhara Y, Ikezoe J,
Eguchi K, Mogami H, Mandai K, Nakata M and Ooshiro Y: Measurement
of localized ground-glass attenuation on thin-section computed
tomography images: Correlation with the progression of
bronchioloalveolar carcinoma of the lung. Invest Radiol.
37:692–697. 2002.PubMed/NCBI View Article : Google Scholar
|
|
9
|
Van Schil PE, Asamura H, Rusch VW,
Mitsudomi T, Tsuboi M, Brambilla E and Travis WD: Surgical
implications of the new IASLC/ATS/ERS adenocarcinoma
classification. Eur Respir J. 39:478–486. 2012.PubMed/NCBI View Article : Google Scholar
|
|
10
|
Koike T, Togashi K, Shirato T, Sato S,
Hirahara H, Sugawara M, Oguma F, Usuda H and Emura I: Limited
resection for noninvasive bronchioloalveolar carcinoma diagnosed by
intraoperative pathologic examination. Ann Thorac Surg.
88:1106–1111. 2009.PubMed/NCBI View Article : Google Scholar
|
|
11
|
Pedersen JH, Saghir Z, Wille MM, Thomsen
LH, Skov BG and Ashraf H: Ground-glass opacity lung nodules in the
era of lung cancer CT screening: Radiology, pathology and clinical
management. Oncology (Williston Park). 30:266–274. 2016.PubMed/NCBI
|
|
12
|
Chou HP, Lin KH, Huang HK, Lin LF, Chen
YY, Wu TH, Lee SC, Chang H and Huang TW: Prognostic value of
positron emission tomography in resected stage IA non-small cell
lung cancer. Eur Radiol. 31:8021–8029. 2021.PubMed/NCBI View Article : Google Scholar
|
|
13
|
Inoue M, Minami M, Sawabata N, Utsumi T,
Kadota Y, Shigemura N and Okumura M: Clinical outcome of resected
solid-type small-sized c-stage IA non-small cell lung cancer. Eur J
Cardiothorac Surg. 37:1445–1449. 2010.PubMed/NCBI View Article : Google Scholar
|
|
14
|
Higuchi M, Yaginuma H, Yonechi A, Kanno R,
Ohishi A, Suzuki H and Gotoh M: Long-term outcomes after
video-assisted thoracic surgery (VATS) lobectomy versus lobectomy
via open thoracotomy for clinical stage IA non-small cell lung
cancer. J Cardiothorac Surg. 9(88)2014.PubMed/NCBI View Article : Google Scholar
|
|
15
|
Zhang J, Wu J, Tan Q, Zhu L and Gao W: Why
do pathological stage IA lung adenocarcinomas vary from prognosis?:
A clinicopathologic study of 176 patients with pathological stage
IA lung adenocarcinoma based on the IASLC/ATS/ERS classification. J
Thorac Oncol. 8:1196–1202. 2013.PubMed/NCBI View Article : Google Scholar
|
|
16
|
Lee SM, Park CM, Goo JM, Lee HJ, Wi JY and
Kang CH: Invasive pulmonary adenocarcinomas versus preinvasive
lesions appearing as ground-glass nodules: Differentiation by using
CT features. Radiology. 268:265–273. 2013.PubMed/NCBI View Article : Google Scholar
|
|
17
|
Lambin P, Rios-Velazquez E, Leijenaar R,
Carvalho S, van Stiphout RGPM, Granton P, Zegers CML, Gillies R,
Boellard R, Dekker A and Aerts HJWL: Radiomics: Extracting more
information from medical images using advanced feature analysis.
Eur J Cancer. 48:441–446. 2012.PubMed/NCBI View Article : Google Scholar
|
|
18
|
Wilson R and Devaraj A: Radiomics of
pulmonary nodules and lung cancer. Transl Lung Cancer Res. 6:86–91.
2017.PubMed/NCBI View Article : Google Scholar
|
|
19
|
Han F, Wang H, Zhang G, Han H, Song B, Li
L, Moore W, Lu H, Zhao H and Liang Z: Texture feature analysis for
computer-aided diagnosis on pulmonary nodules. J Digit Imaging.
28:99–115. 2015.PubMed/NCBI View Article : Google Scholar
|
|
20
|
Kumar V, Gu Y, Basu S, Berglund A,
Eschrich SA, Schabath MB, Forster K, Aerts HJWL, Dekker A,
Fenstermacher D, et al: Radiomics: The process and the challenges.
Magn Reson Imaging. 30:1234–1248. 2012.PubMed/NCBI View Article : Google Scholar
|
|
21
|
Zhao S, Ren W, Zhuang Y and Wang Z: The
influence of different segmentation methods on the extraction of
imaging histological features of hepatocellular carcinoma CT. J Med
Syst. 43:1–7. 2019.PubMed/NCBI View Article : Google Scholar
|
|
22
|
Çinarer G, Gürsel B and Haşim A:
Prediction of glioma grades using deep learning with wavelet
radiomic features. Appl Sci. 10(6296)2020.
|
|
23
|
Korpershoek YJ, Slot JC, Effing TW,
Schuurmans MJ and Trappenburg JC: Self-management behaviors to
reduce exacerbation impact in COPD patients: A Delphi study. Int J
Chron Obstruct Pulmon Dis. 12:2735–2746. 2017.PubMed/NCBI View Article : Google Scholar
|
|
24
|
Dang Y, Wang R, Qian K, Lu J, Zhang H and
Zhang Y: Clinical and radiological predictors of epidermal growth
factor receptor mutation in nonsmall cell lung cancer. J Appl Clin
Med Phys. 22:271–280. 2021.PubMed/NCBI View Article : Google Scholar
|
|
25
|
Dong M, Hou G, Li S, Li N, Zhang L and Xu
K: Preoperatively estimating the malignant potential of mediastinal
lymph nodes: A pilot study toward establishing a robust radiomics
model based on contrast-enhanced CT imaging. Front Oncol.
10(558428)2021.PubMed/NCBI View Article : Google Scholar
|
|
26
|
Vickers AJ and Elkin BB: Decision curve
analysis: A novel method for evaluating prediction models. Med
Decis Making. 26:565–574. 2006.PubMed/NCBI View Article : Google Scholar
|
|
27
|
Sun F, Xi J, Zhan C, Yang X, Wang L, Shi
Y, Jiang W and Wang Q: Ground glass opacities: Imaging, pathology,
and gene mutations. J Thorac Cardiovasc Surg. 156:808–813.
2018.PubMed/NCBI View Article : Google Scholar
|
|
28
|
Shimizu K, Ikeda N, Tsuboi M, Hirano T and
Kato H: Percutaneous CT- guided fine needle aspiration for lung
cancer smaller than 2 cm and revealed by ground-glass opacity at
CT. Lung Cancer. 51:173–179. 2006.PubMed/NCBI View Article : Google Scholar
|
|
29
|
Ikezawa Y, Shinagawa N, Sukoh N, Morimoto
M, Kikuchi H, Watanabe M, Nakano K, Oizumi S and Nishimura M:
Usefulness of endobronchial ultrasonography with a guide sheath and
virtual bronchoscopic navigation for ground-glass opacity lesions.
Ann Thorac Surg. 103:470–475. 2017.PubMed/NCBI View Article : Google Scholar
|
|
30
|
Zhang Y, Qiang JW, Ye JD, Ye XD and Zhang
J: High resolution CT in differentiating minimally invasive
component in early lung adenocarcinoma. Lung Cancer. 84:236–241.
2014.PubMed/NCBI View Article : Google Scholar
|
|
31
|
Lee HJ, Lee CH, Jeong YJ, Chung DH, Goo
JM, Park CM and Austin JHM: IASLC/ATS/ERS international
multidisciplinary classification of lung adenocarcinoma: Novel
concepts and radiologic implications. J Thorac Imaging. 27:340–353.
2012.PubMed/NCBI View Article : Google Scholar
|
|
32
|
Kobayashi Y, Ambrogio C and Mitsudomi T:
Ground-glass nodules of the lung in never-smokers and smokers:
Clinical and genetic insights. Transl Lung Cancer Res. 7:487–497.
2018.PubMed/NCBI View Article : Google Scholar
|
|
33
|
Eguchi T, Yoshizawa A, Kawakami S, Kumeda
H, Umesaki T, Agatsuma H, Sakaizawa T, Tominaga Y, Toishi M and
Hashizume M: Tumor size and computed tomography attenuation of
pulmonary pure ground-glass nodules are useful for predicting
pathological invasiveness. PLoS One. 9(e97867)2014.PubMed/NCBI View Article : Google Scholar
|
|
34
|
Li M, Wang Y, Chen Y and Zhang Z:
Identification of preoperative prediction factors of tumor subtypes
for patients with solitary ground-glass opacity pulmonary nodules.
J Cardiothorac Surg. 13(9)2018.PubMed/NCBI View Article : Google Scholar
|
|
35
|
Chen PH, Chang KM, Tseng WC, Chen CH and
Chao JI: Invasiveness and surgical timing evaluation by clinical
features of ground-glass opacity nodules in lung cancers. Thorac
Cancer. 10:2133–2141. 2019.PubMed/NCBI View Article : Google Scholar
|
|
36
|
Saji H, Matsubayashi J, Akata S, Shimada
Y, Kato Y, Kudo Y, Nagao T, Park J, Kakihana M, Kajiwara N, et al:
Correlation between whole tumor size and solid component size on
high-resolution computed tomography in the prediction of the degree
of pathologic malignancy and the prognostic outcome in primary lung
adenocarcinoma. Acta Radiol. 56:1187–1195. 2015.PubMed/NCBI View Article : Google Scholar
|
|
37
|
Chae HD, Park CM, Park SJ, Lee SM, Kim KG
and Goo JM: Computerized texture analysis of persistent part-solid
ground-glass nodules: Differentiation of preinvasive lesions from
invasive pulmonary adenocarcinomas. Radiology. 273:285–293.
2014.PubMed/NCBI View Article : Google Scholar
|
|
38
|
Li W, Wang X, Zhang Y, Li X, Li Q and Ye
Z: Radiomic analysis of pulmonary ground-glass opacity nodules for
distinction of preinvasive lesions, invasive pulmonary
adenocarcinoma and minimally invasive adenocarcinoma based on
quantitative texture analysis of CT. Chin J Cancer Res. 30:415–424.
2018.PubMed/NCBI View Article : Google Scholar
|
|
39
|
Xue X, Yang Y, Huang Q, Cui F, Lian Y,
Zhang S, Yao L, Peng W, Li X, Pang P, et al: Use of a radiomics
model to predict tumor invasiveness of pulmonary adenocarcinomas
appearing as pulmonary ground-glass nodules. Biomed Res Int.
2018(6803971)2018.PubMed/NCBI View Article : Google Scholar
|
|
40
|
Li M, Narayan V, Gill RR, Jagannathan JP,
Barile MF, Gao F, Bueno R and Jayender J: Computer-aided diagnosis
of ground-glass opacity nodules using open-source software for
quantifying tumor heterogeneity. Am J Roentgenol. 209:1216–1227.
2017.PubMed/NCBI View Article : Google Scholar
|
|
41
|
Haralick RM, Shanmugam K and Dinstein I:
Textural features for image classification. IEEE Trans Systems Man
Cybernetics. 6:610–621. 1973.PubMed/NCBI View Article : Google Scholar
|
|
42
|
Zhang Y, Ko CC, Chen JH, Chang KT, Chen
TY, Lim SW, Tsui YK and Su MY: Radiomics approach for prediction of
recurrence in non-functioning pituitary macroadenomas. Front Oncol.
10(590083)2020.PubMed/NCBI View Article : Google Scholar
|
|
43
|
Batur A, Kılınçer A, Ateş F, Demir NA and
Ergün R: Evaluation of systemic involvement of Coronavirus disease
2019 through spleen; size and texture analysis. Turk J Med Sci.
51:972–980. 2021.PubMed/NCBI View Article : Google Scholar
|
|
44
|
Chen ZW, Tang K, Zhao YF, Chen YZ, Tang
LJ, Li G, Huang OY, Wang XD, Targher G, Byrne CD, et al: Radiomics
based on fluoro-deoxyglucose positron emission tomography predicts
liver fibrosis in biopsy-proven MAFLD: A pilot study. Int J Med
Sci. 18:3624–3630. 2021.PubMed/NCBI View Article : Google Scholar
|