Introduction
Chronic kidney disease (CKD) has become a global
threat to public health. By 2040, CKD is anticipated to occupy the
top five major causes of patient death (1). CKD refers to continuous renal damage
and/or renal dysfunction and has high incidence rate and mortality
worldwide, imposing a heavy economic and social burden (2). CKD is associated with increased risk
of coronary artery disease, cardiac failure and sudden cardiac
death (3). Notwithstanding
progress that has been made in preventing, diagnosing and treating
CKD, this disease continues to represent a notable threat to public
health in the world. Therefore, there is a pressing need to develop
simpler and more practical treatments for CKD.
Ferroptosis is a cell death mode that differs from
apoptosis and necrosis and is induced by various small molecular
substances (4). It is cell death
caused by the metabolic disorder of intracellular lipid oxides and
extensive reactive oxygen species (ROS) production caused by iron
overload (5). Cell ferroptosis has
been reported to cause endoplasmic reticulum stress and
mitochondrial dysfunction in renal cells, affecting the severity
and prognosis of chronic renal injury (6). Zhou et al (7) found that in the kidneys of patients
with CKD and murine unilateral ureteral obstruction (UUO) or
ischemia-reperfusion injury (IRI) model systems, expression of
glutathione peroxidase 4 (GPX4) in renal tubular epithelial cells
decreased while content of 4-hydroxynonenol increased. Moreover,
compared with the healthy control group, inhibiting iron death
notably decreases renal injury, interstitial fibrosis and
inflammatory cell accumulation in UUO or IRI mice (7). However, to the best of our knowledge,
ferroptosis-associated genes in CKD remain poorly characterized and
require additional investigation. The investigation of the roles of
these potential ferroptosis-associated genes in CKD may highlight
novel biomarkers for treating this disease.
Bioinformatics is a multidisciplinary,
interdisciplinary approach that integrates molecular biological
analyses and technological innovation (8). It is growing into a significant
computational tool to elucidate the molecular mechanism of disease
(9). Furthermore, minimally
invasive blood-based analysis of ferroptotic activity can offer
clear insight into underlying disease status (10). In the present study, peripheral
blood mononuclear cells (PBMCs) were leveraged as model targets to
conduct bioenergetic analysis and monitor disease progression. PBMC
samples contain a T, B and natural killer (NK) cells, as well as
monocytes, that may represent ideal targets for studies of
ferroptotic activity and other biosignatures of interest (11). PBMCs also reflect systemic shifts
in physiological homeostasis and previous studies have explored
chronic disease-associated changes in PBMC bioenergetics (12-15).
In the present study, the dataset GSE15072 from the Gene Expression
Omnibus (GEO) database of PBMCs of patients with CKD undergoing
either conservative treatment (CKD; n=9) or haemodialysis (HD;
n=12), as well as healthy controls, were analysed using
bioinformatics tools. Gene Ontology (GO) and Kyoto Encyclopaedia of
Genes and Genomes (KEGG) pathway enrichment analyses and
correlation analyses were used to analyse the differentially
expressed ferroptosis-associated genes (DFGs). Finally, expression
levels of key ferroptosis genes were further verified by RT-qPCR
analysis of the CKD rats and healthy renal tissue.
Materials and methods
Bioinformatics
GSE15072 mRNA profiles (GPL96 platform; Affymetrix
Human Genome U133A Array; ncbi.nlm.nih.gov/geo/query/acc.cgi?acc=GSE15072) were
downloaded from GEO database (ncbi.nlm.nih.gov/geo/). GSE15072 consisted of 29
samples, including eight PBMC samples from healthy controls (NORM),
9 patients with CKD and 12 with HD. The R software (r-project.org/version 3.4.0) and Bioconductor
website(www.bioconductor.org/clusterProfiler) (16,17)
were utilized to identify the differentially expressed genes
(DEGs). The limma package (bioconductor.org/packages/release/bioc/html/limma.html/version
3.42.2) was employed to normalize the gene expression profiles.
Unpaired Student's t test was utilized to find corresponding
P-values for gene symbols according to the predetermined cut-off
criteria P<0.05 and |log[fold-change (FC)]|>1, thus the DEGs
between patients with CKD and healthy control were determined. The
heatmap was created using pheatmap package (bioconductor.org/packages/release/bioc/html/heatmaps.html/versions/1.0.12)
in R software. Furthermore, principal component analysis (PCA)
(18) was conducted to verify the
repeatability of the data in GSE15072. R ‘ggplot2’ package
(http://docs.ggplot2.org/current/Version
3.1.0) (19) was used to draw the
PCA.
Screening DFGs
To identify ferroptosis-related mRNAs, 382
ferroptosis-associated genes were retrieved from the FerrDb website
(http://www.zhounan.org/ferrdb/)
(20). The union sets of DEGs
associated with ferroptosis were validated by a Venn diagram
analysis using the Interacti-Venn website (bioinfogp.cnb.csic.es/tools/venny/index.html/version
2.1) (21). The heatmap and PCA
were used for analysing ferroptosis-associated genes (Table SI), as aforementioned.
Subsequently, R ‘ggplot2’
package((http://docs.ggplot2.org/current/Version 3.1.0) (19) was used to draw the box plot.
GO and KEGG analysis
The GO((http://www.geneontology.org/) (22) and KEGG((http://www.genome.jp/kegg/) (23) enrichment were used for
ferroptosis-associated gene function analyses. Analysed GO terms
included molecular function (MF), cellular component (CC) and
biological process (BP).
Immune infiltration analysis
The CIBERSORT algorithm (cibersort.stanford.edu/) (24) was applied to examine the
ferroptosis-associated genes and the ratio of 20 immunological cell
types such as M0/M1/M2 macrophages, eosinophils, neutrophils, γδT,
regulatory T (Treg), naïve, resting and activated memory
CD4+ T cells, as well as monocytes CD8+ T,
naïve and memory B, resting and activated NK, resting mast, plasma
and resting and activated dendritic cells were obtained. Moreover,
the association between prognostic genes and immune cells was
assessed via Spearman's correlation test.
Protein-protein interaction (PPI) and
correlation analyses of DFGs
The interaction among ferroptosis-associated genes
was examined using STRING online database (https://string-db.org/version 11.0) and Cytoscape
(manual.cytoscape.org/version 3.8.1;
Cytoscape Consortium, San Diego, CA, USA) (25). DFG correlations were analysed using
the ‘Corrplot’ package ((https://github.com/taiyun/corrplot) in R software
(Spearman correlation analysis).
Animals
National Institutes of Health guidelines (26) were followed to conduct animal
studies with pre-approval of the Animal Ethical and Welfare
Committee of Kunming Medical University (approval no.
Kmmu20221379). Male Sprague-Dawley (SD) rats of 6 weeks of age
(180-200 g) were purchased from the Experimental Animal Center of
Kunming Medical University [specific-pathogen-free; license no.
SYXK (Dian) k2020-0006] and were housed under standard conditions
(12/12-h light/dark cycle; 22-25˚C; 50-60% humidity). During the
period of the experiment, these rats took food and water
freely.
Animal model
A total of 22 male SD rats were randomized into
healthy control and CKD groups, with 11 rats in each group. CKD
model rats were prepared as described below. Anesthetization was
induced by inhalation of 2.5% isoflurane and was maintained with
1.5% isoflurane. Rats were intravenously injected via the tail vein
with Adriamycin (3.5 mg/kg in saline; Sigma-Aldrich; Merck KGaA).
After two weeks, a second dose of the Adriamycin solution was
administered. In addition, healthy control group received an equal
volume normal saline injections. After 8 weeks from the final
administration, blood urea nitrogen (BUN) and serum creatinine
(Scr) were quantified to assess successful model generation. Then
2.5% isoflurane was used to anesthetize rats prior to euthanasia
via cervical dislocation. After rats had ceased breathing, the
hearts were no longer beating and paws and eyeballs had turned
white, their left renal tissue was harvested. Each left kidney was
split into two, with one portion undergoing 4% paraformaldehyde
fixation before histological analysis and the other being
snap-frozen with liquid nitrogen before storage at -80˚C.
Histological analysis
Following fixation overnight using 4%
paraformaldehyde at room temperature, renal tissue samples were
paraffin-embedded, cut into 4-µm slices and deparaffinized with
ascending series of alcohol (95, 90, 80 and 70% alcohol each 10
min). For H&E staining (Wuhan Servicebio Technology Co., Ltd.),
the sections were stained with hematoxylin for 1 min and eosin for
20 sec at room temperature, and then washed with tap water. Next,
the sections were dehydrated in 100% alcohol, permeabilized with
xylene and mounted with neutral gum. For Masson staining (Wuhan
Servicebio Technology Co., Ltd.), the sections were soaked in
Masson A overnight and rinsed with tap water. Next, Masson B,
Masson C were prepared into Masson solution according to the ratio
of 1:1. Then, the sections were stained with Masson solution for 1
min. After washing with running water, the sections were
differentiated with 1% hydrochloric acid alcohol and rinsed with
tap water. The sections were then treated with Masson D for 6 min,
washed with tap water, immersed in a Masson E for 1 min and Masson
F for 2-30s. Sections were rinsed with 1% glacial acetic acid and
then dehydrated with anhydrous ethanol. Finally, the sections were
immersed with xylene and sealed with neutral gum. For PAS staining
(Wuhan Servicebio Technology Co., Ltd.), the sections were stained
with PAS dye solution B for 10-15 min, rinsed with tap water, and
then rinsed twice with distilled water. Next, the sections were
stained with PAS A for 25-30 min in the dark and rinsed with tap
water for 5 min. Then the sections were stained with PAS C for 30s
and rinsed with tap water. Subsequently, the sections were treated
with Hydrochloric acid solution and Ammonia, each step required
washing with distilled water. Then the sections were dehydrated
with alcohol and xylene and mounted in neutral gum. Morphological
changes in the renal tissues were evaluated using an Olympus light
microscope (magnification, x400; Olympus Corporation).
RT-qPCR
Total RNA in kidney tissue was extracted using RNA
Extracting Solution (Wuhan Servicebio Technology Co., Ltd. G3013)
according to the manufacturer's instructions. Total RNA (1 µg) was
reverse transcribed into cDNA using the RevertAid reverse
transcriptase kit (Wuhan Servicebio Technology Co., Ltd.) under the
following conditions: 25˚C for 5 min, 42˚C for 30 min and 85˚C for
5 sec. qPCR was performed using 2X SYBR Green qPCR Master Mix kit
(Wuhan Servicebio Technology Co., Ltd. G3320). Thermocycling
conditions for PCR were: Pre-incubation at 95˚C for 30 sec; 40
cycles of 95˚C for 15 sec, annealing 60˚C for 30 sec. Subsequently,
2.0% agarose gel electrophoresis was used to separate PCR
amplicons, which underwent densitometric analysis. Applied
Biosystems 7300 real-time PCR system (Applied Biosystems; Thermo
Fisher Scientific, Inc.) and software (7500 Fast System SDS
Software version 1.4) were used with primers for STAT3, Jun kinase
(JUN), Mechanistic target of rapamycin (MTOR), vascular
endothelial-derived growth factor (VEGF), Heme oxygenase 1 (HMOX1),
Heat shock protein A5 (HSPA5), Mitogen-activated protein kinase 14
(MAPK14), activation transcription factor 3 (ATF3), solute carrier
family 2 member 1 (SLC2A1), and GAPDH, as listed in Table I. mtDNA levels were quantified
using the 2-ΔΔCq method for triplicate samples with GAPDH as the
internal reference (27).
 | Table IPrimer sequences. |
Table I
Primer sequences.
| Gene | Forward | Reverse |
|---|
| STAT3 |
5'-TTAACATTCTGGGCACGAACA-3' |
5'-TGACAATCAAGGAGGCATCAC-3' |
| JUN |
5'-TGGGCACATCACCACTACACC-3' |
5'-GAAGTTGCTGAGGTTGGCGTAG-3' |
| MTOR |
5'-ACCCTCCATCCACCTCATCAG-3' |
5'-CCTGGTCATTCAGAGCCACAAA-3' |
| VEGF |
5'-GCACTGGACCCTGGCTTTACT-3' |
5'-AACTTCACCACTTCATGGGCTTT-3' |
| HMOX1 |
5'-CACAGGGTGACAGAAGAGGCT-3' |
5'-TCTGTGAGGGACTCTGGTCTTTG-3' |
| HSPA5 |
5'-TTCTGCTTGATGTGTGTCCTCTTAC-3' |
5'-CACCTTCGTAGACCTTGATTGTTAC-3' |
| MAPK14 |
5'-CCCGAGCGATACCAGAACCT-3' |
5'-TGGCGTGAATGATGGACTGA-3' |
| ATF3 |
5'-GGGTCACTGGTGTTTGAGGATT-3' |
5'-TTTGTTTCTTTCCCGCCG-3' |
| SLC2A1 |
5'-AGGAGATGAAAGAAGAGGGTCG-3' |
5'-GTGTTGACGATACCCGAGCC-3' |
| GAPDH |
5'-CTGGAGAAACCTGCCAAGTATG-3' |
5'-GGTGGAAGAATGGGAGTTGCT-3' |
Statistical analysis
All experiments were performed in triplicate. Data
are expressed as the mean ± standard deviation. R (version 3.6.2
x64; R Foundation for Statistical Computing) (28) was used for statistical analyses.
Unpaired Student's t test was used to analyse gene expression
levels of the animal samples with SPSS version 23.0 (IBM Corp.).
P<0.05 was considered to indicate a significant difference.
Results
Validation of DFGs in COPD
Patients
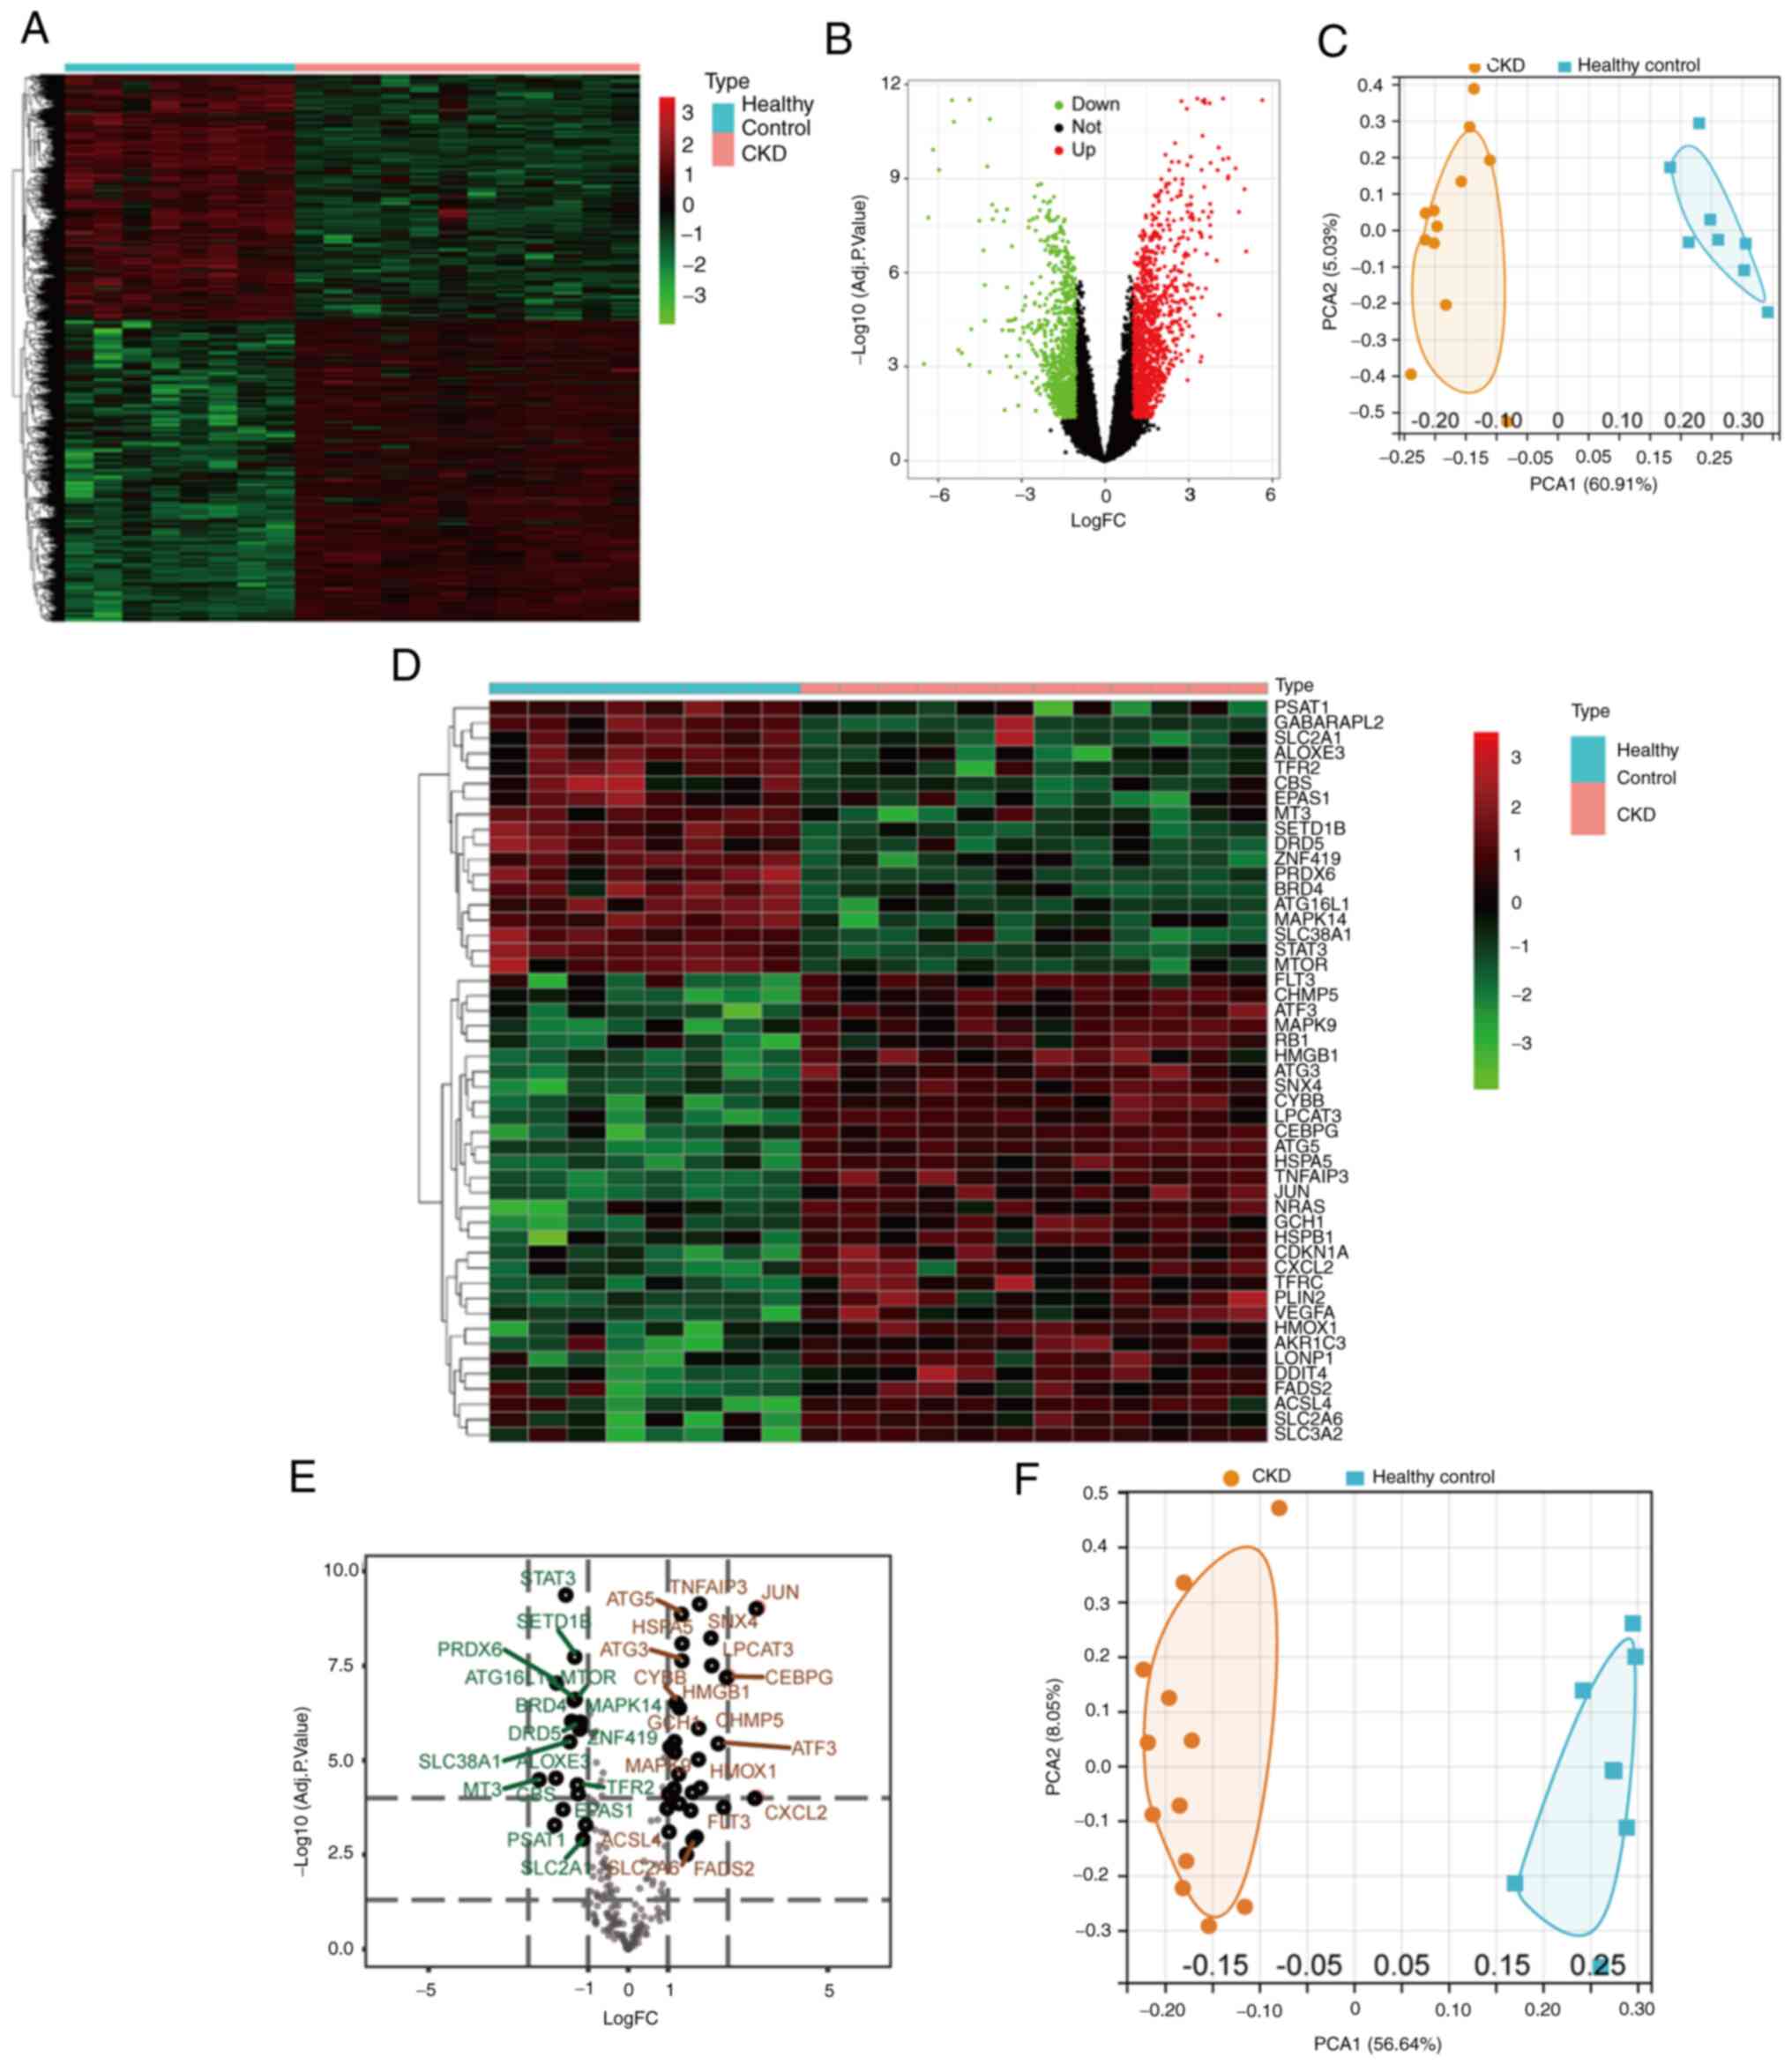
DFGs were identified following batch correction and
microarray standardization for GSE15072. A total of 2,247 DFGs were
identified, consisting of 1,238 up- and 1,009 downregulated genes
(Fig. 1B). The heatmap in Fig. 1A presents the expression levels of
DFGs. PCA was performed to examine the repeatability of intra-group
data, which revealed that the data in GSE15072 had good
repeatability (Fig. 1C). By taking
the intersection of ferroptosis-related genes and DEGs, 49 DFGs
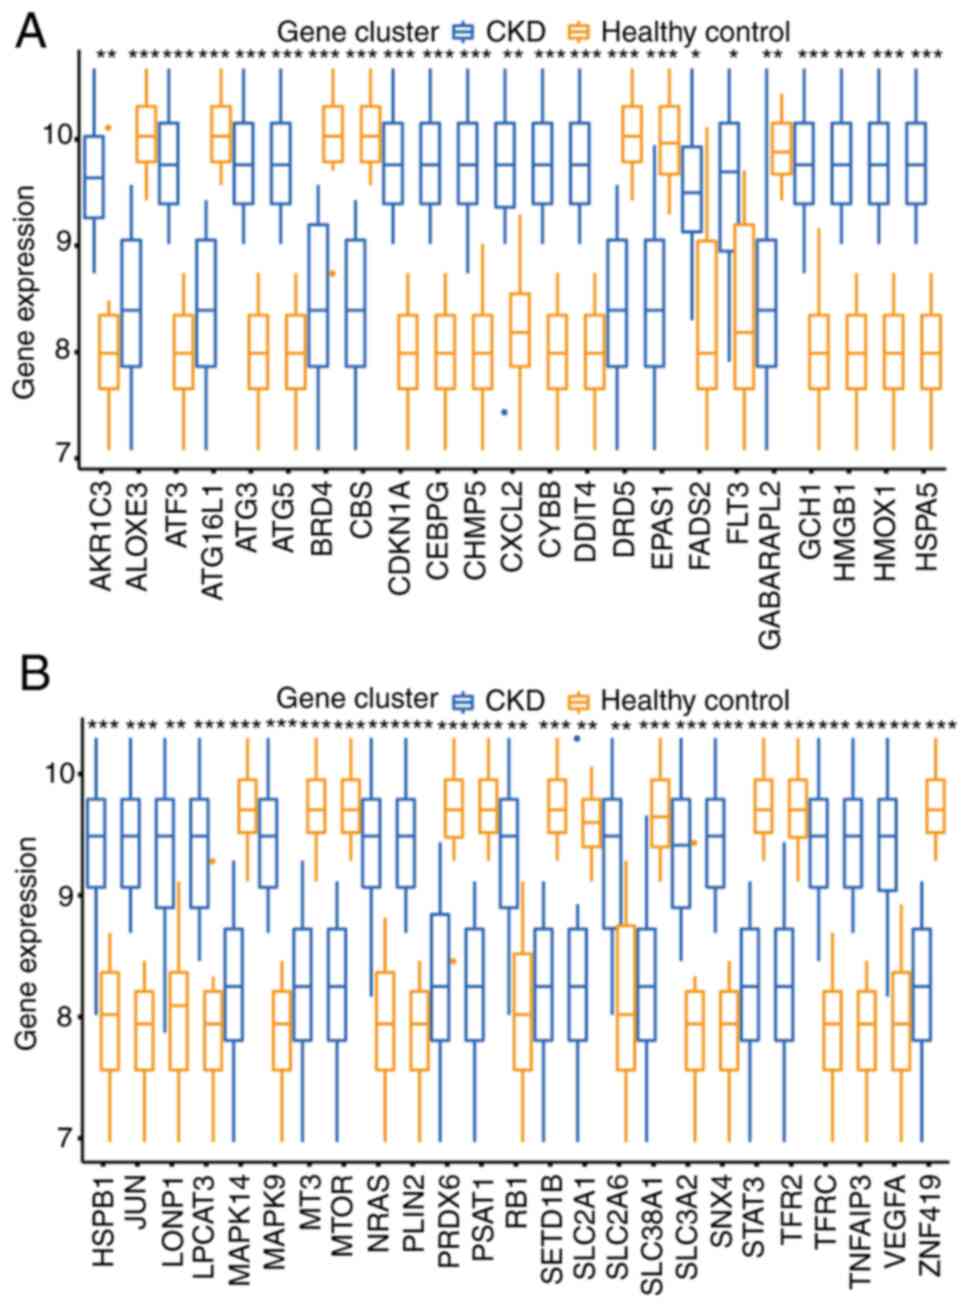
were identified between CKD and normal groups (Fig. 1D and E). PCA of DFGs is displayed in Fig. 1F. Moreover, box plots demonstrated
the expression of 49 DFGs in CKD and normal samples (Fig. 2). The top five up-regulated genes
of the CKD group included aldo-keto reductase 1C3, ATF3,
antithymocyte globulin 3 (ATG3), ATG5 and cyclin-dependent kinase
inhibitor 1 (CDKN1A), and the top five downregulated genes included
arachidonate lipoxygenase 3 (ALOXE3), autophagy related 16 like 1
(ATG16L1), bromodomain-containing protein 4 (BRD4), cystathionine
β-synthase (CBS), and dopamine receptor D5 (DRD5) (Fig. 2).
Pathway enrichment analysis of
DFGs
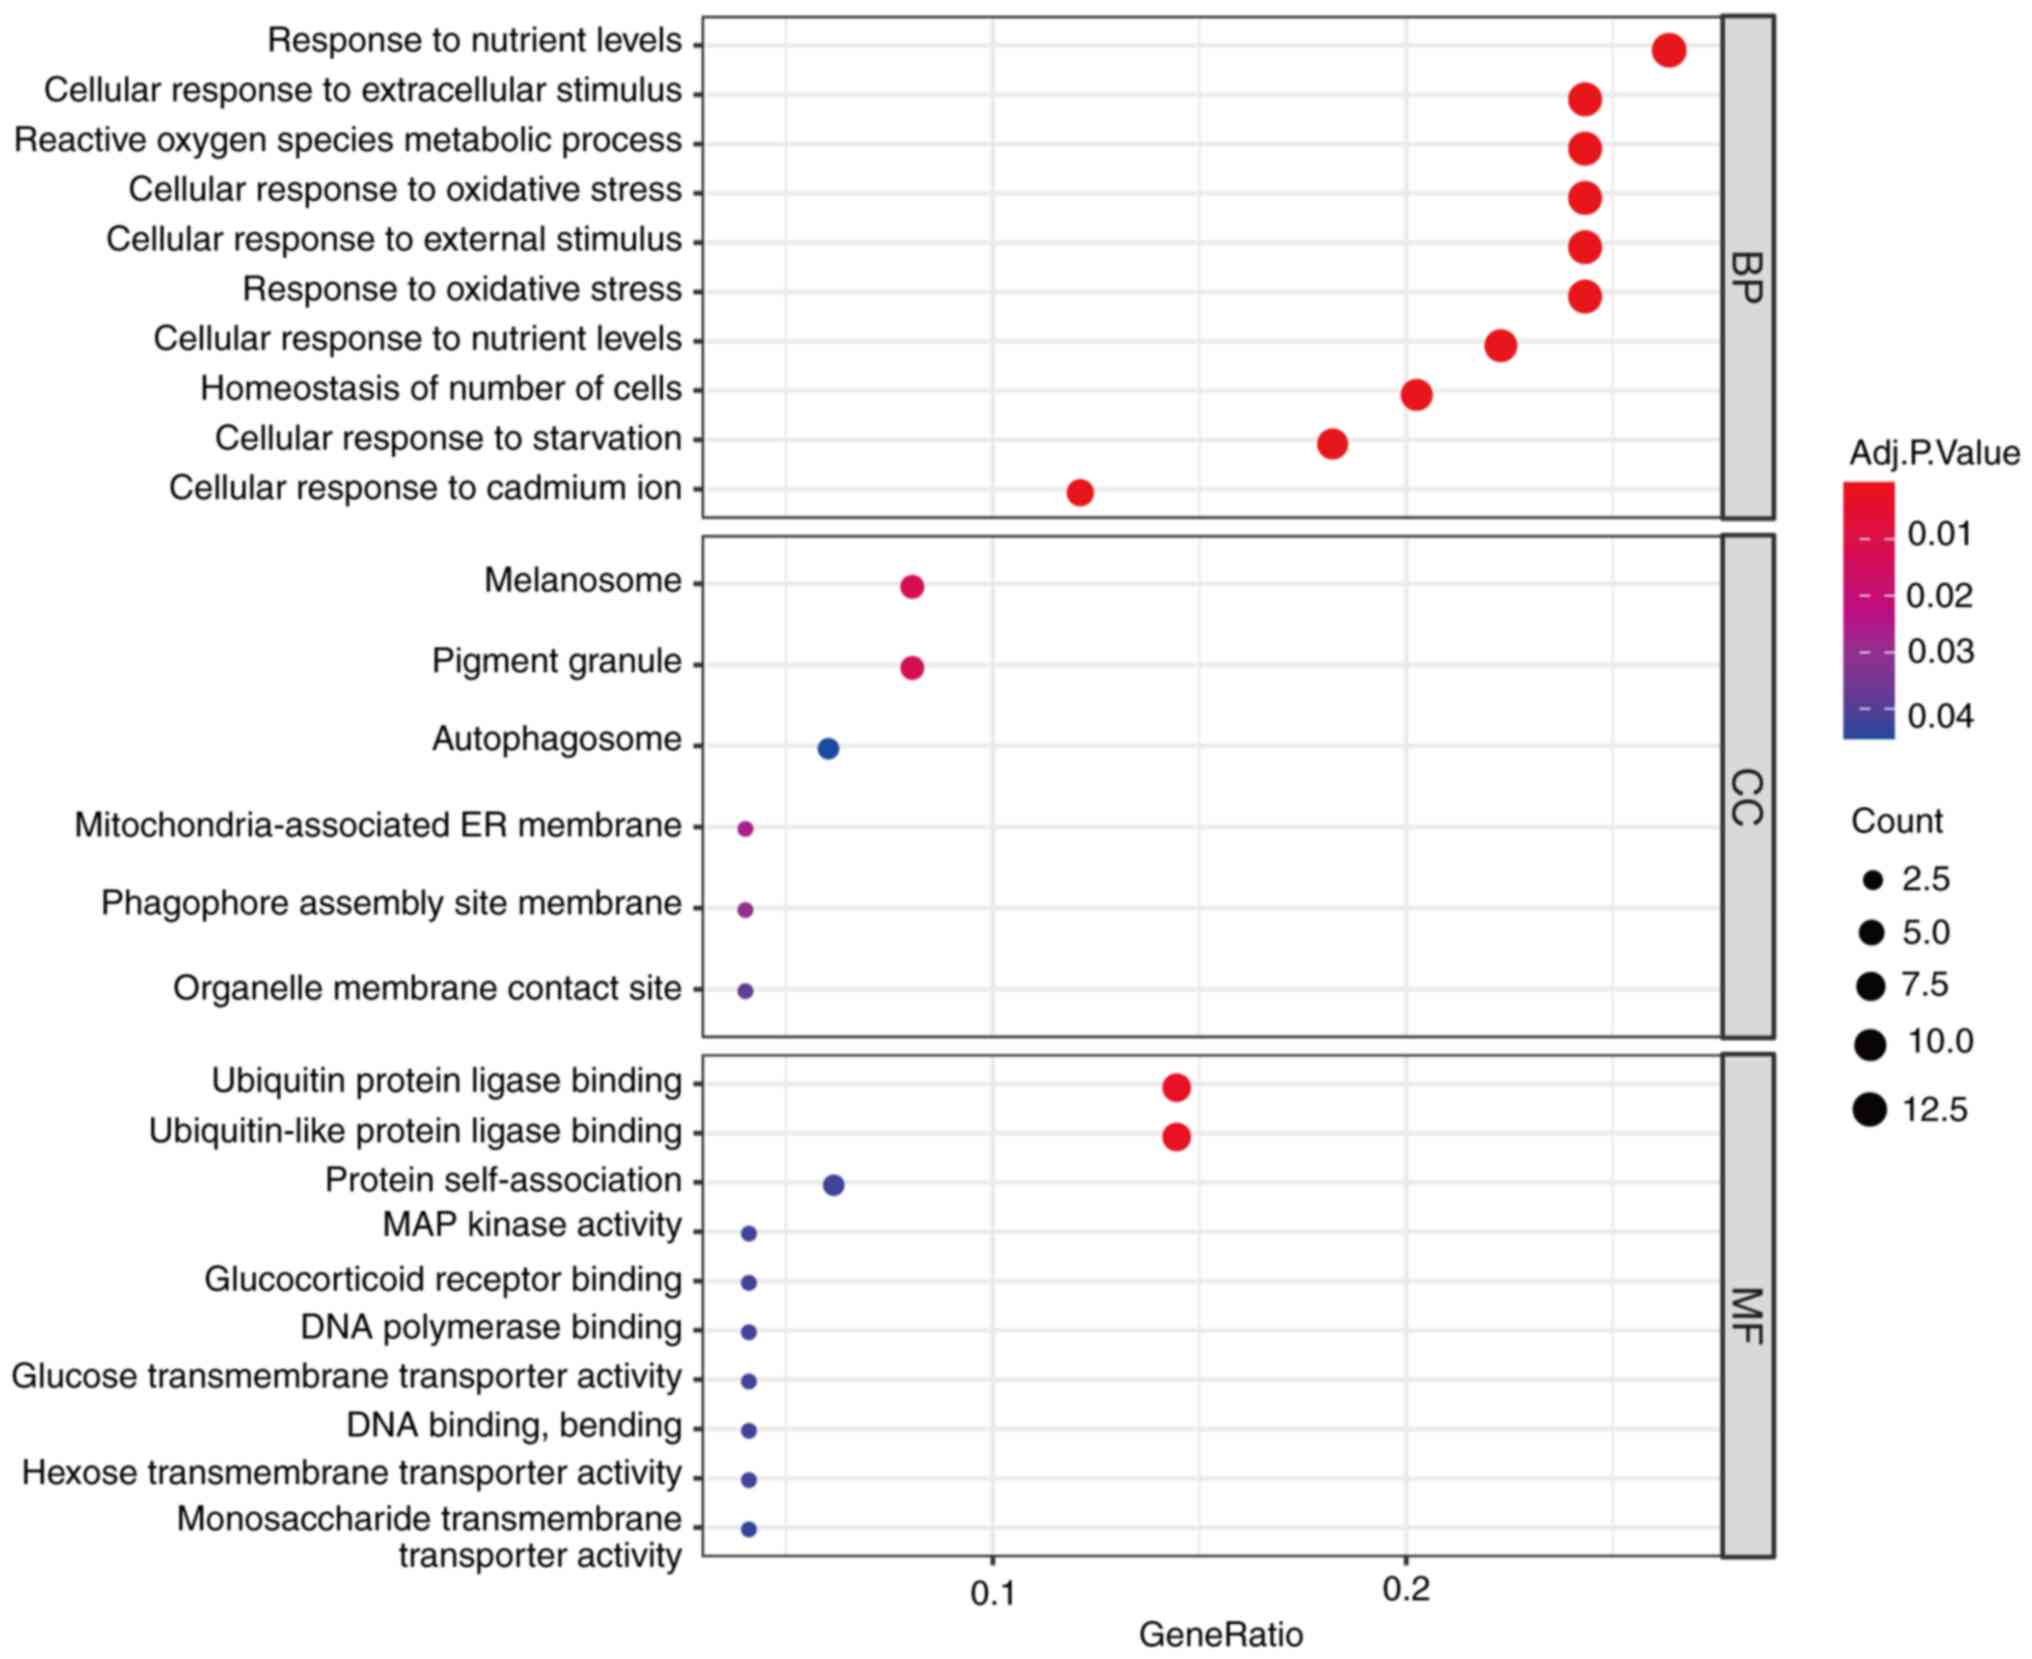
To explore the biological roles of these DFGs, GO
and KEGG enrichment analysis was conducted using R software. This
approach demonstrated that the most significantly enriched GO terms
were involved in ‘response to nutrient levels’, ‘cellular response
to extracellular stimulus’ and ‘ROS metabolic process’ (BP),
‘melanosome’, ‘pigment granule’ and ‘autophagosome’ (CC) and
‘ubiquitin protein ligase binding’, ‘ubiquitin-like protein ligase
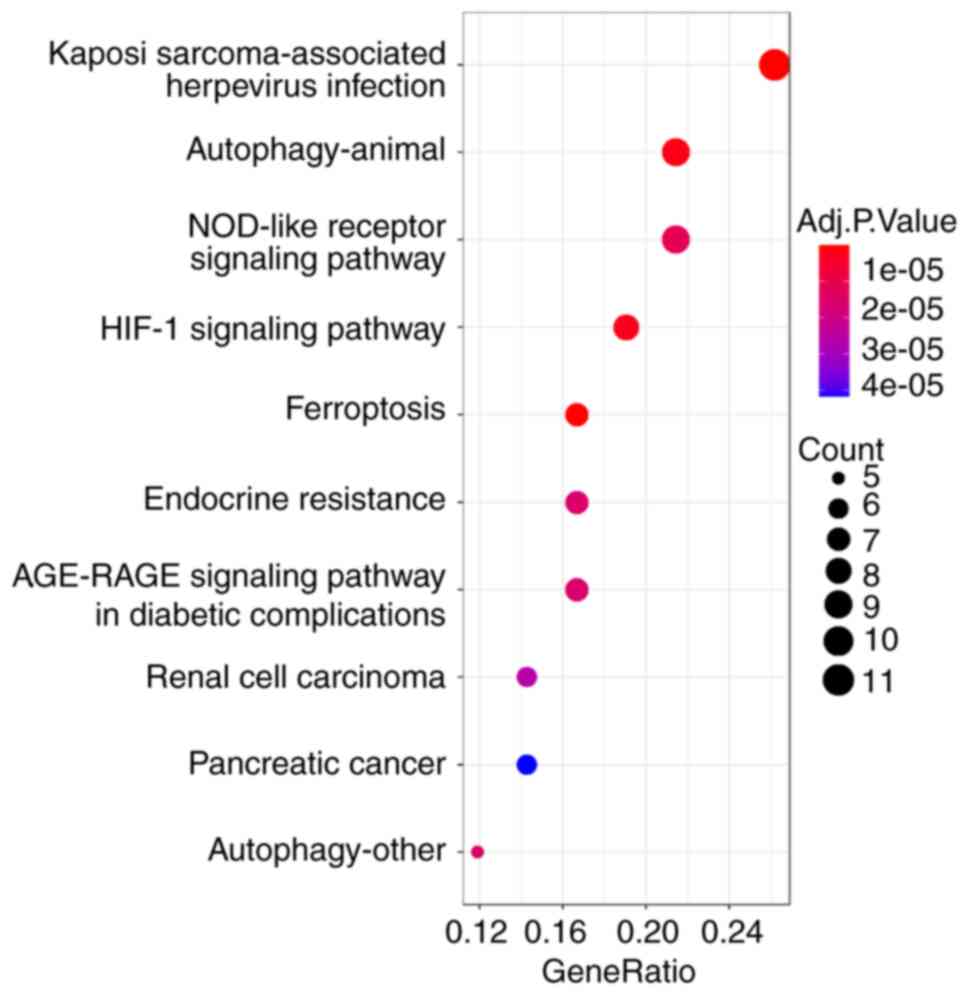
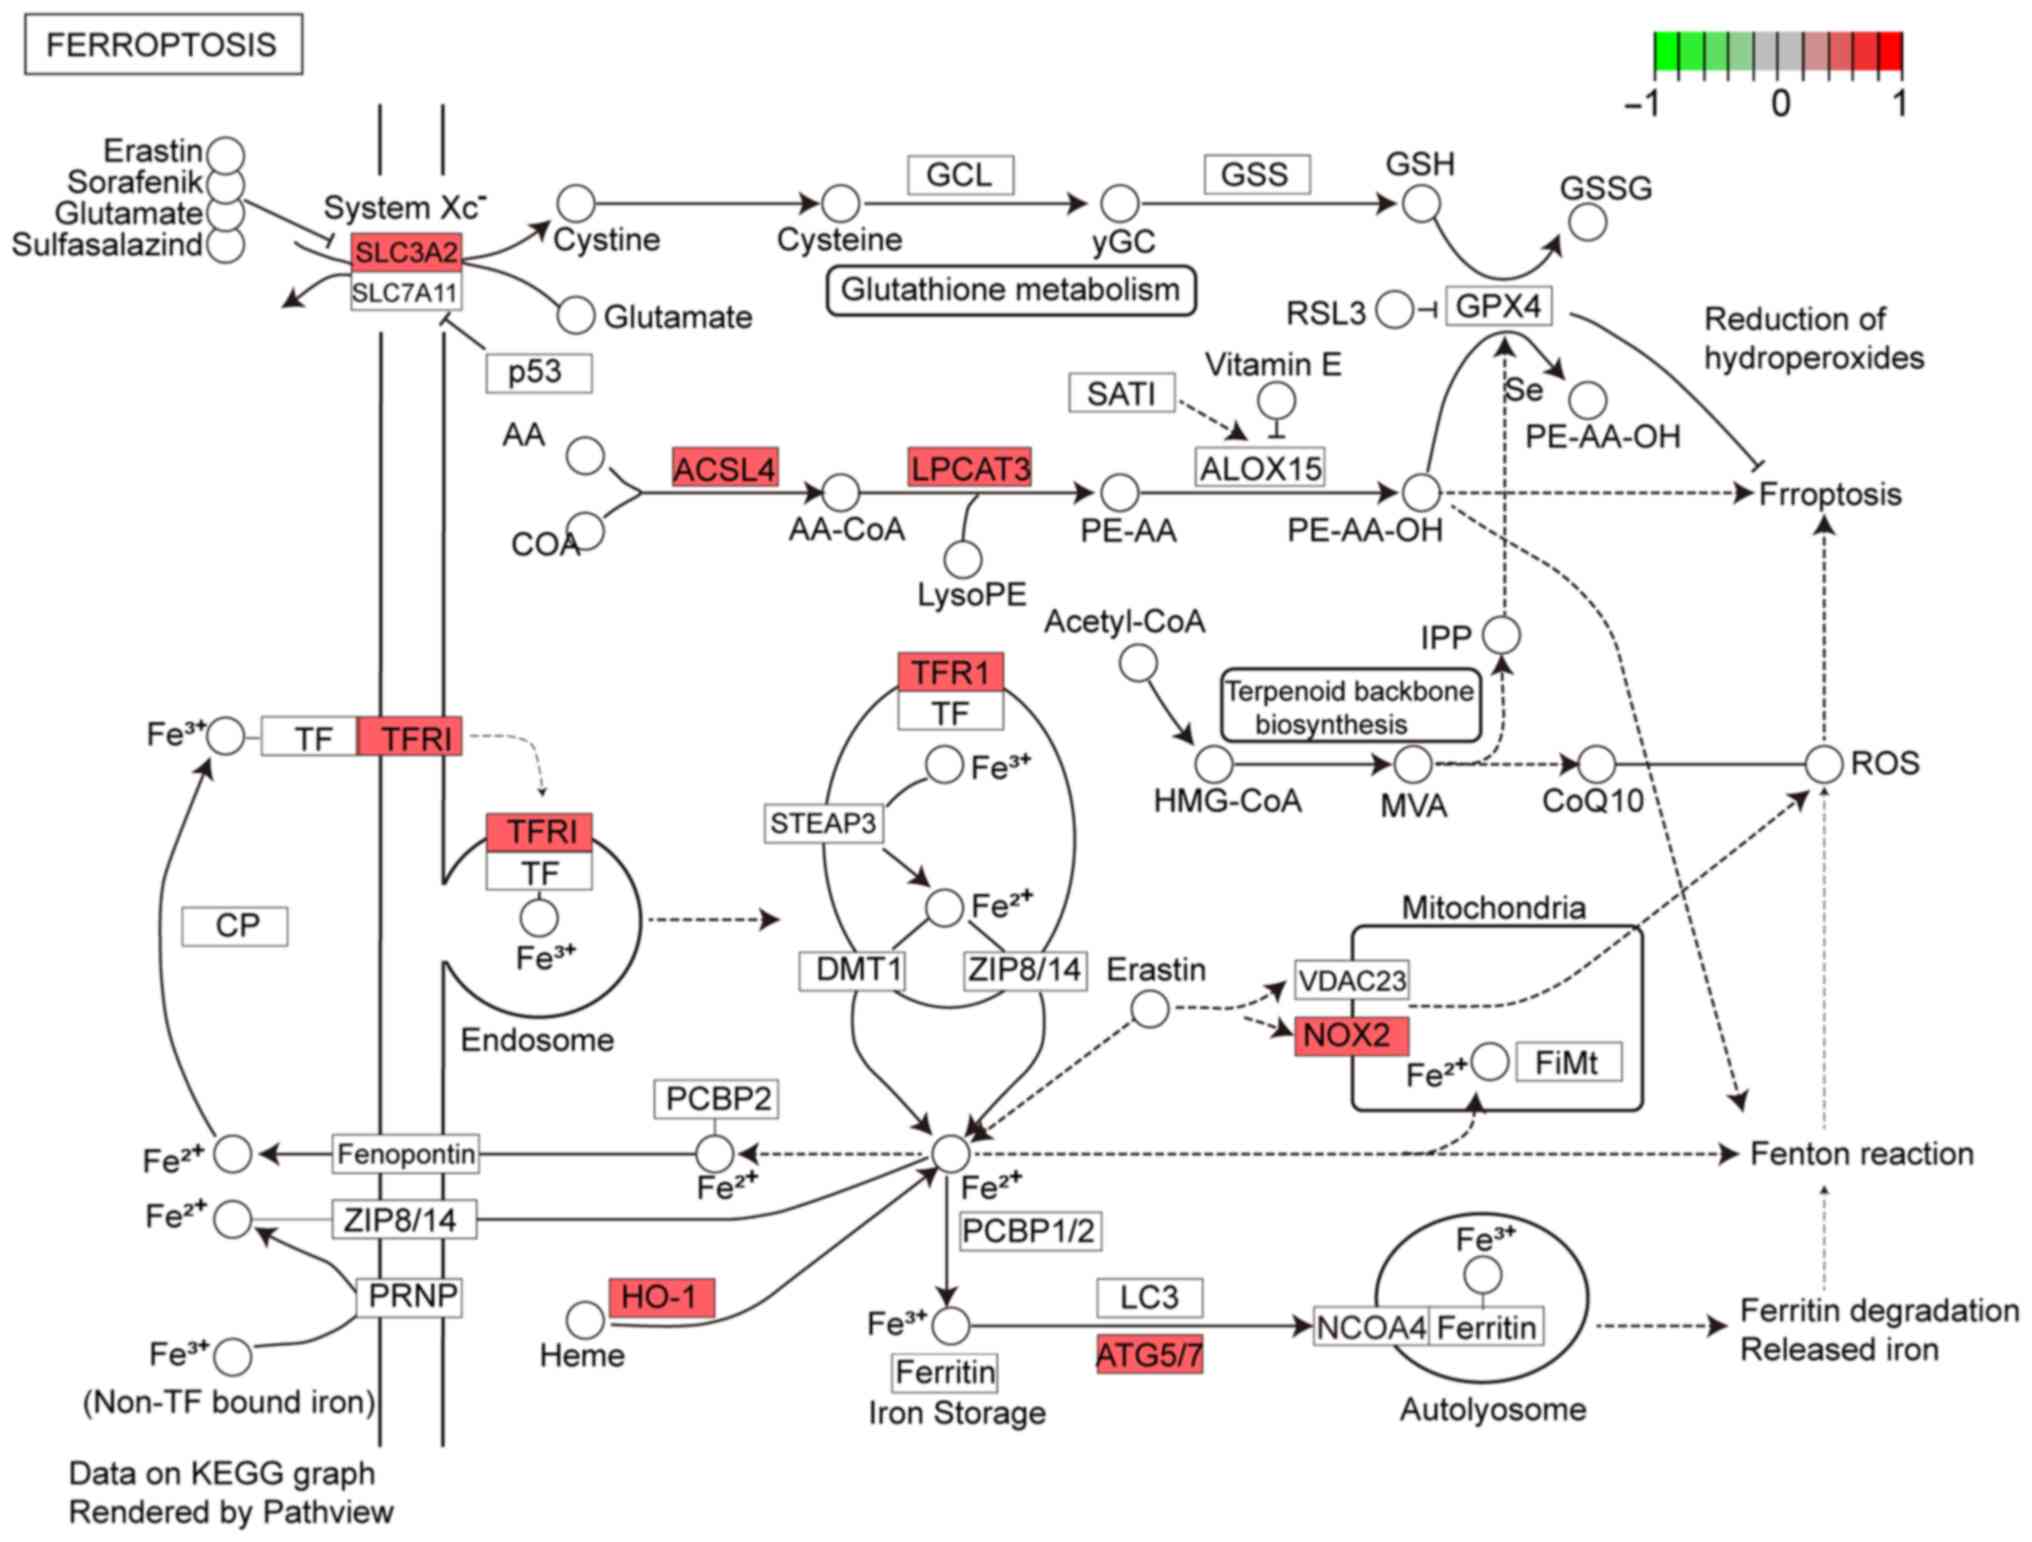
binding’ and ‘protein self-association’ (MF; Fig. 3). In KEGG enrichment analysis, DFGs
were primarily involved in ‘ferroptosis’ and ‘Kaposi
sarcoma-associated herpesvirus infection’ (Fig. 4). The KEGG pathway annotation of
‘ferroptosis’ is presented in Fig.
5.
PPI and correlation analysis of
DFGs
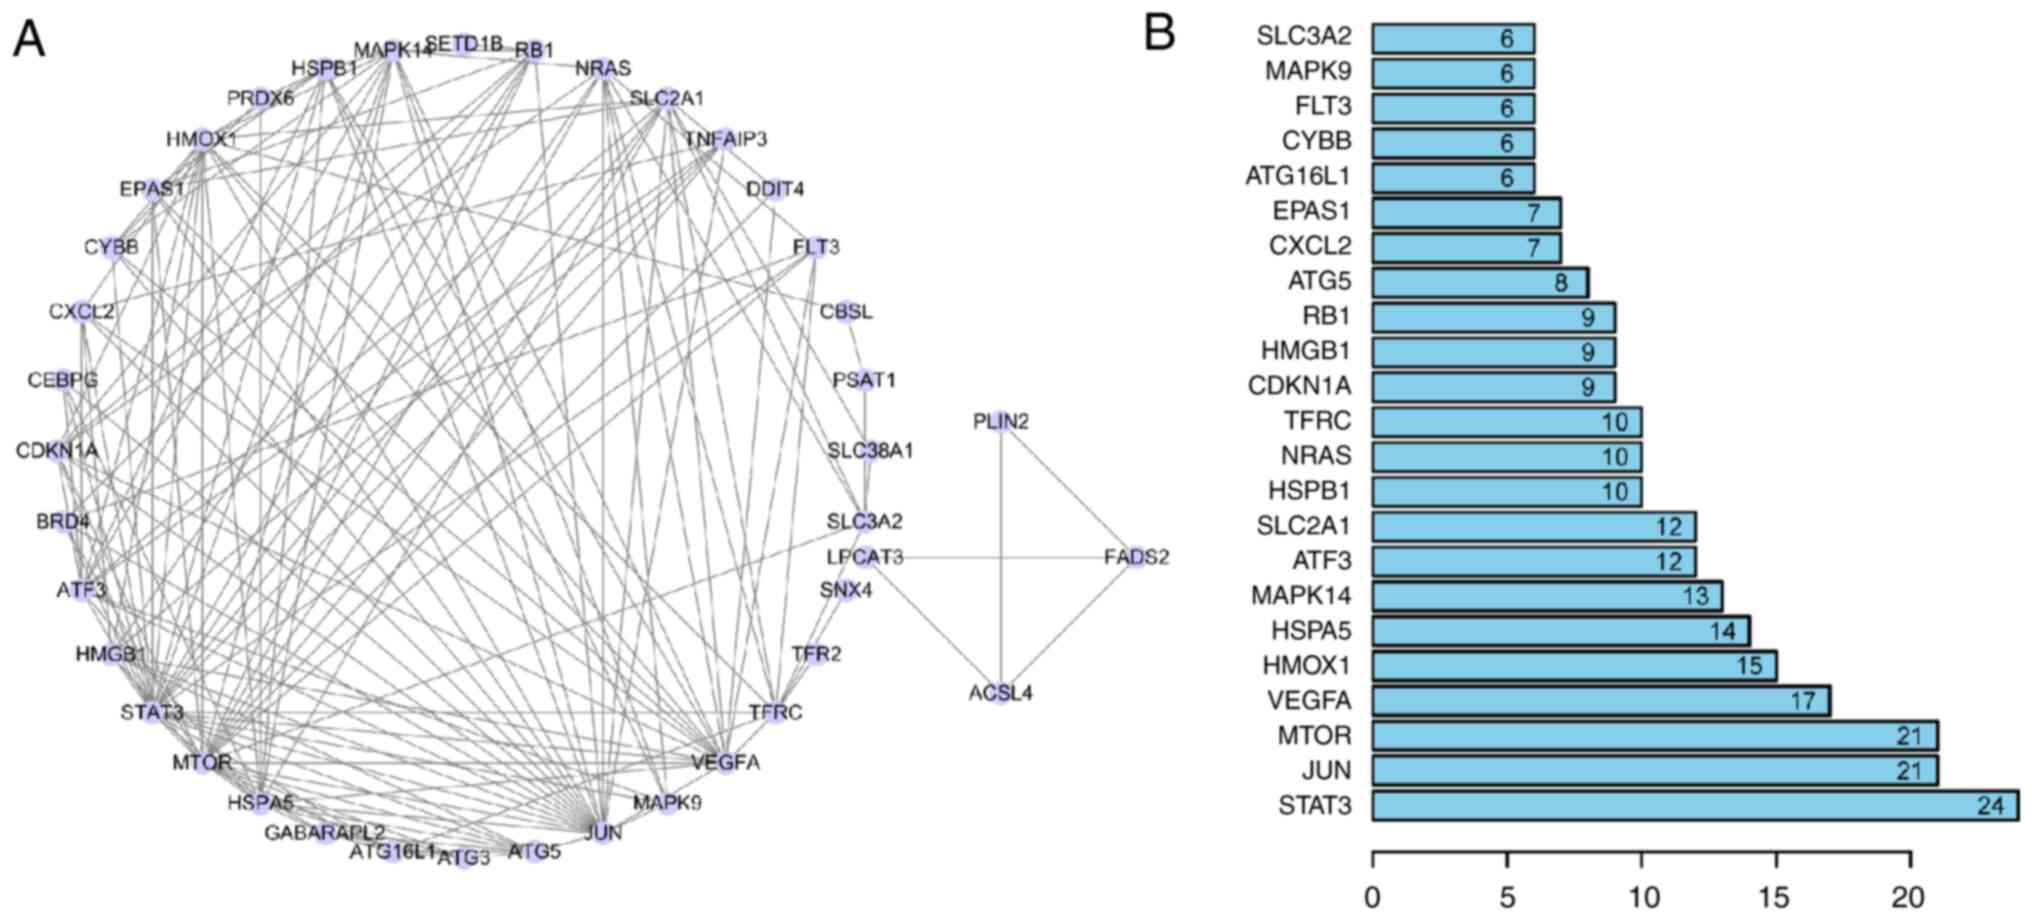
To determine the interactions between DFGs, a
PPI network was constructed. These findings showed that the
ferroptosis-associated genes interacted with one another (Fig. 6A) and revealed interaction numbers
for individual genes (Fig. 6B). As
STRING database does not completely cover all genes, only 40 DFGs
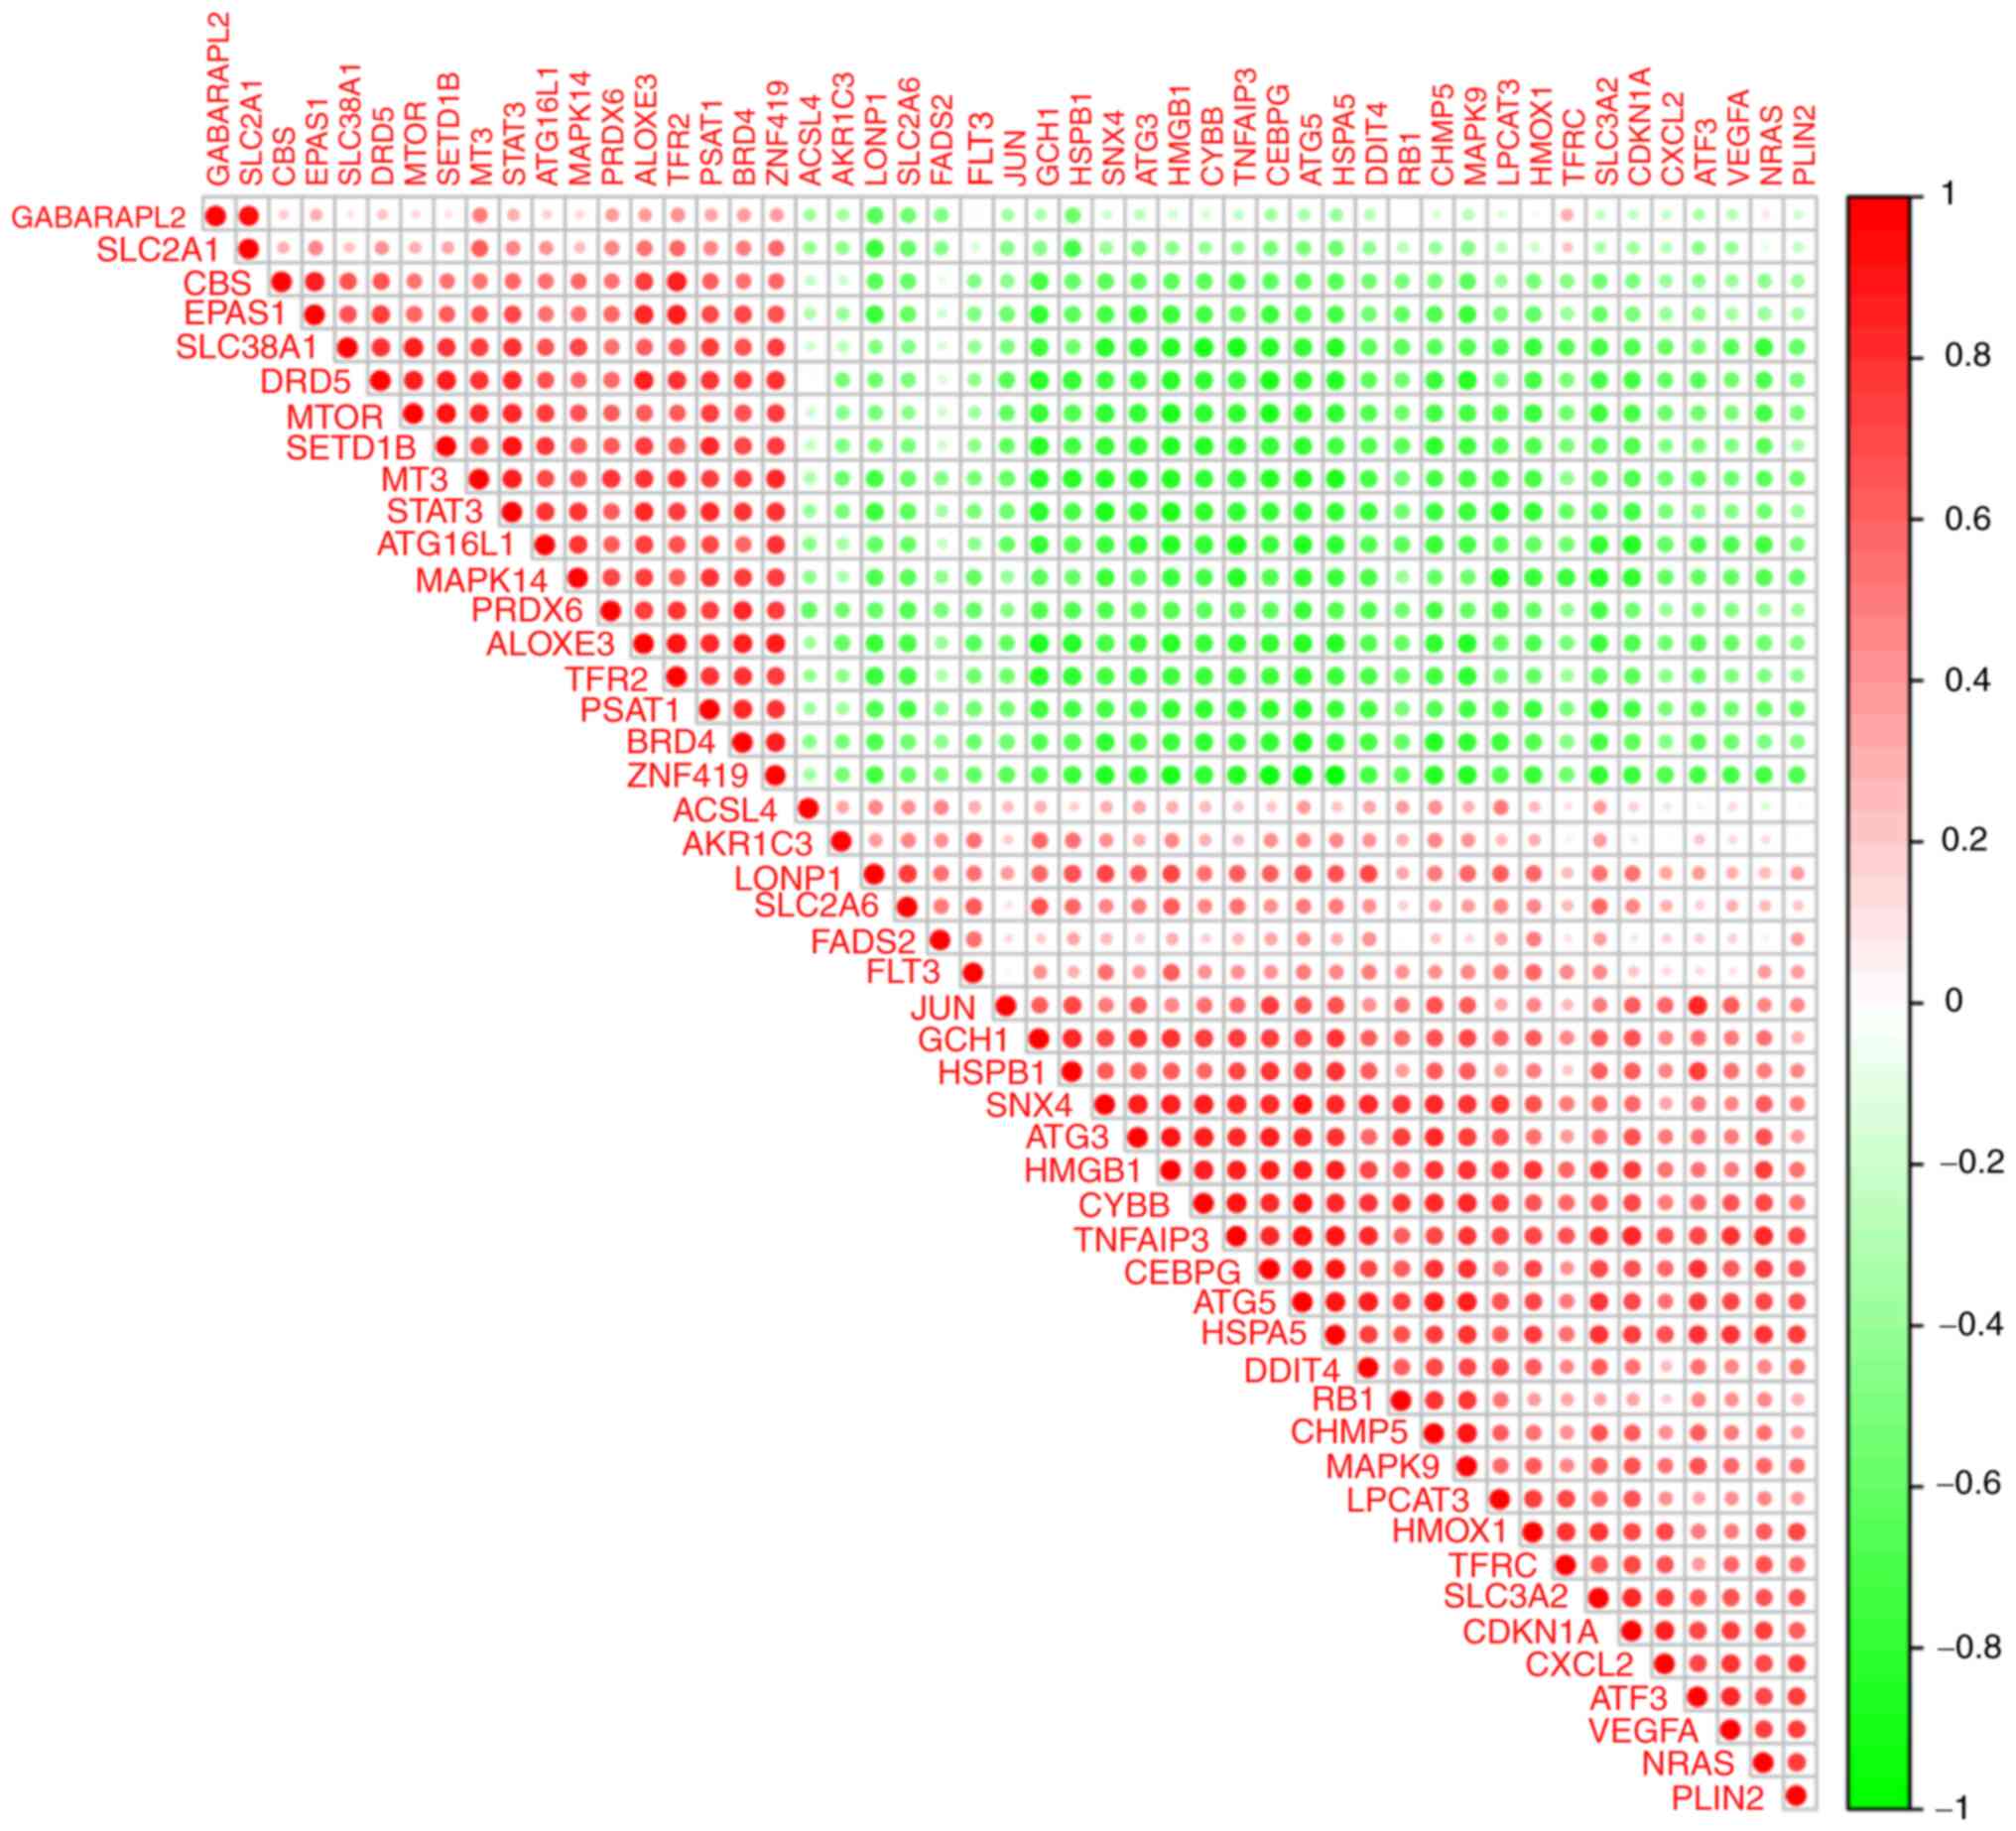
could be analysed. To examine expression correlation between these
DFGs, correlation analysis was performed. Fig. 7 shows the association between 49
DFGs in the GSE15072 dataset.
Immune infiltration assessment
To the best of our knowledge, due to technical
limitations, such as integration and search of genomic information
(29), the immune landscape in CKD
remains to be fully elaborated, particularly in a low abundance of
cell subpopulations. Using immune score P<0.05, 20 samples were
screened for immune analysis. To study differences in immune
infiltration between patients with CKD and healthy controls in 20
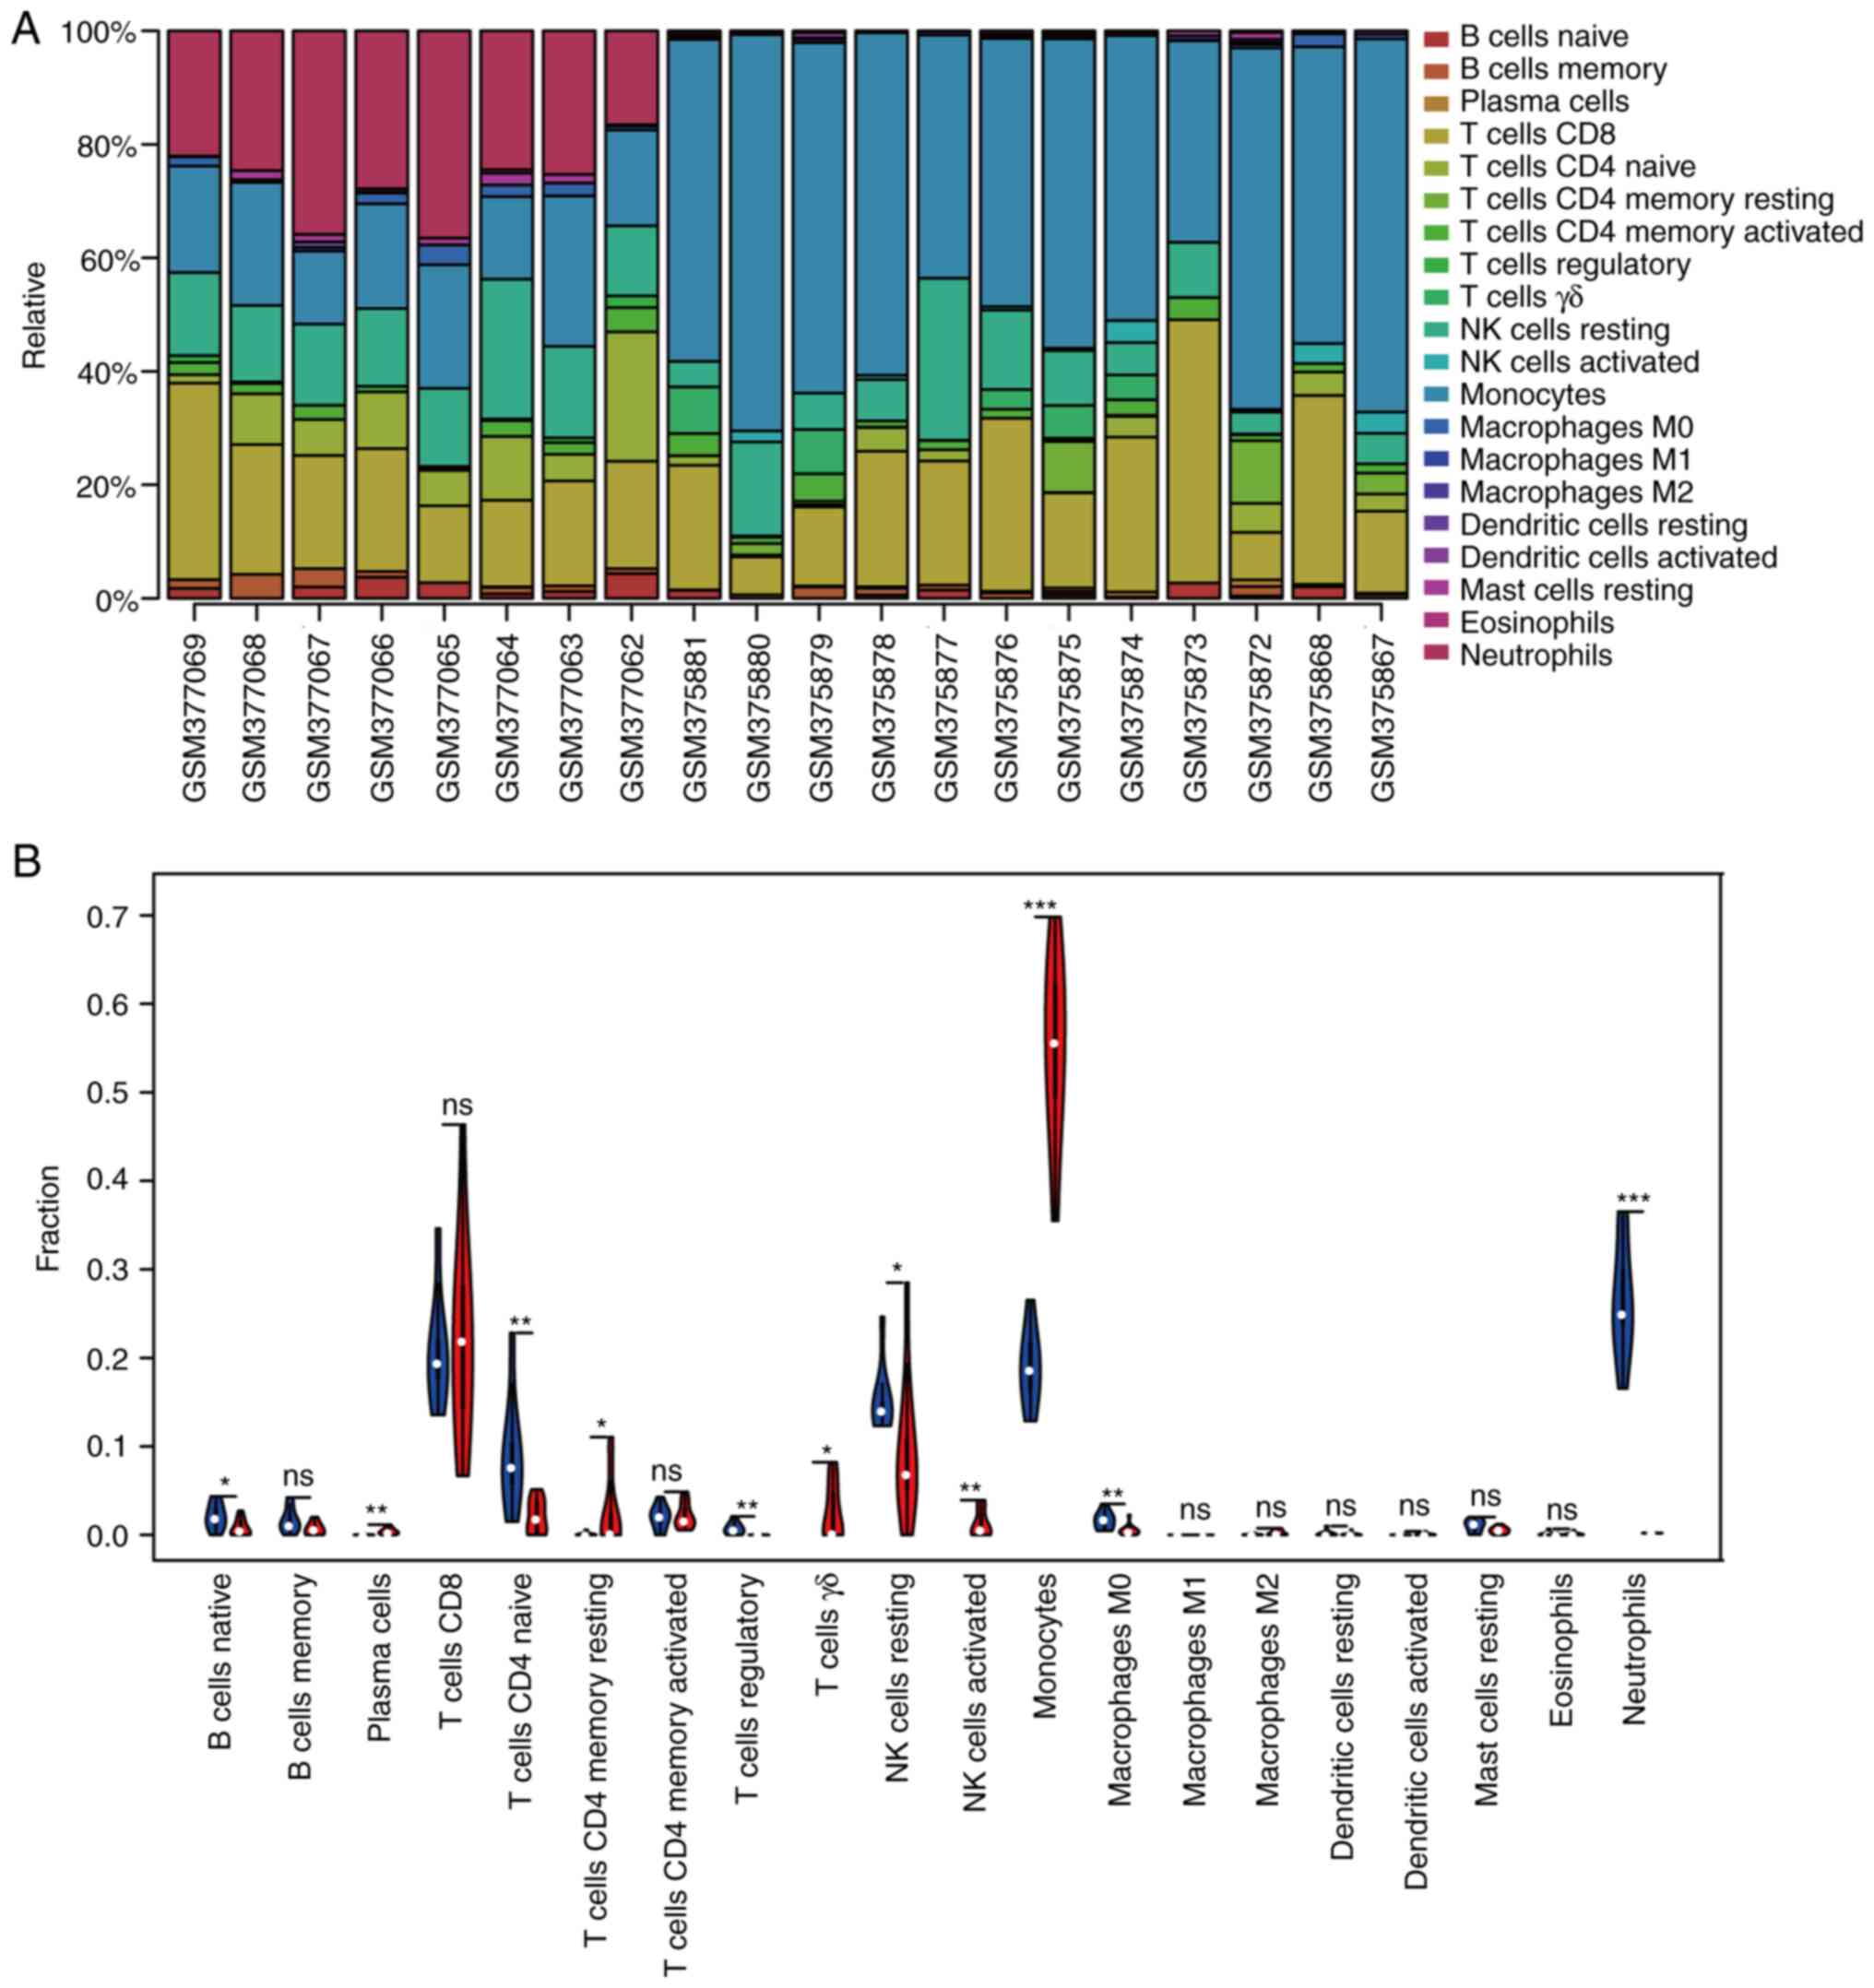
immune cell types, the CIBERSORT algorithm was used. Fig. 8A displays the results obtained from
eight healthy controls and 21 patients with CKD. Compared with
normal tissue, CKD tissue generally exhibited more plasma cells,
resting memory CD4+ T, γδT, resting and activated NK
cells as well as monocytes. By contrast, the proportions of naive B
and CD4+ T and Tregs, as well as M0 macrophages and
neutrophils, were lower (Fig.
8B).
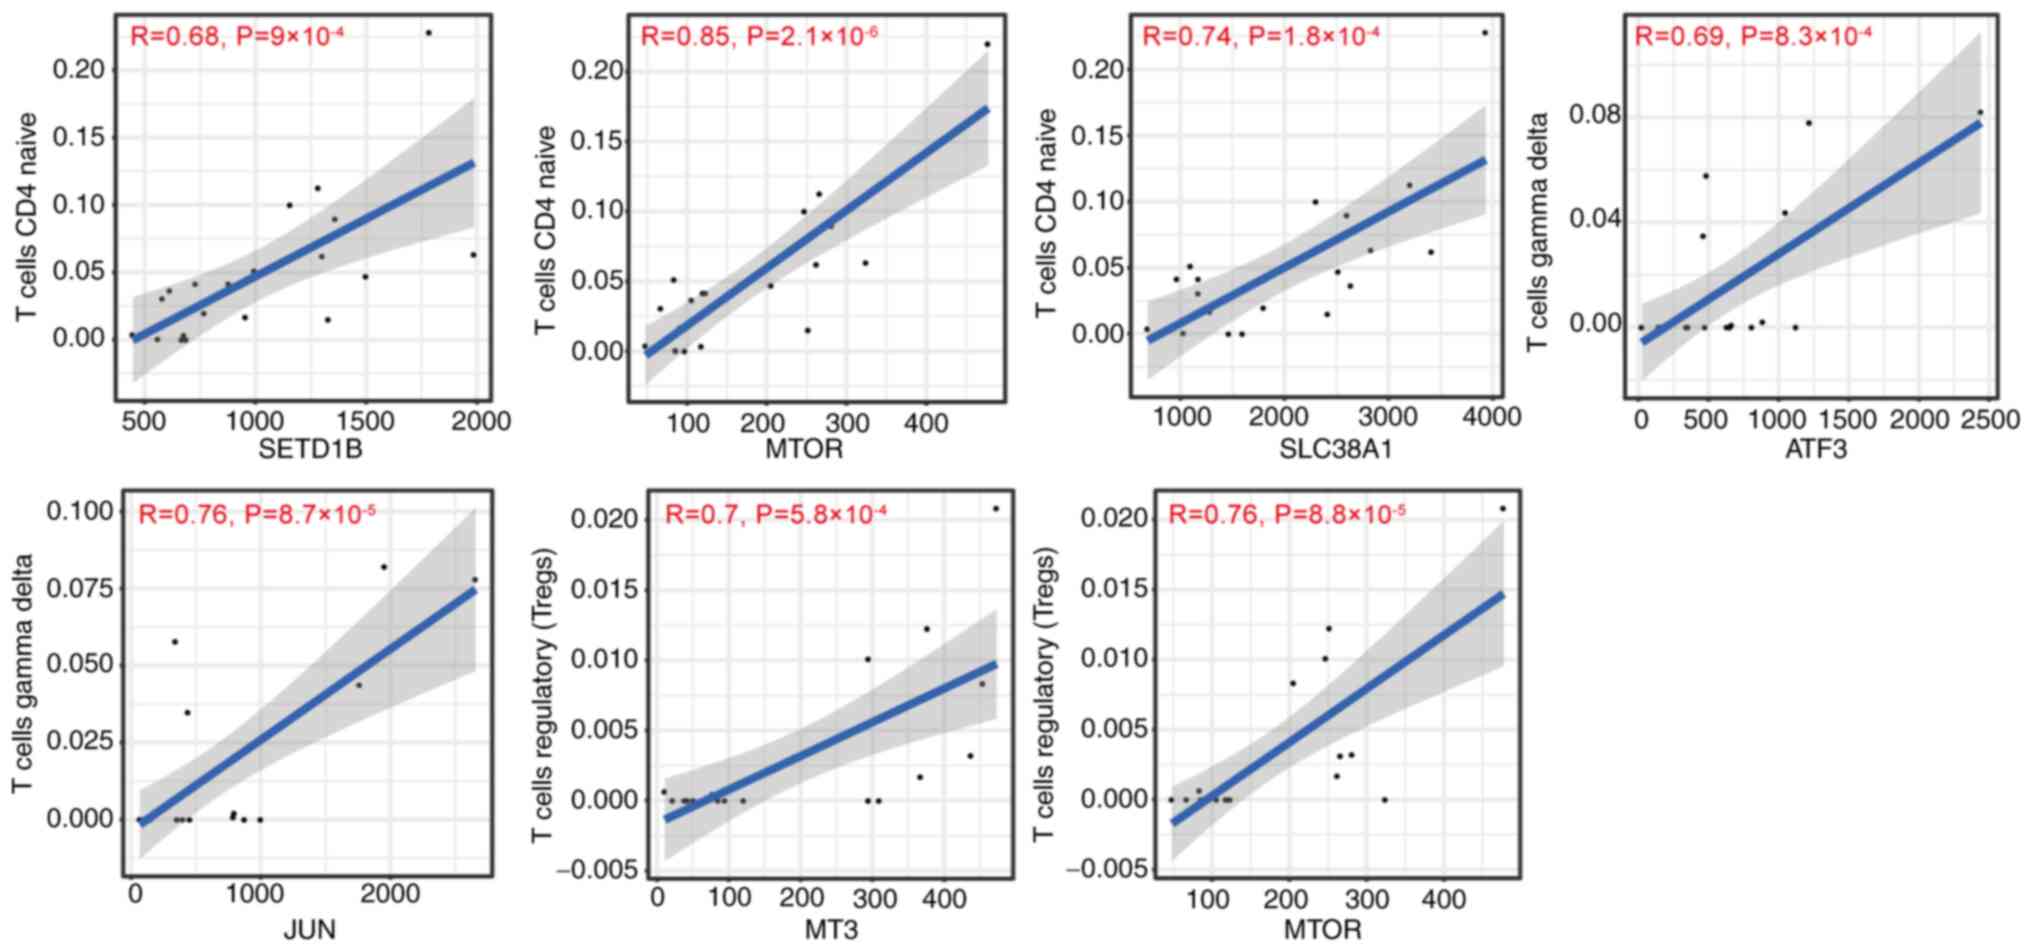
Correlation between DFG expression and
immune infiltration in CKD
It is unclear if DFGs influence immune cell
recruitment in the CKD microenvironment. Therefore, the present
study analysed the association between ferroptosis-related genes
and immune infiltration in CKD. The immune infiltration level of
naive CD4+ T cells was positively associated with
expression of SET domain-containing 1B (SETD1B), MTOR and SLC38A1
(Fig. 9). The immune infiltration
of γδT cells was positively associated with ATF3 and JUN expression
levels (Fig. 9). Immune
infiltration of Tregs was positively correlated with MT3 and MTOR
levels (Fig. 9). The immune
infiltration of monocytes was positively correlated with
antithymocyte globulin 3 (ATG3), ATG5, CDKN1A, CCAAT enhancer
binding protein (CEBPG), charged multivesicular body protein 5
(CHMP5), Cytochrome b-245 beta chain (CYBB), DDIT4 (DNA damage
inducible transcript 4), GCH1 (GTP cyclohydrolase 1), high mobility
group box 1 (HMGB1), HMOX1, HSPA5), MAPK9, neuroblastoma RAS viral
oncogene homolog (NRAS), retinoblastoma susceptibility gene (RB1),
SLC3A2), sorting nexin-4 (SNX4), TNF-alpha-induced protein 3
(TNFAIP3) and VEGFA) expression, but negatively correlated with
arachidonate lipoxygenase 3 (ALOXE3), autophagy related 16 like 1
(ATG16L1), BRD4), DRD5), endothelial PAS Domain Protein 1 (EPAS1),
MAPK14, metallothionein-3 (MT3), MTOR), phosphoserine
aminotransferase 1 (PSAT1), SETD1B), SLC38A1), STAT3, transferrin
receptor 2 (TFR2) and zinc Finger Protein 419 (ZNF419) (Fig. 10). The immune infiltration of
neutrophils was positively associated with expression of ALOXE3,
ATG16L1, BRD4, CBS, DRD5, EPAS1, MAPK14, MT3, MTOR, peroxiredoxin 6
(PRDX6), PSAT1, SETD1B, SLC38A1, STAT3, TFR2 and ZNF419, whereas it
was negatively correlated with antithymocyte globulin 3 (ATG3),
ATG5, CDKN1A, CCAAT enhancer binding protein (CEBPG), charged
multivesicular body protein 5 (CHMP5), CYBB, DNA damage inducible
transcript 4 (DDIT4), GTP cyclohydrolase 1 (GCH1), high mobility
group box 1 (HMGB1), HMOX1, HSPA5, HSPB1, Lon protease 1 (LONP1),
lysophosphatidylcholine acyltransferase 3 (LPCAT3), MAPK9, SLC3A2,
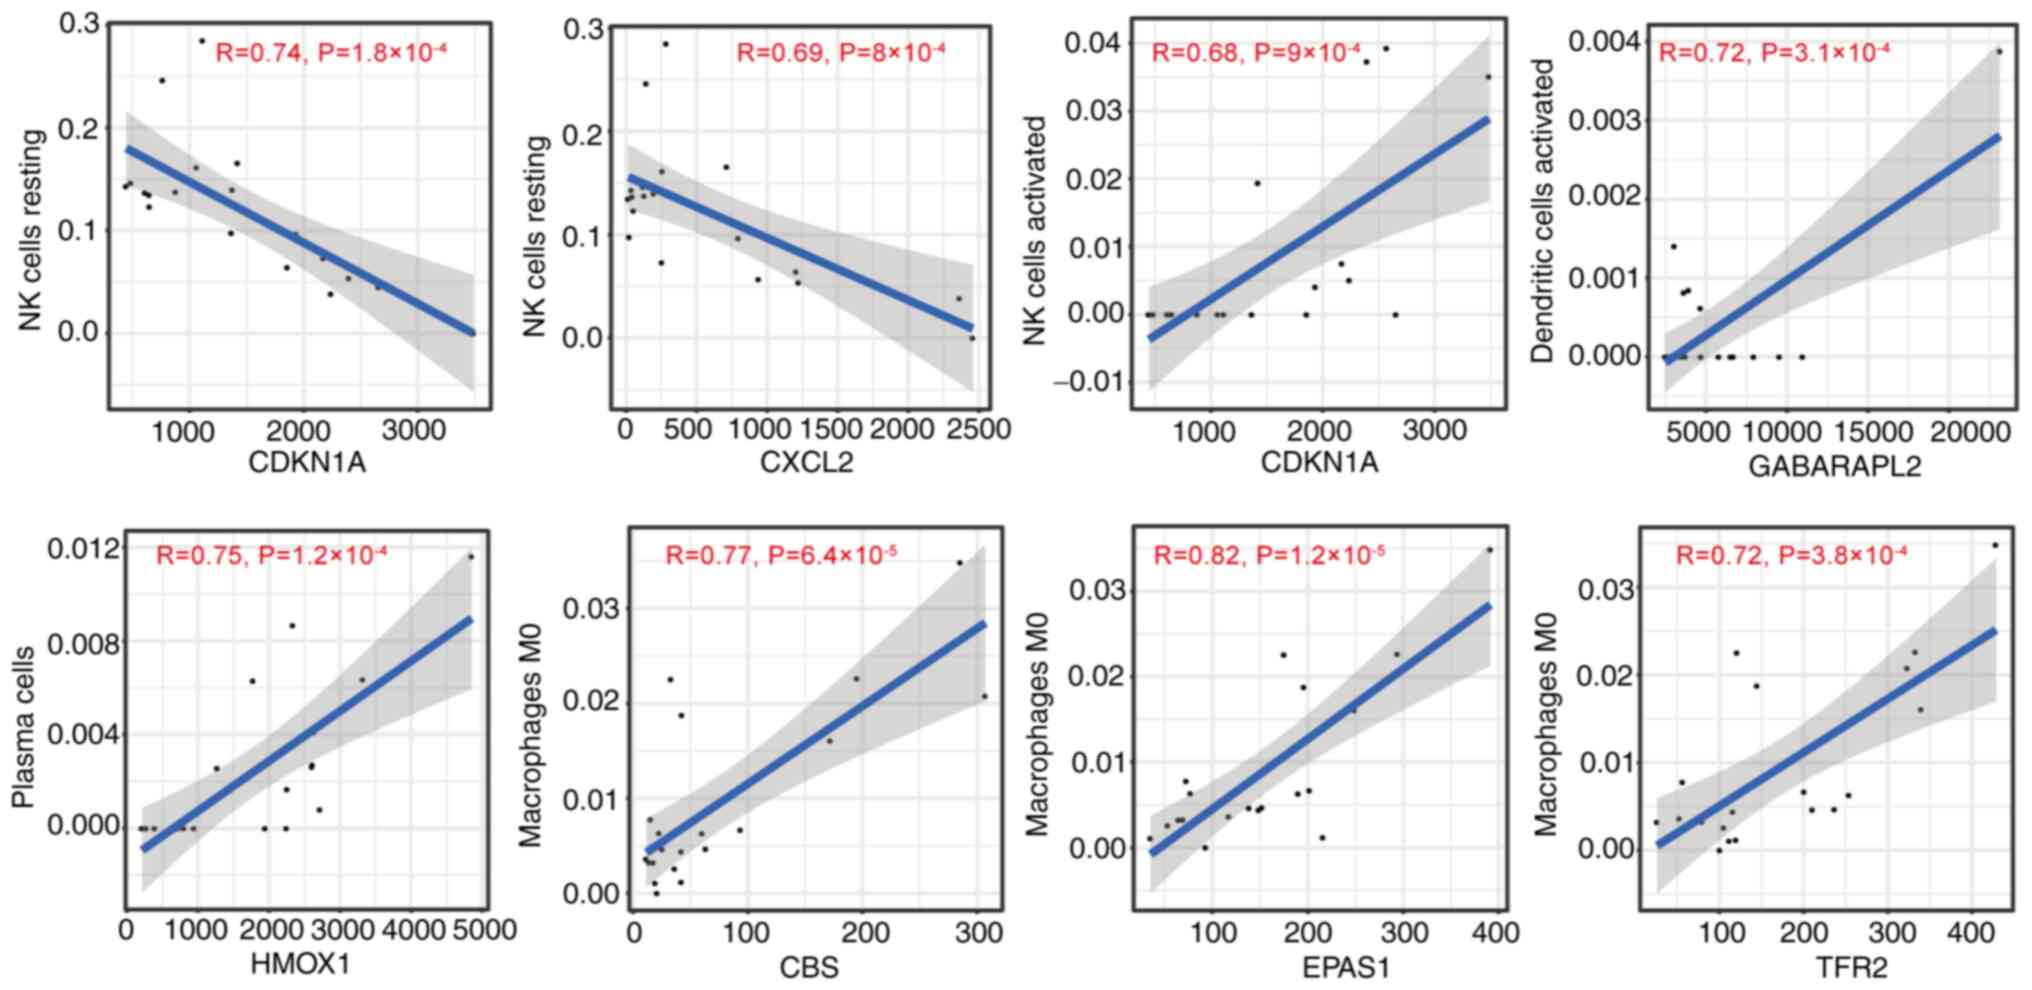
SNX4 and TNFAIP3 (Fig. 11).
CDKN1A and CXC motif chemokine ligand 2 (CXCL2) levels were
negatively associated with levels of resting NK cells (Fig. 12). A positive association between
activated NK cells and CDKN1A, activated dendritic cells and GABA
type A receptor-associated protein 2 and plasma cells and HMOX1
expression was found in this analysis (Fig. 12). Moreover, M0 macrophages were
positively associated with expression of CBS, EPAS1 and TFR2
(Fig. 12). The present results
suggested that DFGs were associated with immune infiltration in
CKD.
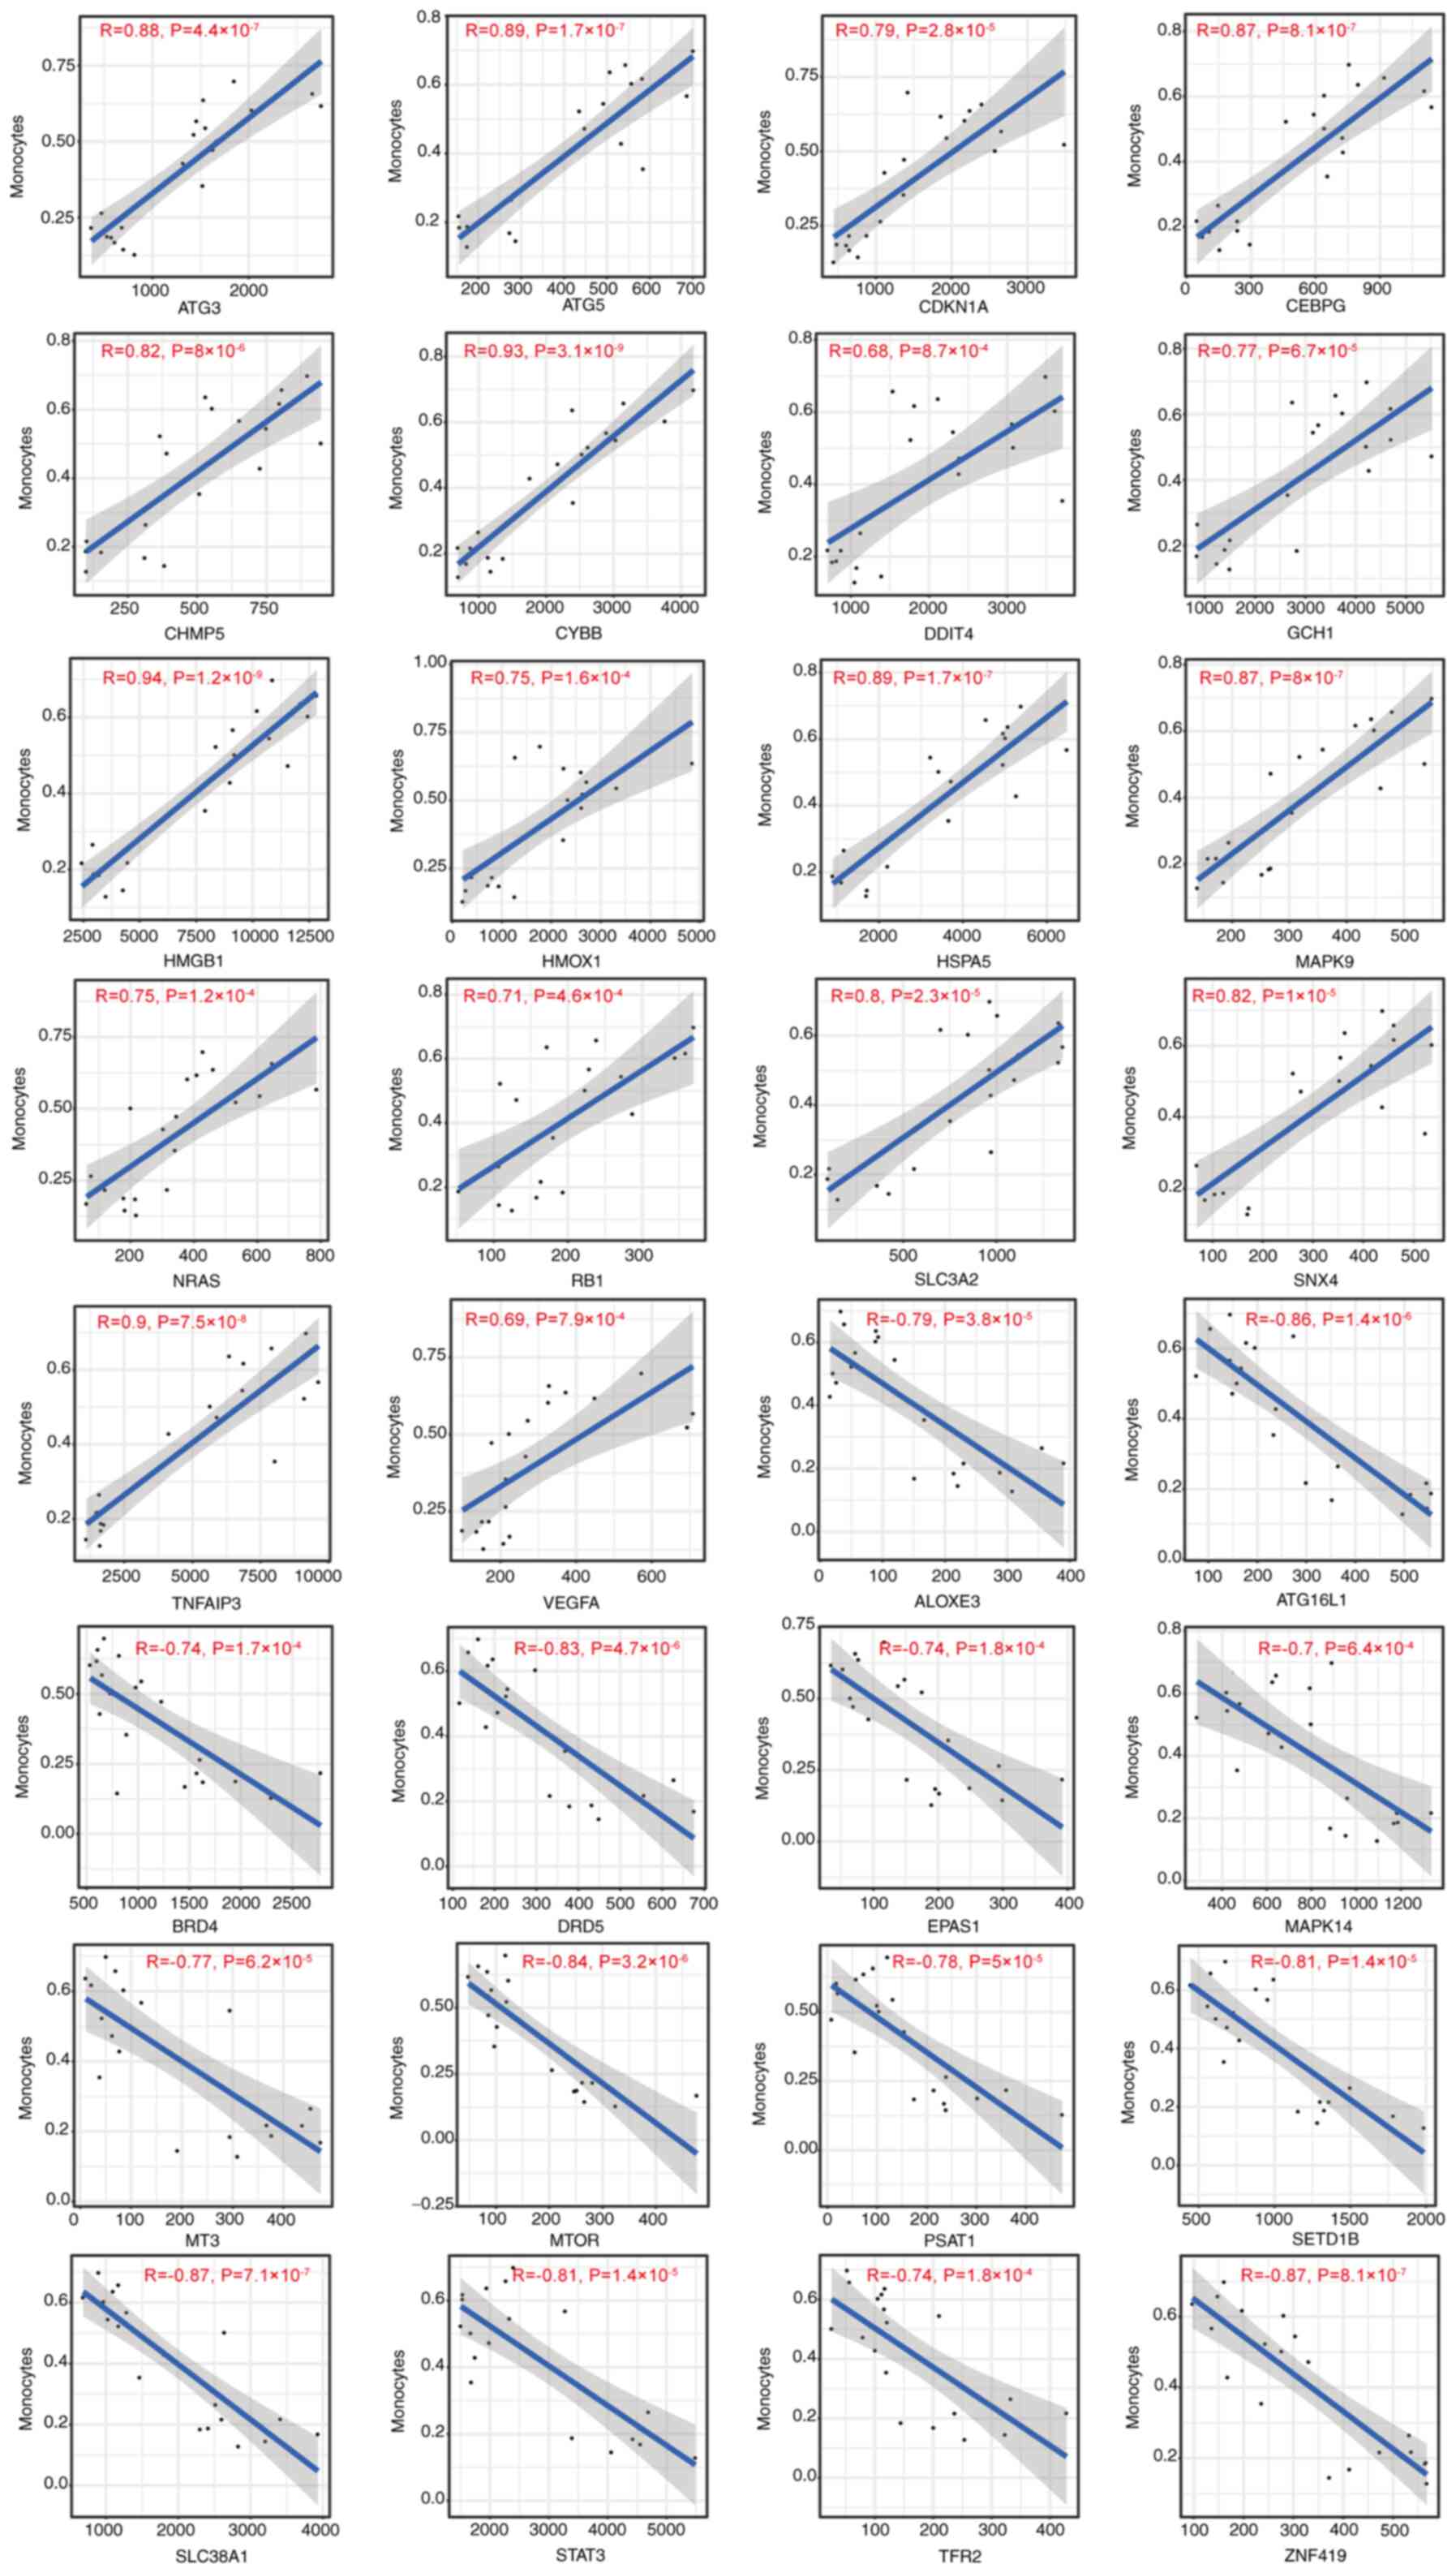 | Figure 10Correlation between
ferroptosis-associated gene expression and the immune infiltration
of monocytes in chronic kidney disease. ATG, antithymocyte
globulin; CDKN1A, cyclin-dependent kinase inhibitor 1; CEBPG, CCAAT
enhancer binding protein; CHMP5, charged multivesicular body
protein 5; CYBB, Cytochrome b-245 beta chain; DDIT4, DNA damage
inducible transcript 4; GCH1, GTP cyclohydrolase 1; HMGB1, high
mobility group box 1; HMOX1, heme oxygenase 1; HSPA5, heat shock
protein 5; NRAS, neuroblastoma RAS viral oncogene homolog; RB1,
retinoblastoma susceptibility gene; SLC3A2, solute carrier 3A2;
SNX4, sorting nexin-4; TNFAIP3, TNF-α-induced protein 3; VEGFA,
vascular endothelial-derived growth factor; ALOXE3, arachidonate
lipoxygenase 3; ATG16L1, autophagy related 16 like 1; BRD4,
bromodomain-containing protein 4; DRD5, dopamine receptor D5;
EPAS1, endothelial PAS Domain Protein 1; MT3, metallothionein-3;
PSAT1, phosphoserine aminotransferase 1; SETD1B, SET
domain-containing 1B; TFR2, Transferrin receptor 2; ZNF419, zinc
finger Protein 419. |
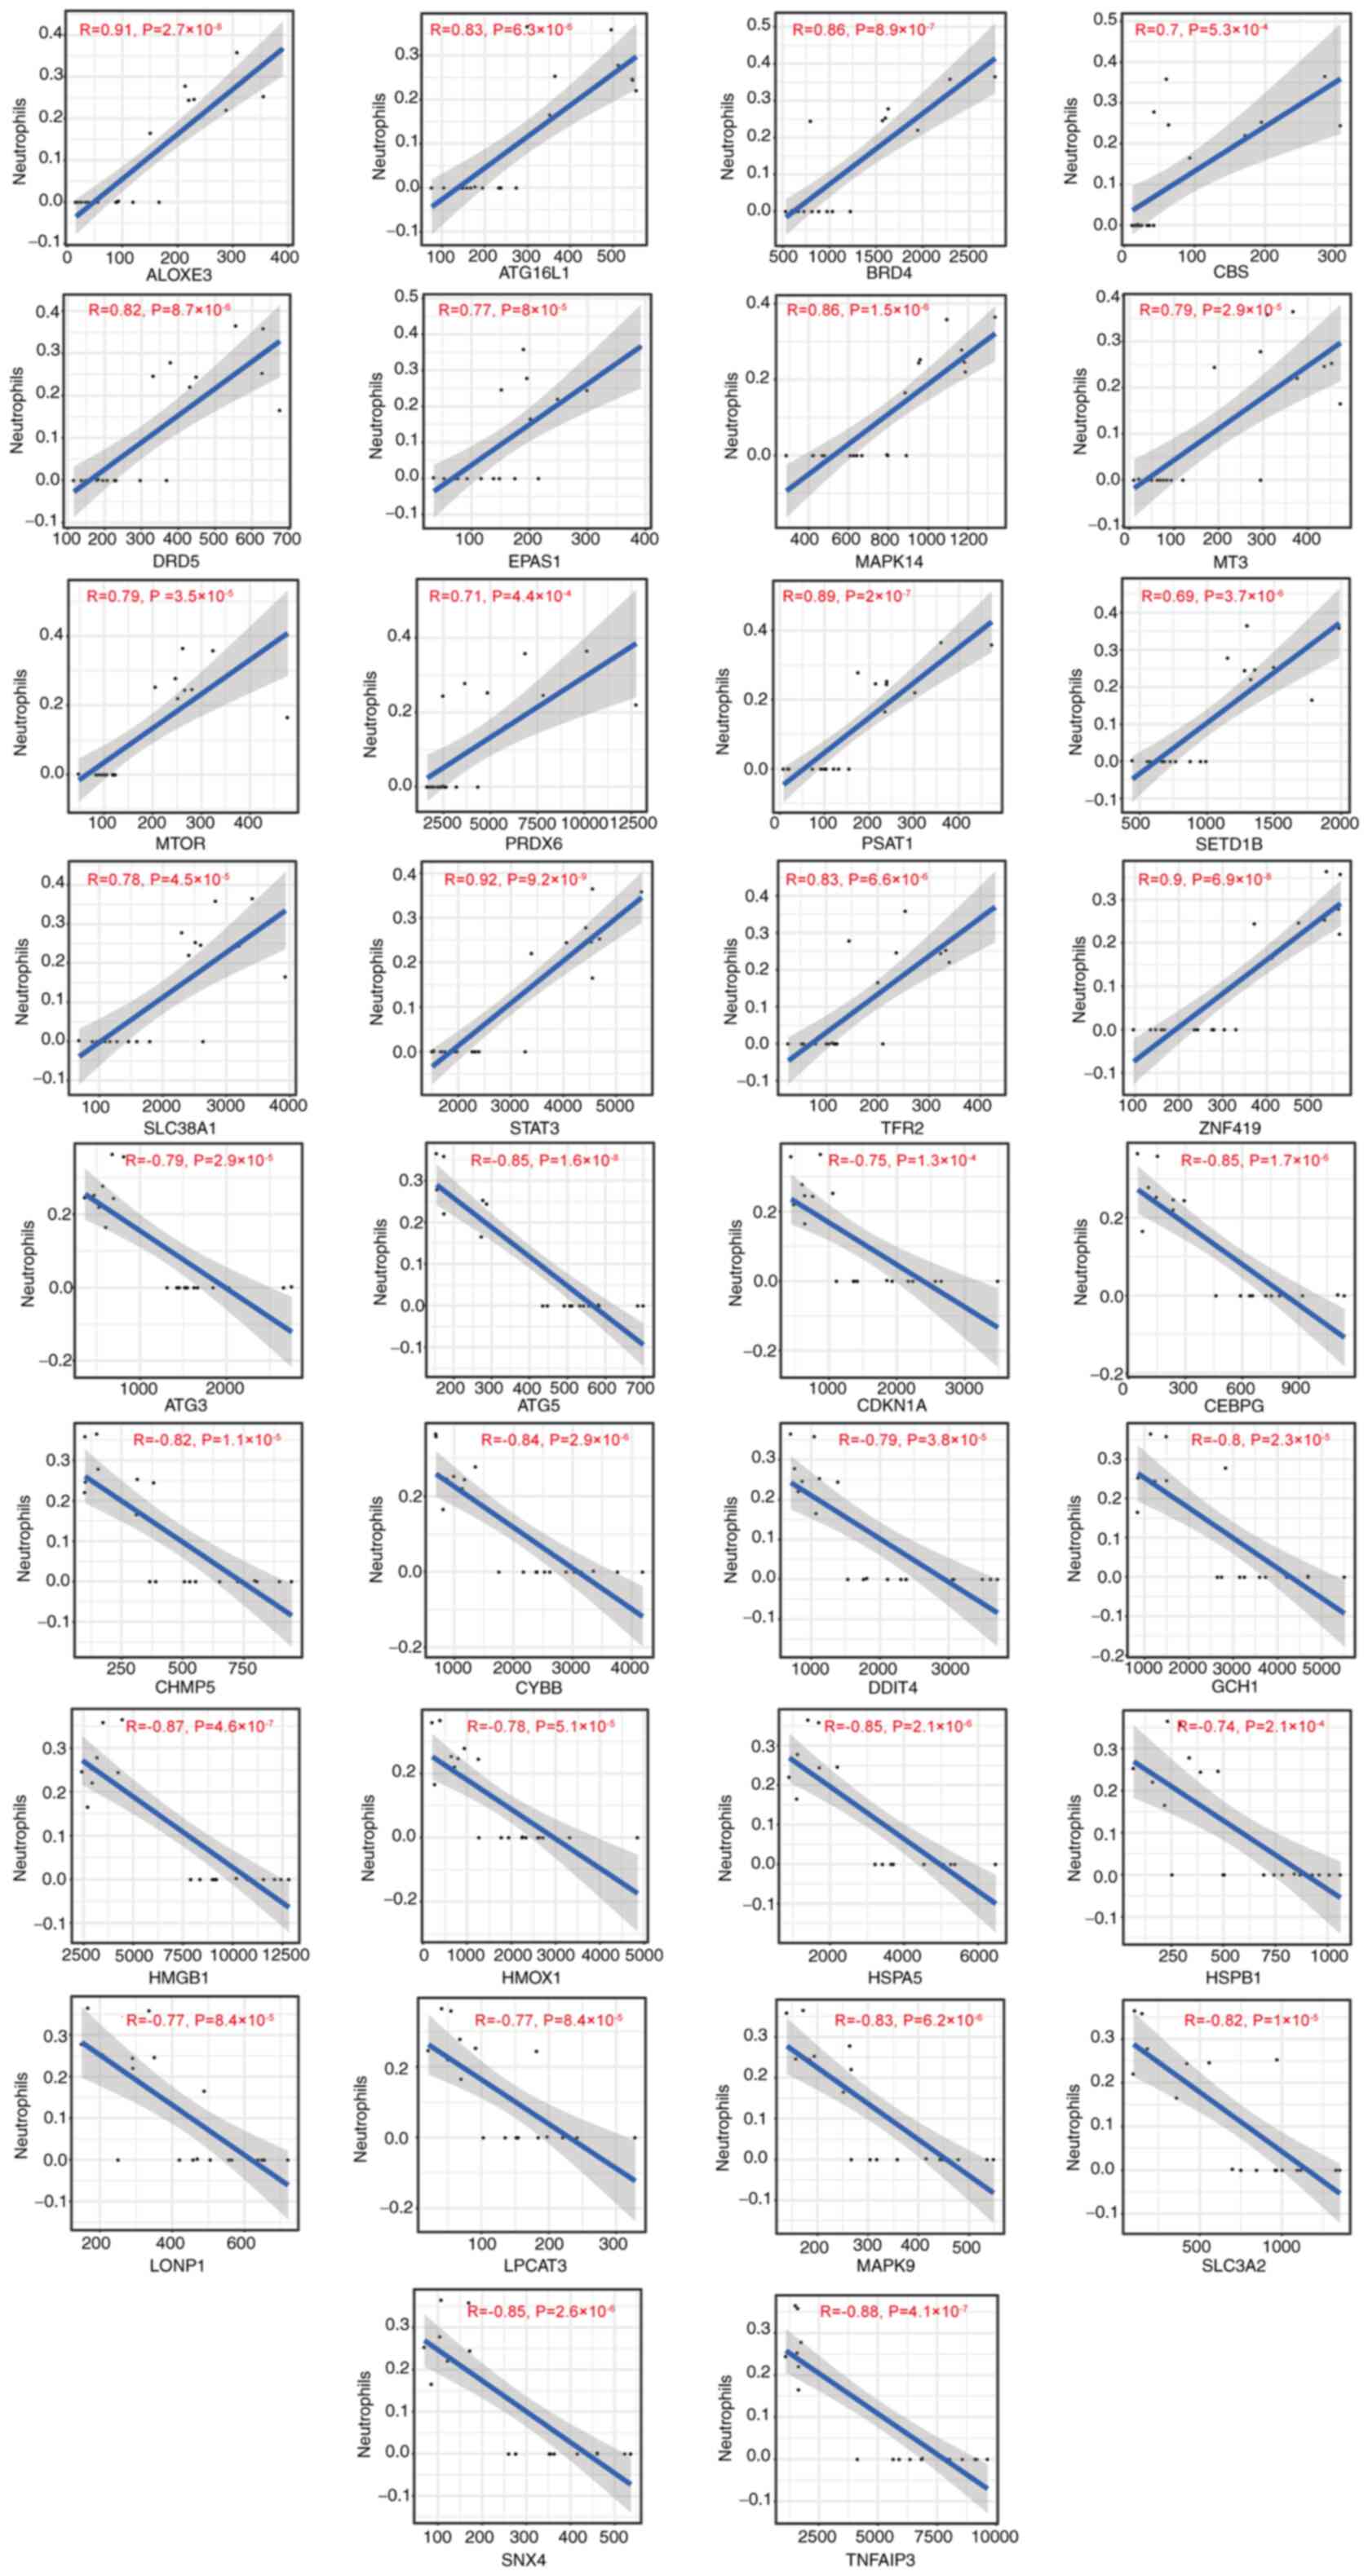 | Figure 11Correlation between
ferroptosis-associated gene expression and immune infiltration of
neutrophils in chronic kidney disease. ATG, antithymocyte globulin;
CDKN1A, cyclin-dependent kinase inhibitor 1; CEBPG, CCAAT enhancer
binding protein; CHMP5, charged multivesicular body protein 5;
CYBB, Cytochrome b-245 beta chain; DDIT4, DNA damage inducible
transcript 4; GCH1, GTP cyclohydrolase 1; HMGB1, high mobility
group box 1; HMOX1, heme oxygenase 1; HSP5, heat shock protein 5;
NRAS, neuroblastoma RAS viral oncogene homolog; RB1, retinoblastoma
susceptibility gene; SLC3A2, solute carrier 3A2; SNX4, sorting
nexin-4; TNFAIP3, TNF-α-induced protein 3; VEGFA, vascular
endothelial-derived growth factor; ALOXE3, arachidonate
lipoxygenase 3; ATG16L1, autophagy related 16 like 1; BRD4,
bromodomain-containing protein 4; DRD5, dopamine receptor D5;
EPAS1, endothelial PAS Domain Protein 1; MT3, metallothionein-3;
PSAT1, phosphoserine aminotransferase 1; SETD1B, SET
domain-containing 1B; TFR2, Transferrin receptor 2; ZNF419, zinc
Finger Protein 419; CBS, cystathionine β-synthase; PRDX6,
peroxiredoxin 6; LONP1, Lon protease 1. |
Validating DFGs in CKD
To confirm GSE15072 dataset reliability, the
expression of the top nine DFGs was assessed in the CKD animal
model via RT-qPCR. To confirm that the present CKD model rat
accurately recapitulated the features of this disease, levels of
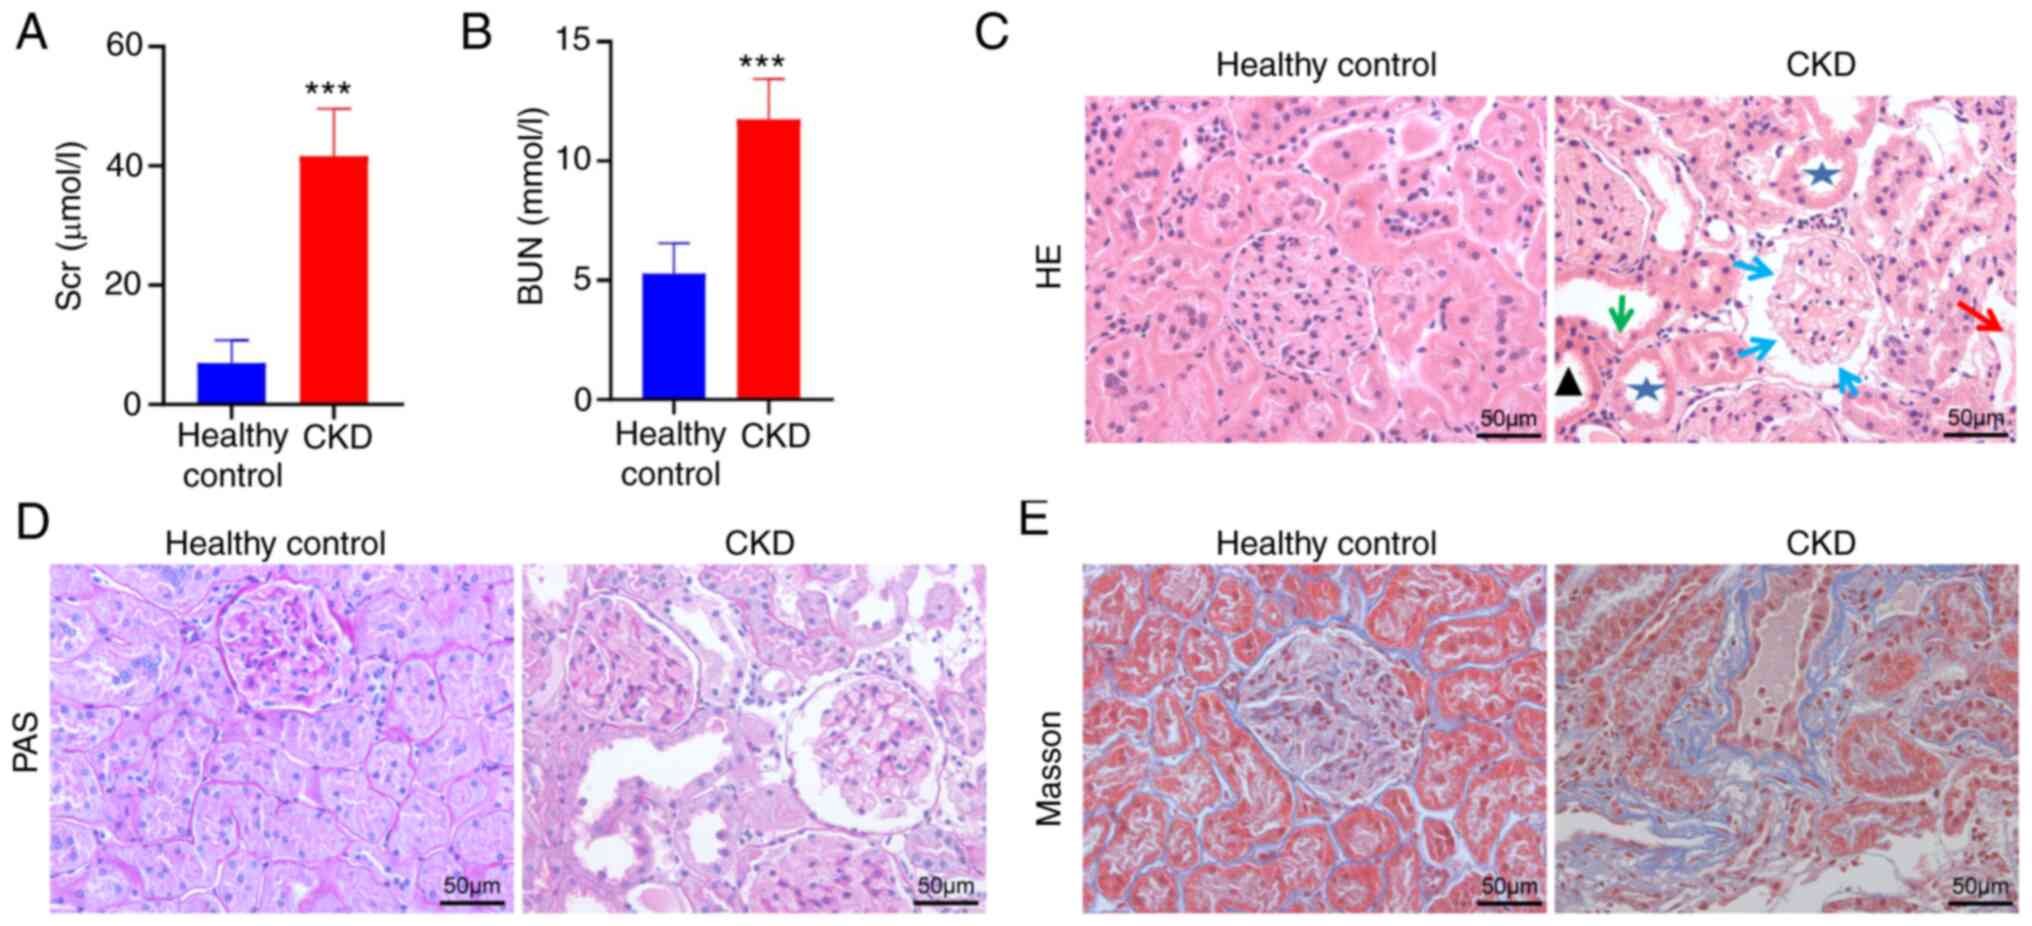
BUN and Scr in these animals were measured (Fig. 13A and B). This analysis found that Adriamycin
induced a significant decrease in renal function, characterized by
increased BUN and Scr levels (P<0.001). Subsequently, the effect
of Adriamycin on renal tissue morphology was considered by
analysing H&E and PAS-stained tissue sections (Fig. 13C and D). Relative to healthy controls, kidney
samples from CKD group animals exhibited focal glomerular sclerosis
in some glomerular and interstitial lesions, interstitial
inflammatory infiltrate, tubular dilatation and atrophy and adenine
crystalline deposits. Furthermore, Masson's trichrome stain of CKD
rats displayed collagen fibril accumulation (blue) in the
tubulointerstitium (Fig.
13E).
The aforementioned results suggested that a
well-characterized model of CKD was successfully established.
RT-qPCR, results shown that the expression levels of STAT3, MAPK14,
HSPA5, MTOR and SLC2A1were significantly higher in CKD rats
compared with normal kidney samples (Fig. 14). However, expression of JUN,
VEGF, HMOX1 and ATF3 was not significantly different between these
groups (Fig. 14).
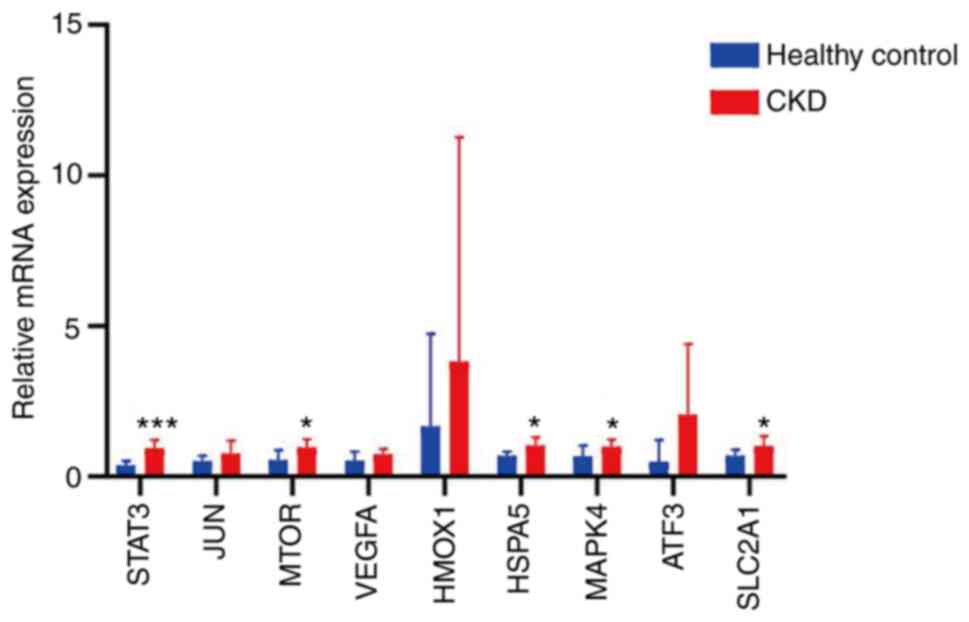 | Figure 14RNA levels of the top nine
ferroptosis-associated genes measured in CKD and healthy kidney
tissue. RNA levels of STAT3, JUN, MTOR, VEGF, HMOX1, HSPA5, MAPK14,
ATF3 and SLC2A1 were compared via reverse
transcription-quantitative PCR analysis of kidney tissue.
*P<0.05 and ***P<0.001 vs. healthy
control. Data are presented as the mean ± standard deviation and
comparisons were performed using the two-sided unpaired Student's t
test. CKD, chronic kidney disease; VEGF, vascular
endothelial-derived growth factor; HMOX1, heme oxygenase 1; HSPA5,
heat shock protein A5; ATF3, activation transcription factor 3;
SLC2A1, solute carrier family 2 member 1. |
Discussion
Ferroptosis is regulated by a series of factors and
signalling pathways linked with various metabolic changes, such as
abnormal amino acid metabolism, iron accumulation and subsequent
lipid peroxidation (6). Iron
deposition has been proven to iron uptake increase and/or iron
export impairment in the kidneys of patients with CKD (30), which suggests that the
CKD-associated renal iron accumulation may first induce
ferroptosis, with iron playing a detrimental role in CKD. The
present study investigated the key ferroptosis-associated
regulatory genes in PBMCs isolated from patients with CKD. These
findings clarify the correlation between ferroptosis and CKD, which
may help screen novel biomarkers for the early diagnosis and
treatment of CKD.
In the present study, DFGs of CKD were first
determined by comparing the gene expression profiles of healthy
controls and patients with CKD. A total of 49 CKD-associated
ferroptosis genes were found, which revealed that
ferroptosis-associated genes were involved in CKD pathogenesis,
providing potential pharmacological targets. Functions of the
identified DFGs were explored by GO and KEGG enrichment analysis.
Moreover, GO and KEGG analyses revealed that these 49 DFGs were
primarily associated with ‘response to nutrient levels’,
‘autophagy’, ‘HIF-1 signalling pathway’, ‘ferroptosis’, ‘lipid’ and
‘atherosclerosis’. These pathways were involved in CKD. Previous
studies indicated that ferroptosis is important in apoptosis of
renal tubular epithelial cells and epithelial-mesenchymal
transition of renal tubular cells (31-33).
Zhao et al (34) discovered
that hypoxia-inducible factor-1 activate Notch-1 transcriptionally
and post-transcriptionally and promotes renal fibrosis in a
cisplatin-induced mouse CKD model. Targeted inhibition of kidney
cells ferroptosis in patients with CKD may be a novel direction for
the therapy of CKD.
The STRING database was used to generate DFG PPI
networks and nine hub genes for ferroptosis in CKD were identified
by Cytoscape software: STAT3, JUN, MTOR, VEGF, HMOX1, HSPA5,
MAPK14, ATF3 and SLC2A1. For bioinformatics, the top nine DFGs were
validated via RT-qPCR in the kidney of the CKD rat model. This
confirmed that STAT3, MAPK14, HSPA5, MTOR and SLC2A1 levels in the
kidney of the CKD animal model were significantly increased
compared with those in the normal controls. STAT3 plays a key role
in tumorigenesis and inflammation (35). Its activation via phosphorylation
increases lysosomal membrane permeability and promotes survival of
breast cancer cells in the context of erastin-induced ferroptosis
(36). MAPK14 is a key part of the
MAP kinase signal transduction pathway, which is crucial for
mitophagy (37). HSPA5 directly
protects cells from endoplasmic reticulum stress due to ROS damage
(38). The atypical
serine/threonine kinase mTOR is a key cell proliferation and
metabolism regulator. mTOR accelerates anabolic processes such as
nucleotide, fatty acid, ribosome biogenesis and protein and lipid
synthesis and inhibits catabolic processes such as autophagy
(39). SLC2A1 encodes glucose
transporter-1 (GLUT1), which is the primary glucose transport
protein present in the blood-brain barrier (40). To the best of our knowledge,
however, how these genes influence CKD pathogenesis remains unclear
and warrants further exploration.
Certain genes are associated with pathogenesis of
CKD. For example, the activation of the transcriptional regulator
STAT3 has been reported in tubular cells following kidney damage,
consistent with a potential role for STAT3 as a driver of CKD
(41). Wang et al (42) suggested a role for mTOR as a
mediator of CKD pathogenesis and that treatment with mTOR inhibitor
rapamycin suppresses this signalling activity to protect against
CKD. In a diabetic nephropathy model, HSPA5 has also been reported
to be upregulated, with similar findings in UUO-induced renal
fibrosis model (43,44). To the best of our knowledge,
although no prior reports have specifically analysed SLC2A1 or
MAPK14 in the context of CKD, knocking down MAPK14 promotes
downregulation of cell division cycle 25B and suppresses clear cell
renal cell carcinoma proliferative and migratory activity (45). In addition, GLUT1 deficiency
syndrome is linked to the translational initiation of SLC2A1 via
upstream regulatory mechanisms (46). The precise mechanistic pathways by
which these verified genes affect development and progression of
CKD, however, remain unclear. In the present analysis, RT-qPCR
revealed that CKD was associated with upregulation of STAT3,
MAPK14, HSPA5, MTOR and SLC2A1. Further investigation exploring
genes downregulated in CKD is thus warranted.
Studies have highlighted the importance of
ferroptotic cell death as a contributing factor to CKD incidence.
For example, a recent study utilizing the UUO-induced renal
fibrosis model system demonstrated that regulation of ferroptotic
signalling can protect against renal damage (47). Wang et al (48) observed the induction of ferroptotic
activity in a 5/6 nephrectomy-induced (one whole kidney is removed
and the poles of the remaining kidney are ablated) CKD model and
determined that dysregulated iron metabolism promotes this
deleterious activity. Accordingly, the use of
ferroptosis-inhibiting compounds, such as deferoxamine or
ferrostatin-1, can protect against interstitial fibrosis, renal
damage and accumulation of inflammatory cells in IRI or UUO-induced
mice (7,49). In a UUO-induced renal fibrosis
mouse model, tocilizumab mimotope treatment protects against renal
injury and fibrotic activity by inhibiting ferroptosis (47). Together, these data highlight the
key role of ferroptosis in pathogenic progression of CKD.
PBMC populations include multipotent progenitor
cells that give rise to a diverse array of immune cell types,
thereby coordinating both physiological and pathological
immunological activity (50). Many
immunosuppressive agents have been used for immune-mediated renal
disease such as acute kidney injury, CKD and graft-versus-host
disease (51). Immunosuppressor
use in CKD is still under debate because only patients exhibiting
large amounts of proteinuria will receive these treatments to
balance the benefit and risks of immunosuppression (51). Preliminary data indicated that
ferroptosis may induce immune cell-induced cell death (52,53).
System xc- (an exchange agency) levels are decreased in
response to IFNγ (52), which is
secreted by CD8+ T cells was recently reported to be
involved in increasing tumour cell sensitivity towards ferroptosis.
Another report revealed that IL-4 and IL-13 inhibit the expression
of GPX4 in kidney cells and other cell types, corresponding to
increased ALOX15 expression, thus allowing a robust generation of
inflammatory arachidonic acid metabolites (53). The present study systematically
analysed differential expression of immune cells and DFGs in CKD.
DFGs in CKD were primarily associated with naive CD4+ T
cells, Tregs, monocytes, neutrophils, resting and activated NK
cells and activated dendritic cells.
However, the current study had limitations. Firstly,
the amount of data analysed was small from the GSE15072 dataset and
bioinformatics findings were obtained from blood samples and not
kidney tissue of patients with CKD. Secondly, the clinical
information downloaded from the GSE15072 dataset is incomplete,
especially demographic data and clinical index, which may be
helpful to understand the basic clinical features of patients with
CKD and HD. Thirdly, experimental verification was performed on the
kidney tissue of CKD rats; the present data need to be further
verified in a higher number of CKD clinical samples. Moreover, the
underlying mechanisms of ferroptosis and CKD, as well as the
dysregulated genes in CKD and HD, need to be further demonstrated.
However, potential therapeutic target genes and pathways were
screened via bioinformatics, which may provide a theoretical
foundation for further studies on therapeutic interventions,
although clinical validation of these results is critical.
Altogether, the present findings suggested STAT3,
MAPK14, HSPA5, MTOR and SLC2A1 as potential diagnostic and
therapeutic biomarkers for CKD, providing evidence regarding the
key role of ferroptosis in CKD.
Supplementary Material
Utilized ferroptosis-associated
genes
Acknowledgements
Not applicable.
Funding
Funding: The current study was supported by the National Natural
Science Foundation of China (grant no. 81860144) and the Yunnan
Fundamental Research Projects (grant no. 202101AY070001-184).
Availability of data and materials
All data generated or analyzed during this study are
included in this published article.
Authors' contributions
LS, CB and JW conceived the study. LS and QF confirm
the authenticity of all the raw data. LS, YanZ and CS performed the
experiments. QF and YaZ analyzed the data. LS wrote the manuscript.
JW wrote and edited the manuscript. CB edited the manuscript. All
authors have read and approved the final manuscript.
Ethics approval and consent to
participate
The present study was approved by the Animal Ethical
and Welfare Committee of Kunming Medical University (approval no.
Kmmu20221379).
Patient consent for publication
Not applicable.
Competing interests
The authors declare that they have no competing
interests.
References
|
1
|
Foreman K, Marquez N, Dolgert A, Fukutaki
K, Fullman N, McGaughey M, Pletcher MA, Smith AE, Tang K, Yuan CW,
et al: Forecasting life expectancy, years of life lost, and
all-cause and cause-specific mortality for 250 causes of death:
Reference and alternative scenarios for 2016-40 for 195 countries
and territories. Lancet. 392:2052–2090. 2018.PubMed/NCBI View Article : Google Scholar
|
|
2
|
Zhao H, Ma SX, Shang YQ, Zhang HQ and Su
W: microRNAs in chronic kidney disease. Clin Chim Acta. 491:59–65.
2019.PubMed/NCBI View Article : Google Scholar
|
|
3
|
Saritas T and Floege J: Cardiovascular
disease in patients with chronic kidney disease. Herz. 45:122–128.
2020.PubMed/NCBI View Article : Google Scholar
|
|
4
|
Sun Y, Chen P, Zhai B, Zhang M, Xiang Y,
Fang J, Xu S, Gao Y, Chen X, Sui X and Li G: The emerging role of
ferroptosis in inflammation. Biomed Pharmacother.
127(110108)2020.PubMed/NCBI View Article : Google Scholar
|
|
5
|
Battaglia A, Chirillo R, Aversa I, Sacco
A, Costanzo F and Biamonte F: Ferroptosis and cancer: Mitochondria
meet the ‘Iron Maiden’ cell death. Cells. 9(1505)2020.PubMed/NCBI View Article : Google Scholar
|
|
6
|
Zhang X and Li X: Abnormal iron and lipid
metabolism mediated ferroptosis in kidney diseases and its
therapeutic potential. Metabolites. 12(58)2022.PubMed/NCBI View Article : Google Scholar
|
|
7
|
Zhou L, Xue X, Hou Q and Dai C: Targeting
ferroptosis attenuates interstitial inflammation and kidney
fibrosis. Kidney Dis (Basel). 8:57–71. 2022.PubMed/NCBI View Article : Google Scholar
|
|
8
|
Moore JH: Bioinformatics. J Cell Physiol.
213:365–369. 2007.PubMed/NCBI View Article : Google Scholar
|
|
9
|
Chen JY, Youn E and Mooney SD: Connecting
protein interaction data, mutations, and disease using
bioinformatics. Methods Mol Biol. 541:449–461. 2009.PubMed/NCBI View Article : Google Scholar
|
|
10
|
Wang D, Xie N, Gao W, Kang R and Tang D:
The ferroptosis inducer erastin promotes proliferation and
differentiation in human peripheral blood mononuclear cells.
Biochem Biophys Res Commun. 503:1689–1695. 2018.PubMed/NCBI View Article : Google Scholar
|
|
11
|
Altintas M, DiBartolo S, Tadros L, Samelko
B and Wasse H: Metabolic changes in peripheral blood mononuclear
cells isolated from patients with end stage renal disease. Front
Endocrinol (Lausanne). 12(629239)2021.PubMed/NCBI View Article : Google Scholar
|
|
12
|
Hartman ML, Shirihai OS, Holbrook M, Xu G,
Kocherla M, Shah A, Fetterman JL, Kluge MA, Frame AA, Hamburg M and
Vita JA: Relation of mitochondrial oxygen consumption in peripheral
blood mononuclear cells to vascular function in type 2 diabetes
mellitus. Vasc Med. 19:67–74. 2014.PubMed/NCBI View Article : Google Scholar
|
|
13
|
Calton EK, Keane KN, Raizel R, Rowlands J,
Soares MJ and Newsholme P: Winter to summer change in vitamin D
status reduces systemic inflammation and bioenergetic activity of
human peripheral blood mononuclear cells. Redox Biol. 12:814–820.
2017.PubMed/NCBI View Article : Google Scholar
|
|
14
|
Tomas C, Brown A, Strassheim V, Elson JL,
Newton J and Manning P: Cellular bioenergetics is impaired in
patients with chronic fatigue syndrome. PLoS one.
12(e0186802)2017.PubMed/NCBI View Article : Google Scholar
|
|
15
|
Gangcuangco L, Mitchell BI, Siriwardhana
C, Kohorn LB, Chew GM, Bowler S, Kallianpur KJ, Chow DC, Ndhlovu
LC, Gerschenson M and Shikuma CM: Mitochondrial oxidative
phosphorylation in peripheral blood mononuclear cells is decreased
in chronic HIV and correlates with immune dysregulation. PLoS One.
15(e0231761)2020.PubMed/NCBI View Article : Google Scholar
|
|
16
|
Gentleman RC, Carey VJ, Bates DM, Bolstad
B, Dettling M, Dudoit S, Ellis B, Gautier L, Ge Y, Gentry J, et al:
Bioconductor: Open software development for computational biology
and bioinformatics. Genome Biol. 5(R80)2004.PubMed/NCBI View Article : Google Scholar
|
|
17
|
Huber W, Carey VJ, Gentleman R, Anders S,
Carlson M, Carvalho BS, Bravo HC, Davis S, Gatto L, Girke T, et al:
Orchestrating high-throughput genomic analysis with Bioconductor.
Nat Methods. 12:115–121. 2015.PubMed/NCBI View Article : Google Scholar
|
|
18
|
Preisendorfer RW and Mobley CD: Principal
component analysis in meteorology and oceanography. Journal
1988.
|
|
19
|
Ito K and Murphy D: Application of ggplot2
to pharmacometric graphics. CPT Pharmacometrics Syst Pharmacol.
2(e79)2013.PubMed/NCBI View Article : Google Scholar
|
|
20
|
Zhou N and Bao J: FerrDb: A manually
curated resource for regulators and markers of ferroptosis and
ferroptosis-disease associations. Database (Oxford).
1(baaa021)2020.PubMed/NCBI View Article : Google Scholar
|
|
21
|
Jia A, Xu L and Wang Y: Venn diagrams in
bioinformatics. Brief Bioinform. 22(bbab108)2021.PubMed/NCBI View Article : Google Scholar
|
|
22
|
Wang JH, Zhao LF, Lin P, Su XR, Chen SJ,
Huang LQ, Wang HF, Zhang H, Hu ZF, Yao KT and Huang ZX: GenCLiP
2.0: A web server for functional clustering of genes and
construction of molecular networks based on free terms.
Bioinformatics. 30:2534–2536. 2014.PubMed/NCBI View Article : Google Scholar
|
|
23
|
Du J, Yuan Z, Ma Z, Song J, Xie X and Chen
Y: KEGG-PATH: Kyoto encyclopedia of genes and genomes-based pathway
analysis using a path analysis model. Mol Biosyst. 10:2441–2447.
2014.PubMed/NCBI View Article : Google Scholar
|
|
24
|
Newman AM, Liu CL, Green MR, Gentles AJ,
Feng W, Xu Y, Hoang CD, Diehn M and Alizadeh AA: Robust enumeration
of cell subsets from tissue expression profiles. Nat Methods.
12:453–457. 2015.PubMed/NCBI View Article : Google Scholar
|
|
25
|
Smoot ME, Ono K, Ruscheinski J, Wang PL
and Ideker T: Cytoscape 2.8: New features for data integration and
network visualization. Bioinformatics. 27:431–432. 2011.PubMed/NCBI View Article : Google Scholar
|
|
26
|
Sandberg K and Umans JG: Recommendations
concerning the new U.S. National institutes of health initiative to
balance the sex of cells and animals in preclinical research. FASEB
J. 29:1646–1652. 2015.PubMed/NCBI View Article : Google Scholar
|
|
27
|
Livak KJ and Schmittgen TD: Analysis of
relative gene expression data using real-time quantitative PCR and
the 2(-Delta Delta C(T)) method. Methods. 25:402–408.
2001.PubMed/NCBI View Article : Google Scholar
|
|
28
|
Viechtbauer W: Conducting meta-analyses in
R with the metafor package. J Statistical Software. 36:1–48.
2010.
|
|
29
|
Masseroli M, Mons B, Bongcam-Rudloff E,
Ceri S, Kel A, Rechenmann F, Lisacek F and Romano P: Integrated
bio-search: Challenges and trends for the integration, search and
comprehensive processing of biological information. BMC
Bioinformatics. 15 (Suppl 1)(S2)2014.PubMed/NCBI View Article : Google Scholar
|
|
30
|
van Raaij S, van Swelm R, Bouman K,
Cliteur M, van den Heuvel MC, Pertijs J, Patel D, Bass P, van Goor
H, Unwin R, et al: Tubular iron deposition and iron handling
proteins in human healthy kidney and chronic kidney disease. Sci
Rep. 8(9353)2018.PubMed/NCBI View Article : Google Scholar
|
|
31
|
Liu Y: Epithelial to mesenchymal
transition in renal fibrogenesis: Pathologic significance,
molecular mechanism, and therapeutic intervention. J Am Soc
Nephrol. 15:1–12. 2004.PubMed/NCBI View Article : Google Scholar
|
|
32
|
Kalluri R and Neilson EG:
Epithelial-mesenchymal transition and its implications for
fibrosis. J Clin Invest. 112:1776–1784. 2003.PubMed/NCBI View Article : Google Scholar
|
|
33
|
Chevalier RL: Pathogenesis of renal injury
in obstructive uropathy. Curr Opin Pediatr. 18:153–160.
2006.PubMed/NCBI View Article : Google Scholar
|
|
34
|
Zhao H, Han Y, Jiang N, Li C, Yang M, Xiao
Y, Wei L, Xiong X, Yang J, Tang C, et al: Effects of HIF-1α on
renal fibrosis in cisplatin-induced chronic kidney disease. Clin
Sci (Lond). 135:1273–1288. 2021.PubMed/NCBI View Article : Google Scholar
|
|
35
|
Hillmer EJ, Zhang H, Li HS and Watowich
SS: STAT3 signaling in immunity. Cytokine Growth Factor Rev.
31:1–15. 2016.PubMed/NCBI View Article : Google Scholar
|
|
36
|
Zhou B, Liu J, Kang R, Klionsky DJ,
Kroemer G and Tang D: Ferroptosis is a type of autophagy-dependent
cell death. Semin Cancer Biol. 66:89–100. 2020.PubMed/NCBI View Article : Google Scholar
|
|
37
|
Hirota Y, Yamashita S, Kurihara Y, Jin X,
Aihara M, Saigusa T, Kang D and Kanki T: Mitophagy is primarily due
to alternative autophagy and requires the MAPK1 and MAPK14
signaling pathways. Autophagy. 11:332–343. 2015.PubMed/NCBI View Article : Google Scholar
|
|
38
|
Gomer C, Ferrario A, Rucker N, Wong S and
Lee AS: Glucose regulated protein induction and cellular resistance
to oxidative stress mediated by porphyrin photosensitization.
Cancer Res. 51:6574–6579. 1991.PubMed/NCBI
|
|
39
|
Saxton RA and Sabatini DM: MTOR signaling
in growth, metabolism, and disease. Cell. 168:960–976.
2017.PubMed/NCBI View Article : Google Scholar
|
|
40
|
Waln O and Jankovic J: Paroxysmal movement
disorders. Neurol Clin. 33:137–152. 2015.PubMed/NCBI View Article : Google Scholar
|
|
41
|
Bienaimé F, Muorah M, Yammine L, Burtin M,
Nguyen C, Baron W, Garbay S, Viau A, Broueilh M, Blanc T, et al:
Stat3 controls tubulointerstitial communication during CKD. J Am
Soc Nephrol. 27:3690–3705. 2016.PubMed/NCBI View Article : Google Scholar
|
|
42
|
Wang J, Chai L, Lu Y, Lu H, Liu Y and
Zhang Y: Attenuation of mTOR signaling is the major response
element in the rescue pathway of chronic kidney disease in rats.
Neuroimmunomodulation. 27:9–18. 2020.PubMed/NCBI View Article : Google Scholar
|
|
43
|
Lindenmeyer MT, Rastaldi MP, Ikehata M,
Neusser MA, Kretzler M, Cohen CD and Schlöndorff D: Proteinuria and
hyperglycemia induce endoplasmic reticulum stress. J Am Soc
Nephrol. 19:2225–2236. 2008.PubMed/NCBI View Article : Google Scholar
|
|
44
|
Bhreathnach U, Griffin B, Brennan E, Ewart
L, Higgins D and Murphy M: Profibrotic IHG-1 complexes with renal
disease associated HSPA5 and TRAP1 in mitochondria. Biochim Biophys
Acta Mol Basis Dis. 1863:896–906. 2017.PubMed/NCBI View Article : Google Scholar
|
|
45
|
Liu J, Yu X, Yu H, Liu B, Zhang Z, Kong C
and Li Z: Knockdown of MAPK14 inhibits the proliferation and
migration of clear cell renal cell carcinoma by downregulating the
expression of CDC25B. Cancer Med. 9:1183–1195. 2020.PubMed/NCBI View Article : Google Scholar
|
|
46
|
Willemsen MA, Vissers LE, Verbeek MM, van
Bon BW, Geuer S, Gilissen C, Klepper J, Kwint MP, Leen WG, Pennings
M, et al: Upstream SLC2A1 translation initiation causes GLUT1
deficiency syndrome. Eur J Hum Genet. 25:771–774. 2017.PubMed/NCBI View Article : Google Scholar
|
|
47
|
Yang L, Guo J, Yu N, Liu Y, Song H, Niu J
and Gu Y: Tocilizumab mimotope alleviates kidney injury and
fibrosis by inhibiting IL-6 signaling and ferroptosis in UUO model.
Life Sci. 261(118487)2020.PubMed/NCBI View Article : Google Scholar
|
|
48
|
Wang J, Wang Y, Liu Y, Cai X, Huang X, Fu
W, Wang L, Qiu L, Li J and Sun L: Ferroptosis, a new target for
treatment of renal injury and fibrosis in a 5/6 nephrectomy-induced
CKD rat model. Cell Death Discov. 8(127)2022.PubMed/NCBI View Article : Google Scholar
|
|
49
|
Ikeda Y, Ozono I, Tajima S, Imao M,
Horinouchi Y, Izawa-Ishizawa Y, Kihira Y, Miyamoto L, Ishizawa K,
Tsuchiya K and Tamaki T: Iron chelation by deferoxamine prevents
renal interstitial fibrosis in mice with unilateral ureteral
obstruction. PLoS One. 9(e89355)2014.PubMed/NCBI View Article : Google Scholar
|
|
50
|
Zhang M and Huang B: The
multi-differentiation potential of peripheral blood mononuclear
cells. Stem Cell Res Ther. 3(48)2012.PubMed/NCBI View Article : Google Scholar
|
|
51
|
Tang P, Zhang Y, Chan M, Lam WWY, Chung
JYF, Kang W, To KF, Lan HY and Tang PMK: The emerging role of
innate immunity in chronic kidney diseases. Int J Mol Sci.
21(4018)2020.PubMed/NCBI View Article : Google Scholar
|
|
52
|
Sato H, Fujiwara K, Sagara J and Bannai S:
Induction of cystine transport activity in mouse peritoneal
macrophages by bacterial lipopolysaccharide. Biochem J.
310:547–551. 1995.PubMed/NCBI View Article : Google Scholar
|
|
53
|
Schnurr K, Borchert A and Kuhn H: Inverse
regulation of lipid-peroxidizing and hydroperoxyl lipid-reducing
enzymes by interleukins 4 and 13. FASEB J. 13:143–154.
1999.PubMed/NCBI View Article : Google Scholar
|