Introduction
Forming part of the basic unit of female
reproduction, a follicle consists of oocyte and granulosa cells
(GCs) (1). GCs are involved in
supporting and nourishing oocytes during follicular development and
maturation (2,3). Oxidative stress (OS) caused by the
increase of reactive oxygen species (ROS) levels has an important
effect on oocyte and embryo quality (4,5).
Previous study have found that the levels of ROS in the follicular
fluid of patients with polycystic ovary syndrome (PCOS) and
endometriosis (EMT) are significantly increased (4,6). In
addition, within the healthy population, the total oxidative state
and total antioxidant state in the follicular fluid also tend to be
abnormal as the individual ages (6-8).
Other studies have confirmed that OS can reduce the ovarian
follicle stimulating hormone (FSH) activity by downregulating the
expression of the FSH regulatory gene P450 aromatase and then
decreasing the expression of FSHR (9,10).
Therefore, it is important to protect GC from OS injury to improve
the quality of follicles and embryos, in addition to preserving
female reproductive function.
L-carnitine (LC) is a type of water soluble vitamin
analogue that is naturally occurring in the human body (11). As an important substance of
aliphatic acid energy metabolism, it can help transport long chain
aliphatic acids from the cytoplasm into the mitochondria (12). Since L-carnitine is a carrier of
long-chain fatty acyl groups, it can participate in the deacylation
and reacylation of membrane phospholipids in the process of
membrane repair, which is conducive to timely membrane repair
(12). In other words, LC exhibits
high antioxidant effects. Although previous studies have
demonstrated that LC exerts protective effects on female
reproduction by reducing the damage of oocytes by oxidative stress
products (such as ROS) by reducing oocyte oxidative stress, which
improves oocyte quality (13,14),
the potential role of LC in GCs remains unclear. Therefore, the
present study firstly introduced LC into an in vitro model
of OS in GCs, which is established in the ovarian granular cell
line KGN through H2O2 treatment. OS
biomarkers and FSH receptor (FSHR) protein expression levels were
then measured to explore the effects of LC on OS injury in KGN
cells induced by H2O2. The present study
examined the morphological changes of KGN cells in the
aforementioned groups using electron microscopy, measured the
levels of oxidative stress [2,7-dichloro-dihydrofluorescein
diacetate (DCFH-DA) assay of ROS, spectrophotometry of superoxide
dismutase levels, ELISA of glutathione levels, spectrophotometry of
malondialdehyde (MDA) levels], and examined cell apoptosis using
flow cytometry and FSHR expression using western blotting to
explore the effects of LC on the response of KGN cells to oxidative
stress.
Materials and methods
Reagents
LC (purity >98%) was purchased from Sigma-Aldrich
(Merck KGaA). H2O2 30% solution (analytical
grade) was purchased from Yantai Far East Fine Chemical Co., Ltd.
KGN human ovarian granulocyte cells (cat. no. YS549C) were
purchased from Shanghai Yaji Biotechnology Co., Ltd. The KGN cells
were authenticated by short tandem repeat profiling.
Culture of KGN cells
KGN cells are anchorage-dependent cells and can
proliferate steadily (15). KGN
cells maintain the majority of the physiological activities of
normal human ovarian GCs, including functional FSHR expression,
steroid production and Fas-mediated apoptotic patterns (16). They are suitable for studying the
physiological regulation of human GCs (16). KGN cells were cultured in complete
medium (CM), which was comprised of 89% DMEM/F-12 (Beijing Oka
Biological Technology Co., Ltd.), 10% FBS (ExCell Biotechnology
Co., Ltd.) supplement and 1% penicillin (100 U/ml) and streptomycin
(0.1 mg/ml) (Beijing Biosharp Biotechnology Co., Ltd.) at 37˚C with
5% CO2. The cells able to multiply normally were
cryopreserved once every other week with 1 ml cryoprotectant made
of DMSO (Beijing Solarbio Science & Technology Co., Ltd.) and
FBS at a ratio of 1:9.
KGN cells were divided into the following groups for
the Cell Counting Kit-8 (CCK-8), OS level (DCFH-DA,
spectrophotometry, ELISA and spectrophotometry), JC-1 and western
blotting assays: Blank (CM-blank 24 h + CM-blank 24 h), OS
(CM-blank 24 h + CM-H2O2 100 µmol/l 24 h),
low LC (CM-LC 40 µmol/l 24 h + CM-H2O2 100
µmol/l 24 h) and high LC (CM-LC 80 µmol/l 24 h +
CM-H2O2 100 µmol/l 24 h) groups.
Determination of
H2O2 concentration needed to induce OS
KGN cells (1x10³ cells/well) were seeded
into a 96-well plate and cultured at 37˚C for 24 h. Cells were then
divided into the following groups: Control (cells without
H2O2 treatment); treatment (cells treated
with 25, 50, 100, 150 and 200 µmol/l H2O2)
and the blank groups (wells without cells or
H2O2 treatment). After culture for 12, 24 and
48 h at 37˚C, 10 µl CCK-8 solution (Beijing Solarbio Science &
Technology Co., Ltd.) was added to each well according to the
manufacturer's protocols. The plates were incubated for 2 h at 37˚C
and the absorbance at 450 nm wavelength, which was obtained as the
optical density (OD) value, was measured with a Multiskan SkyHigh
automatic microplate reader (Thermo Fisher Scientific, Inc.). Cell
viability was calculated using the following formula: Cell
viability=(ODtreatment-ODblank)/(ODcontrol-ODblank)
x100. The appropriate concentration of H2O2
in CM was screened out by monitoring changes in cell viability and
cell viability of 50-60% was selected to construct the OS model for
subsequent experiments. Cell viability was assessed in three
replicates for each group.
Determination of the concentration of
LC
KGN cells had a relatively long population doubling
time of ~46.4 h (13), therefore,
the cells were sub-cultured at a 1:2 ratio. Subsequently, cells
were cultured in CM containing 80 µmol/l LC for 24 h and then the
CM containing 100 µmol/l H2O2 was replaced to
culture cells for a further 24 h at 37˚C. The duration of 24 h was
selected because a culture time of two times 24 h was close to its
doubling time (15).
Effect of LC concentration on KGN cell
viability. KGN cells (5x10³ cells/well) were seeded
into a 96-well plate and divided into the control group (cells
without LC treatment) and the experimental groups (cells treated
with 10, 20, 40, 80 and 160 µmol/l LC at 37˚C). The OD data were
corrected for the OD of the blank group (wells without cell or LC
treatment) and then normalized to the control group. After 24 h,
cell viability was calculated according to the manufacturer's
instructions using CCK-8 (cat. no. BS350A; Biosharp Life Sciences)
at 37˚C for 4 h. This cell viability experiment was assessed in
three replicates for each group.
LC concentration in KGN cells. KGN cells
(1x10⁵ cells/well) were seeded into a six-well plate
without the blank group. Aliquots of 2 ml CM containing different
LC concentrations (10, 20, 40, 80 and 160 µmol/l LC at 37˚C) were
added to each well and before intracellular LC concentrations were
detected after 24 h at 37˚C. After washing with PBS, cells were
digested with 1 ml trypsin (cat. no. T1300, Beijing Solarbio
Science & Technology Co., Ltd.) for 1 min and collected in a
1.5-ml Eppendorf tube. After further washing with PBS, cells were
resuspended in 1 ml PBS, repeatedly frozen and thawed (-80˚C and
37˚C) for three times. Subsequently, cells were centrifuged at 590
x g for 20 min and the LC concentration in the supernatant was
measured using ELISA (cat. no. ml037170; Shanghai Enzyme-linked
Biotechnology Co., Ltd.) according to the manufacturer's protocols.
Sample concentrations were extrapolated from a calibration curve.
Sample concentrations were tested three times. The concentration of
LC was selected according to the change in LC concentration in GCs
under different extracellular concentrations of LC.
Observation of the ultrastructure of
KNG cells
Cells were cultured to 1x10⁷ cells in
each group: Blank (CM-blank 24 h + CM-blank 24 h), OS (CM-blank 24
h + CM-H2O2 100 µmol/l 24 h), low LC (CM-LC
40 µmol/l 24 h + CM-H2O2 100 µmol/l 24 h) and
high LC (CM-LC 80 µmol/l 24 h + CM-H2O2 100
µmol/l 24 h) groups. After digestion at 37˚C with 1 ml
trypsin for 1 min, the cells were collected in a 1.5-ml Eppendorf
tube and centrifuged at 100 g for 10 min to remove the supernatant.
Subsequently, cells were fixed in 4% paraformaldehyde + 1%
glutaraldehyde solution for 30 min at 37˚C and stored at 5˚C for 12
h. After removal of the fixative solution, cells were rinsed with
PBS three times for 15 min each time. Subsequently, cells were
fixed with 1% osmium tetroxide solution for 1-2 h at 37˚C, washed
with PBS, dehydrated in ascending ethanol series (30, 50, 70, 80,
90 and 95% ethanol; 15 min each) before being finally treated with
100% ethanol for 20 min. After treatment with pure acetone for 20
min, the cells were treated with a mixture of embedding agent and
acetone (V/V=1/1 for 1 h, then V/V=3/1 for 3 h) and pure embedding
agent overnight. The osmotic samples were heated overnight at 70˚C.
The samples were sliced into 70-90-nm sections using an ultrathin
slicing machine (HT7700; Hitachi, Ltd.) and stained with lead
citric acid solution and 50% ethanol saturated solution of uranium
dioxane acetate for 5-10 min, respectively. After exposure to air,
the specimens were observed under transmission electron microscopy
(EM UC7; Leica Microsystems GmbH) to analyze the morphology of the
nuclear membranes and mitochondria. The specific method was
consistent with that used by Ma et al (17).
Measurement of cell viability and OS
levels
Cell viability. A total of 1x10⁶
KGN cells were cultured in a 96-well plate at 37˚C as follows:
Blank group (CM-blank 24 h + CM-blank 24 h), OS (CM-blank 24 h +
CM-H2O2 100 µmol/l 24 h), low LC (CM-LC 40
µmol/l 24 h + CM-H2O2 100 µmol/l 24 h) and
high LC groups (CM-LC 80 µmol/l 24 h +
CM-H2O2 100 µmol/l 24 h). Subsequently, cell
viability of each experimental group was detected using CCK-8
assay.
OS levels. A total of 1x10⁶ KGN
cells were cultured in a 96-well plate at 37˚C: Blank group
(CM-blank 24 h + CM-blank 24 h), OS (CM-blank 24 h +
CM-H2O2 100 µmol/l 24 h), low LC (CM-LC 40
µmol/l 24 h + CM-H2O2 100 µmol/l 24 h) and
high LC groups (CM-LC 80 µmol/l 24 h +
CM-H2O2 100 µmol/l 24 h). ROS (cat.
no. CA1410), MDA content (cat. no. BC0020), reduced glutathione
(GSH) content (cat. no. BC1175) and superoxide dismutase (SOD)
activity (cat. no. BC0170) assay kits, all purchased from Beijing
Solarbio Science & Technology Co., Ltd., were used to analyze
the OS levels in vitro, according to the manufacturer's
protocols.
ROS. The ROS level in KGN cells was measured
based on the fluorescence intensity of DCFH-DA. After washing with
PBS, cells were treated with 1 ml working solution (DCFH-DA:
serum-free medium=1:1,000). ROS detection solution was prepared
with the DCFH-DA probe in serum-free medium at 1:1,000 ratio and 1
ml ROS detection solution was added into the six-well plate to
cover the bottom of the wells. After cultured for 25 min at 37˚C,
the cells were gently washed with DMEM and digested with 500 µl
trypsin without EDTA for 3 min at 37˚C. The average fluorescence
intensity of KGN cells in each experimental group was recorded
using the fluorescein isothiocyanate (FITC) channel of a NovoCyte
2040R flow cytometer (Beckman Coulter, Inc.) and analyzed using
NovoExpress 1.1.0 (Agilent Technologies, Inc.) within 1 h. The
maximum absorption and excitation wavelengths of FITC were 494 and
518 nm, respectively. The ROS level analysis was performed in
triplicate.
MDA. KGN cells in the Blank (CM-blank 24 h +
CM-blank 24 h), OS (CM-blank 24 h + CM-H2O2
100 µmol/l 24 h), low LC (CM-LC 40 µmol/l 24 h +
CM-H2O2 100 µmol/l 24 h) and high LC (CM-LC
80 µmol/l 24 h + CM-H2O2 100 µmol/l 24 h)
groups were washed with PBS, digested with 400 µl trypsin for 1 min
at 37˚C and resuspended in an Eppendorf tube. A total of 10 µl cell
suspension was collected for cell counting using a hemocytometer.
After cell counting, the cells in each group were centrifuged at
210 x g for 5 min at 37˚C to remove the supernatant and then
diluted in PBS to 5x10⁶ cells/ml. Cell disruption was
performed at 4˚C using an ultrasonic breaker (KQ-800GKDV; Kunshan
Ultrasonic Instrument Co., Ltd.) for 30 cycles of sonication at 20%
power for 3 sec with an interval of 10 sec between each sonication.
Subsequently, the broken cells were centrifuged at 8,000 g and 4˚C
for 10 min to collect the supernatant that was stored at 4˚C until
further use. The samples were treated with the MDA content assay
kit as per manufacturer's protocols and sealed in water bath at
100˚C for 60 min. After cooling to room temperature (~1 h), the
samples were centrifuged at 10,000 g and room temperature for 10
min, before 200 µl were added into each well of a 96-well plate.
The absorbance at 450, 532 and 600 nm in each well was determined
and ∆OD was obtained as the OD difference between test well and
blank well at the same wavelength. MDA content in each sample was
calculated using the following formula: MDA content=[12.9x
(∆OD532-∆OD600)-2.58x ∆OD450] x V
total/(500/Vextract x Vsample).
The MDA content was measured three times.
GSH. KGN cells in a six-well plate were
collected and counted to ensure a number of cells of
1x10⁶-1x10⁷. After centrifugation at 600 x g
and 10 min at room temperature, cells were washed twice with PBS
and then treated with the working solution according to the
manufacturer's protocol of the specific kit. After being frozen (30
min) and thawed (30 min) for three times, the samples were
centrifuged at 8,000 x g for 10 min at room temperature and the
supernatants were collected and stored at 4˚C until further
analysis. A calibration curve was prepared according to the
manufacturer's protocols of the specific kit and the sample
supernatants were loaded into a microplate reader. For each sample,
the absorbance at 412 nm was measured and the detection absorbance
of the blank detection hole was set as D0.
∆OD412=OD412-OD0). Subsequently,
the calibration curve was used to extrapolate the concentration of
each sample from the corresponding ∆OD412. The GSH
content was calculated using the following formula: Sample
concentration x
Vsample/(Vsample/Vsample
total x cell number), i.e. the ratio between sample
concentration and cell number. The GSH content was measured three
times.
SOD. The protocol used to measure the SOD
content was the same as that for MDA in terms of experimental
groups and treatments, cell counting and disruption, as well as
supernatant collection. The SOD activity detection kit was
purchased from Beijing Solarbio Science & Technology Co., Ltd.
(product no. BC0170). The supernatants collected from each sample
were loaded in the microplate reader according to the kit protocols
before the test, control (untreated KGN cells) and blank (no cells)
samples were set. After sample loading using the loading buffer in
the kit to prevent excessive protein degradation, the supernatants
and the assay reagents in each tube were mixed, incubated at 37˚C
for 30 min and cooled down to room temperature. Samples were added
into 96-well plate at the volume of 200 µl per well and the
absorbance at 560 nm of each sample was measured using a microplate
reader. ∆ODtest was the difference of ODtest
and ODcontrol, whereas ∆ODblank was the
difference of ODblank1 and ODblank2 (blank1
and blank2 were replicates. This step aimed to eliminate systematic
errors). The inhibition percentage was calculated using the
following formula: %
Inhibition=(∆ODblank-∆ODtest)/∆ODblank
x100. The cell number of samples were adjusted to 1.2
x106 to ensure the inhibition percentage of 30-70% based
on preliminary experiments. Therefore, the SOD activity was
calculated using the following formula: SOD activity=inhibition
percentage x Vreaction/(1-inhibition
percentage)/(500/Vsample total x Vsample) x
Dilution ratio. The SOD content was measured three times.
Measurement of mitochondrial membrane
potential (ΔΨm) and cell apoptosis
ΔΨm. The ΔΨm was measured using the
Mitochondrial Membrane Potential Detection Kit (JC-1 Assay; cat.
no. CA1310; Beijing Solarbio Science & Technology Co., Ltd.)
according to the manufacturer's protocols. Cells were cultured in
six-well plates and 4 ml 200X JC-1 dye solution diluted with
ultrapure water at a ratio 1:160 was added with 1 ml 5X JC-1 dyeing
buffer solution to prepare the JC-1dyeing working solution. After
washing with PBS, the cells were treated with 1 ml CM-blank or JC-1
dyeing working solution and incubated at 37˚C for 20 min. The
distilled water and 5X JC-1 dyeing buffer were mixed in a 4:1 ratio
to obtain 1X JC-1 dyeing buffer. After incubation, cells were
gently washed two times with the 1X JC-1 dyeing buffer and 2 ml
CM-blank was added into each well. The samples were observed under
a fluorescence microscope (magnifications, x200 and s400; IX73
DP22; Olympus Corporation) within 1 h. The JC-1 monomers diluted in
the cytoplasm of KGN cells were excited using blue light to present
green fluorescence, whilst the JC-1 aggregates in the mitochondrial
matrix of KGN cells were excited using green light to present red
fluorescence. The maximum excitation and emission wavelengths of
JC-1 monomer (green light) are 514 and 529 nm respectively. The
maximum excitation wavelength of the JC-1 polymer (J-aggregates;
red light) is 585 nm, and the maximum emission wavelength is 590
nm. The presence of green fluorescence in the cytoplasm indicates a
decrease in mitochondrial membrane potential, where the cells would
be considered in the early stages of apoptosis, whilst red
fluorescence would indicate normal mitochondrial membrane potential
and the cells are likely to be in normal condition. The images
displaying either green or red fluorescence were merged using the
ImageJ V1.8.0 software (National Institutes of Health). The ΔΨm
measurement was performed three times and calculated according to
the kit instructions.
Cell apoptosis. Cell apoptosis was detected
using a ACEA NovoCyte flow cytometer (ACEA Bioscience, Inc.)
according to the protocols of the Annexin V-FITC/PI double-staining
kit (cat. no. 40302ES20; Shanghai Yeasen Biotechnology Co., Ltd.).
KNG cells were digested with 400 µl trypsin and collected by
centrifugation at 300 g and 4˚C for 5 min. A total of
1x10⁶ Cells were washed twice with cold PBS and
resuspended with 100 µl 1X Binding Buffer, before they were gently
mixed with Annexin V-FITC (5 µl) and PI staining solution (10 µl).
The control was only composed of Annexin V-FITC and PI staining
solution without cells. The cells were stored away from light to
react at room temperature for 15 min, mixed with 400 µl 1X binding
buffer and stored on ice. Samples were analyzed within 1 h and FITC
and PI channels were selected. The results were graphically
analyzed using the Novoexpress 1.5.6 software (Agilent
Technologies, Inc.). The experiment was performed three times.
Detection of FSHR protein expression
in GCs
Total protein was extracted from KNG cells using 500
µl RIPA lysis buffer (RIPA and PMSF at a ratio of 100:1). RIPA
(product no. R0010) and PMSF (product no. P0100) were purchased
from Beijing Solarbio Science & Technology Co., Ltd. After
lysis on ice in the dark for 30 min, the cells were scraped and
transferred into an Eppendorf tube for centrifugation at 13,680 x g
and 4˚C. The supernatants were collected and total protein contents
were measured using a BCA protein quantitative detection kit. RIPA
was used to adjust the total protein concentration of supernatants
in each group to the same value and 5X protein loading buffer was
added according to the samples in a 5:1 ratio. The protein samples
were boiled at 100˚C for 5 min and the 10% polyacrylamide gel was
prepared using a PAGE Gel rapid preparation kit. Protein (30 µg per
lane) separation was performed by SDS-PAGE using the voltage of 80
V for 30 min and 120 V for 1 h, before the proteins were
transferred onto PDVF membranes. After washing three times with
TBST (0.5% Tween; cat. no. T1085; Beijing Solarbio Science &
Technology Co., Ltd.), the samples were blocked with 5% milk for 2
h at 37˚C and incubated with primary antibodies against FSHR
(1:1,500; cat. no. 22665-1-AP; ProteinTech Group, Inc.) and GAPDH
(1:10,000, cat. no. 60004-1-Ig; ProteinTech Group, Inc.) overnight
at 4˚C, then incubated with the HRP-IgG secondary antibodies
(1:10,000, cat. no. PR30011; ProteinTech Group, Inc.) for 1 h at
37˚C. Subsequently, the membranes were washed and the protein bands
were developed using Omni-ECL™ basic chemiluminescence
detection Kit (cat. no. SQ201; Shanghai Epizyme Biotech Co., Ltd.).
Luminescence imaging was performed using a chemiluminescence imager
(ChemiDoc touch; Bio-Rad Laboratories, Inc.). The experiment was
repeated three times. ImageJ V1.8.0 software was used to quantify
protein expression.
Statistical analysis
SPSS 25.0 (IBM Corp.) and GraphPad Prism 8.0
(GraphPad Software, Inc.) were used for statistical analysis. Data
are expressed as the mean ± standard deviation. Levene's test was
used to test the homogeneity of variance in each group. If the
variance was homogeneous, Tukey's test would be used. By contrast,
if the variance was not homogeneous, then Welch ANOVA and Dunnett's
T3 test would be used. All experiments were repeated ≥ three times
and P<0.05 was considered to indicate a statistically
significant difference.
Results
Determination of the
H2O2 concentration needed to induce OS
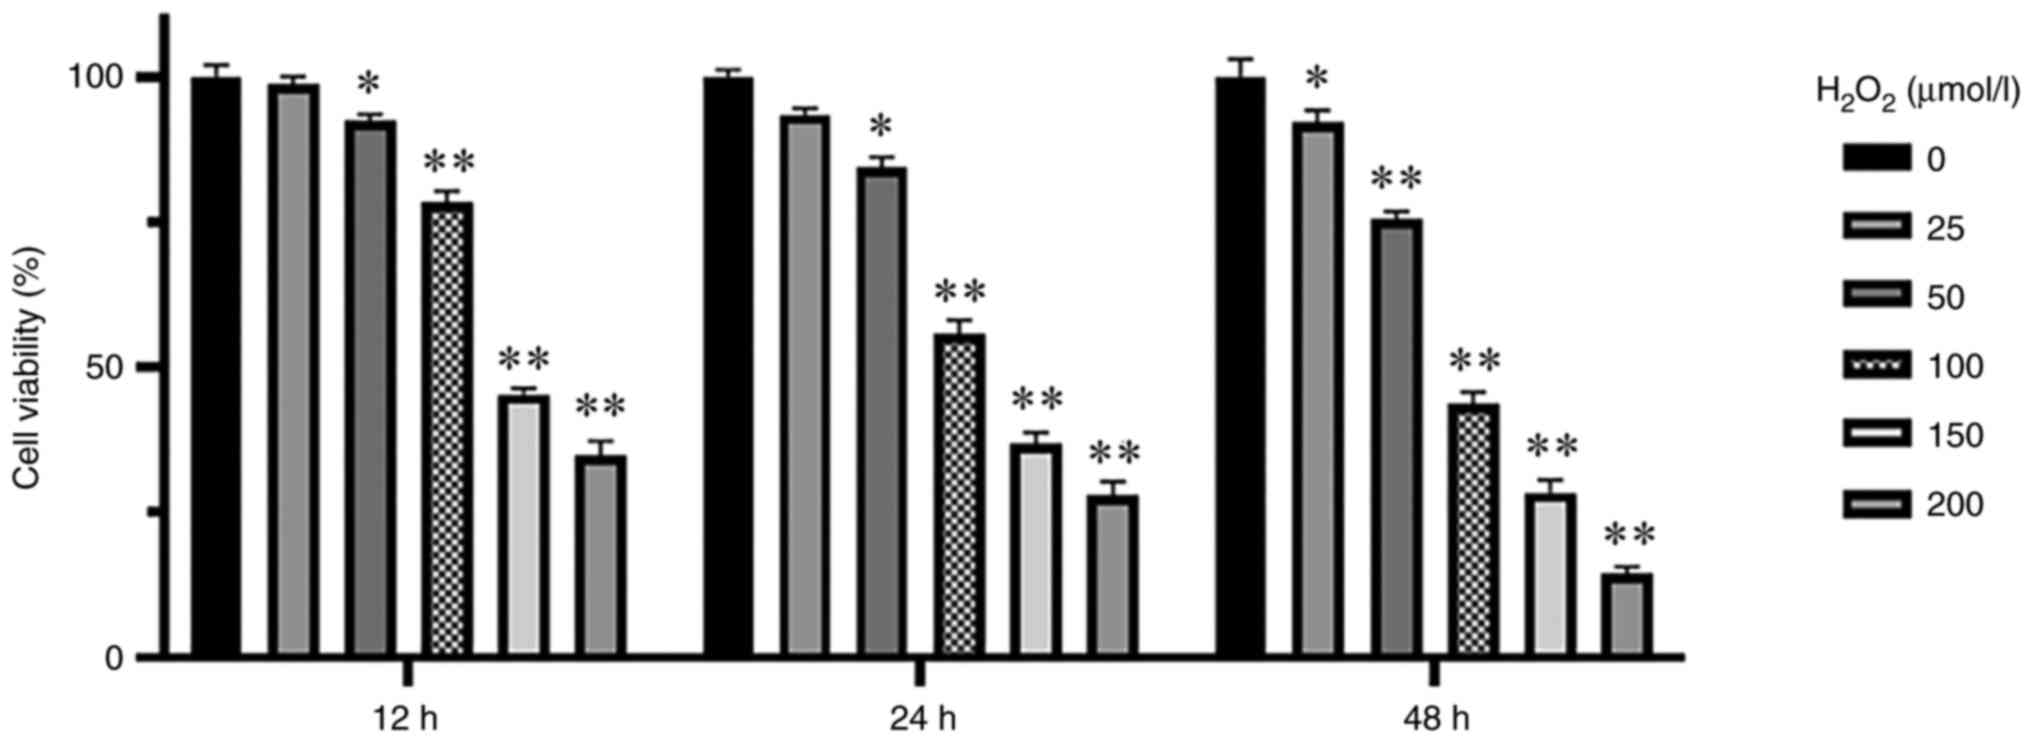
KGN cells were cultured at different
H2O2 concentrations (0, 25, 50, 100, 150 and
200 µmol/l) and cell viability was measured through CCK-8 assay at
different timepoints after treatment with
H2O2 (12, 24 and 48 h). Cell viability of
each group decreased as the H2O2
concentration increased compared with that in the control group,
reaching significance at H2O2 concentrations
of >50 µmol/l for 24 h (P<0.05; Fig. 1). Therefore, 100 µmol/l
H2O2 were used to treat KGN cells for 24 h to
induce OS in the KGN cells.
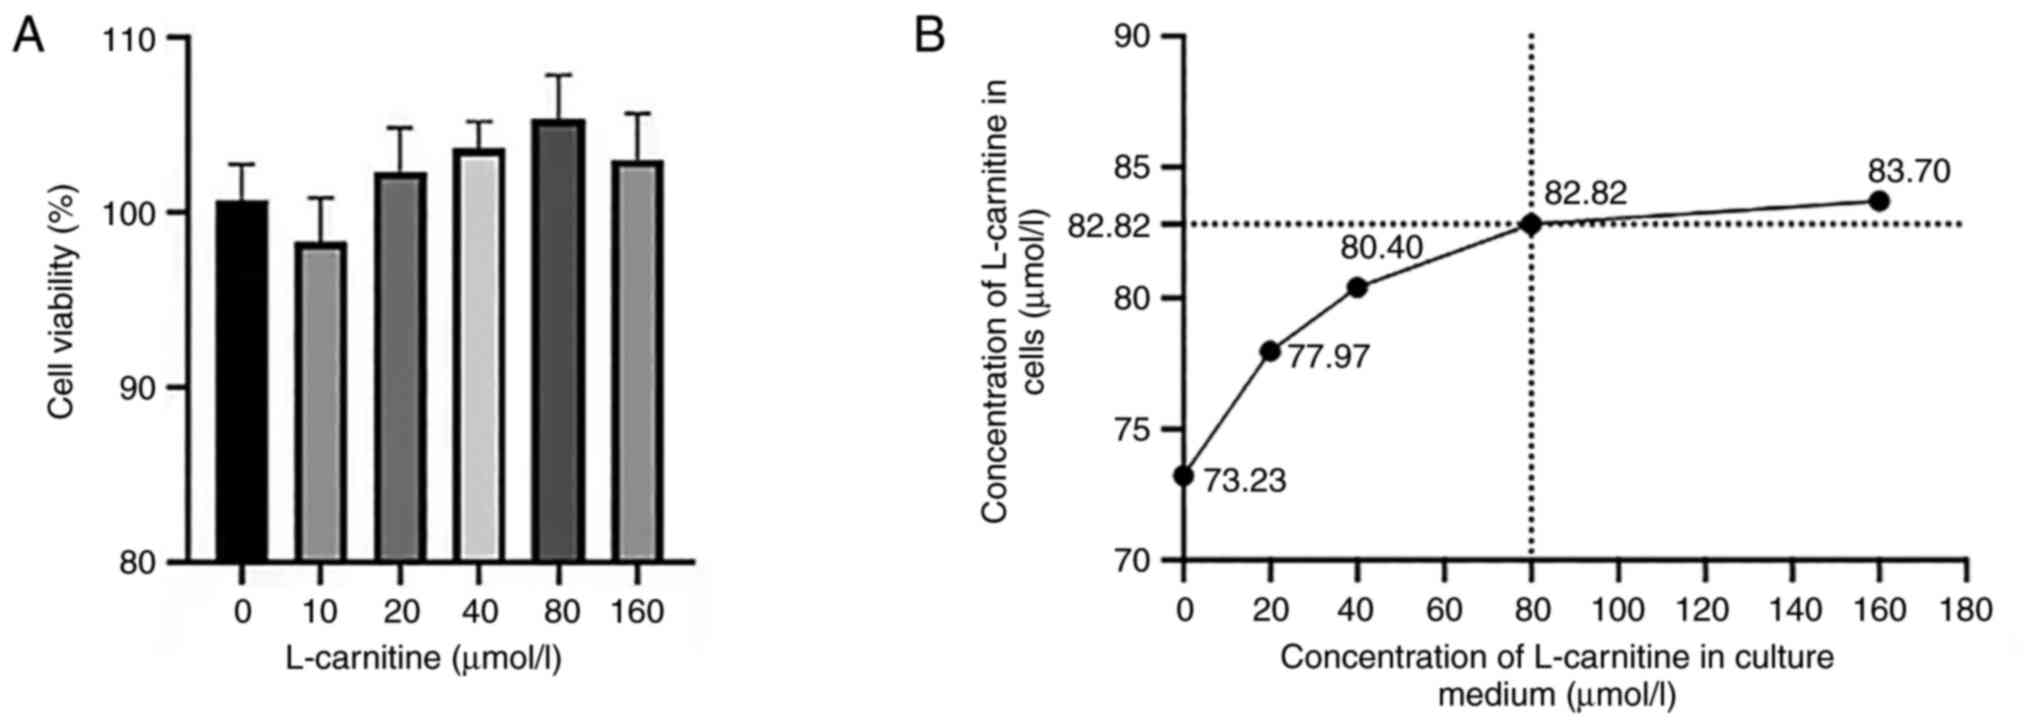
Determination of the optimal LC
concentration
LC exerted no significant effects on cell viability
(Fig. 2A). ELISA showed that
increasing the LC concentration from 80 to 160 µmol/l did not
result in a significant increase in the concentration of LC
internalized by the cells, whilst cell viability was decreased
slightly (Fig. 2B). Therefore, 80
µmol/l LC was chosen for further experiments, and 40 µmol/l was
used as a median control.
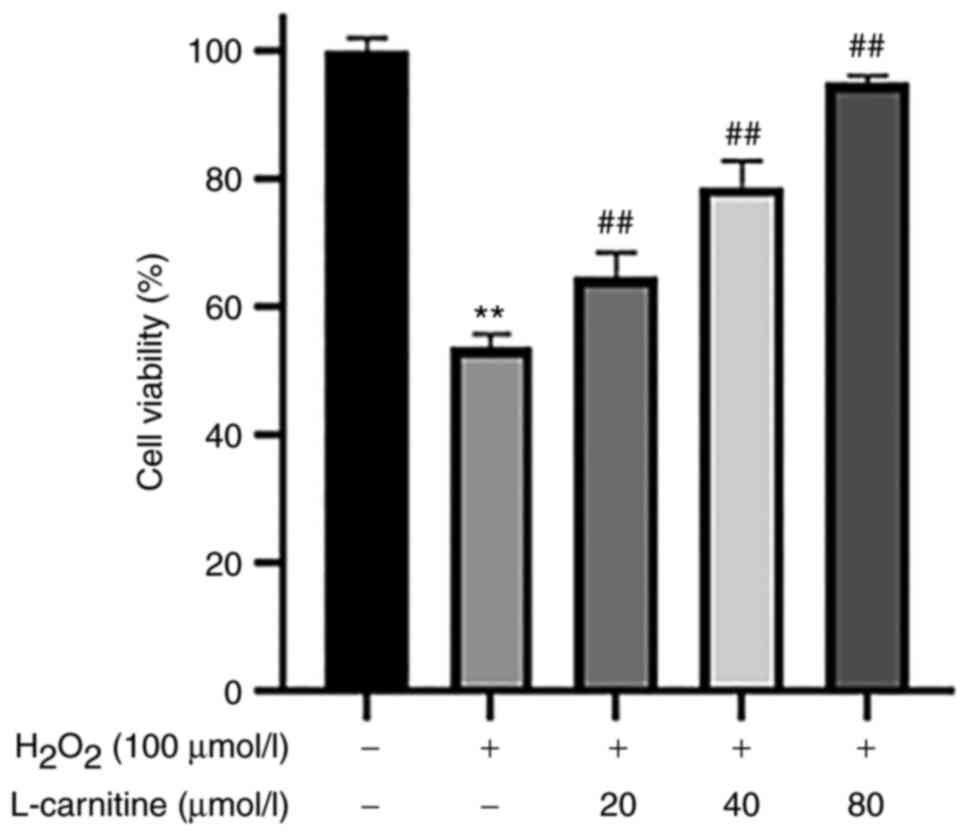
Effect of LC pretreatment on cell
viability in the presence of H2O2-induced
OS
Compared with that in the control group, the cell
viability in the H2O2-only group was
significantly decreased (P<0.01; Fig. 3). Compared with that in the
H2O2-only group, the cell viability of all LC
pre-treated groups were all significantly increased in a
dose-dependent manner (P<0.01; Fig. 3).
Ultrastructure of KGN cells
KGN cells in the control group showed intact
nucleolus, clear nuclear membrane and normal mitochondrial
morphology, whilst in the H2O2-only group and
the 40 and 80 µmol/l LC pretreatment groups, different degrees of
early and late apoptosis appeared in electron microscopy (Fig. 4). In the blank control group, the
cells showed a spindle-shaped extension state under the light
microscope and were well attached to the wall. Under the electron
microscope, it was observed that the cell structure was complete,
the nucleolus was complete, the nuclear membrane was clear, the
mitochondrial morphology and structure were normal, and the
mitochondrial crest was clearly visible. In the injury model group,
the density of KGN cells decreased, floating dead cells and cell
debris were visible under the light microscope, and aperture was
visible around some cells, and the ability of cells to adhere to
walls decreased. Under the electron microscope, the ultrastructural
damage of cells was obvious, the intracellular apoptotic bodies
increased, the nucleolus lobules increased, the nuclear membrane
was blurred and unstructured, the mitochondria showed obvious
swelling, and the mitochondrial crest fracture disappeared, showing
early or late apoptotic manifestations. These characteristics
include increased nucleolar lobulation, blurred nuclear membrane,
mitochondrial swelling, mitochondrial cristae rupture and increased
intracellular phagocytes.
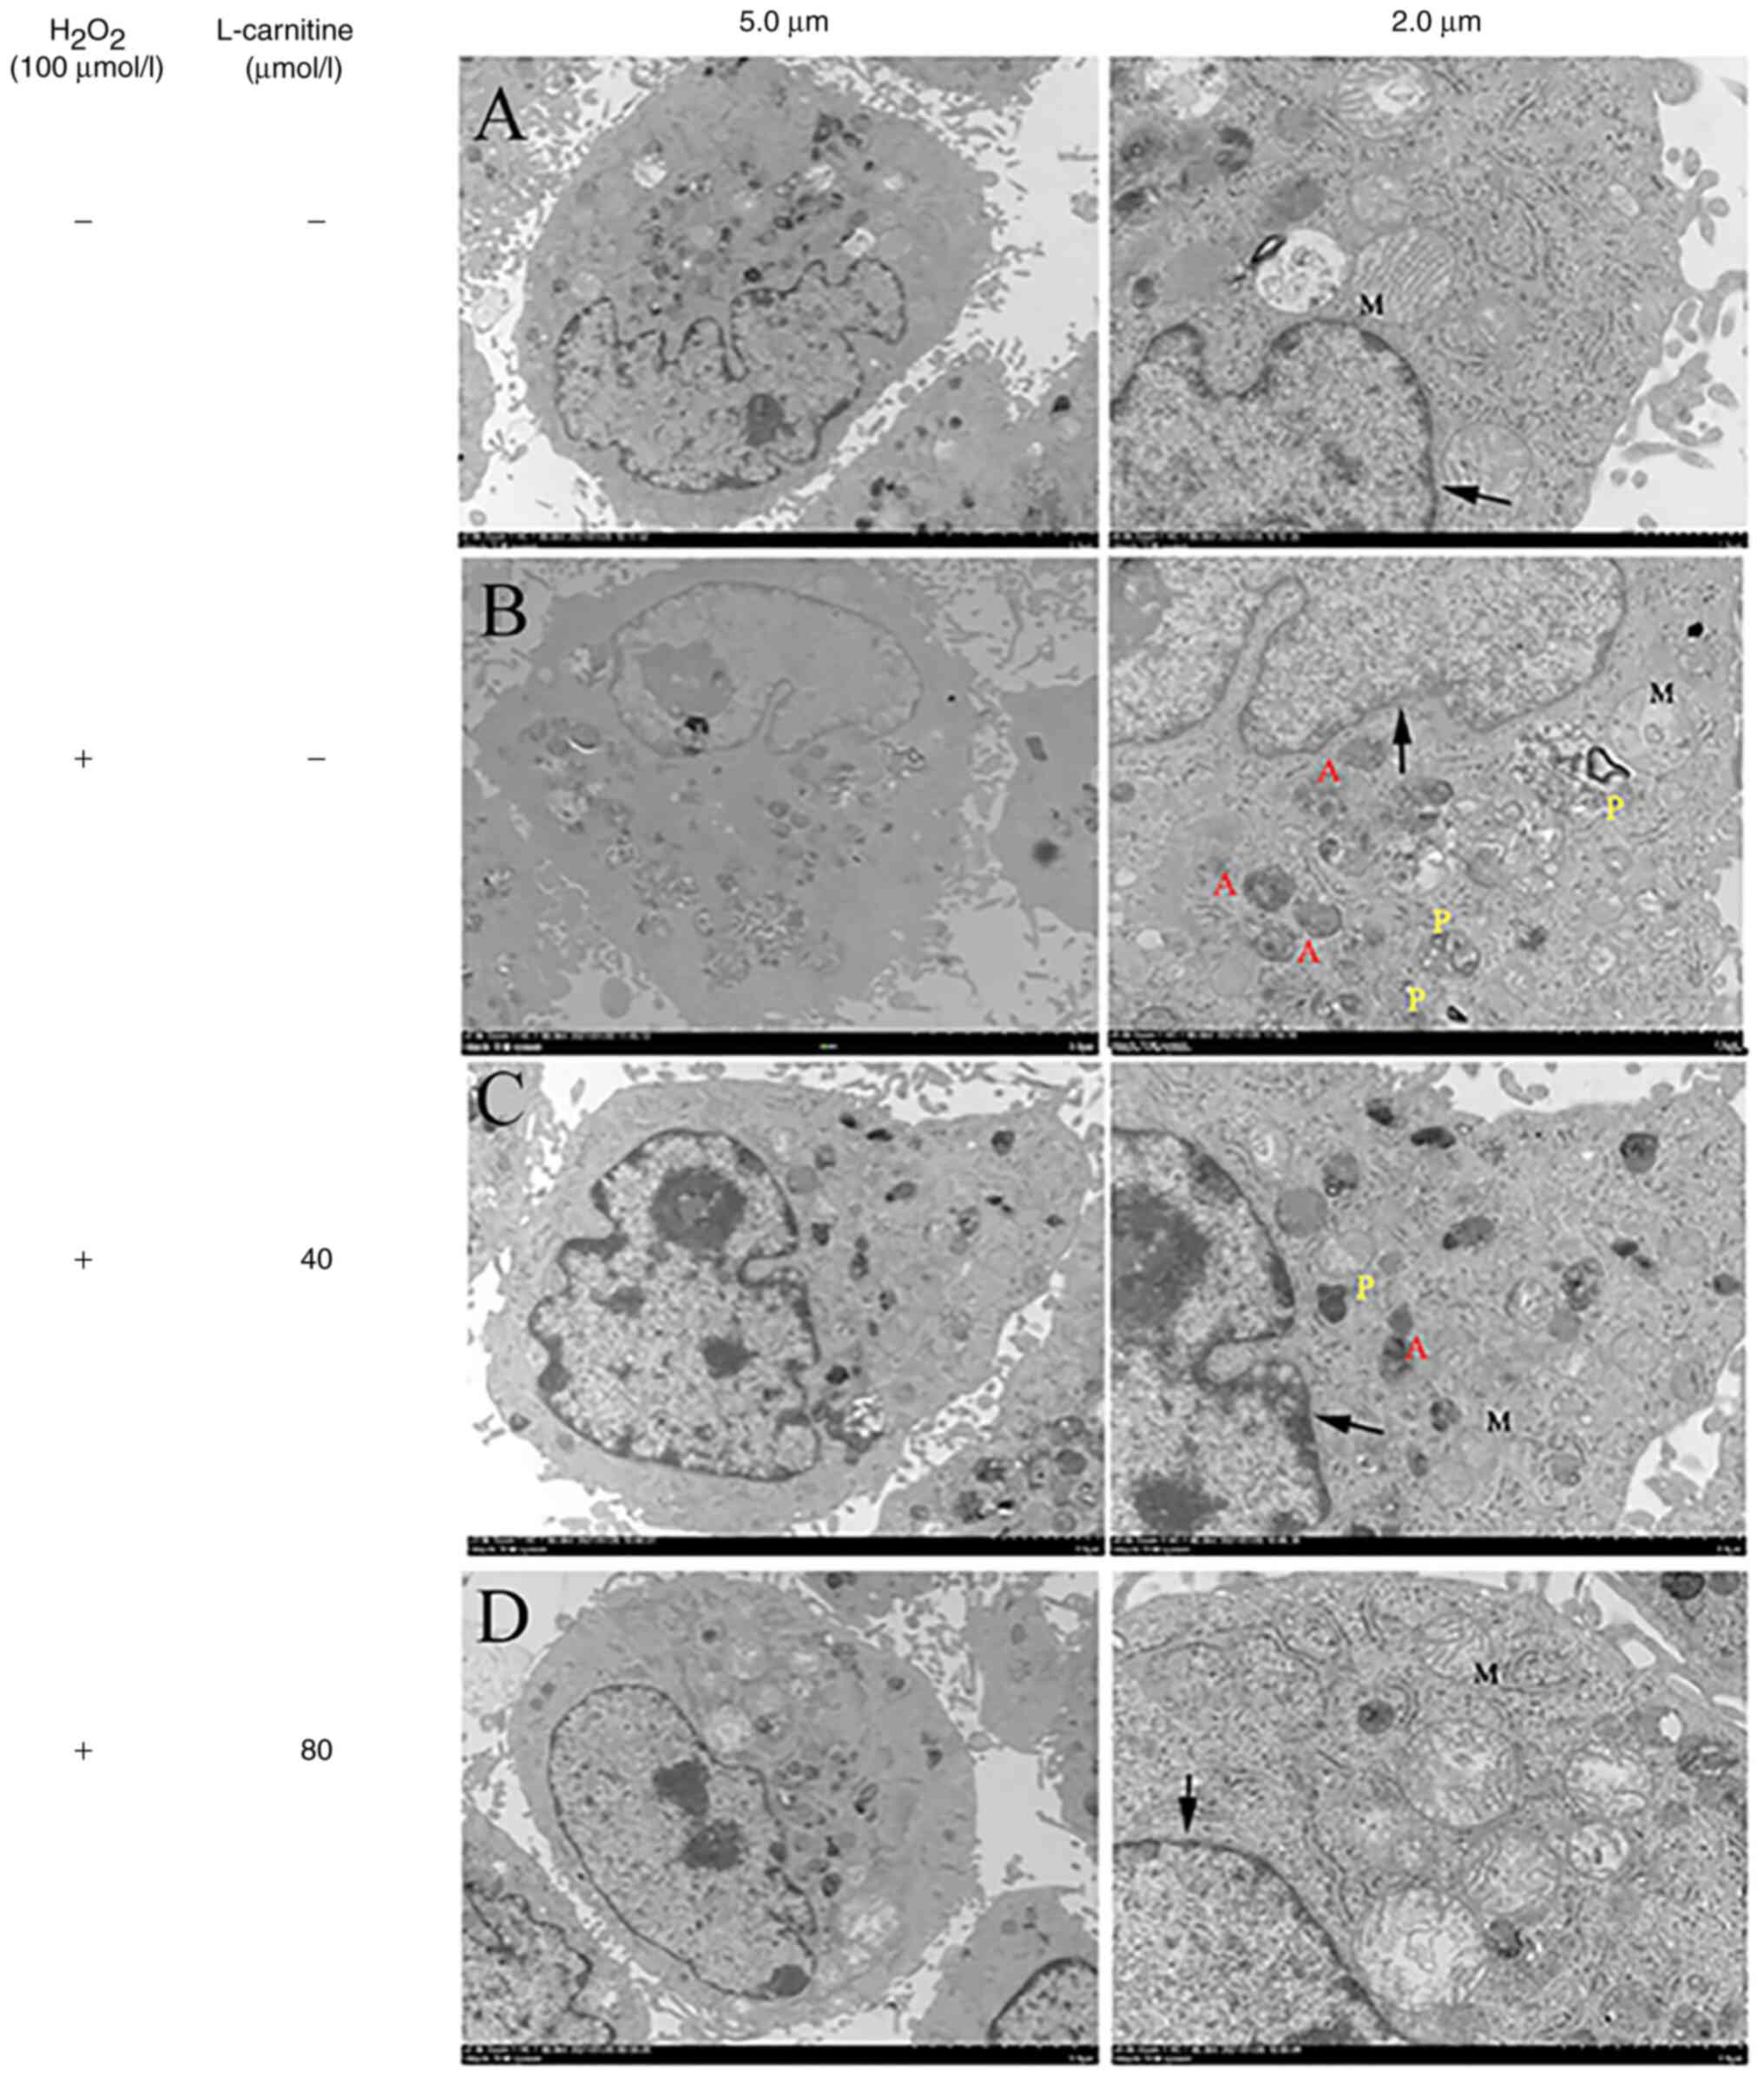 | Figure 4Ultrastructure of untreated KGN
cells, those treated with H2O2 and those
pre-treated with L-carnitine as analyzed using transmission
electron microscopy. The arrows indicate the nuclear membrane. (A)
In the control group, the nucleus is complete, the nuclear membrane
is clear, the mitochondrial structure is complete and the
mitochondrial ridge is clearly visible. (B) In the
H2O2-only group, the nucleolus is diffused,
the nuclear membrane is blurred, the nuclear membrane in some areas
disappeared. The majority of mitochondria do not present with the
complete structure and there is a large number of apoptotic and
phagocytic bodies in the cytoplasm. (C) In the low L-carnitine
group (40 µmol/l), the nucleus is heterogeneous, the nuclear
membrane in some areas is fuzzy, some mitochondria were visible,
the structure in the mitochondria is unclear and apoptotic.
Phagocytic bodies are visible in the cytoplasm. (D) In the high
L-carnitine group (80 µmol/l), the nucleus is complete, the nuclear
membrane is basically clear, the mitochondrial structure is
basically complete and a clear mitochondrial ridge can be seen.
Magnifications: Left, x2,000; right, x5,000. M, mitochondria; P,
phagosome; A, apoptotic body. |
OS biomarkers in KGN cells
After 100 µmol/l H2O2
induction, ROS and MDA levels in the
H2O2-only group were significantly increased
(P<0.01; Fig. 5A and
B), whilst GSH content and SOD
activity were significantly decreased compared with those in the
control group (P<0.01; Fig.
5C and D). This suggest that
100 µmol/l H2O2 effectively induced OS injury
in KGN cells. Compared with those in the
H2O2-only group, the ROS and MDA levels in
the 40 and 80 µmol/l LC pre-treatment groups were significantly
decreased (P<0.05; Fig. 5A and
B), whilst GSH content and SOD
activity were significantly increased (P<0.01; Fig. 5C and D). In particular, the 80 µmol/l LC
pre-treatment group exerted a greater effect compared with that by
40 µmol/l LC pre-treatment group.
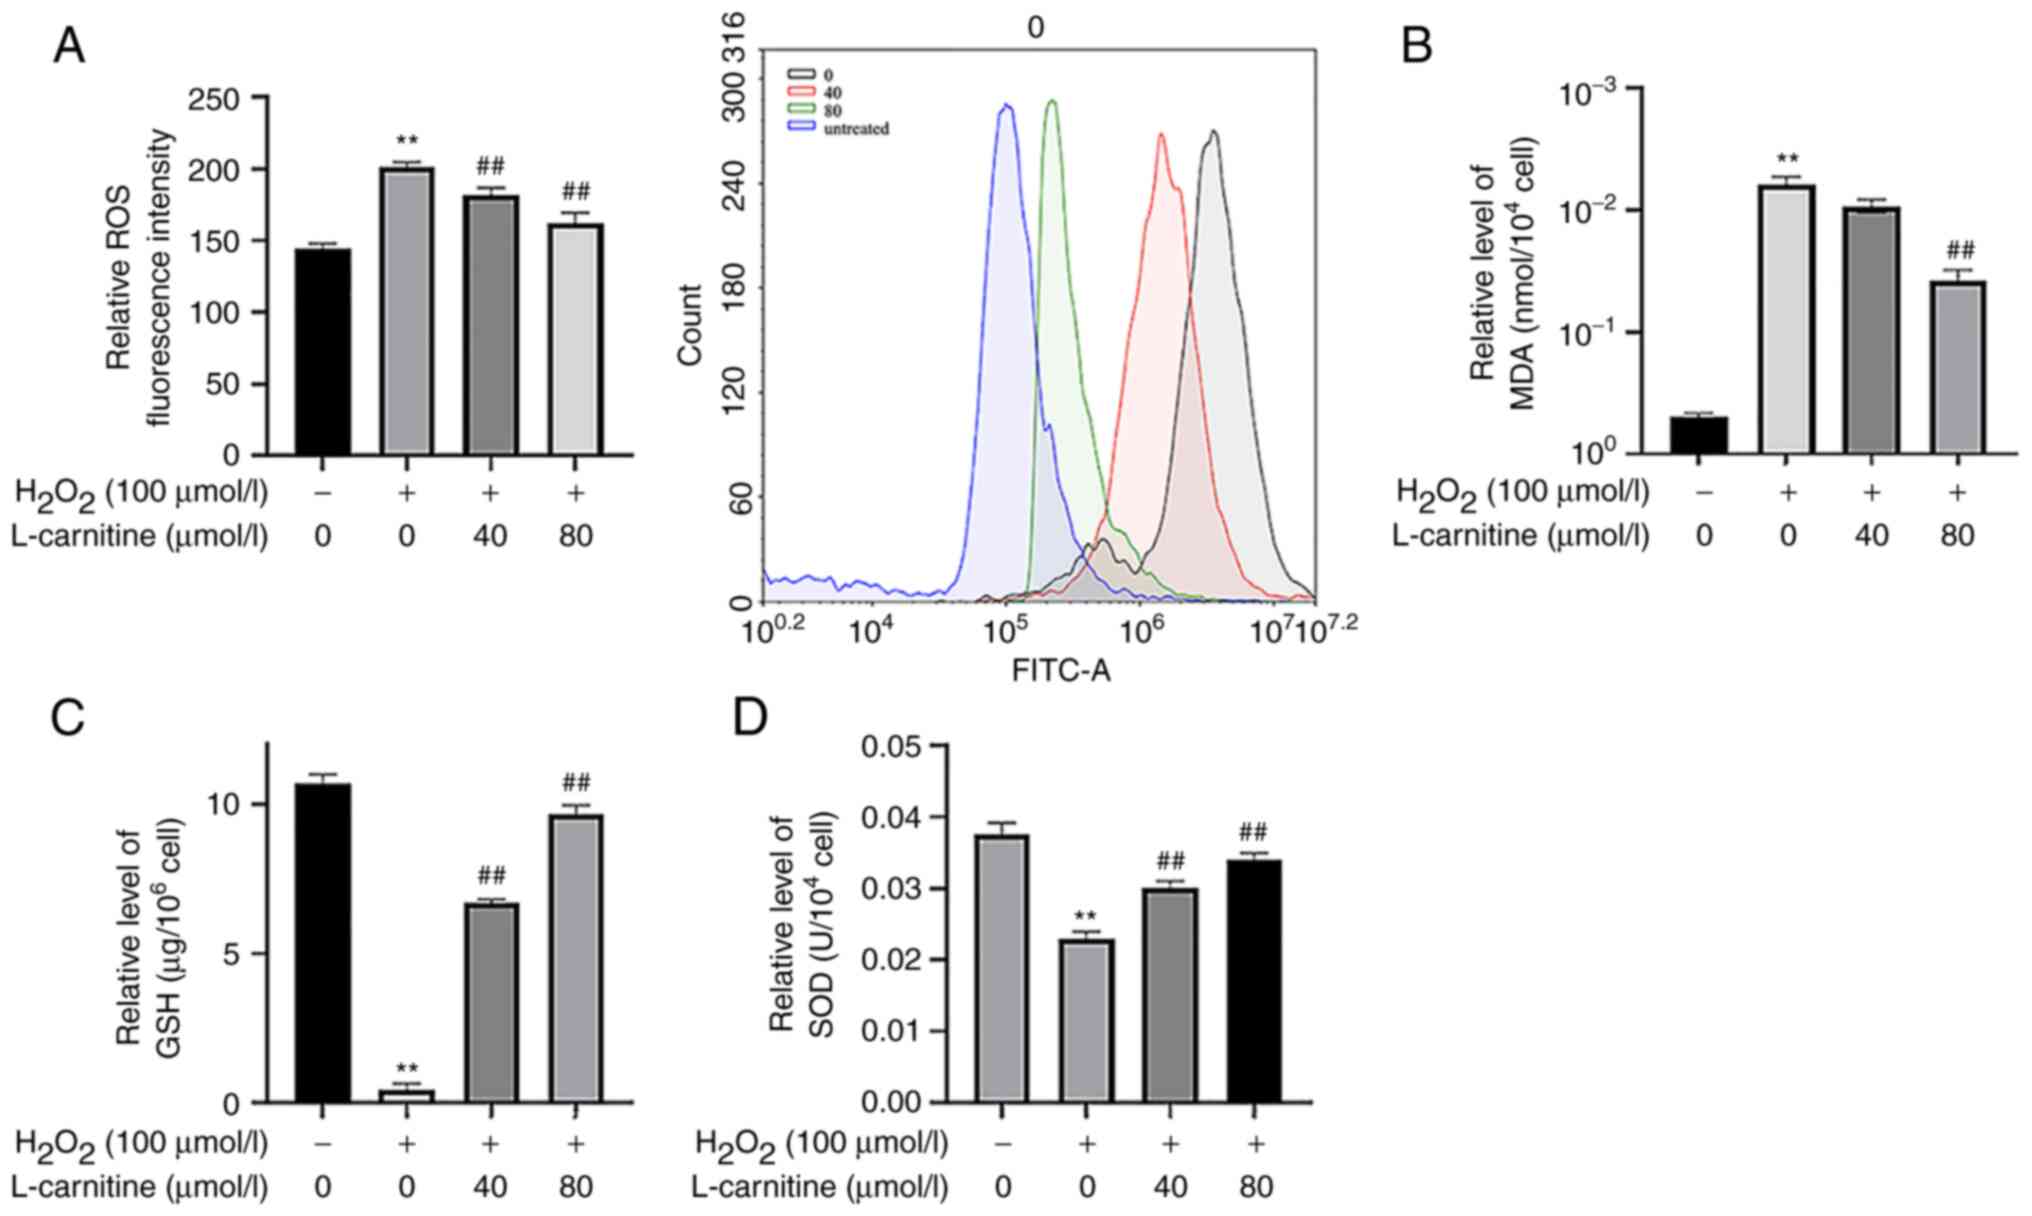 | Figure 5OS levels in KGN cells. (A) ROS
content quantification and corresponding flow cytometry histogram.
(B) MDA, (C) GSH and (D) SOD content. Compared with the control
group, the KNG cells challenged with H2O2
showed an increase in the content of ROS and MDA, whilst the
content of GSH and the activity of SOD were decreased. The OS
injury model group was successfully constructed. Compared with that
in the OS group, 40 and 80 µmol/l L-carnitine pre-treatment
ameliorated the effect of H2O2 in KGN cells.
**P<0.01 vs. untreated cells and
##P<0.01 vs. H2O2-only; (A, C
and D) Tukey's test; (B) Dunnett's T3 test. Data are presented as
the mean ± standard deviation (n=3). OS, oxidative stress; ROS,
reactive oxygen species; MDA, malondialdehyde; GSH, reduced
glutathione; SOD, superoxide dismutase. |
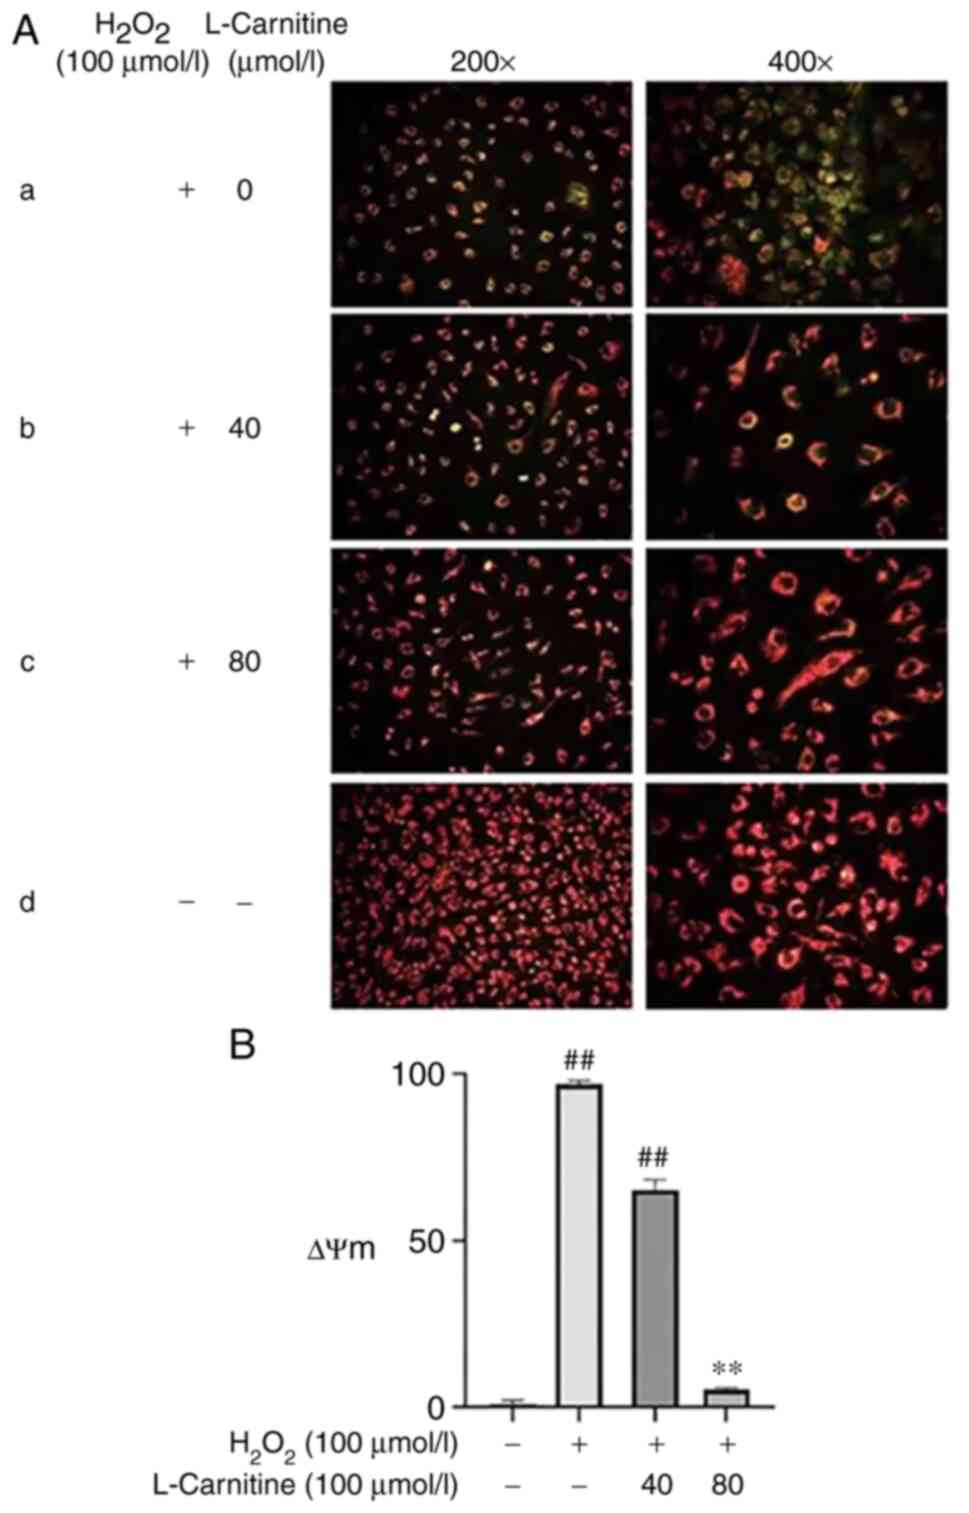
ΔΨm and cell apoptosis of KGN
cells
Compared with that in the control group, the ΔΨm in
the H2O2-only group decreased significantly
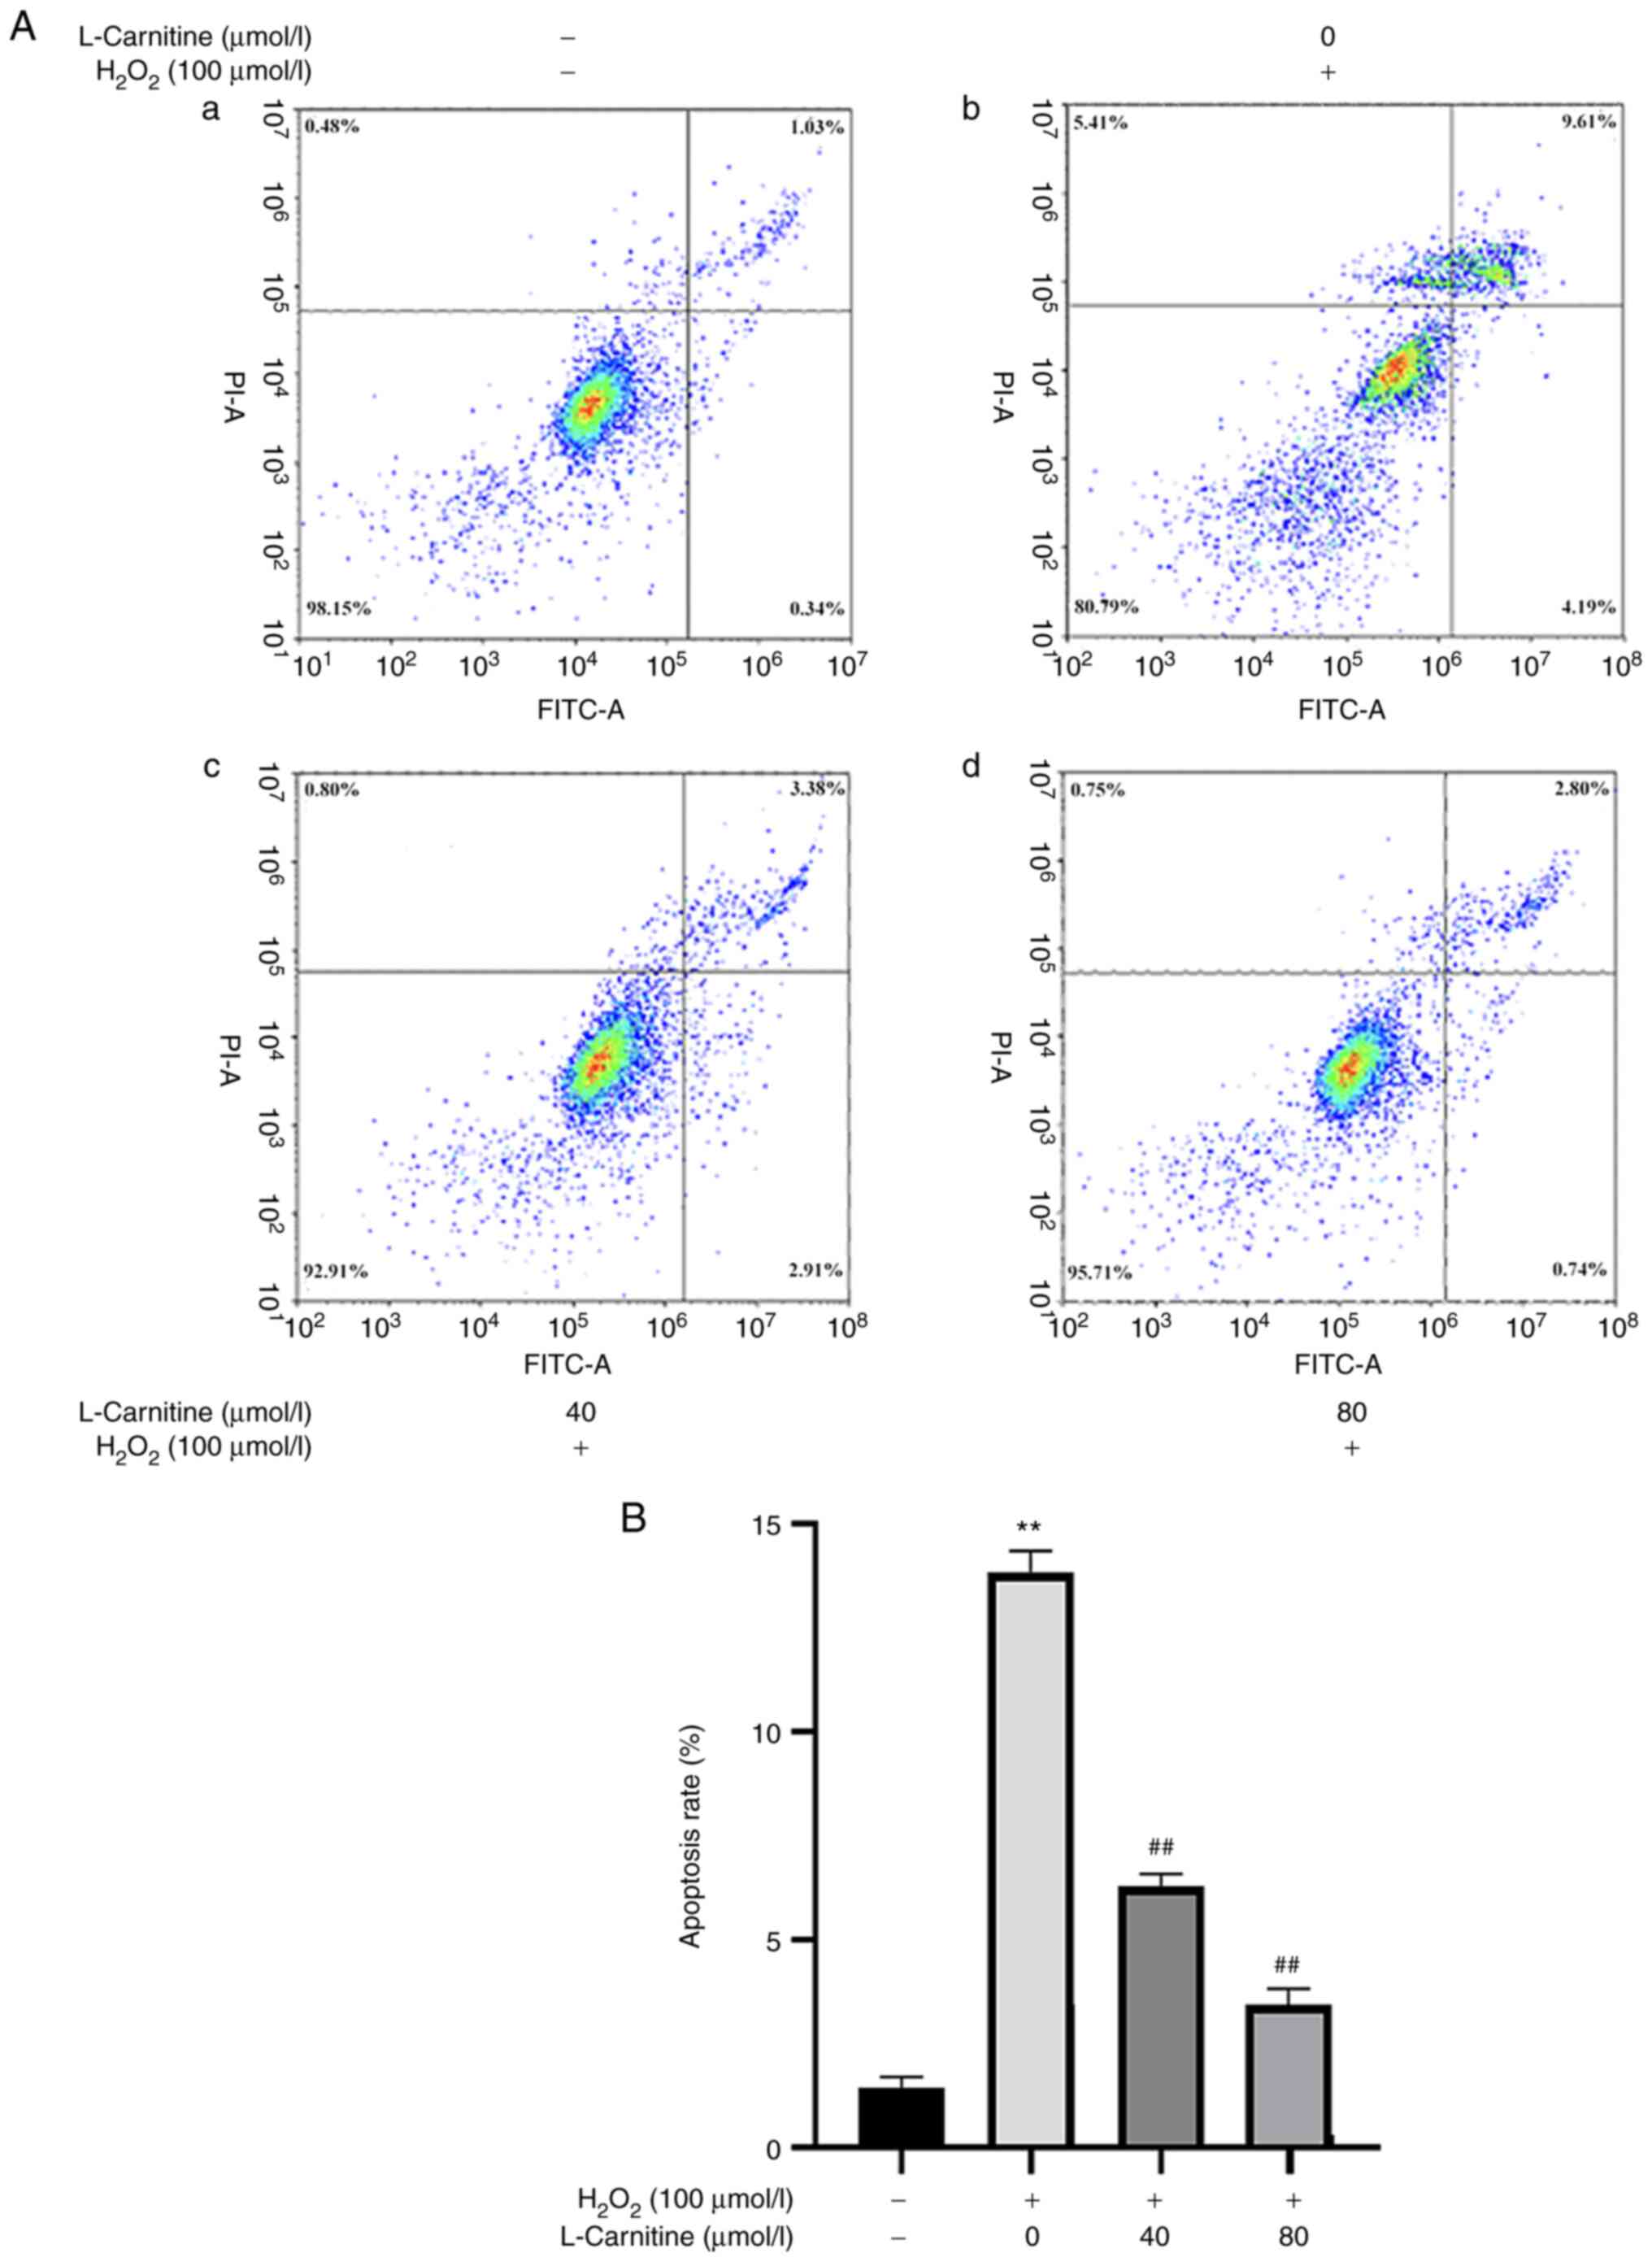
(P<0.01; Fig. 6A and B) whereas the cell apoptosis rate was
also significantly increased (P<0.01; Fig. 7A and B). Compared with those in the OS group,
40 and 80 µmol/l LC pre-treatment was able to significantly restore
normal ΔΨm (P<0.01; Fig. 6A and
B) and significantly reduce the
extent of cell apoptosis (P<0.01; Fig. 7A and B), with the effects mediated by 80 µmol/l
LC being more potent. These results suggest that LC pretreatment
can prevent the early apoptosis of KGN cells after OS injury and
reduce the apoptosis rate after injury.
Expression level of the FSHR protein
in KGN cells
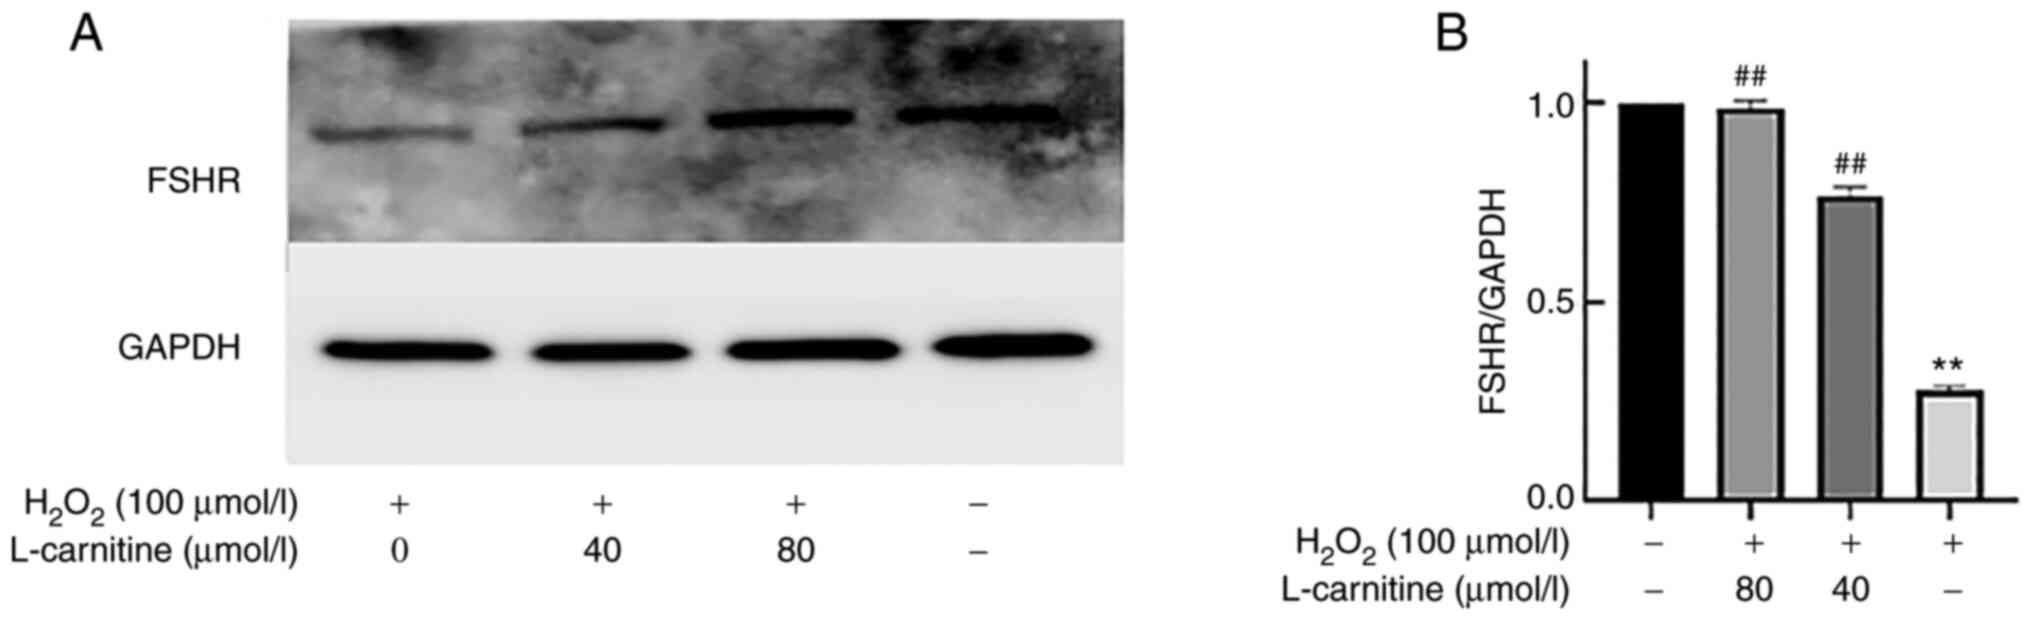
Compared with that in the control group, the
expression of FSHR in KGN cells was significantly decreased in the
H2O2-only group (P<0.01; Fig. 8A and B). Compared with that in the
H2O2-only group, 40 and 80 µmol/l LC
pre-treatments could significantly increase FSHR protein expression
(P<0.01; Fig. 8A and B).
Discussion
As one of the most important components of the
follicle, ovarian GCs are involved in the mechanism of signal
transduction and nutritional support to oocytes (18). The decrease in the number of GCs,
as well as damage to their function, may lead to the decline of
oocyte quality and eventually of ovarian function, which can cause
female infertility (16).
The oocytes show different sensitivity to OS at
different stages of follicle development (16). It is considered that once the
dominant follicle enters the first stage of meiosis, a certain
degree of OS is present to maintain high metabolic activity, whilst
the subsequent process after of the first meiosis requires low OS
to avoid cell damage (19).
Compared with somatic cells, GCs have constitutively high metabolic
levels during the entire process of follicular development, whilst
the oxidation and antioxidant systems in the follicular
microenvironment maintain a dynamic balance to meet the needs of
the oocytes (15,16). When this system is disrupted by
stress stimuli, OS and reduced local repair capability can change
macromolecules, such as estradiol, production and induce
mitochondrial mutations in the follicular microenvironment
(20). A large number of follicle
atresia causes an irreversible decline in ovarian function and
eventually leads to premature ovarian failure (19). Previous studies have also found
that the high level of ROS in the follicular fluid is associated
with poor follicular quality, dysontogenesis and failure of in
vitro fertilization-embryo transfer (IVF-ET) (19,21).
In addition, the increase of ROS in the follicular fluid was also
found in common female reproductive diseases, such as PCOS and EMT,
suggesting that ROS may be associated with the occurrence and
development of ovarian disorders (19). Therefore, it is important to
protect ovarian GCs from OS damage for preserving female
reproductive vitality.
LC is an amino acid analogue naturally occurring in
the human body (13). It can
promote lipid metabolism, protect plasma and mitochondrial membrane
from damage by lipid peroxidation (19). LC has been widely used as an
antioxidant (22), where it has
been found that the addition of LC in sperm culture can improve
sperm motility (22). In addition,
LC treatment in the oocyte culture can improve oocyte quality,
which may be associated with the reduction of GC apoptosis and
improvement of mitochondrial function (23). It has also been reported that the
administration of LC is beneficial to alleviate delayed embryonic
development, DNA fragmentation and abnormal blastocyst development
caused by long-term culture in elevated ROS conditions (24). Therefore, treatment with LC may
have the potential to improve the quality of follicles and the
pregnancy outcome following IVF-ET.
OS injury of GCs can lead to an imbalanced
follicular microenvironment, reduced function of GCs and ovarian
aging (24-26).
The present study demonstrated that LC can effectively alleviate
the generation of excess ROS induced by H2O2
by maintaining the redox balance. In addition, the level of MDA,
the end-product of lipid peroxidation, was found to be
significantly reduced in GCs after LC pre-treatment, suggesting
that LC may alleviate the cell damage caused by OS and the
mitochondrial oxidative respiratory chain. Analysis of SOD activity
and GSH content revealed that LC pre-treatment may improve the
antioxidant activity to reduce the consumption of antioxidants,
which may in turn maintain the dynamic balance of redox species in
the follicular microenvironment.
Damage of macromolecules, such as proteins and DNA,
caused by OS eventually leads to the apoptosis of GCs (1). The present study showed that LC
pre-treatment can effectively prevent the formation of apoptotic
bodies, mitochondrial swelling and vacuolation, and nuclear
membrane blurring induced by H2O2. The
protective effects of LC was demonstrated by the fluorescence
detection of ΔΨm and cell apoptosis analysis. The expression of
FSHR was higher in the cells with strong granulosa cell
proliferation activity (27,28).
A previous study has suggested that OS can increase FSH activity by
increasing the expression of P450 aromatase (9). Therefore, the present study aimed to
use FSHR as an indicator to evaluate the function of GCs. The
present results demonstrated that the expression level of FSHR in
the H2O2-only group is significantly
decreased compared with that in the control group. The expression
of FSHR on GCs in the presence of H2O2 was
significantly increased after pre-treatment with LC, further
demonstrating the protective effect of LC. However, some
limitations remain in the present study. The effect of LC on GCs
has been investigated only in vitro since the number of
granulosa cells collected could not meet the requirements of the
experiment. In the future, it is important to build a rat model to
confirm the effects of LC in vivo.
In conclusion, the present study suggest that LC
treatment has the potential to reduce OS injury in GCs induced by
H2O2 and decrease GC apoptosis. Therefore, LC
may exert a protective effect on GCs, which could ensure improved
nutritional support to oocytes and improve the quality of
follicles.
Acknowledgements
Not applicable.
Funding
Funding: This work was supported by funding from Weifang
Municipal Health Commission [grant number (wfwsjk_2019_029)].
Availability of data and materials
All data generated and/or analyzed during this
study are included in this published article.
Authors' contributions
XL, XW and TM were responsible for designing the
study, and analyzing and interpreting the data. XL performed the
study in the laboratory in accordance with the methodology. XL and
HM were responsible for the acquisition, analysis and
interpretation of the data. HM and XL confirm the authenticity of
all the raw data. XW, TM, YZ, PS and DQ provided scientific and
technical assistance to the experiments, and critically revised the
article for important intellectual content. XL collected samples
and was responsible for the execution of the project. XL was
responsible for the cellular and molecular experiments. All authors
read and approved the final manuscript.
Ethics approval and consent to
participate
Not applicable.
Patient consent for publication
Not applicable.
Competing interests
The authors declare that they have no competing
interests.
References
|
1
|
Zhang J, Xu Y, Liu H and Pan Z: MicroRNAs
in ovarian follicular atresia and granulosa cell apoptosis. Reprod
Biol Endocrinol. 17(9)2019.PubMed/NCBI View Article : Google Scholar
|
|
2
|
Zhang H, Luo Q, Lu X, Yin N, Zhou D, Zhang
L, Zhao W, Wang D, Du P, Hou Y, et al: Effects of hPMSCs on
granulosa cell apoptosis and AMH expression and their role in the
restoration of ovary function in premature ovarian failure mice.
Stem Cell Res Ther. 9(20)2018.PubMed/NCBI View Article : Google Scholar
|
|
3
|
Matsuda F, Inoue N, Manabe N and Ohkura S:
Follicular growth and atresia in mammalian ovaries: Regulation by
survival and death of granulosa cells. J Reprod Dev. 58:44–50.
2012.PubMed/NCBI View Article : Google Scholar
|
|
4
|
Terao H, Wada-Hiraike O, Nagumo A,
Kunitomi C, Azhary JMK, Harada M, Hirata T, Hirota Y, Koga K, Fujii
T and Osuga Y: Role of oxidative stress in follicular fluid on
embryos of patients undergoing assisted reproductive technology
treatment. J Obstet Gynaecol Res. 45:1884–1891. 2019.PubMed/NCBI View Article : Google Scholar
|
|
5
|
Elmorsy E, Al-Ghafari A, Aggour AM, Khan R
and Amer S: The role of oxidative stress in antipsychotics induced
ovarian toxicity. Toxicol In Vitro. 44:190–195. 2017.PubMed/NCBI View Article : Google Scholar
|
|
6
|
Lu J, Wang Z, Cao J, Chen Y and Dong Y: A
novel and compact review on the role of oxidative stress in female
reproduction. Reprod Biol Endocrinol. 16(80)2018.PubMed/NCBI View Article : Google Scholar
|
|
7
|
González F, Considine RV, Abdelhadi OA and
Acton AJ: Oxidative stress in response to saturated fat ingestion
is linked to insulin resistance and hyperandrogenism in polycystic
ovary syndrome. J Clin Endocrinol Metab. 104:5360–5371.
2019.PubMed/NCBI View Article : Google Scholar
|
|
8
|
Scutiero G, Iannone P, Bernardi G,
Bonaccorsi G, Spadaro S, Volta CA, Greco P and Nappi L: Oxidative
stress and endometriosis: A systematic review of the literature.
Oxid Med Cell Longev. 2017(7265238)2017.PubMed/NCBI View Article : Google Scholar
|
|
9
|
Palumbo A, Rotoli D, Gonzalez-Fernandez R,
Hernandez J and Avila J: Glucose-induced oxidative stress is
associated with increased ALDH3A2 expression and altered response
to FSH in cultured human granulosa-lutein cells (Gl cells) from
young oocyte donors. Fertil Steril. 100 (Suppl 1)(S427)2013.
|
|
10
|
González-Fernández R, Peña O, Hernández J,
Martín-Vasallo P, Palumbo A and Avila J: FSH receptor, KL1/2, P450,
and PAPP genes in granulosa-lutein cells from in vitro
fertilization patients show a different expression pattern
depending on the infertility diagnosis. Fertil Steril. 94:99–104.
2010.PubMed/NCBI View Article : Google Scholar
|
|
11
|
Talenezhad N, Mohammadi M,
Ramezani-Jolfaie N, Mozaffari-Khosravi H and Salehi-Abargouei A:
Effects of l-carnitine supplementation on weight loss and body
composition: A systematic review and meta-analysis of 37 randomized
controlled clinical trials with dose-response analysis. Clin Nutr
ESPEN. 37:9–23. 2020.PubMed/NCBI View Article : Google Scholar
|
|
12
|
Carrillo-González DF, Hernández-Herrera DY
and Maldonado-Estrada JG: The role of L-carnitine in bovine embryo
metabolism. A review of the effect of supplementation with a
metabolic modulator on in vitro embryo production. Anim Biotechnol:
June 21, 2021 (Epub ahead of print).
|
|
13
|
Agarwal A, Sengupta P and Durairajanayagam
D: Role of L-carnitine in female infertility. Reprod Biol
Endocrinol. 16(5)2018.PubMed/NCBI View Article : Google Scholar
|
|
14
|
Li J, Liu L, Weng J, Yin TL, Yang J and
Feng HL: Biological roles of l-carnitine in oocyte and early embryo
development. Mol Reprod Dev. 88:673–685. 2021.PubMed/NCBI View Article : Google Scholar
|
|
15
|
Nishi Y, Yanase T, Mu Y, Oba K, Ichino I,
Saito M, Nomura M, Mukasa C, Okabe T, Goto K, et al: Establishment
and characterization of a steroidogenic human granulosa-like tumor
cell line, KGN, that expresses functional follicle-stimulating
hormone receptor. Endocrinology. 142:437–445. 2001.PubMed/NCBI View Article : Google Scholar
|
|
16
|
Tiwari M and Chaube SK: Moderate increase
of reactive oxygen species triggers meiotic resumption in rat
follicular oocytes. J Obstet Gynaecol Res. 42:536–546.
2016.PubMed/NCBI View Article : Google Scholar
|
|
17
|
Ma B, Liu Y, Zhang X, Zhang R, Zhang Z,
Zhang Z, Liu J, Juan Z, Sun X, Sun L, et al: TSPO ligands protect
against neuronal damage mediated by LPS-induced BV-2 microglia
activation. Oxid Med Cell Longev. 2022(5896699)2022.PubMed/NCBI View Article : Google Scholar
|
|
18
|
Silva EG, Kim G, Bakkar R, Bozdag Z,
Shaye-Brown A, Loghavi S, Stolnicu S, Hadareanu V, Bulgaru D, Cayax
LI, et al: Histology of the normal ovary in premenopausal patients.
Ann Diagn Pathol. 46(151475)2020.PubMed/NCBI View Article : Google Scholar
|
|
19
|
Agarwal A, Aponte-Mellado A, Premkumar BJ,
Shaman A and Gupta S: The effects of oxidative stress on female
reproduction: A review. Reprod Biol Endocrinol.
10(49)2012.PubMed/NCBI View Article : Google Scholar
|
|
20
|
Prasad S, Tiwari M, Pandey AN, Shrivastav
TG and Chaube SK: Impact of stress on oocyte quality and
reproductive outcome. J Biomed Sci. 23(36)2016.PubMed/NCBI View Article : Google Scholar
|
|
21
|
Lee TH, Lee MS, Liu CH, Tsao HM, Huang CC
and Yang YS: The association between microenvironmental reactive
oxygen species and embryo development in assisted reproduction
technology cycles. Reprod Sci. 19:725–732. 2012.PubMed/NCBI View Article : Google Scholar
|
|
22
|
Fu LL, Zhang LY, An Q, Zhou F, Tong Y, Guo
Y, Lu WH, Liang XW, Chang B and Gu YQ: L-carnitine protects the
motion parameters and mitochondrial function of human sperm in
cryopreservation. Zhonghua Nan Ke Xue. 24:1059–1063.
2018.PubMed/NCBI(In Chinese).
|
|
23
|
Dunning KR, Russell DL and Robker RL:
Lipids and oocyte developmental competence: The role of fatty acids
and β-oxidation. Reproduction. 148:R15–R27. 2014.PubMed/NCBI View Article : Google Scholar
|
|
24
|
Kucukaydın Z, Duran C, Basaran M, Camlica
F, Erdem SS, Basaran A, Kutlu O, Burnik FS, Elmas H and Gonen MS:
Plasma total oxidant and antioxidant status after oral glucose
tolerance and mixed meal tests in patients with polycystic ovary
syndrome. J Endocrinol Invest. 39:1139–1148. 2016.PubMed/NCBI View Article : Google Scholar
|
|
25
|
Yang L, Chen Y, Liu Y, Xing Y, Miao C,
Zhao Y, Chang X and Zhang Q: The role of oxidative stress and
natural antioxidants in ovarian aging. Front Pharmacol.
11(617843)2021.PubMed/NCBI View Article : Google Scholar
|
|
26
|
Peters AE, Mihalas BP, Bromfield EG, Roman
SD, Nixon B and Sutherland JM: Autophagy in female fertility: A
role in oxidative stress and aging. Antioxid Redox Signal.
32:550–568. 2020.PubMed/NCBI View Article : Google Scholar
|
|
27
|
Yding Andersen C: Inhibin-B secretion and
FSH isoform distribution may play an integral part of follicular
selection in the natural menstrual cycle. Mol Hum Reprod. 23:16–24.
2017.PubMed/NCBI View Article : Google Scholar
|
|
28
|
Knapczyk-Stwora K, Grzesiak M, Witek P,
Duda M, Koziorowski M and Slomczynska M: Neonatal exposure to
agonists and antagonists of sex steroid receptors affects AMH and
FSH plasma level and their receptors expression in the adult pig
ovary. Animals (Basel). 10(12)2019.PubMed/NCBI View Article : Google Scholar
|