Introduction
Temporomandibular joint disorder (TMD) is a common
disease, which affects up to 15% of adults (1). Degeneration of the temporomandibular
joint (TMJ) disc is the most common concomitant symptom of
temporomandibular disorders (TMDs) (2), which compromises the therapeutic
efficacy of TMD treatment (3). At
present, the most commonly used methods to treat TMD in the clinic
include occlusal splint therapy, drugs, intra-articular injection,
discectomy and joint replacement. However, the efficacy of various
treatment methods cannot be guaranteed. Because these traditional
treatment methods cannot reverse the dysfunctional TMJ tissue, TMD
cannot be fully cured and the patients' pain may not be completely
relieved (4). The causative
factors in disc degeneration are unclear (5), although studies have suggested that
aging (6), inflammation (7) and biomechanical factors (8) are implicated. One hypothesis is that
insufficient nutrient supply and energy metabolism disorders in TMJ
discs may lead to disc degeneration, although evidence for this is
lacking (9-11).
Glucose and oxygen are necessary to maintain
cellular nutrition and metabolic homeostasis (12,13),
both of which are vital for articular disc development and
extracellular matrix synthesis (14). Glucose and oxygen levels are
typically lower in non-vascular connective tissues, such as
articular cartilage and discs, than in blood and tissue fluids
(15). Intervertebral disc cells
and chondrocytes are typically classified as high glycolytic cells
(16,17). By contrast, TMJ disc cells have a
higher cell density and higher oxygen consumption than
intervertebral discs and articular cartilage (18), and are more susceptible to disease
caused by impaired nutrient supply (19,20).
Our prior study of the effects of different oxygen partial
pressures on the growth and proliferation of sheep TMJ disc cells
found that hypoxic conditions (2% O2) favored cell
survival (21,22). However, it is unlikely that the TMJ
discs are affected solely by hypoxia or glucose alone (23). Given the steep nutrient gradient in
the TMJ disc, we designed experimental groups with glucose at
concentrations of 0, 0.5, 3 and 5.5 mmol/l and a control group with
high sugar medium (25 mmol/l). Oxygen partial pressure was designed
to be at normal (21% O2) and hypoxic (2% O2)
levels. This allowed the investigation of cell proliferation,
synthesis and energy metabolism. The respiratory metabolism
pathways in TMJ disc cells and the effects of oxygen and glucose
concentrations were elucidated to study the pathogenesis of TMJ
disc degeneration.
Materials and methods
Experimental groups
A total of 10 experimental groups were constructed.
Five were normoxic (21% O2), with glucose concentrations
of 0 (NG1), 0.5 (NG2), 3 (NG3), 5.5 (NG4) and 22.5 mmol/l [negative
control (NC)]. The remaining groups were hypoxic (2% O2)
and exposed to the same glucose concentrations: 0 (HG1), 0.5 (HG2),
3 (HG3), 5.5 (HG4) and 22.5 mmol/l [hypoxic control (HC)].
Cell isolation and culture
TMJ disc cells were isolated and extracted from 12
discs of six fresh heads of 3-6-month-old healthy sheep, which were
purchased from slaughterhouses, as described previously (22). Sheep heads were cleaned and soaked
in 75% alcohol for 30 min. Bilateral temporomandibular discs were
removed in whole pieces under aseptic conditions, and the ligaments
around the disc and the attached muscles were removed. The cells
were digested with 0.2% collagenase type I (cat. no. SCR103;
Sigma-Aldrich) for ~15 h at 37˚C in a water bath shaker at 80 x g
and collected by centrifugation. Primary cells were cultured in
DMEM (cat. no. 10313-021; Gibco; Thermo Fisher Scientific, Inc.),
10% FBS [cat. no. 04-001-1A; Biological Industries (BI)] and 1%
penicillin-streptomycin solution (cat. no. 03-031-1B; BI). The
cells were incubated at 37˚C in a 5% CO2 incubator. All
animal procedures were approved by The Animal Ethics Committee of
the School of Stomatology, Northwest Minzu University (Lanzhou,
China) and complied with its requirements (approval no. XBMZ
YX-2021004).
Cell proliferation
Third generation (p3) sheep TMJ disc cells were
seeded in 96-well plates at a density of 6,000 cells/well and
tested after 1, 2, 3, 6 and 9 days of incubation at 37˚C under
different glucose and oxygen conditions. The Cell Counting Kit-8
(CCK-8) assay (cat. no. CA1210-100T; Beijing Solarbio Science &
Technology) was performed by uniformly replacing the complete
culture media with 200 µl fresh media containing 10 µl CCK-8
solution, gently shaking the plate to mix the liquid, and
incubating for 4 h. The absorbance was measured at 450 nm using a
microplate reader. The results reflected cell proliferation.
Reverse transcription-quantitative PCR
(RT-qPCR)
RNA was extracted from p3 sheep TMJ disc cells
cultured in 6-well plates at a density of 1x10⁵
cells/well for 9 days under the above-mentioned different
nutritional conditions. RNA extraction was performed using a
Quick-RNA Viral Kit (cat. no. D3015; Zymo Research Corp). Then, RNA
was reverse transcribed using a HiScript II 1st Strand cDNA
Synthesis Kit (cat. no. R211-01; Vazyme Biotech Co., Ltd.). The
reaction was conducted at 50˚C for 15 min and 85˚C for 5 sec to
obtain cDNA products, and the mixture was then stored at 4˚C. The
qPCR system was configured according to the instructions of the
ChamQ SYBR qPCR Master Mix (High ROX Premixed; cat. no. Q341-02;
Vazyme Biotech Co., Ltd.). The standard procedure for the PCR
amplification was as follows: Pre-denaturation at 95˚C for 10 min,
for 1 cycle; thermal cycling at 95˚C for 15 sec, 60˚C for 15 sec,
and 72˚C for 30 sec, for 40 cycles. The primer sequences used are
provided in Table I. GAPDH was
selected as the internal reference gene. The F=2-ΔΔCq
method was used to quantify data and calculate the relative
expression level of the target gene (24). The expression of the NC group was
set to F=1 and all other experimental groups were compared with
it.
 | Table IPrimers used in reverse
transcription-quantitative PCR. |
Table I
Primers used in reverse
transcription-quantitative PCR.
| Gene | Primer sequences
(5'-3') | bp |
|---|
| GAPDH | F:
CAAGTTCCACGGCACAGTCA | 20 |
| | R:
GGTTCACGCCCATCACAAA | 19 |
| Col-I | F:
CCTGCGTACAGAACGGCCT | 19 |
| | R:
ACAGCACGTTGCCGTTGTC | 19 |
| Col-II | F:
AGCAGCAAGAGCAAGGACAAG | 21 |
| | R:
TTCTTGCAGTGGTAGGTGATGTT | 23 |
| Aggrecan | F:
GTCCACCATTCGGCATAACC | 20 |
| | R:
TGGGGTCACTTCAACCAAACT | 21 |
| GLUT1 | F:
CTGGTTCTGTTCTTCATCTTCACCT | 25 |
| | R:
TTGTCACTTTGGCTTGCTCCT | 21 |
| AMPKα1 | F:
GACTGCTACTCCACAGAGATCG | 22 |
| | R:
TCAGCATCTGAATCACTCCTTT | 22 |
Flow cytometric analysis
The p3 sheep TMJ disc cells were cultured in 6-well
plates at a density of 1x10⁵ cells/well for 9 days at
37˚C with the same 10 groups as above. The cells were digested and
centrifuged three times and the supernatant was discarded. The
mitochondria were stained using Mito-tracker Green (cat. no. C1048;
Bi Yun Tian Biologicals) and the staining solution was diluted
according to the manufacturer's instructions. Subsequently, 1 ml of
pre-warmed (37˚C) Mito-Tracker Green was added to the samples and
then incubated for 15-30 min. Following this, cells were
resuspended in PBS. Samples were detected using an image flow
cytometer (model Amnis® FlowSight; Luminex Corporation)
and the results were analyzed using IDEAS 1.0 software provided by
the above company.
Mitochondrial morphology
The p3 sheep TMJ disc cells were cultured in Petri
dishes at a density of 1x10⁵ cells/well for 9 days at
37˚C with the same 10 groups as above. Then, 1 ml of diluted
Mito-tracker Green (the dye solution at a ratio of 1:10,000) was
added to each culture dish and incubated for 15-30 min. The
staining solution was aspirated and 1 ml Hoechst 33258 (cat. no.
C1011; Bi Yun Tian Biologicals) was added to the cells for 10 min
to stain the nuclei. The samples were observed and imaged by
confocal laser scanning microscopy (CLSM; model Olympus FV3000;
Olympus Corporation). Image processing and acquisition were
finished via Olympus TruSight provided by Olympus Corporation.
Glycolysis stress test
The p3 sheep TMJ disc cells were seeded at
1x10⁴ cells/well in XFe 24-well cell culture plates. The
test was performed after 3 and 9 days of incubation at 37˚C with
the same 10 groups as above. On the day of the assay, the plates
were washed three times with the Seahorse XF media (without serum,
glucose, or bicarbonate, but with the addition of 2 mM glutamine.
cat. no. 103575-100; Agilent Technologies, Inc.). Then, the
Seahorse XF Glycolysis Stress Test Kit (cat. no. 103020-100;
Agilent Technologies, Inc.) reagents were added according to the
manufacturer's instructions. The Seahorse XFe24 analyzer (Agilent
Technologies, Inc.) was used to measure glycolysis stress.
Enzyme-linked immunosorbent assay
(ELISA)
The p3 sheep TMJ disc cells were cultured in 6-well
plates at a density of 1x10⁵ cells/well for 1, 2, 3, 6,
9 days at 37˚C with the same 10 groups as above. The cells were
resuspended using PBS and the cell concentration was adjusted to
~106 cells/ml. The samples were rapidly frozen and
thawed five times to release the cell contents and the supernatant
was collected. The concentrations of lactate dehydrogenase (LDH),
reactive oxygen species (ROS) and superoxide dismutase (SOD) were
measured using the Sheep Lactate Dehydrogenase (LDH) ELISA Kit
(cat. no. SP18658; WuHan Saipei Biotechnology Co, Ltd), Sheep
Reactive Oxygen Species (ROS) ELISA Kit (cat. no. SP19258; WuHan
Saipei Biotechnology Co, Ltd.) and Sheep Superoxide Dismutase (SOD)
ELISA Kit (cat. no. SP18814; WuHan Saipei Biotechnology Co, Ltd.).
The samples were processed according to the manufacturer's
instructions and analyzed using a microplate reader with a
wavelength of 450 nm. The experimental results were calculated by
drawing a standard curve following the manufacturer's
instructions.
Statistical analysis
All data were presented as the mean ± SD and all
experiments were repeated at least three times with similar
results. GraphPad Prism 8.0 software (GraphPad Software; Dotmatics)
was used to perform all statistical analyses, and two-way ANOVA
followed by Tukey's test was used to compare the differences
between groups. P<0.05 was considered to indicate a
statistically significant difference.
Results
Hypoxia and low glucose inhibit cell
growth
Cell proliferation assays demonstrated that under
normoxic conditions, TMJ disc cell culture densities reached an
OD450 of 2.0 on day 6. Different glucose concentrations
had no significant effect on proliferation over 9 days (P=0.567;
Fig. 1A). Under hypoxic
conditions, there was no significant difference for the first 3
days (P=0.875), but on day 6, cell proliferation decreased
significantly in the HG1 (0.367±0.092) and HG2 (0.46±0.124) groups,
as proliferation stopped and apoptosis was initiated with the
OD450 remaining <1.0 (Fig. 1B), which may indicate the cessation
of cell proliferation and the onset of apoptosis. The remaining
groups (HG3, HG4 and HC) showed continued but slowed proliferation
compared with HG1 and HG2. On day 9, the OD450 values
reached 2.0 for HG3 (2.137±0.129), HG4 (2.118±0.177) and HC
(2.073±0.252) groups (Fig. 1B),
which suggested that glucose concentrations ≥3 mmol/l resulted in
an increase in TMJ cell proliferation.
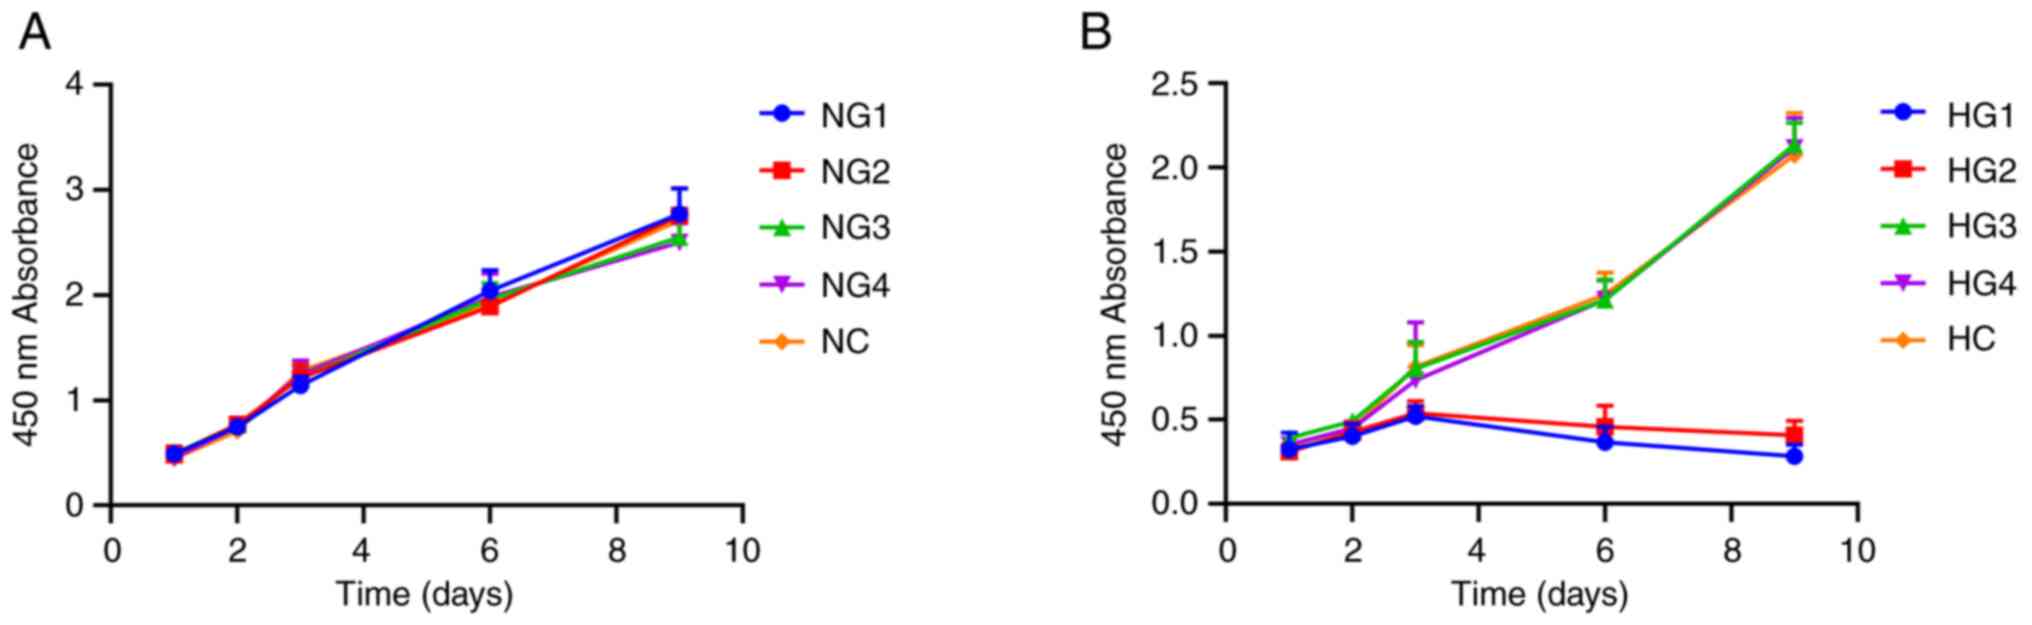 | Figure 1Effects of different glucose
concentrations on the proliferation of sheep temporomandibular
joint disc cells. (A) Cell proliferation curve of cells in normoxic
conditions. (B) Cell proliferation curve of cells in hypoxic
conditions. NG1, normoxia and 0 mmol/l glucose group; NG2, normoxia
and 0.5 mmol/l glucose group; NG3, normoxia and 3 mmol/l glucose
group; NG4, normoxia and 5.5 mmol/l glucose group; NC, normoxia and
control group (22.5 mmol/l); HG1, hypoxia and 0 mmol/l glucose
group; HG2, hypoxia and 0.5 mmol/l glucose group; HG3, hypoxia and
3 mmol/l glucose group; HG4, hypoxia and 5.5 mmol/l glucose group;
HC, hypoxia and control group (22.5 mmol/l). |
Low glucose concentration affects
extracellular matrix synthesis and adenosine
5'-monophosphate-activated protein kinase subunit α1 (AMPKα1)
expression
The main components of the extracellular matrix of
TMJ disc cells are collagen type I (Col-I), Col-II and aggrecan,
the expression levels of which were measured using RT-qPCR
(Fig. 2A-C). Col-I expression
under normoxic conditions in each group was as follows: compared
with NC (1.00±0.106), NG1 (0.542±0.086; P<0.0001) and NG2
(0.854±0.021; P=0.0033), were significantly reduced, versus the
significant increase in NG3 (1.508±0.037; P<0.0001) and NG4
(1.610±0.057; P<0.0001) (Fig.
2A). Expression under hypoxic conditions was lower in HG1
(0.091±0.006; P<0.0001) and HG2 (0.189±0.010; P<0.0001) than
in the HC (0.415±0.082) group (Fig.
2A). There was no difference in the HG3 group (0.482±0.023;
P=0.4082, P>0.05), however, Col-I in the HG4 group (0.655±0.014;
P=0.0002) significantly increased compared with HC. Regardless of
oxygen concentration, the expression of Col-I was highest in the
5.5 mmol/l glucose (NG4 and HG4 groups), but was significantly
lower in hypoxic conditions than in normoxic conditions
(P<0.0001).
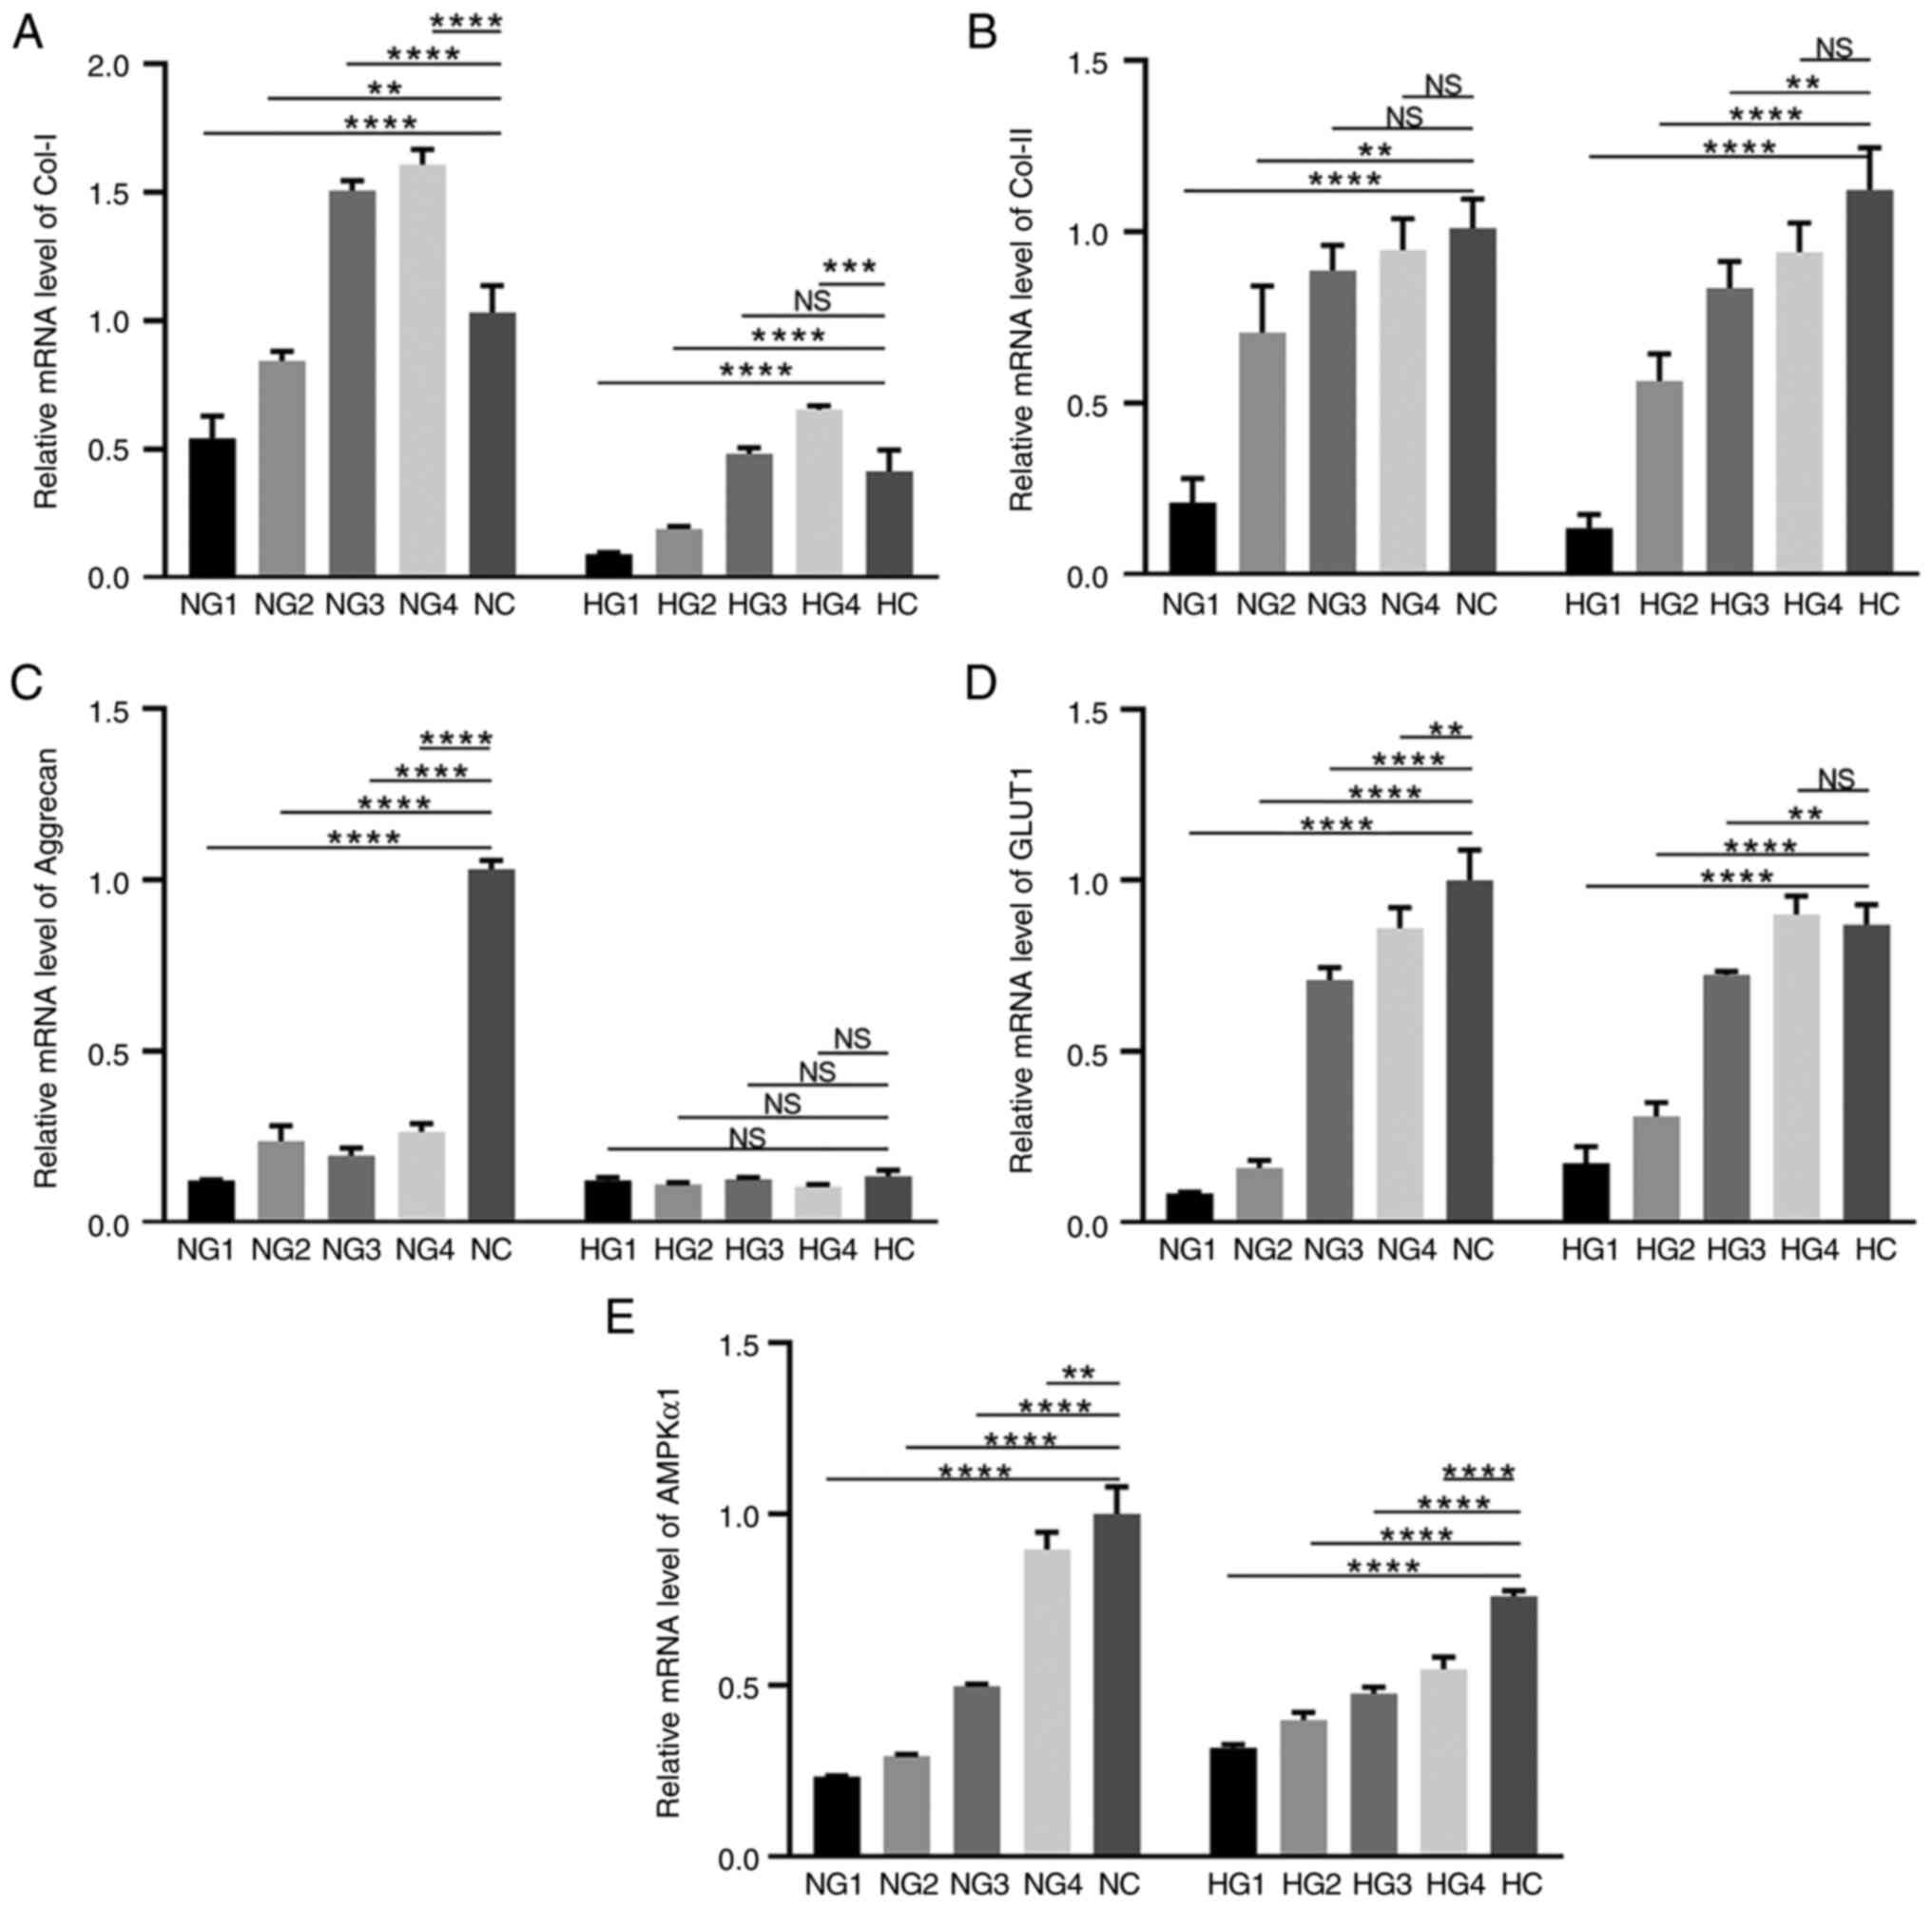 | Figure 2Expression levels of extracellular
matrix and cell metabolism-related molecules. (A) The mRNA
expression level of Col-I. (B) The mRNA expression level of Col-II.
(C) The mRNA expression level of aggrecan. (D) The mRNA expression
level of GLUT-1. (E) The mRNA expression level of AMPKα1.
**P<0.01, ***P<0.001,
****P<0.0001. NS, not significant; Col-I, collagen
type I; GLUT-1, glucose transporter 1; AMPKα1, adenosine
5'-monophosphate-activated protein kinase subunit α1; NG1, normoxia
and 0 mmol/l glucose group; NG2, normoxia and 0.5 mmol/l glucose
group; NG3, normoxia and 3 mmol/l glucose group; NG4, normoxia and
5.5 mmol/l glucose group; NC, normoxia and control group (22.5
mmol/l); HG1, hypoxia and 0 mmol/l glucose group; HG2, hypoxia and
0.5 mmol/l glucose group; HG3, hypoxia and 3 mmol/l glucose group;
HG4, hypoxia and 5.5 mmol/l glucose group; HC, hypoxia and control
(22.5 mmol/l) group. |
The level of Col-II expression, as shown in Fig. 2B, increased with increasing glucose
concentration. Under normoxic conditions, NG1 (0.209±0.071;
P<0.0001), NG2 (0.706±0.136; P=0.0019), NG3 (0.887±0.074;
P>0.05) and NG4 (0.946±0.092; P>0.05) exhibited lower levels
of Col-II expression than the NC group (1.00±0.086), but there was
no statistical significance between NG3 and NG4. Under hypoxic
conditions, Col-II expression in HG1 (0.134±0.040; P<0.0001),
HG2 (0.564±0.079; P<0.0001) and HG3 (0.836±0.077; P=0.0034) was
significantly lower than that in the HC group (1.122±0.124),
and there was no significant difference in the HG4 group
(0.940±0.085; P>0.05). There was also no significant difference
in Col-II expression between the hypoxic and normoxic conditions
(P>0.05).
Aggrecan expression was significantly upregulated in
the NC group (P<0.0001; Fig.
2C), but was low under all other test conditions. In general,
the aggrecan expression levels in the normoxia groups were higher
than those in the hypoxia groups.
Glucose transporter 1 (GLUT1) is the primary glucose
transporter in chondrocytes (24).
GLUT1 expression increased in high glucose concentrations (Fig. 2D). Under normoxic conditions, GLUT1
expression was significantly lower in NG1 (0.086±0.003;
P<0.0001), NG2 (0.160±0.023; P<0.0001), NG3 (0.710±0.035;
P<0.0001), and NG4 (0.861±0.060; P=0.0080) groups when compared
with the NC group (1.00±0.090). Under hypoxic conditions, the HG1
(0.173±0.049; P<0.0001), HG2 (0.311±0.039; P<0.0001), and HG3
(0.724±0.009; P=0.0052) groups had lower GLUT1 concentrations than
the HC group (0.871±0.058). HG4 (0.901±0.053; P>0.05) was
slightly higher than the HC group, but this difference was not
statistically significant. GLUT1 expression was essentially
unaffected by oxygen partial pressure.
AMPK is a key molecule in the regulation of
biological metabolism (25). Under
normoxic conditions, AMPKα1 expression increased at high glucose
concentrations (Fig. 2E). NG1
(0.233±0.003; P<0.0001), NG2 (0.293±0.005; P<0.0001), NG3
(0.496±0.007; P<0.0001), and NG4 (0.897±0.050; P=0.0046) groups
exhibited significantly downregulated AMPKα1 expression, compared
with the NC group (1.00±0.080). The trends were similar
under hypoxic conditions. The trend of AMPKa1 expression in both
normoxia and hypoxia was up-regulated with increasing sugar
concentration, indicating that sufficient glucose could activate
the expression of AMPKa1.
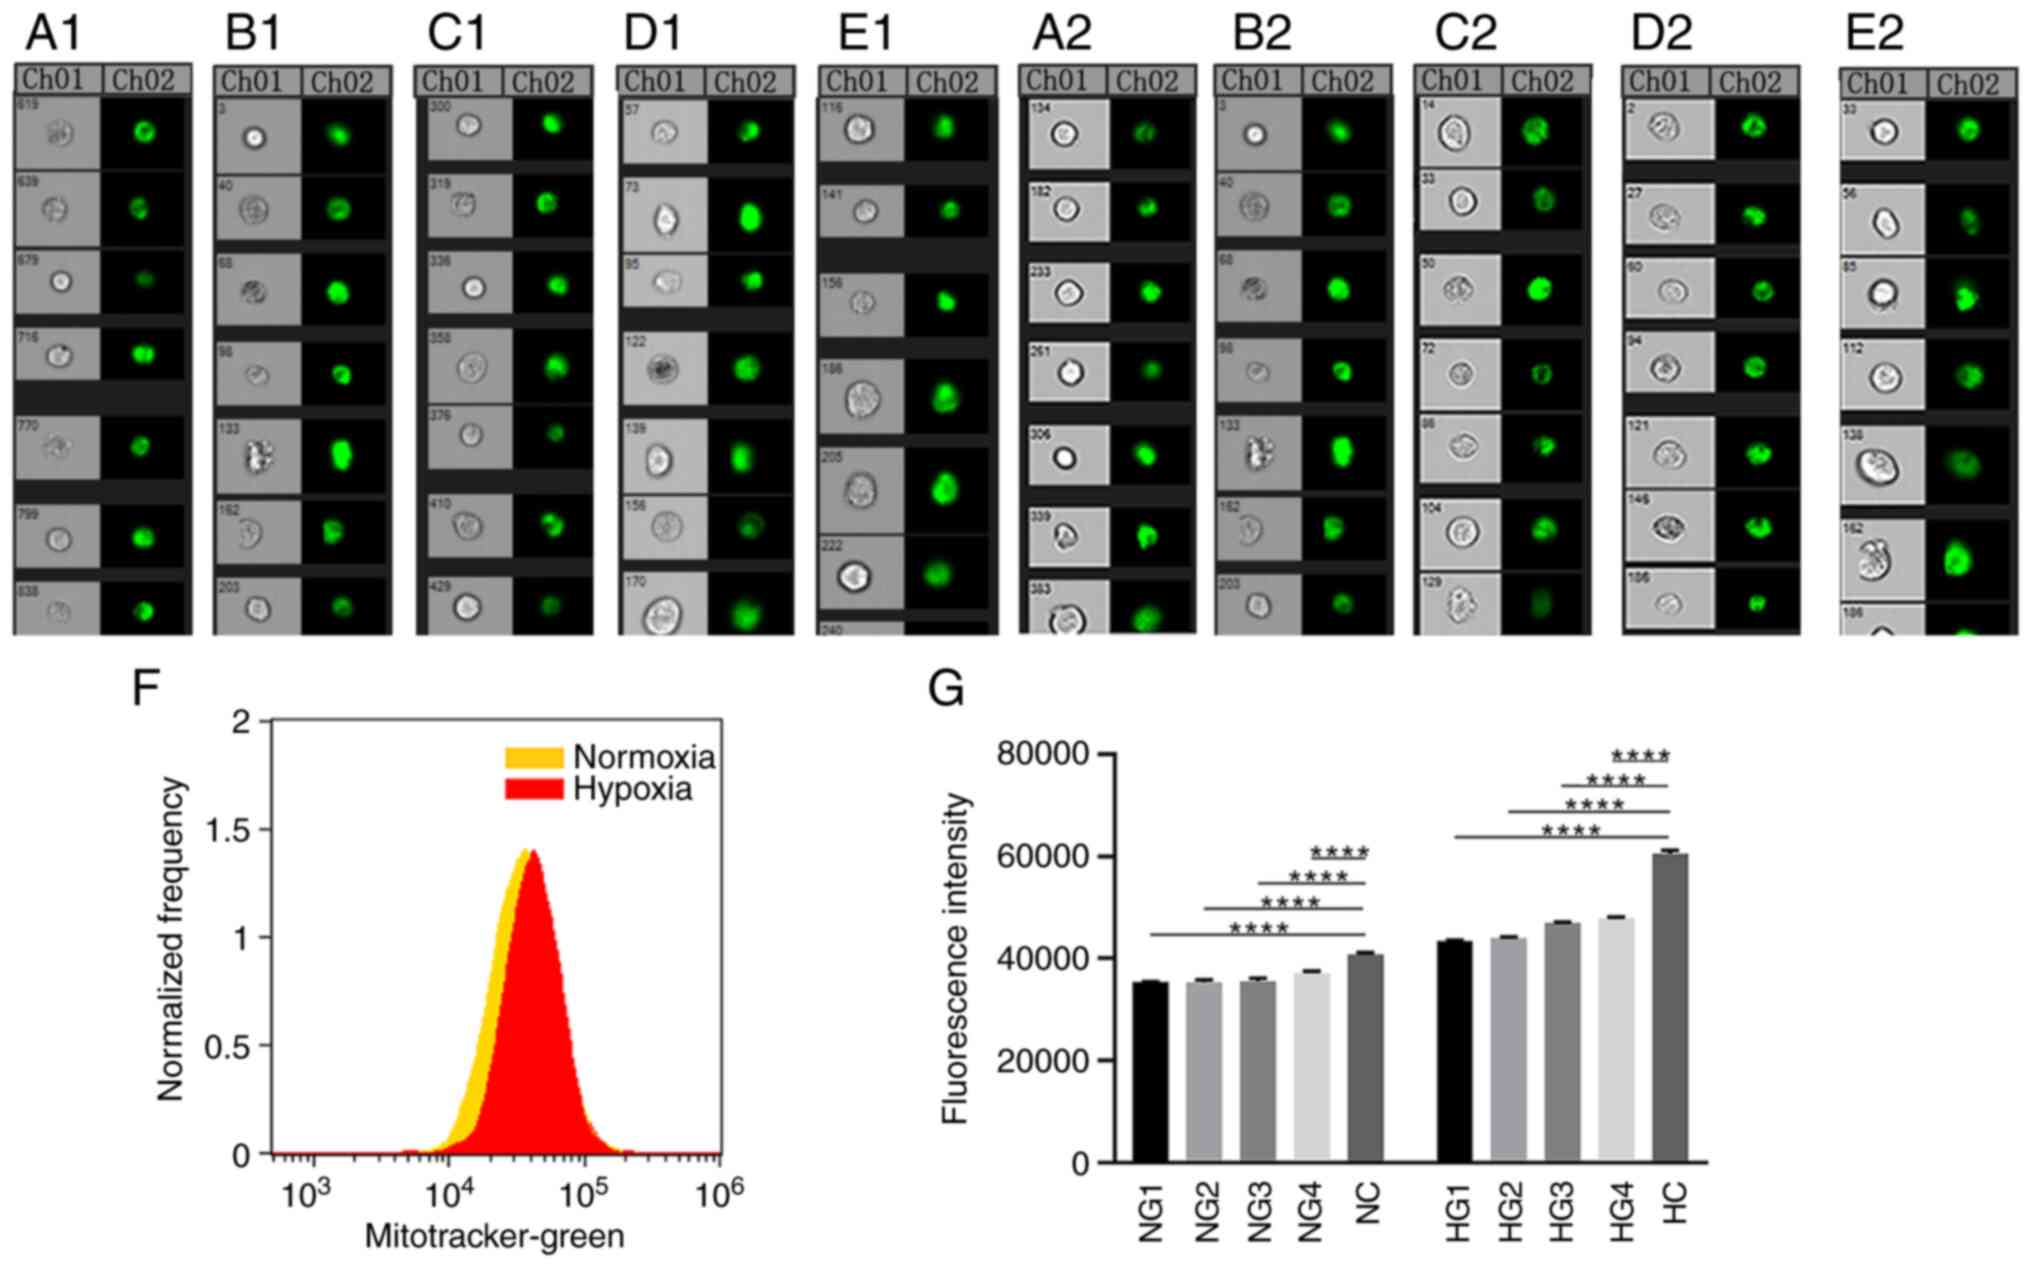
Hypoxia causes a compensatory increase
in the number of mitochondria
MitoTracker Green mitochondrial staining and flow
cytometry were used to observe the number of mitochondrial in TMJ
disc cells under normoxic and hypoxic conditions (Fig. 3A-G). In Fig. 3A-E, CH01 panels show images under
light microscopy observation, and the CH02 panels show fluorescence
images observed after mitochondrial staining. Fluorescence
intensity values reflect the relative number of mitochondria.
Compared with the normoxic samples, fluorescence was significantly
higher in the hypoxic samples (P<0.0001) and increased with
increasing glucose concentrations. All groups were significantly
different from the control group (P<0.0001; Fig. 3G).
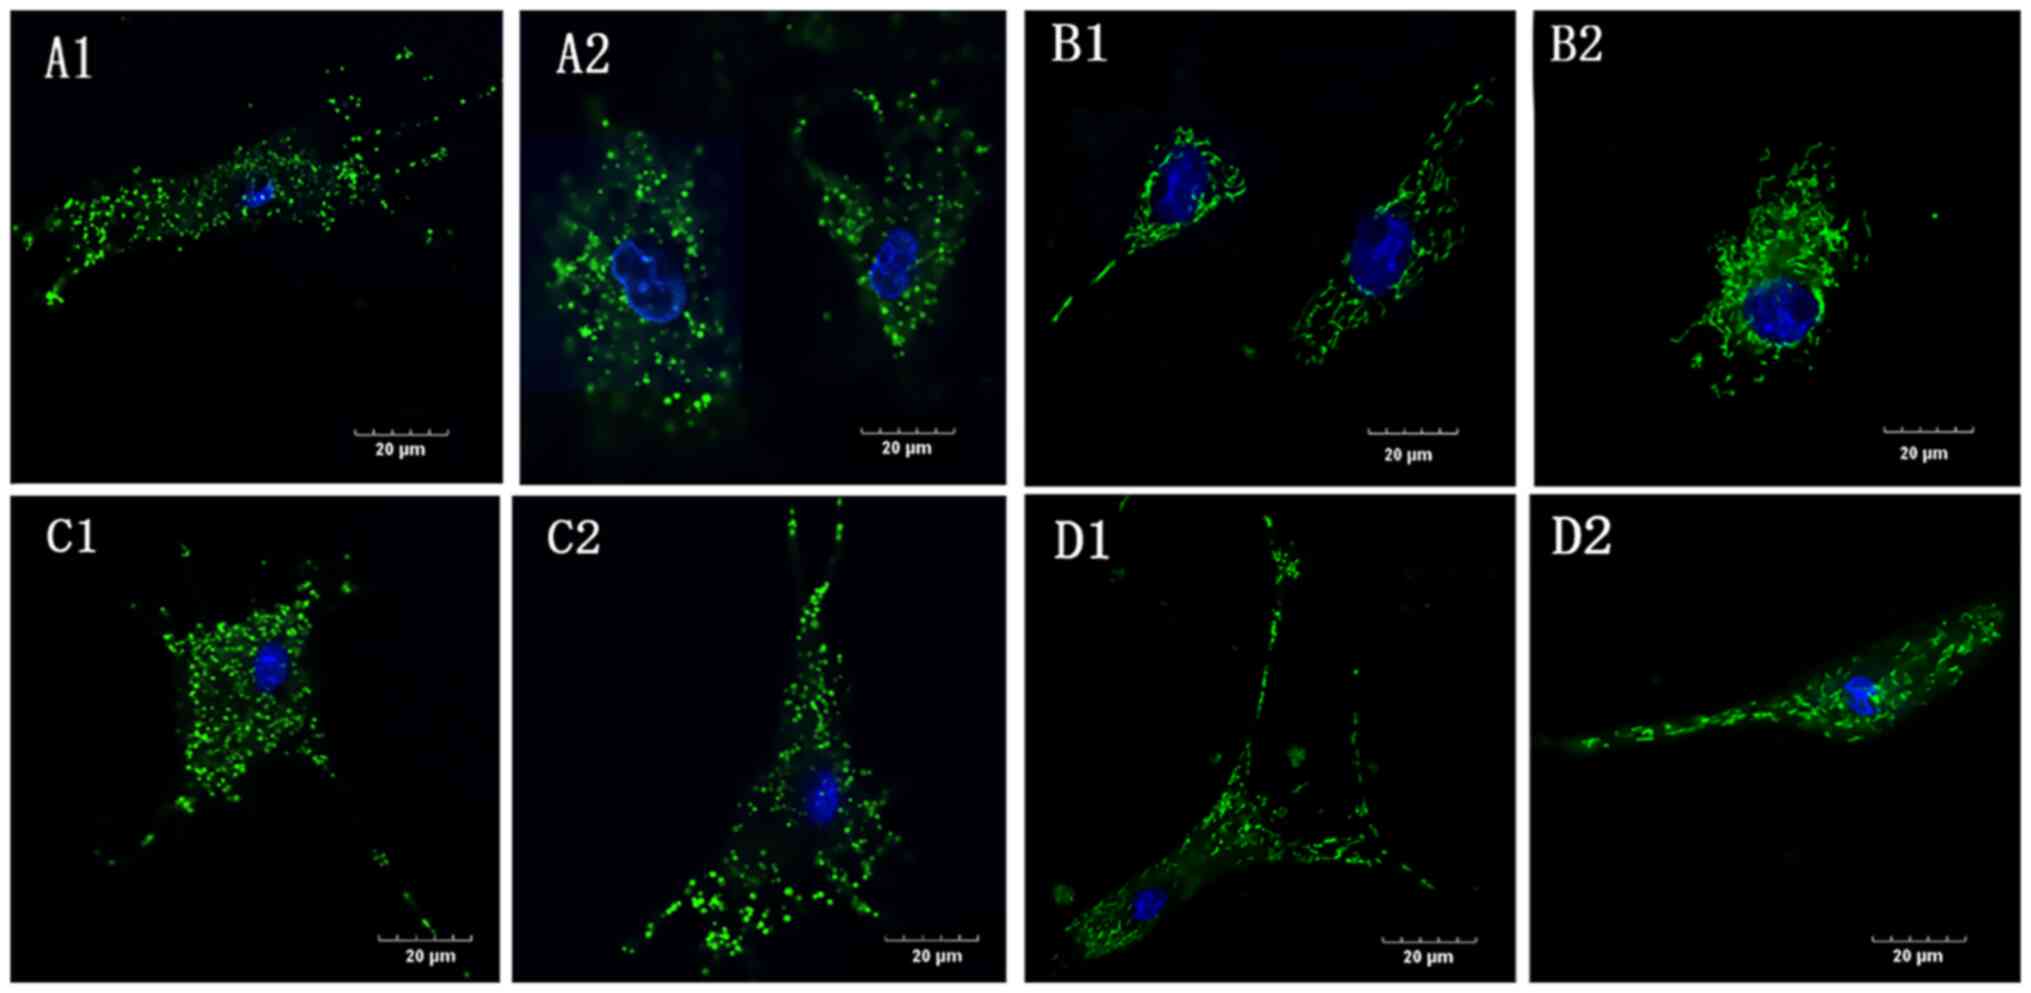
Mitochondrial deformation and swelling
in the absence of glucose
In the G1 group, under both normoxic and hypoxic
conditions (NG1 and HG1, respectively), the mitochondrial
morphology was swollen and shorter and the mitochondrial network
was absent (Fig. 4A and C) compared with the controls (Fig. 4B and D), in which the mitochondria were evenly
distributed in the cytoplasm surrounding the nucleus and connected
in a network. Compared with the normoxic control group (NC), the
mitochondrial morphology in the hypoxic control group (HC) was
slightly shorter and the network was less clear.
Glycolysis is the primary metabolic
pathway of TMJ disc cells
The glycolytic pathway is significantly enhanced
when cells are well nourished. When nutrition is insufficient,
metabolic pathways are inhibited. The Seahorse XFe glycolysis
stress test was used to detect the extracellular acidification rate
(ECAR) and oxygen consumption rate (OCAR). This experiment detected
glycolysis after the addition of glucose and 2-deoxy-D-glucose. The
values express the basic glycolytic ability and potential of cells.
Glycolysis ability represents the level of glycolysis of cells
under normal nutrient supply. Glycolysis potential represents the
maximum glycolysis level of cells when the oxidative
phosphorylation pathway is inhibited.
There was no significant difference in the basic
glycolysis rate after 3 days under normoxic conditions. Cultures
exposed to lower glucose concentrations had a greater glycolysis
potential and stronger glycolysis ability (Fig. 5A). After 9 days in a normoxic
environment, the glycolytic ability and potential of cells in the
low glucose group had improved (P<0.0001; Fig. 5B).
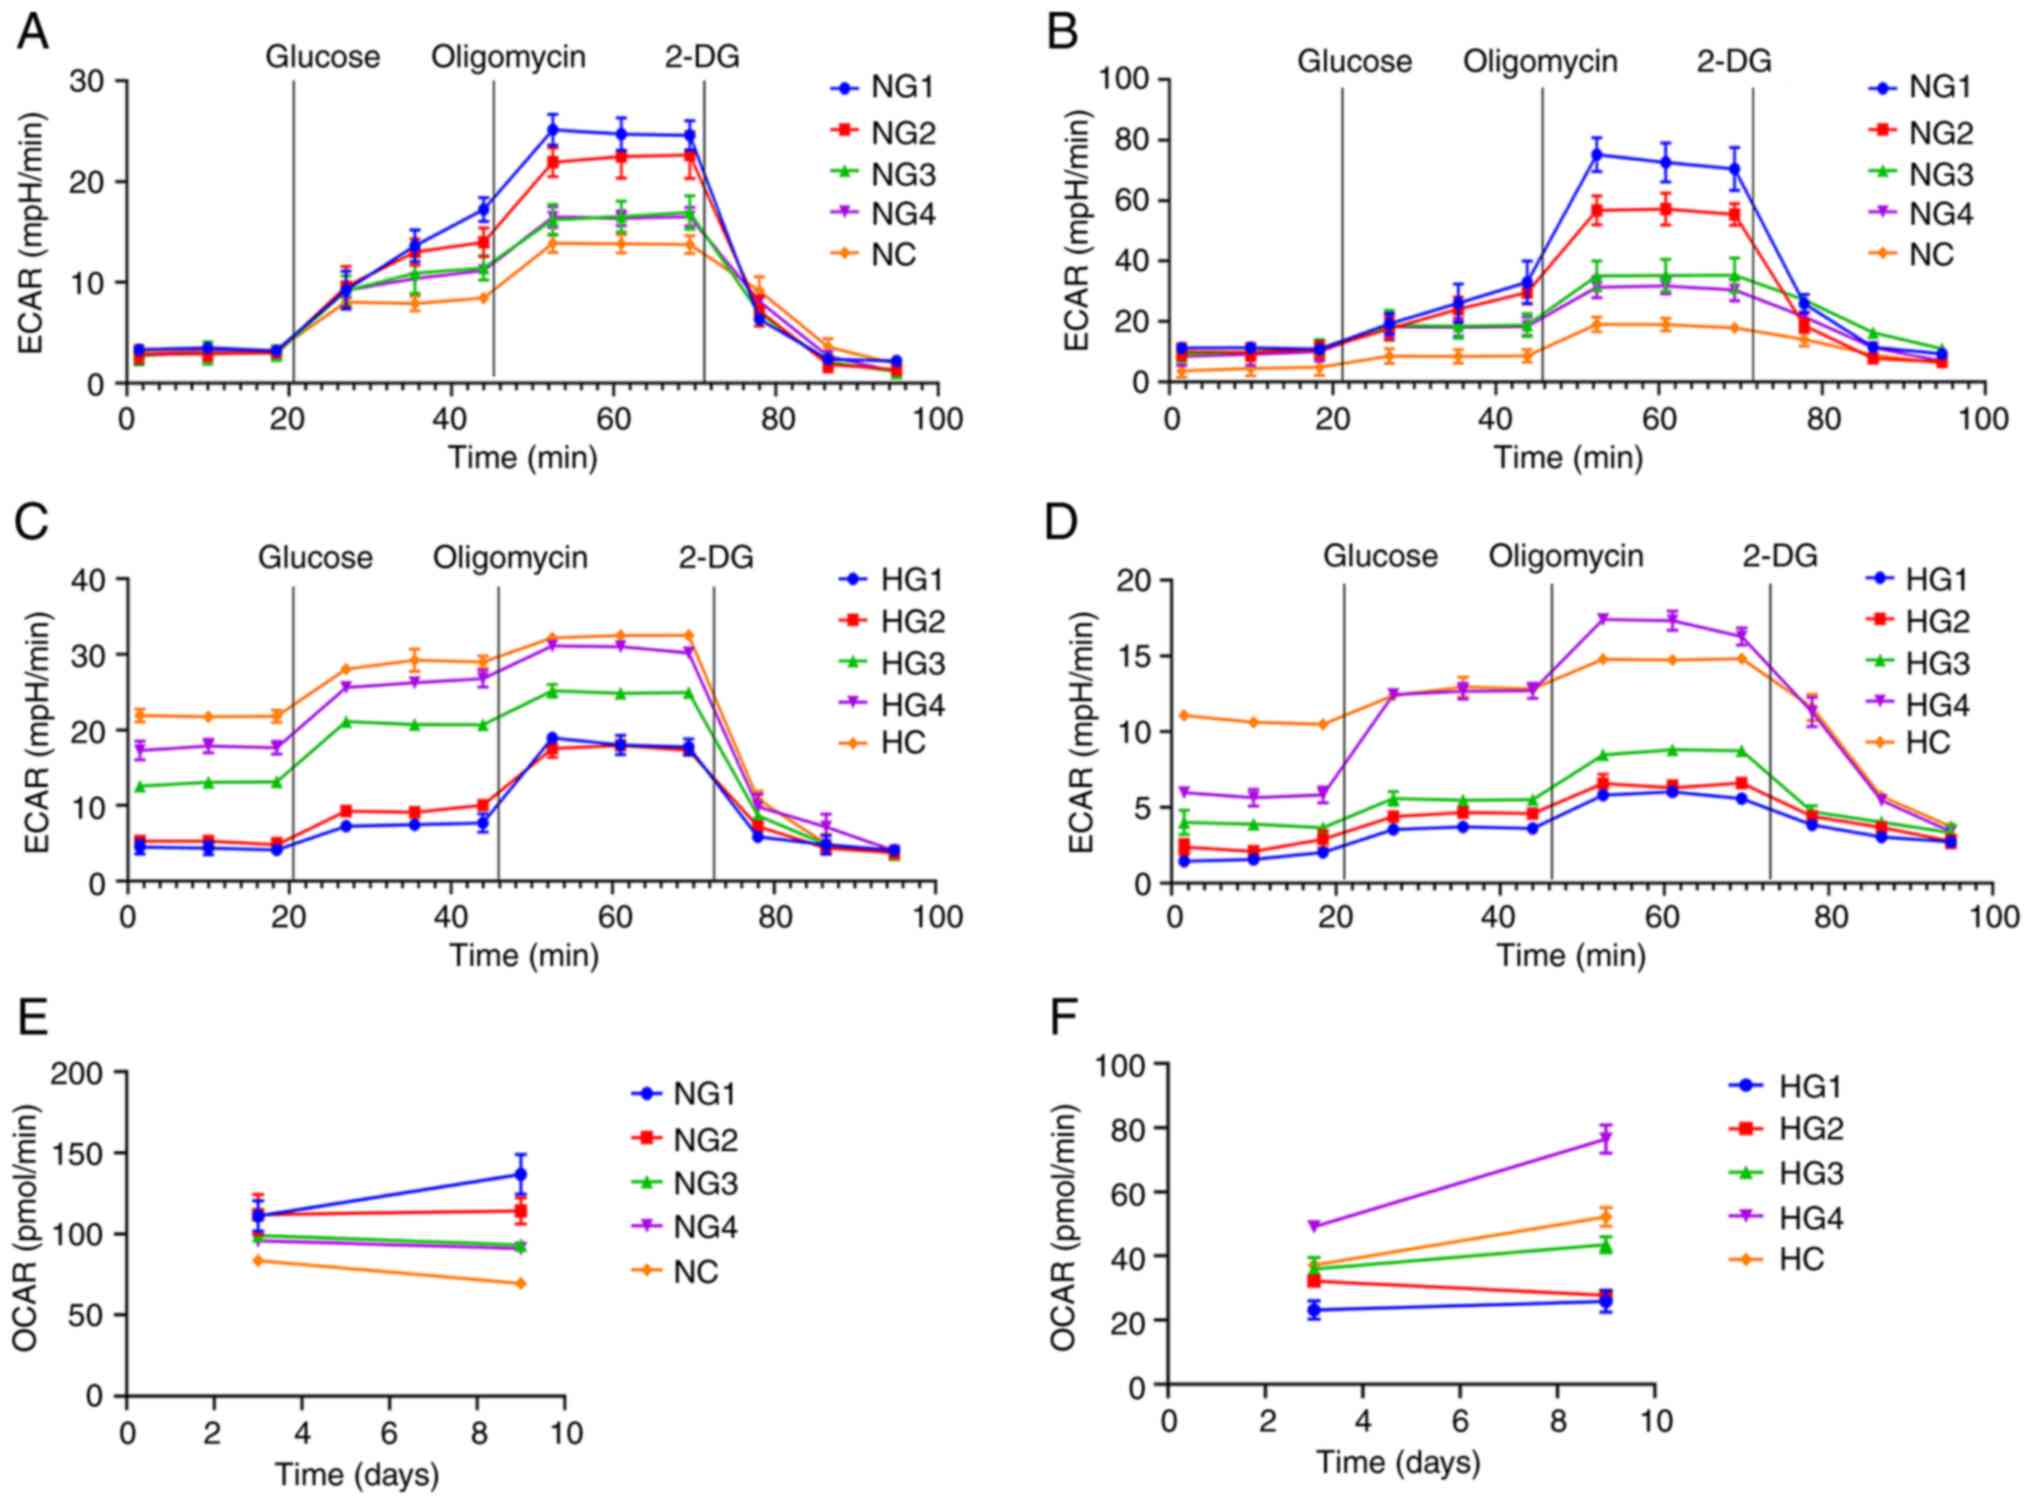 | Figure 5Glycolysis pressure test results. (A)
ECAR after 3 days under normoxic conditions. (B) ECAR after 9 days
under normoxic conditions. (C) ECAR after 3 days under hypoxic
conditions. (D) ECAR after 9 days under hypoxic conditions. (E)
OCAR after 3 and 9 days under normoxic conditions. (F) OCAR after 3
and 9 days under hypoxic conditions. ECAR, extracellular
acidification rate; OCAR, oxygen consumption rate; NG1, normoxia
and 0 mmol/l glucose group; NG2, normoxia and 0.5 mmol/l glucose
group; NG3, normoxia and 3 mmol/l glucose group; NG4, normoxia and
5.5 mmol/l glucose group; NC, normoxia and control (22.5 mmol/l)
group; HG1, hypoxia and 0 mmol/l glucose group; HG2, hypoxia and
0.5 mmol/l glucose group; HG3, hypoxia and 3 mmol/l glucose group;
HG4, hypoxia and 5.5 mmol/l glucose group; HC, hypoxia and control
(22.5 mmol/l) group. |
After three days in a hypoxic environment, the basic
glycolysis rate of TMJ disc cells increased with increasing glucose
concentrations (Fig. 5C). On day
nine, the basic glycolysis rate and ability of glycolysis of the
cells decreased significantly (Fig.
5D). The overall detection of glycolysis was lower in hypoxia
than in normoxia (P<0.0001).
The Seahorse XFe glycolysis stress test also showed
the basic OCAR. In normoxia, the OCAR decreased with increasing
glucose concentrations (Fig. 5E).
In hypoxia, the OCAR was the highest in the HG4 group and increased
with increasing glucose concentration but remained significantly
lower than in normoxic conditions (P<0.0001; Fig. 5F).
Some respiratory metabolites remain at
normal levels in the short term
LDH, ROS, and SOD levels were detected using an
ELISA kit, as LDH is the key enzyme in glycolysis, ROS is a product
of oxidative phosphorylation, and SOD is an antagonist of ROS and
is used as a detection index.
The content of LDH under normoxic conditions
decreased gradually over time (P<0.0001; Fig. 6A). However, differences in glucose
concentration yielded no significant differences in LDH, ROS or SOD
concentrations (P>0.05; Fig.
6A-C). Under hypoxic conditions, LDH concentration gradually
increased with increasing glucose concentrations (Fig. 6D). On day 9, compared with the HC
group (31.226±0564 U/ml), the LDH content was significantly lower
in the HG1 (10.723±0.779 U/ml; P<0.0001) and HG2 (982.826±25.171
U/ml; P<0.0001) groups. In the HG3 (34.789±0.508 U/ml;
P=0.000191) and HG4 (35.435±0.529 U/ml; P=0.000045) groups, the LDH
concentration was slightly higher than that in the HC group.
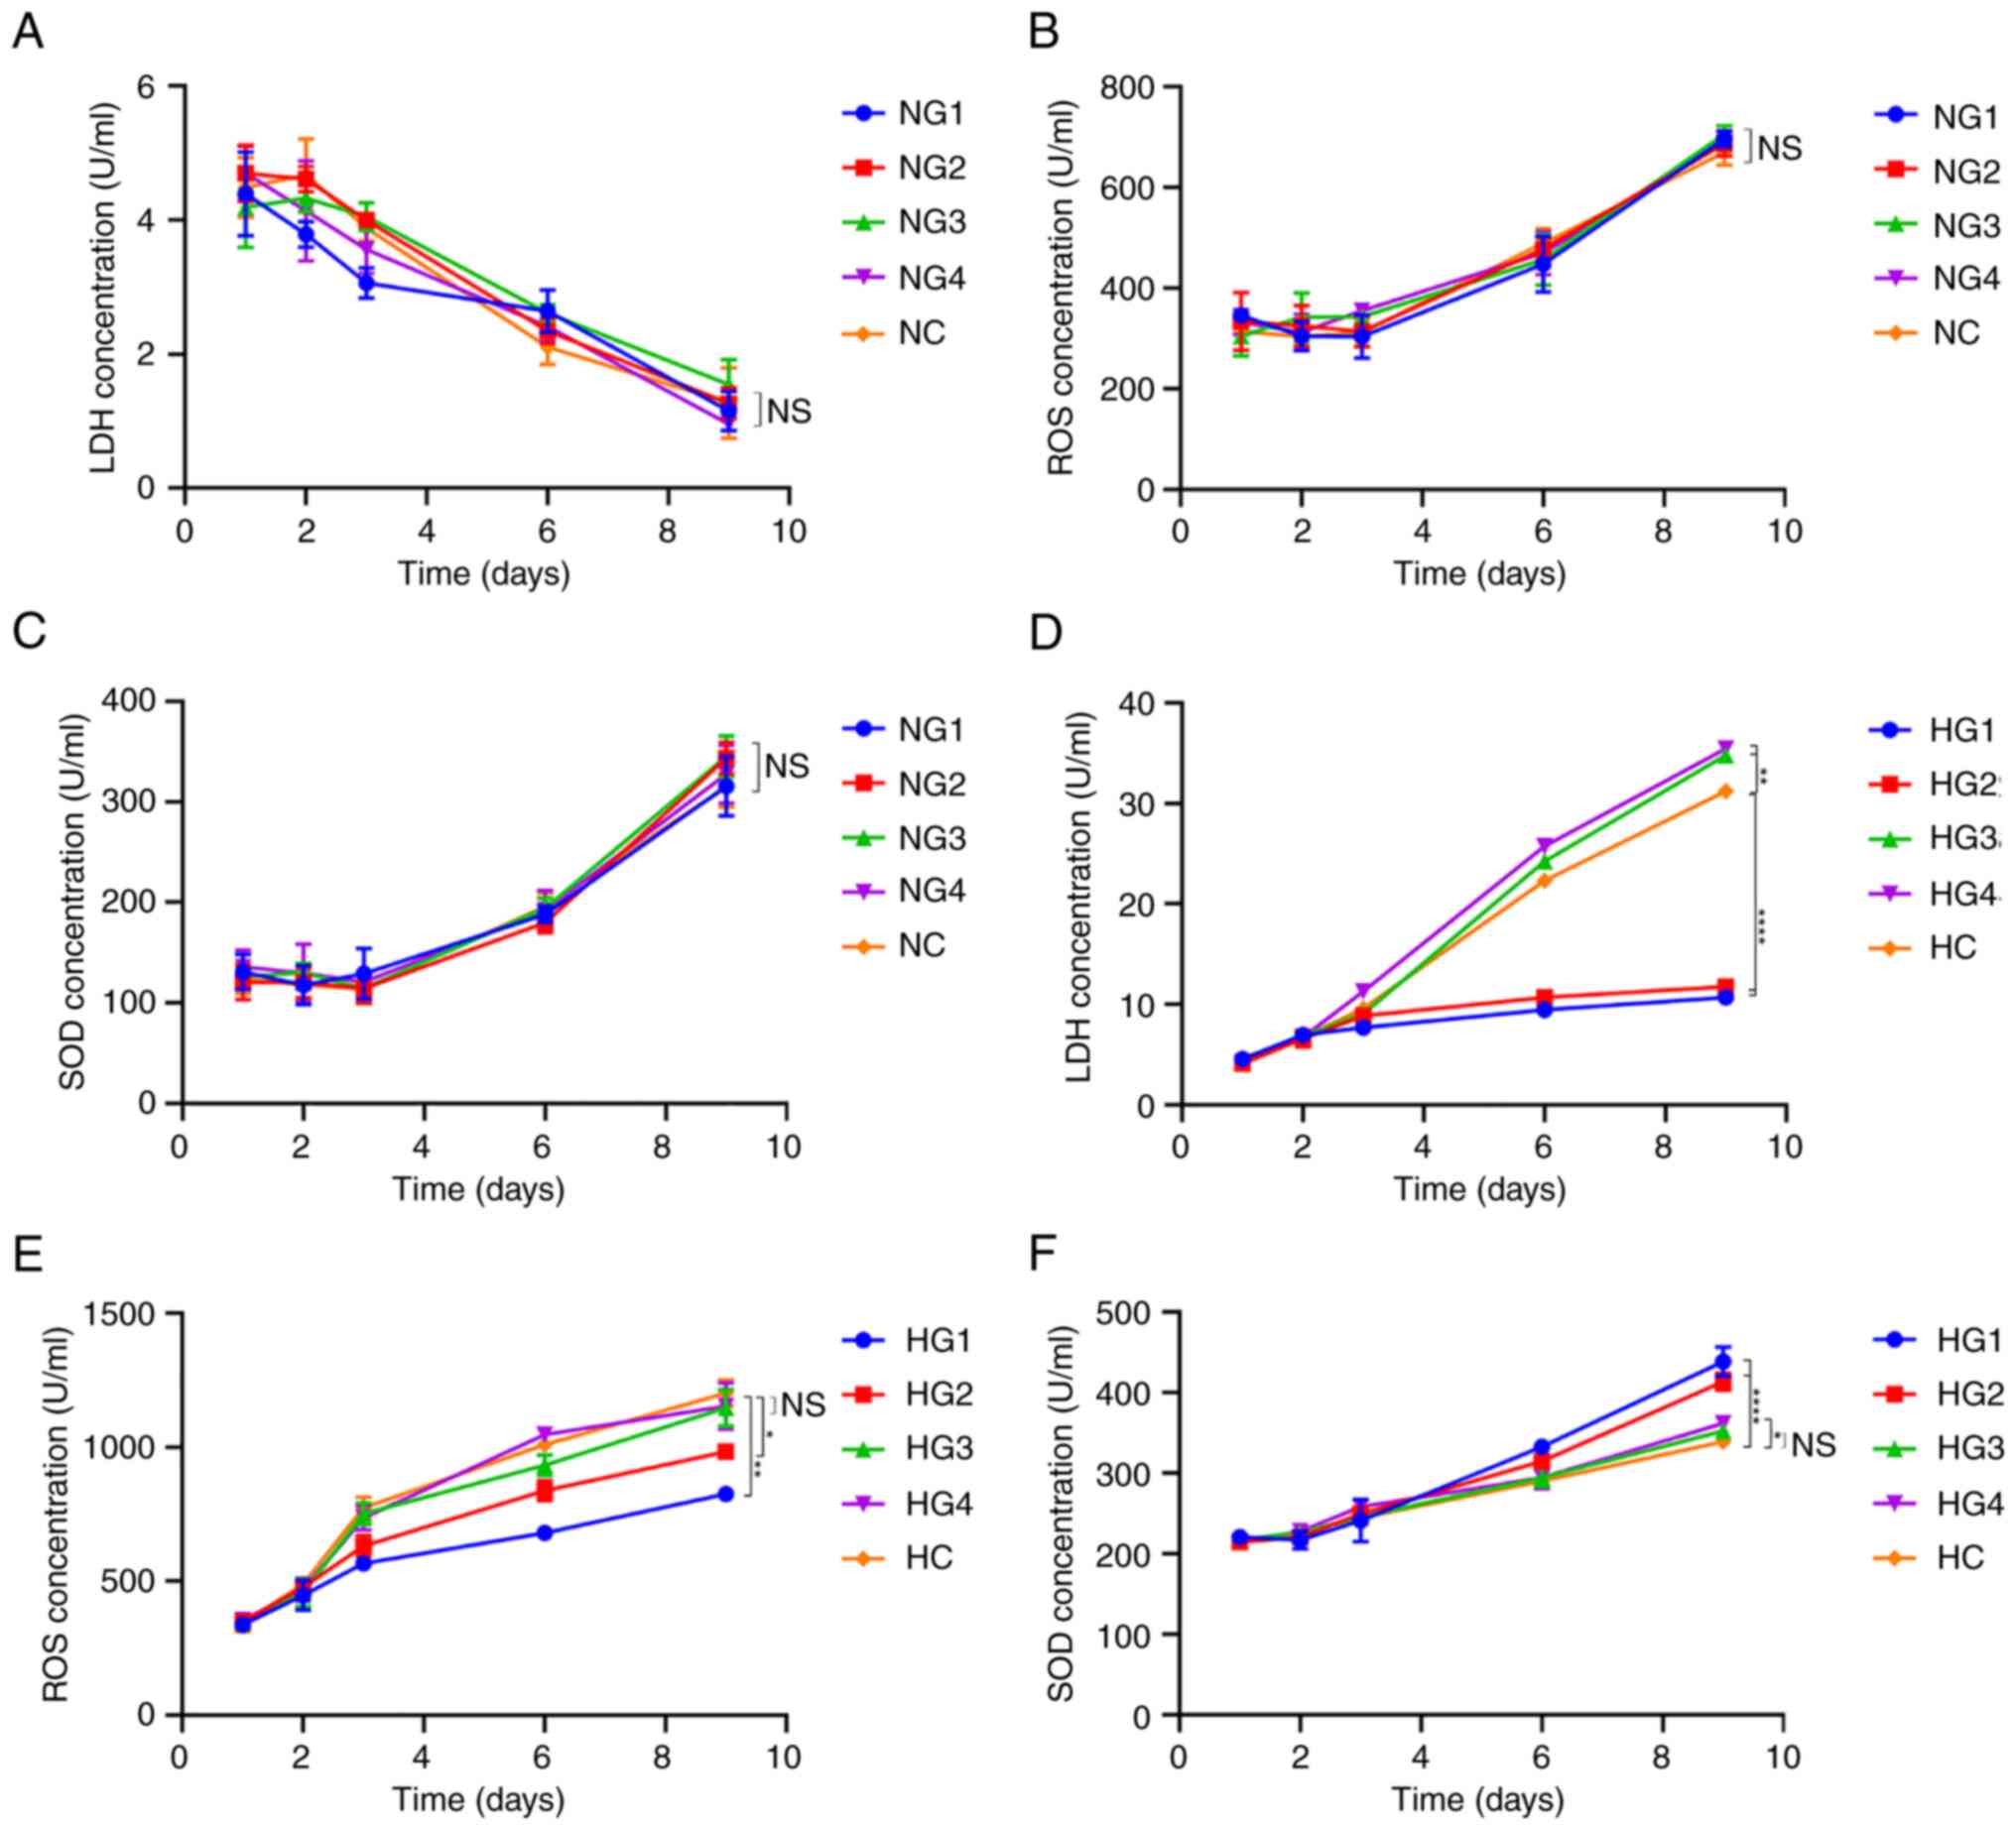 | Figure 6Concentration of respiratory
metabolism-related molecules. (A) LDH concentration in cells in
normoxic conditions; (B) ROS concentration in cells in normoxic
conditions. (C) SOD concentration in cells in normoxic conditions.
(D) LDH concentration in cells in hypoxic conditions. (E) ROS
concentration in cells in hypoxic conditions. (F) SOD concentration
in cells in hypoxic conditions. *P<0.05,
**P<0.01, ****P<0.0001. NS, not
significant; LDH, lactate dehydrogenase; ROS, reactive oxygen
species; SOD, superoxide dismutase; NG1, normoxia and 0 mmol/l
glucose group; NG2, normoxia and 0.5 mmol/l glucose group; NG3,
normoxia and 3 mmol/l glucose group; NG4, normoxia and 5.5 mmol/l
glucose group; NC, normoxia and control (22.5 mmol/l) group; HG1,
hypoxia and 0 mmol/l glucose group; HG2, hypoxia and 0.5 mmol/l
glucose group; HG3, hypoxia and 3 mmol/l glucose group; HG4,
hypoxia and 5.5 mmol/l glucose group; HC, hypoxia and control (22.5
mmol/l) group. |
Under hypoxic conditions, there was no significant
difference in ROS concentration between the different glucose
groups within the first 3 days (P=0.348; Fig. 6E). On day 9, the ROS concentration
in the HG1 (825.123±26.915 U/ml; P=0.000072) and HG2
(982.826±25.171 U/ml; P=0.005) groups were significantly lower than
that in the HC group (1,202.200±49.208 U/ml) (Fig. 6E). However, the ROS concentration
in the HG3 (1,146.631±68.128 U/ml, P=0.747) and HG4
(1,153.435±86.183 U/ml; P=0.882) groups was not significantly
different from that in the HC group.
The SOD concentration in cells in normoxic
conditions increased over time, with no significant difference
between groups (P=0.440; Fig. 6C).
The SOD concentration in cells under hypoxic conditions also
increased over time (Fig. 6F) but
remained only slightly higher than that under normoxic conditions
(the first 6 days, P<0.0001; on day 9, P=0.0183). On day 9, SOD
levels in HG1 (438.808±17.860 U/ml; P=0.000002) and HG2
(413.990±10.483 U/ml; P=0.000026) were significantly higher than
those in HC (339.338±3.691 U/ml); furthermore, SOD levels in HG3
(352.630±6.134 U/ml; P=0.506) and HG4 (362.225±3.427 U/ml; P=0.102)
were higher but the differences were not significant (Fig. 6F).
Discussion
A study has shown that glucose is a key nutrient for
maintaining cell survival in non-vascular tissue (26). For example, bovine nucleus pulposus
cell viability decreases significantly in the absence of glucose,
regardless of oxygen concentration (27). In addition, a study investigating
the energy metabolism of porcine TMJ disc cells showed that glucose
was a limiting nutrient for survival. Hypoxia also limits the
production of intracellular ATP and the synthesis of extracellular
collagen and proteoglycan (23).
This is consistent with the results of the present study. The
present study demonstrated that in hypoxic conditions, the number
of cellular mitochondria increased, Col-II and aggrecan expression
did not change significantly, and cellular glucose uptake and
AMPKα1 levels were also unaffected. This suggested that hypoxia
does not cause cellular damage or lead to degeneration in TMJ disc
cells. By contrast, low-glucose conditions yielded changes in
mitochondrial morphology (causing the organelle to appear
degenerated and swollen) and significantly inhibited the expression
of extracellular matrix synthesis-associated Col-I, Col-II and
aggrecan and the expression of GLUT and AMPKα1, all of which may
contribute to degeneration in TMJ disc cells.
Mitochondria are critical in cell aging and
age-related diseases (28). The
loss of mitochondrial function leads to the shortening of cell
telomeres, which in turn leads to aging (29). Mitochondria are essential for
maintaining equilibrium between redox reactions and energy
metabolism in cells and are critical for cell survival and death
(30). The expression of AMPK has
a significant impact on mitochondrial function and is therefore a
key factor in cellular degeneration and aging (31). AMPK is located in the mitochondria
and can be activated in the absence of glucose; it stimulates the
regeneration of new mitochondria, promotes the autophagy of aging
mitochondria and maintains the dynamic balance of mitochondrial
numbers (25). Furthermore,
decreased levels of mitochondrial function and AMPK activity have
also been observed in degenerative cartilage, aging cartilage, and
biomechanically injured bovine cartilage (32,33).
This decrease in AMPK activity is likely a direct result of the
decline of mitochondrial function (34). In the present study, the
glucose-free group exhibited decreased quantities of mitochondria,
the mitochondrial morphology was swollen and deformed, and AMPKα1
expression was significantly downregulated. It was therefore
demonstrated that AMPKα1 expression was directly associated with
glucose concentration.
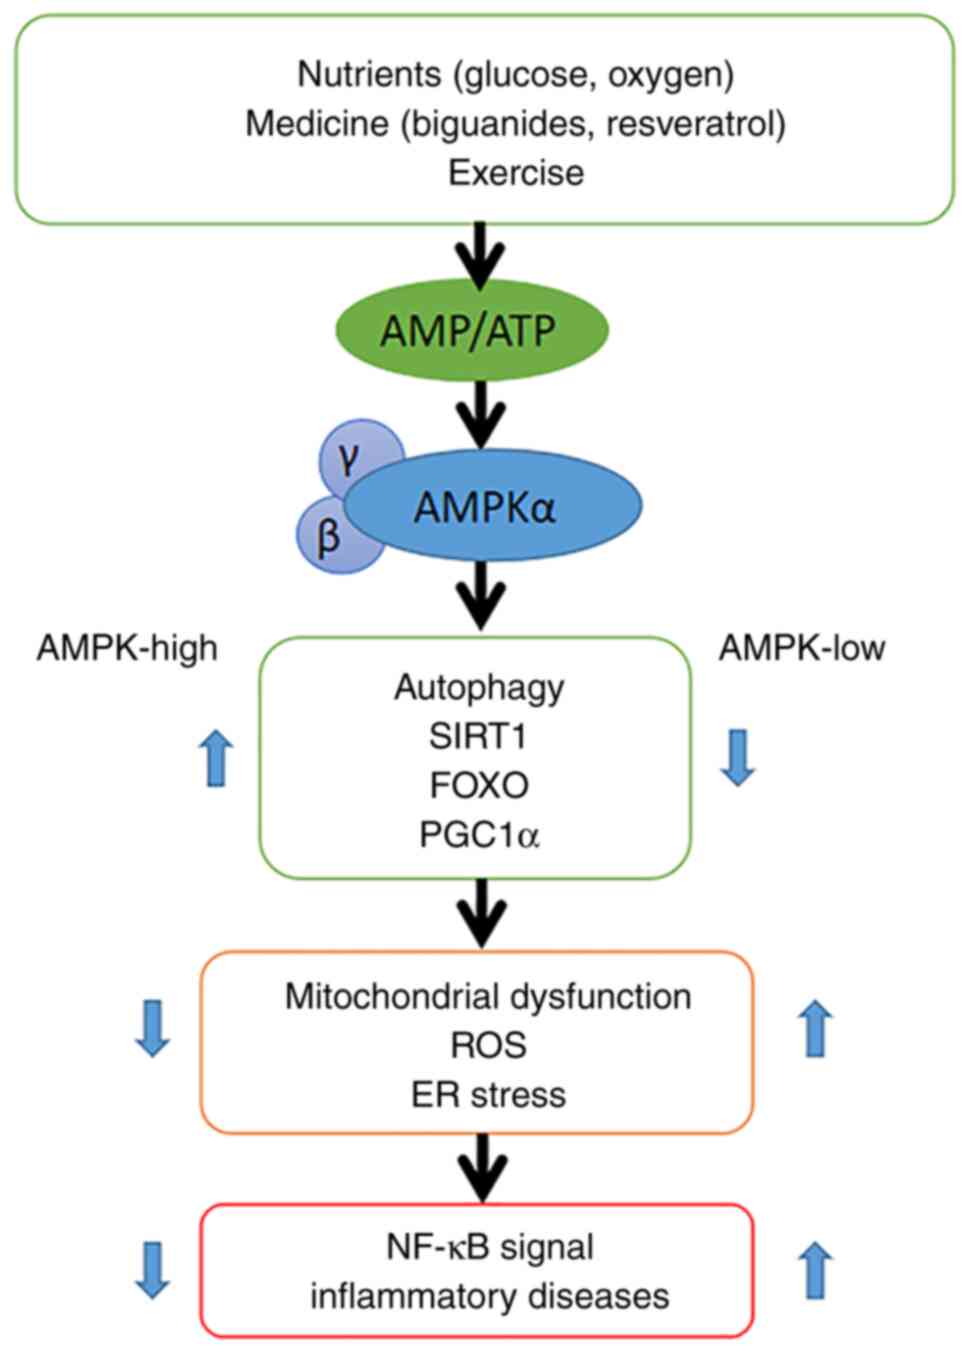
A proposed mechanism for the link between AMPK
signaling and inflammation is shown in Fig. 7. AMPK is activated when cellular
AMP/ATP levels change due to physiological stress or drug-induced
effects. The AMPK signaling pathway mediates immune inflammation.
High AMPK expression promotes the production of sirtuin 1, forkhead
box protein O and peroxisome proliferator-activated receptor γ
coactivator 1-α, thereby protecting cells from mitochondrial
dysfunction, endoplasmic reticulum stress and oxidative stress,
whilst inhibiting NF-κB signaling. NF-κB plays a key regulatory
role in the immune inflammatory response. When the expression of
AMPK is low, cells are no longer protected and NF-κB signaling is
enhanced (35). Thus, the level of
AMPK is closely related to the presence and function of
mitochondria, and glucose concentration is key to maintaining the
function of AMPK and may be the primary cause of cell aging.
The investigation into energy metabolism in the
present study showed that glycolysis is the primary form of
metabolism in TMJ disc cells, in an environment with sufficient
glucose and oxygen. Both metabolic mechanisms glycolysis and
oxidative phosphorylation were inhibited when glucose and oxygen
were insufficient, which means the Pasteur effect did not occur in
sheep TMJ disc cells. The Pasteur effect means that glycolysis in
biological cells and tissues will increase when oxygen is reduced.
The Seahorse XFe test demonstrated that under normoxic conditions,
the basal OCAR and glycolysis potential increased. Under hypoxic
conditions, respiratory metabolism was inhibited, and the function
of glycolysis and oxidative phosphorylation was significantly
decreased. A previous study has confirmed that there is no Pasteur
effect in chondrocytes but there is a Pasteur effect in TMJ
articular disc cells (17). If the
Pasteur effect existed in TMJ disc cells, the glycolysis rate would
increase with the lack of oxygen supply, resulting in glucose
depletion, more lactic acid, and low pH, leading to more extensive
cell death (23). If the Pasteur
effect did not exist in TMJ disc cells, the rate of glycolysis
would be downregulated in hypoxia and the cells would maintain low
glucose consumption, which would have a protective effect of the
cells. The results of the present study demonstrated that the
Pasteur effect did not occur in sheep TMJ disc cells. Thus, it was
speculated that this is a self-protection mechanism for TMJ disc
cells.
A study has found that the OCAR of degenerative
intervertebral disc cells is three to five times higher than that
of normal disc cells and that these degenerative cells may have
been converted to a more oxidative phenotype (36). Meanwhile, chondrocytes can restore
their phenotype under hypoxic conditions (37). Hypoxia has a major effect on the
phenotypic maintenance of TMJ disc cells. In previous studies,
sheep TMJ disc cells show reduced autophagy and apoptosis rates and
increased cell survival under hypoxic conditions (21,22).
This is beneficial for these dedifferentiated cells to achieve
phenotypic reversal and produce more extracellular matrix. The
results of the present study showed that the expression levels of
Col-I and Col-II is downregulated during hypoxia. However, whether
this helps to maintain the phenotype of articular disc cells
requires further research.
From the results of the present study, it is
demonstrated that glucose deficiency is a key factor in the
degeneration of articular disc cells, and we suggest that
regulating glucose concentration could be a viable treatment for
tissue degeneration. Different drugs can regulate mitochondrial
function and the respiratory metabolism of organisms through
different mechanisms. It has been reported that AMPK can mediate
the response to biguanide treatment, affect mitochondrial function
and regulate blood glucose (38).
Resveratrol can improve the ROS scavenging activity of SOD, thereby
improving mitochondrial membrane potential and promoting
mitochondrial biogenesis and function (39). However, to understand which drug
could be effective in treating degenerative disease requires
further research.
In conclusion, the present study demonstrated that
the metabolism of TMJ disc cells is primarily glycolytic under
physiological conditions. Hypoxic conditions and normal glucose
concentrations may be suitable for the growth of TMJ disc cells.
Glucose is a necessary nutrient to ensure cell survival,
extracellular matrix synthesis, and mitochondrial function. Glucose
deficiency may be related to disc degeneration, aging, and disease
mechanisms. Future studies should focus on how glucose
concentration can be adjusted under physiological conditions in TMJ
cells in order to find a treatment for degeneration.
Acknowledgements
The authors would like to thank Dr Jing-ying Liu and
Dr Hui Ren (School of Stomatology, Lanzhou University, Lanzhou,
China) for their assistance in tissue sample preparation and
Professor She-Ning Qi (Department of Histology and Embryology,
School of Basic Medical Sciences, Lanzhou University, Lanzhou,
China) for his linguistic assistance during the preparation of this
manuscript. They also thank Professor Ben-Zhong Zhang (School of
Public Health, Lanzhou University, Lanzhou, China) for his help
with the statistical model and analysis.
Funding
Funding: The present study was supported by the Natural Science
Foundation of Gansu Province (grant no. 21JR7RA161) and the
Fundamental Research Funds for the Central Universities of NWMU
(grant no. 31920220013).
Availability of data and materials
All data generated or analyzed during this study are
included in this published article.
Authors' contributions
HK and GB conceived and designed the project. FD and
PZ participated in cell culture and detection of cell
proliferation, RT-PCR, Seahorse XF Glycolysis stress test, flow
cytometry, fluorescence detection and ELISA. FD, GB and HK
completed the draft preparation. FD and BM performed the
statistical analysis. All authors took part in the discussion and
revision of the manuscript before submission. All authors have read
and approved the final manuscript. FD, HK and GB confirm the
authenticity of all the raw data.
Ethics approval and consent to
participate
All animal procedures were approved by The Animal
Ethics Committee of the School of Stomatology, Northwest Minzu
University (Lanzhou, China) and complied with its requirements
(approval no. XBMZ YX-2021004).
Patient consent for publication
Not applicable.
Competing interests
The authors declare that they have no competing
interests.
References
|
1
|
Gauer RL and Semidey MJ: Diagnosis and
treatment of temporomandibular disorders. Am Fam Physician.
91:378–386. 2015.PubMed/NCBI
|
|
2
|
Murphy MK, MacBarb RF, Wong ME and
Athanasiou KA: Temporomandibular disorders: A review of etiology,
clinical management, and tissue engineering strategies. Int J Oral
Maxillofac Implants. 28:e393–e414. 2013.PubMed/NCBI View Article : Google Scholar
|
|
3
|
Liu F and Steinkeler A: Epidemiology,
diagnosis, and treatment of temporomandibular disorders. Dent Clin
North Am. 57:465–479. 2013.PubMed/NCBI View Article : Google Scholar
|
|
4
|
Tanaka E, Detamore MS and Mercuri LG:
Degenerative disorders of the temporomandibular joint: Etiology,
diagnosis, and treatment. J Dent Res. 87:296–307. 2008.PubMed/NCBI View Article : Google Scholar
|
|
5
|
Lu K, Ma F, Yi D, Yu H, Tong L and Chen D:
Molecular signaling in temporomandibular joint osteoarthritis. J
Orthop Translat. 32:21–27. 2021.PubMed/NCBI View Article : Google Scholar
|
|
6
|
Cha S, Lee SM, Wang J, Zhao Q and Bai D:
Enhanced circadian clock in MSCs-based cytotherapy ameliorates
age-related temporomandibular joint condyle degeneration. Int J Mol
Sci. 22(10632)2021.PubMed/NCBI View Article : Google Scholar
|
|
7
|
Nascimento GC, De Paula BB, Gerlach RF and
Leite-Panissi CRA: Temporomandibular inflammation regulates the
matrix metalloproteinases MMP-2 and MMP-9 in limbic structures. J
Cell Physiol. 236:6571–6580. 2021.PubMed/NCBI View Article : Google Scholar
|
|
8
|
Sagl B, Schmid-Schwap M, Piehslinger E,
Rausch-Fan X and Stavness I: An in silico investigation of the
effect of bolus properties on TMJ loading during mastication. J
Mech Behav Biomed Mater. 124(104836)2021.PubMed/NCBI View Article : Google Scholar
|
|
9
|
Chapman J, Fielder E and Passos JF:
Mitochondrial dysfunction and cell senescence: Deciphering a
complex relationship. FEBS Lett. 593:1566–1579. 2019.PubMed/NCBI View Article : Google Scholar
|
|
10
|
Wu Y, Cisewski SE, Coombs MC, Brown MH,
Wei F, She X, Kern MJ, Gonzalez YM, Gallo LM, Colombo V, et al:
Effect of sustained joint loading on TMJ disc nutrient environment.
J Dent Res. 98:888–895. 2019.PubMed/NCBI View Article : Google Scholar
|
|
11
|
Messina OD, Wilman MV and Neira LF:
Nutrition, osteoarthritis and cartilage metabolism. Ageing Clin Exp
Res. 31:807–813. 2019.PubMed/NCBI View Article : Google Scholar
|
|
12
|
Mamun AA, Hayashi H, Yamamura A, Nayeem MJ
and Sato M: Hypoxia induces the translocation of glucose
transporter 1 to the plasma membrane in vascular endothelial cells.
J Physiol Sci. 70(44)2020.PubMed/NCBI View Article : Google Scholar
|
|
13
|
Richardson SM, Hoyland JA, Mobasheri R,
Csaki C, Shakibaei M and Mobasheri A: Mesenchymal stem cells in
regenerative medicine: Opportunities and challenges for articular
cartilage and intervertebral disc tissue engineering. J Cell
Physiol. 222:23–32. 2010.PubMed/NCBI View Article : Google Scholar
|
|
14
|
Kulkarni AC, Kuppusamy P and Parinandi N:
Oxygen, the lead actor in the pathophysiologic drama: Enactment of
the trinity of normoxia, hypoxia, and hyperoxia in disease and
therapy. Antioxid Redox Signal. 9:1717–1730. 2007.PubMed/NCBI View Article : Google Scholar
|
|
15
|
Adesida AB, Mulet-Sierra A and Jomha NM:
Hypoxia mediated isolation and expansion enhances the chondrogenic
capacity of bone marrow mesenchymal stromal cells. Stem Cell Res
Ther. 3(9)2012.PubMed/NCBI View
Article : Google Scholar
|
|
16
|
Holm S, Maroudas A, Urban JP, Selstam G
and Nachemson A: Nutrition of the intervertebral disc: Solute
transport and metabolism. Connect Tissue Res. 8:101–119.
1981.PubMed/NCBI View Article : Google Scholar
|
|
17
|
Lee RB and Urban JP: Evidence for a
negative Pasteur effect in articular cartilage. Biochem J.
321:95–102. 1997.PubMed/NCBI View Article : Google Scholar
|
|
18
|
Kuo J, Shi C, Cisewski S, Zhang L, Kern MJ
and Yao H: Regional cell density distribution and oxygen
consumption rates in porcine TMJ discs: An explant study.
Osteoarthritis Cartilage. 19:911–918. 2011.PubMed/NCBI View Article : Google Scholar
|
|
19
|
Wright GJ, Kuo J, Shi C, Bacro TR, Slate
EH and Yao H: Effect of mechanical strain on solute diffusion in
human TMJ discs: An electrical conductivity study. Ann Biomed Eng.
41:2349–2357. 2013.PubMed/NCBI View Article : Google Scholar
|
|
20
|
Shi C, Kuo J, Bell PD and Yao H:
Anisotropic solute diffusion tensor in porcine TMJ discs measured
by FRAP with spatial Fourier analysis. Ann Biomed Eng.
38:3398–3408. 2010.PubMed/NCBI View Article : Google Scholar
|
|
21
|
Xiaolan H, Guangjie B, Linglu S, Xue Z,
Shanying B and Hong K: Effect of different oxygen tension on the
cytoskeleton remodeling of sheep temporomandibular joint disc
cells. Hua Xi Kou Qiang Yi Xue Za Zhi. 35:362–367. 2017.PubMed/NCBI View Article : Google Scholar : (In Chinese).
|
|
22
|
Zhang F, Bao G and Tang Y: Effects of
hypoxia on the apoptosis and autophagy of the goat
temporomandibular joint disc cells after serum deprivation. Chin J
Cell Biol. 40:1295–1302. 2018.
|
|
23
|
Cisewski SE, Zhang L, Kuo J, Wright GJ, Wu
Y, Kern MJ and Yao H: The effects of oxygen level and glucose
concentration on the metabolism of porcine TMJ disc cells.
Osteoarthritis Cartilage. 23:1790–1796. 2015.PubMed/NCBI View Article : Google Scholar
|
|
24
|
Mobasheri A, Bondy CA, Moley K, Mendes AF,
Rosa SC, Richardson SM, Hoyland JA, Barrett-Jolley R and Shakibaei
M: Facilitative glucose transporters in articular chondrocytes.
Expression, distribution and functional regulation of GLUT isoforms
by hypoxia, hypoxia mimetics, growth factors and pro-inflammatory
cytokines. Adv Anat Embryol Cell Biol. 200:1–84. 2008.PubMed/NCBI
|
|
25
|
Carling D, Mayer FV, Sanders MJ and
Gamblin SJ: AMP-activated protein kinase: Nature's energy sensor.
Nat Chem Biol. 7:512–518. 2011.PubMed/NCBI View Article : Google Scholar
|
|
26
|
Zheng L, Zhang Z, Sheng P and Mobasheri A:
The role of metabolism in chondrocyte dysfunction and the
progression of osteoarthritis. Ageing Res Rev.
66(101249)2021.PubMed/NCBI View Article : Google Scholar
|
|
27
|
Bibby SR and Urban JP: Effect of nutrient
deprivation on the viability of intervertebral disc cells. Eur
Spine J. 13:695–701. 2004.PubMed/NCBI View Article : Google Scholar
|
|
28
|
Amorim JA, Coppotelli G, Rolo AP, Palmeira
CM, Ross JM and Sinclair DA: Mitochondrial and metabolic
dysfunction in ageing and age-related diseases. Nat Rev Endocrinol.
18:243–258. 2022.PubMed/NCBI View Article : Google Scholar
|
|
29
|
Ramasamy TS, Yee YM and Khan IM:
Chondrocyte aging: The molecular determinants and therapeutic
opportunities. Front Cell Dev Biol. 9(625497)2021.PubMed/NCBI View Article : Google Scholar
|
|
30
|
Gogvadze V and Orrenius S: Mitochondrial
regulation of apoptotic cell death. Chem Biol Interact. 163:4–14.
2006.PubMed/NCBI View Article : Google Scholar
|
|
31
|
Henrotin Y, Kurz B and Aigner T: Oxygen
and reactive oxygen species in cartilage degradation: Friends or
foes? Osteoarthritis Cartilage. 13:643–654. 2005.PubMed/NCBI View Article : Google Scholar
|
|
32
|
Petursson F, Husa M, June R, Lotz M,
Terkeltaub R and Liu-Bryan R: Linked decreases in liver kinase B1
and AMP-activated protein kinase activity modulate matrix catabolic
responses to biomechanical injury in chondrocytes. Arthritis Res
Ther. 15(R77)2013.PubMed/NCBI View
Article : Google Scholar
|
|
33
|
Terkeltaub R, Yang B, Lotz M and Liu-Bryan
R: Chondrocyte AMP-activated protein kinase activity suppresses
matrix degradation responses to proinflammatory cytokines
interleukin-1β and tumor necrosis factor α. Arthritis Rheum.
63:1928–1937. 2011.PubMed/NCBI View Article : Google Scholar
|
|
34
|
Wang Y, Zhao X, Lotz M, Terkeltaub R and
Liu-Bryan R: Mitochondrial biogenesis is impaired in osteoarthritis
chondrocytes but reversible via peroxisome proliferator-activated
receptor γ coactivator 1α. Arthritis Rheumatol. 67:2141–2153.
2015.PubMed/NCBI View Article : Google Scholar
|
|
35
|
Andris F and Leo O: AMPK in lymphocyte
metabolism and function. Int Rev Immunol. 34:67–81. 2015.PubMed/NCBI View Article : Google Scholar
|
|
36
|
Cisewski SE, Wu Y, Damon BJ, Sachs BL,
Kern MJ and Yao H: Comparison of oxygen consumption rates of
nondegenerate and degenerate human intervertebral disc cells. Spine
(Phila Pa 1976). 43:E60–E67. 2018.PubMed/NCBI View Article : Google Scholar
|
|
37
|
Adesida AB, Mulet-Sierra A, Laouar L and
Jomha NM: Oxygen tension is a determinant of the matrix-forming
phenotype of cultured human meniscal fibrochondrocytes. PLoS One.
7(e39339)2012.PubMed/NCBI View Article : Google Scholar
|
|
38
|
Di Magno L, Di Pastena F, Bordone R, Coni
S and Canettieri G: The mechanism of action of biguanides: New
answers to a complex question. Cancers (Basel).
14(3220)2022.PubMed/NCBI View Article : Google Scholar
|
|
39
|
Zhou J, Yang Z, Shen R, Zhong W, Zheng H,
Chen Z, Tang J and Zhu J: Resveratrol improves mitochondrial
biogenesis function and activates PGC-1α pathway in a preclinical
model of early brain injury following subarachnoid hemorrhage.
Front Mol Biosci. 8(620683)2021.PubMed/NCBI View Article : Google Scholar
|