Introduction
Osteoarthritis (OA) is a chronic and degenerative
disease that involves various structured tissues in the joint on
the basis of cartilage degeneration and bone hyperplasia (1). OA is more common in middle-aged and
elderly individuals and occurs more frequently in weight-bearing
joints and joints that experience more activity. The incidence of
OA is high, and the prevalence increases with age (2). Clinically, OA is characterized by
joint pain, deformation and limited movement. Pathological changes
initially occur in the articular cartilage, and later invade the
subchondral bone plate and synovial tissues surrounding the joint.
Patients with mild OA may not exhibit symptoms, while patients with
severe OA exhibit joint pain, swelling, stiffness, limited
activity, bone hyperplasia and joint weakness. If the arthritic
joint compresses a nerve, it may result in neuronal damage and
cause joint deformity in a patient (3). The primary treatment for OA is to
reduce the weight on a weight-bearing joint and reduce excessive
motion to delay the progress of the disease, and a combination of
patient education, drug therapy, physical therapy and surgery is
also used (4). Prevention and
early treatment of OA are critical; however, the cause of OA
remains unclear. It is generally hypothesized to be related to
aging, trauma, inflammation, obesity, metabolism and genetics, and
may also be related to genetic factors, chromosomal abnormalities
and gene fusion (5,6). Therefore, an in-depth study of the
molecular mechanism underlying the development and/or progression
of OA is of particular importance.
With advances in data science, computer science and
biological sequencing technologies, the applications of data mining
have grown substantially. Bioinformatics is a method that combines
computer data science and statistical analysis to mine big
biological datasets in Genomics and Proteomics (7). Bioinformatics can not only analyze
genomic and proteomic data, but also has theoretical and practical
significance for predicting novel genes of potential value
accurately (8).
Previous studies considered cartilage as an
initiating factor in the pathogenesis of OA. Previous studies have
shown that the abnormal changes in subchondral bone also play an
important role (9-11).
However, relatively fewer studies have been performed that focus on
the subchondral bone in OA. Therefore, bioinformatics analysis was
used to explore the core genes in subchondral bone tissues between
healthy patients and patients with OA, and the identified genes
were verified in OA tissues.
Materials and methods
OA subchondral bone dataset
In the present study, the GSE51588 dataset
(https://www.ncbi.nlm.nih.gov/geo/query/acc.cgi?acc=GSE51588)
was downloaded from the GEO online database (www.ncbi.nlm.nih.gov/geo) (12). GSE51588, a whole-genome profiling
study was performed on an Agilent microarray platform and analyzed
using an Agilent GeneSpring GX11.5 (Agilent Technologies, Inc.),
consisted of 40 OA subchondral bone samples and 10 healthy tissue
samples for identification of differentially expressed genes (DEGs)
in OA subchondral bone.
DEGs
The R package limma (version 3.40.6) (13) was used to explore the DEGs between
OA and non-OA subchondral bone tissues. The GSE51588 dataset was
analyzed using the lmFit method for multivariate regression
(13). The Bayes method was used
to calculate the moderated t-statistics, moderated f-statistics and
log ratios of differential expression by empirical Bayesian
adjustment, which aims to shrink the standard errors towards a
common value (13). Volcano plots
were used to visualize the DEGs.
Weighted gene co-expression network
analysis (WGCNA)
First, the median absolute deviation (MAD) of each
gene in the GSE51588 dataset was calculated, eliminating the top
50% of the genes with the smallest MAD. Abnormal data and samples
were removed using the GoodSamplesGenes method in the WGCNA package
(version 1.0) in R (14). A
scale-free co-expression network was further analyzed using WGCNA.
The detailed steps are as follows, first a Pearson correlation
matrix and average linkage method were used for all paired genes.
Next, the power function A_mn=|C_ mn|^β Construct a weighted
adjacency matrix (C_mn=Pearson correlation between Geneum and
Gene_n; A_mn=adjacency between Gene m and Gene n) was used, where β
is a soft threshold parameter that can emphasize a strong
correlation between genes and weaken the impact of weak and
negative correlations. In the third step, selecting 10 as the
appropriate power, a topological overlap matrix (TOM) was
constructed using the adjacency parameter. The corresponding degree
of dissimilarity (1-TOM) was calculated. Finally, the modules with
a distance of <0.25 were merged, resulting in 25 co-expression
modules. The Grey module was considered a gene set that could not
be assigned to any module.
Protein-protein interaction (PPI)
networks
A list of DEGs were input into the STRING database
(https://www.string-db.org/) to construct
a PPI network for prediction of the core genes (confidence level
>0.4). The PPI network formed by STRING was visualized and core
genes were predicted using Cytoscape (version 3.9.1) (15). The PPI network was imported into
Cytoscape, the modules with the best correlation were identified
using MCODE (version 1.0) (16),
and the genes with the best correlation were identified using three
algorithms (MCC, MNC and DMNC), from which the intersection was
obtained. After visualization, the core genes list was
exported.
Functional enrichment analysis
Gene Ontology (GO) and Kyoto Encyclopedia of Genes
and Genomics (KEGG) (17,18) analysis are computational methods
for evaluating gene function and biological pathways. The list of
differential genes screened from the Venn diagram was input into
the KEGG REST API (www.kegg.jp/kegg/rest/keggapi.html). The latest gene
annotation of KEGG pathway was obtained and used as a background to
map each gene into the background set, after which the R package
clusterProfiler (version 3.14.3) (19) was used for enrichment analysis to
obtain the results of gene set enrichment. The genes were annotated
in R using the package org.Hs.eg.db (version 3.1.0) (20) as a background to map the gene to
the background. The minimum gene set was set as 5, whilst the
maximum was set as 5,000. P<0.05 and FDR <0.25 were set as
the significance thresholds.
The Metascape database (https://metascape.org/gp/index.html#/main/step1)
provides a list of annotations and resources and can visually
export them. The Metascape database was used for functional
enrichment analysis and export of the aforementioned differential
gene list.
Gene set enrichment analysis
(GSEA)
GSEA (version 3.0) was used to divide the entire set
into two groups: Subchondral bone OA tissues and normal tissues.
The samples were collected from the Molecular Signatures Database
(https://www.gsea-msigdb.org/gsea/msigdb). A subset of
c2.cp.kegg.v7.4.symbols.gmt was loaded to evaluate the molecular
mechanisms and functions of the related pathways. Based on the gene
expression profile and phenotypic grouping, the minimum gene set
was set to 5, and the maximum gene set was set to 5,000. A thousand
resamples showed that P<0.05 and FDR<0.25 were considered
suitably statistically significant. GO and KEGG analyses were
performed on the entire genome.
Gene expression calorimetry
The R function, heatmap, was used to plot heat maps
of the expression of core genes found by the three algorithms in
the PPI network to visualize the difference in the expression of
core genes between subchondral bone and healthy tissue samples in
OA.
Comparative toxicogenomics database
(CTD) analysis
The CTD database (https://ctdbase.org/) is a publicly available database
that studies the associations between chemicals, genes, phenotypes,
diseases and the environment, and can advance understanding of
chemicals and human health. The database contains several types of
data, including >2.3 million chemical drugs, 46,689 genes, 4,340
phenotypes and 7,212 genes and chemical phenotypes of diseases,
drug-related diseases, gene-related diseases and drug interactions
(21). The core genes were input
into the CTD database to find the most relevant diseases of the
core hub genes, then a radar map of the expression differences of
each gene was drawn using Microsoft Excel (Microsoft
Corporation).
Immunohistochemical staining
The samples were obtained from the Third Hospital of
Hebei Medical University, collected from January 2021 to December
2022. The present study was approved by the Academic Ethics
Committee of the Third Hospital of Hebei Medical University. All
patients provided informed consent for the publication of their
data for use of their materials for scientific research. A total of
15 knee OA and 5 healthy tissue samples from the subchondral bone
of the tibial plateau were fixed in 10% buffered formalin for 24 h
at 25˚C. Subsequently, the tissues were decalcified using 10% EDTA
(pH 7.3) for 6 months at 25˚C and then embedded in paraffin.
Sections (4 µm) of the tissues were processed for immunostaining. A
standard protocol was used to perform the immunohistochemical
staining (22). The sections were
incubated with primary antibodies against collagen type III α1
(COL3A1; 1:500; cat. no. 22734-1-AP; ProteinTech Group, Inc.),
COL5A1 (1:500; cat. no. 67604-1-lg; ProteinTech Group, Inc.),
COL6A2 (1:500; cat. no. 14853-1-AP; ProteinTech Group, Inc.) and
COL12A1 (1:500; cat. no. YT1010; ImmunoWay Biotechnology Company)
overnight at 4˚C. Subsequently, the sections were covered with
secondary antibodies (HRP-goat anti-rabbit; 1:500; cat. no.
GB23303; and HRP-goat anti-mouse; 1:200; cat. no. GB23301; Wuhan
Servicebio Technology Co., Ltd.) against the corresponding species
of primary antibodies and incubated at 25˚C for 50 min. Afterwards,
the sections were developed with DAB and counterstained with
hematoxylin. After dehydration and sealing, the sections were
observed under an optical microscope (Nikon E100) and an imaging
system (Image-Pro Plus 6.0; Media Cybernetics).
microRNA (miRNA/miR)
TargetScan (www.targetscan.org) is an online database for
predicting and analyzing miRNAs and target genes. TargetScan was
used to screen miRNAs that regulated the central DEG.
Statistical analysis
All data were analyzed using GraphPad Prism version
9.0 (GraphPad Software, Inc.). For comparisons between two groups,
an unpaired, 2-tailed Student's t-test was used. The date are
presented as the mean ± standard deviation. The number of repeats
was 6. P<0.05 was considered to indicate a statistically
significant difference.
Results
Functional enrichment analysis of
DEGs
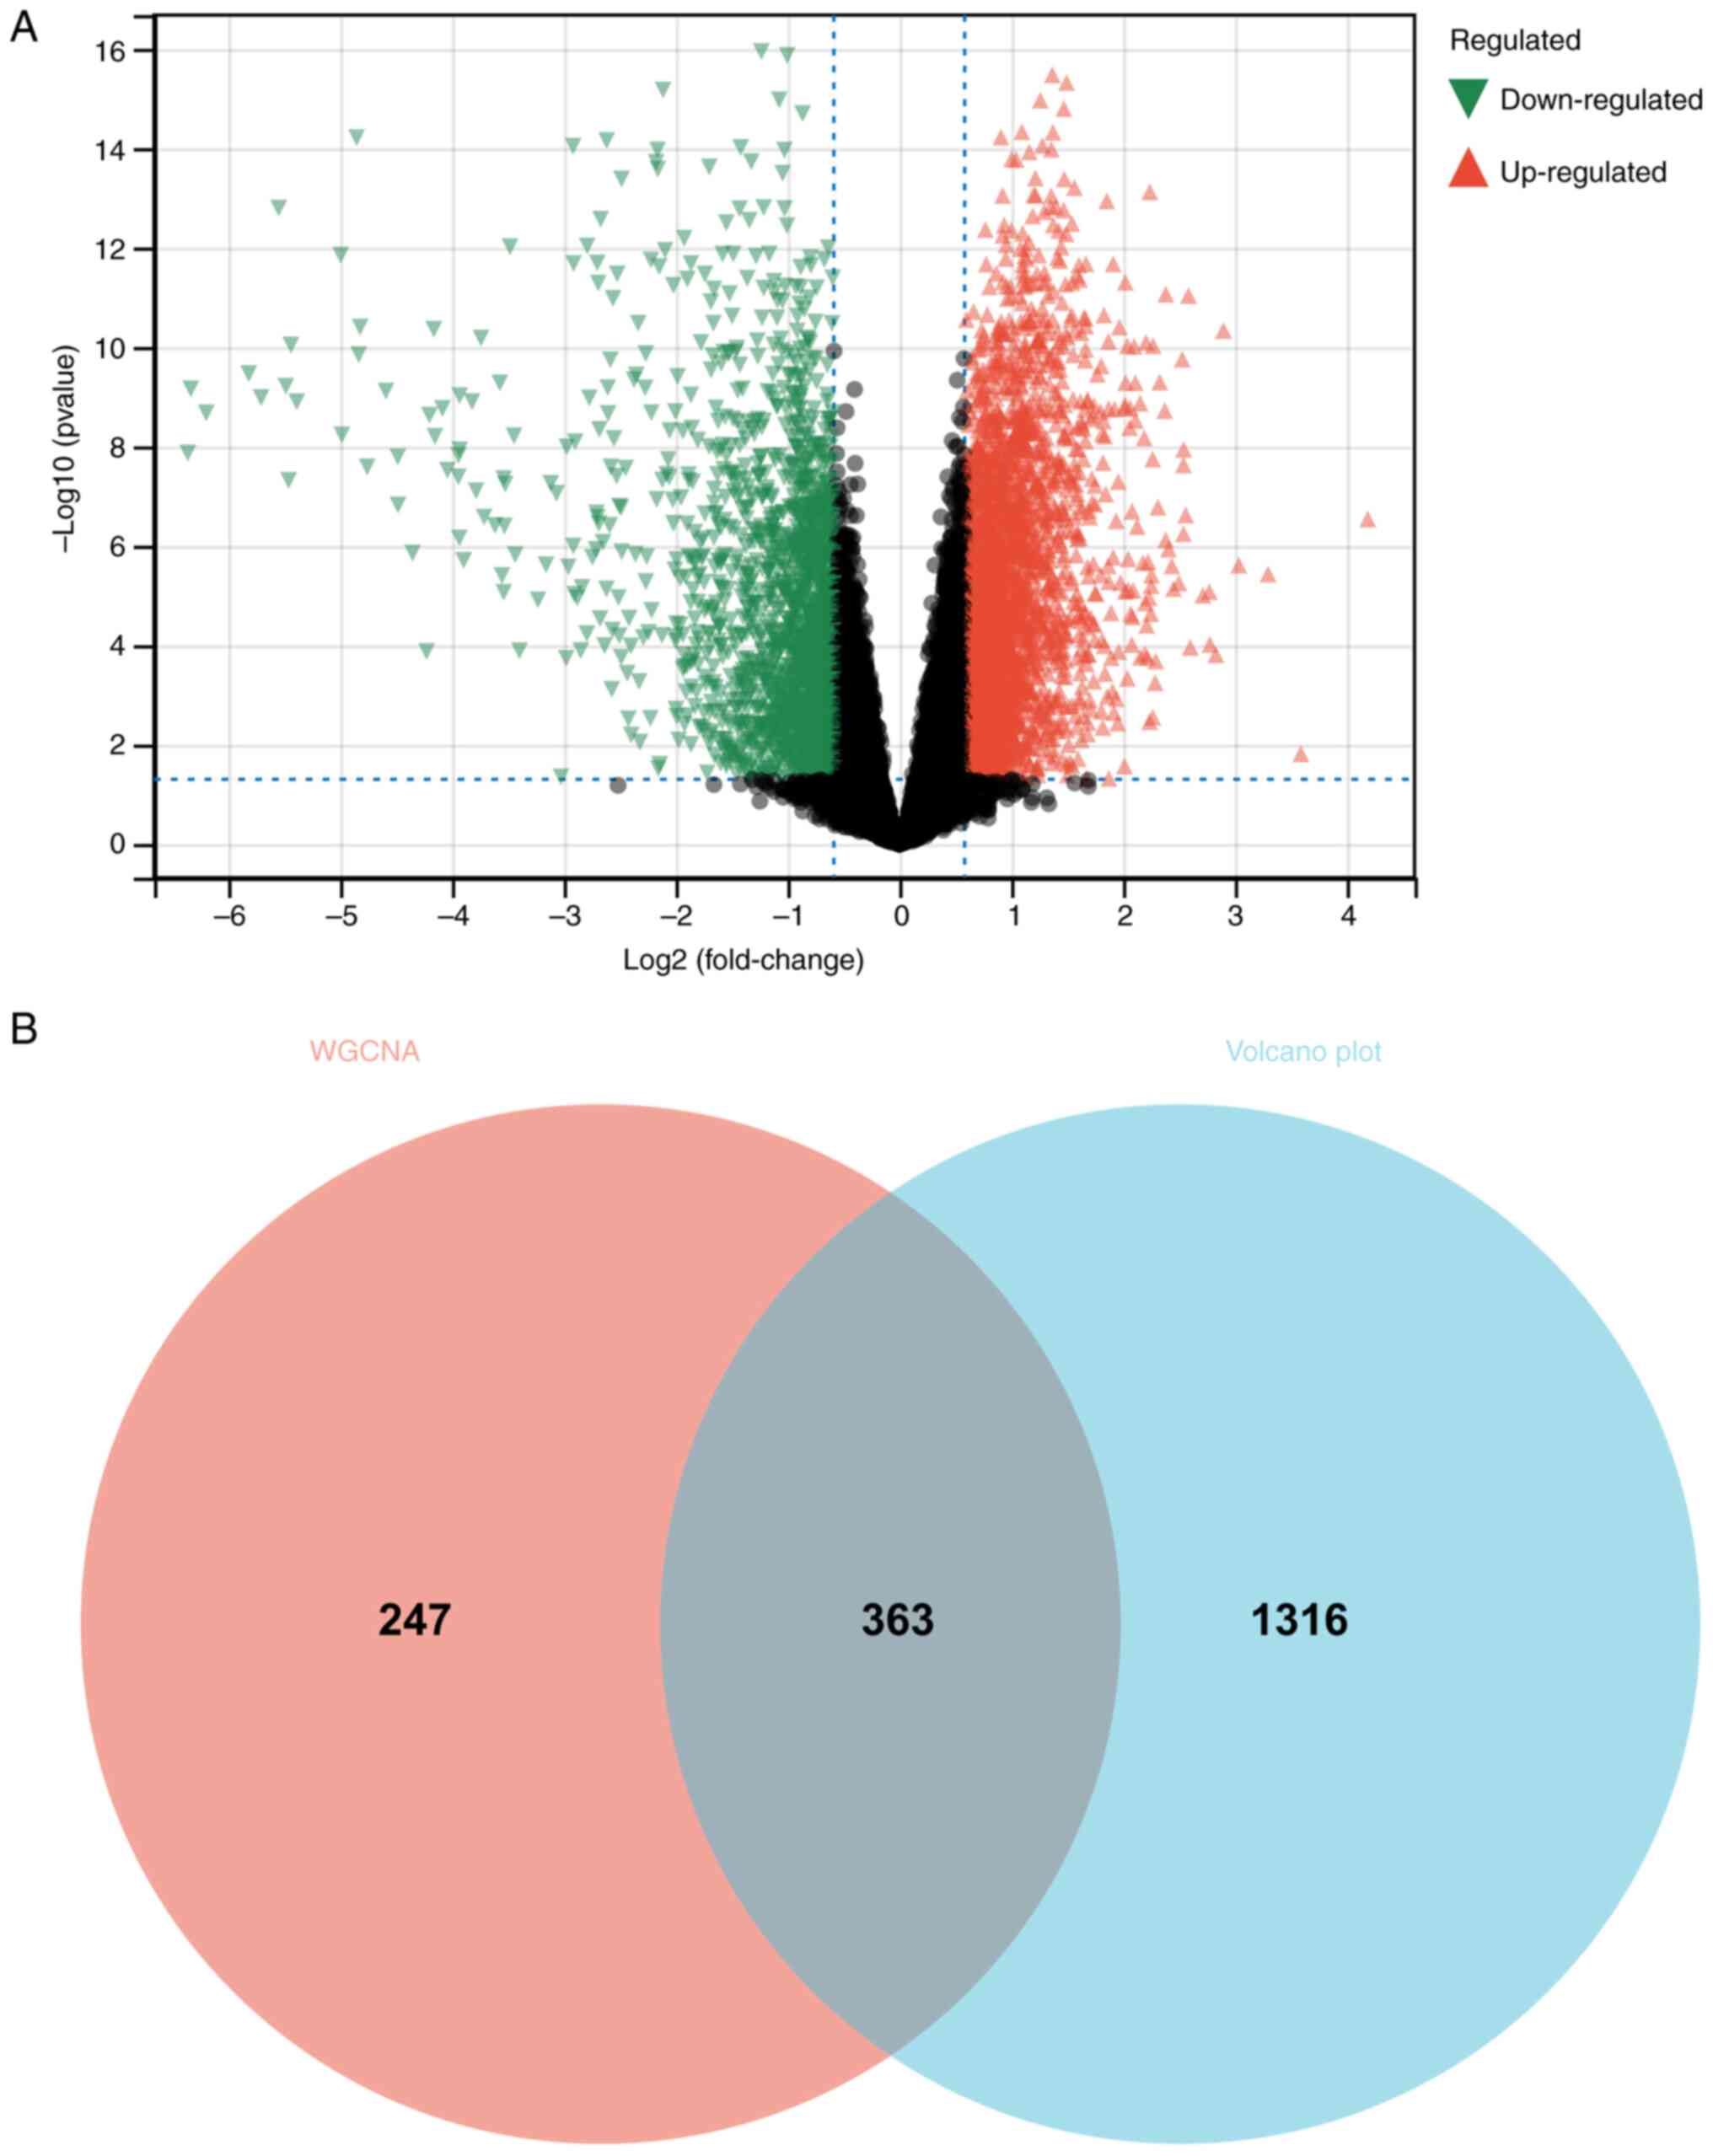
A total of 1,679 DEGs were identified based on the
matrix identification of GSE51588 (Fig. 1A). Next, GO and KEGG analyses were
performed on these DEGs. According to the GO analysis, the DEGs
were enriched in ‘immune system processes’, ‘extracellular region’,
‘secretory granule’, ‘collagen-containing extracellular matrix’,
‘glycosaminoglycan binding’, ‘systemic lupus erythematosus’ and
‘ECM-receptor interaction’ (Fig.
2A, C, E and G).
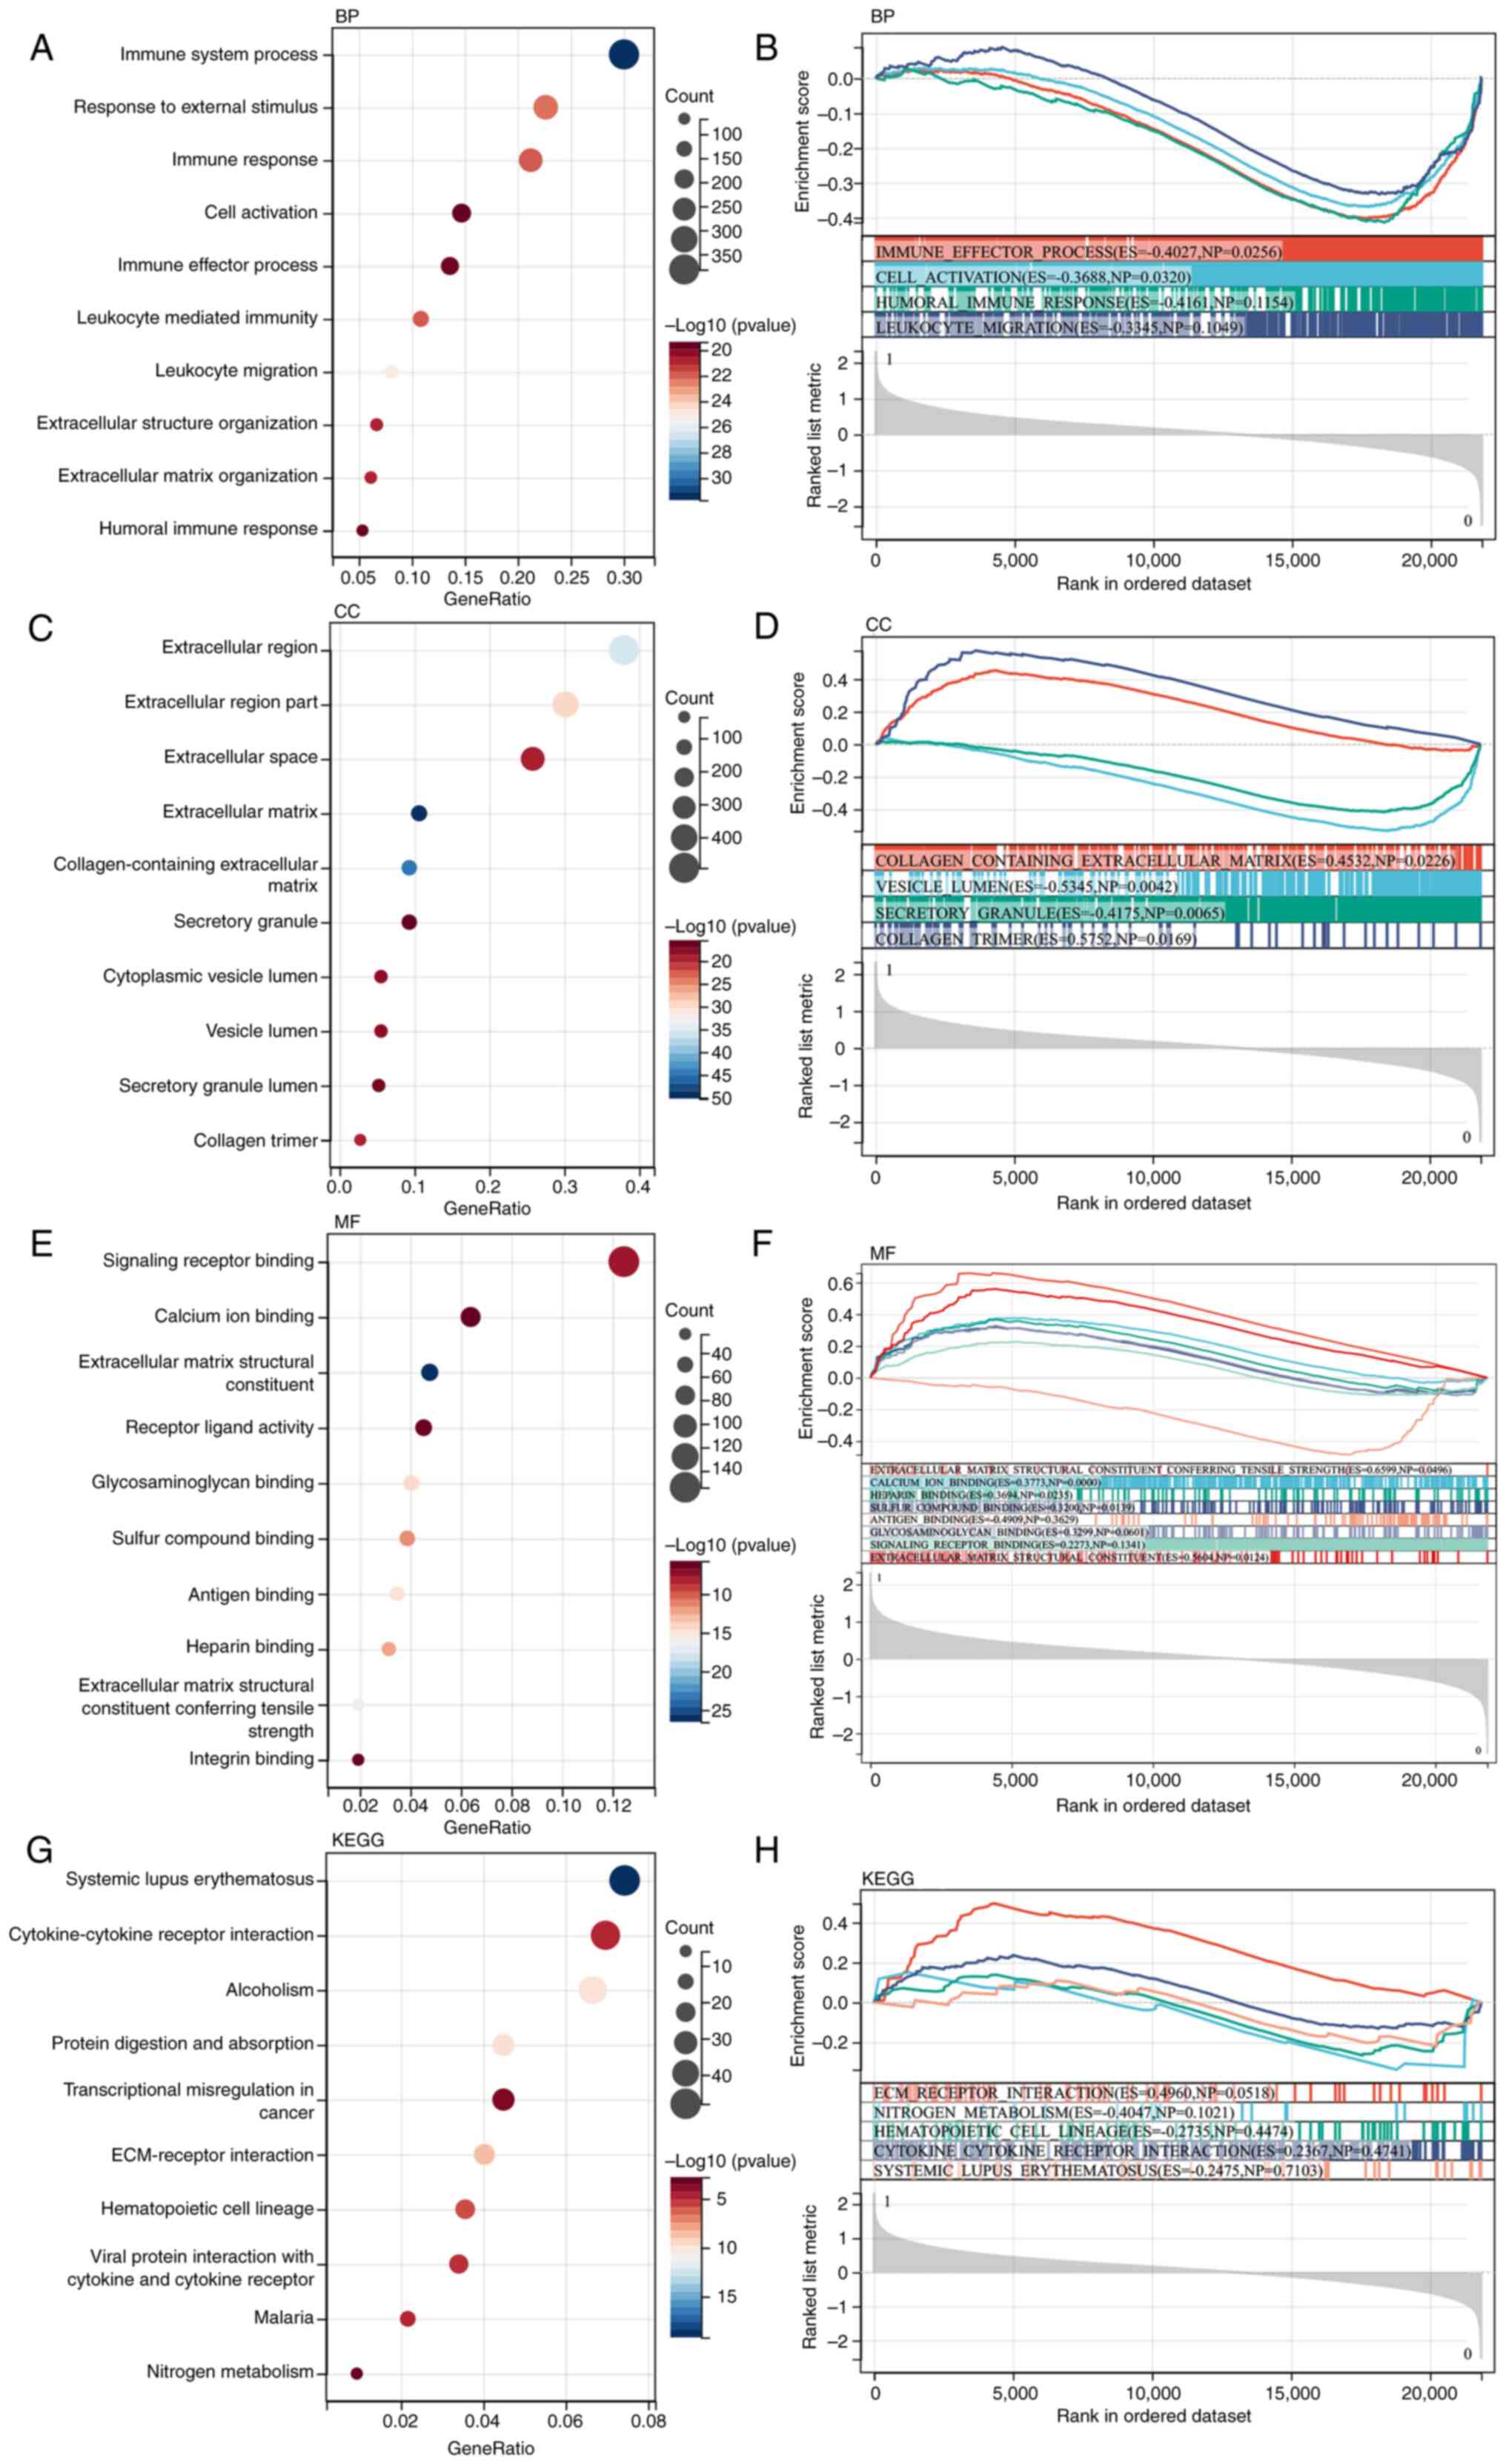 | Figure 2Functional enrichment analysis. DEG
functional enrichment analysis and GSEA. (A and B) BP analysis
showed the DEGs were primarily enriched in the ‘immune effector
process’ and ‘cell activation’. (C and D) CC analysis showed the
DEGs were primarily enriched in the ‘collagen-containing
extracellular matrix’, ‘vesicle lumen’ and ‘secretory granule’. (E
and F) MF analysis showed the DEGs were primarily enriched in the
‘signaling receptor binding’, ‘calcium ion binding’, ‘extracellular
matrix structural constituent’, ‘receptor ligand activity’ and
‘antigen binding’. (G and H) KEGG analysis showed the DEGs were
primarily enriched in the ‘ECM-receptor interaction’ and ‘nitrogen
metabolism’. DEG, differentially expressed gene; GSEA, gene set
enrichment analysis; BP, biological process; CC, cellular
component; MF, molecular function; KEGG, Kyoto Encyclopedia of
Genes and Genomes; ECM, extracellular matrix. |
GSEA
GSEA was performed on the entire genome to identify
possible enrichment items in non-differentially expressed genes. As
shown in Fig. 2B, D, F and
H, the enriched terms were similar
to those identified by GO and KEGG enrichment.
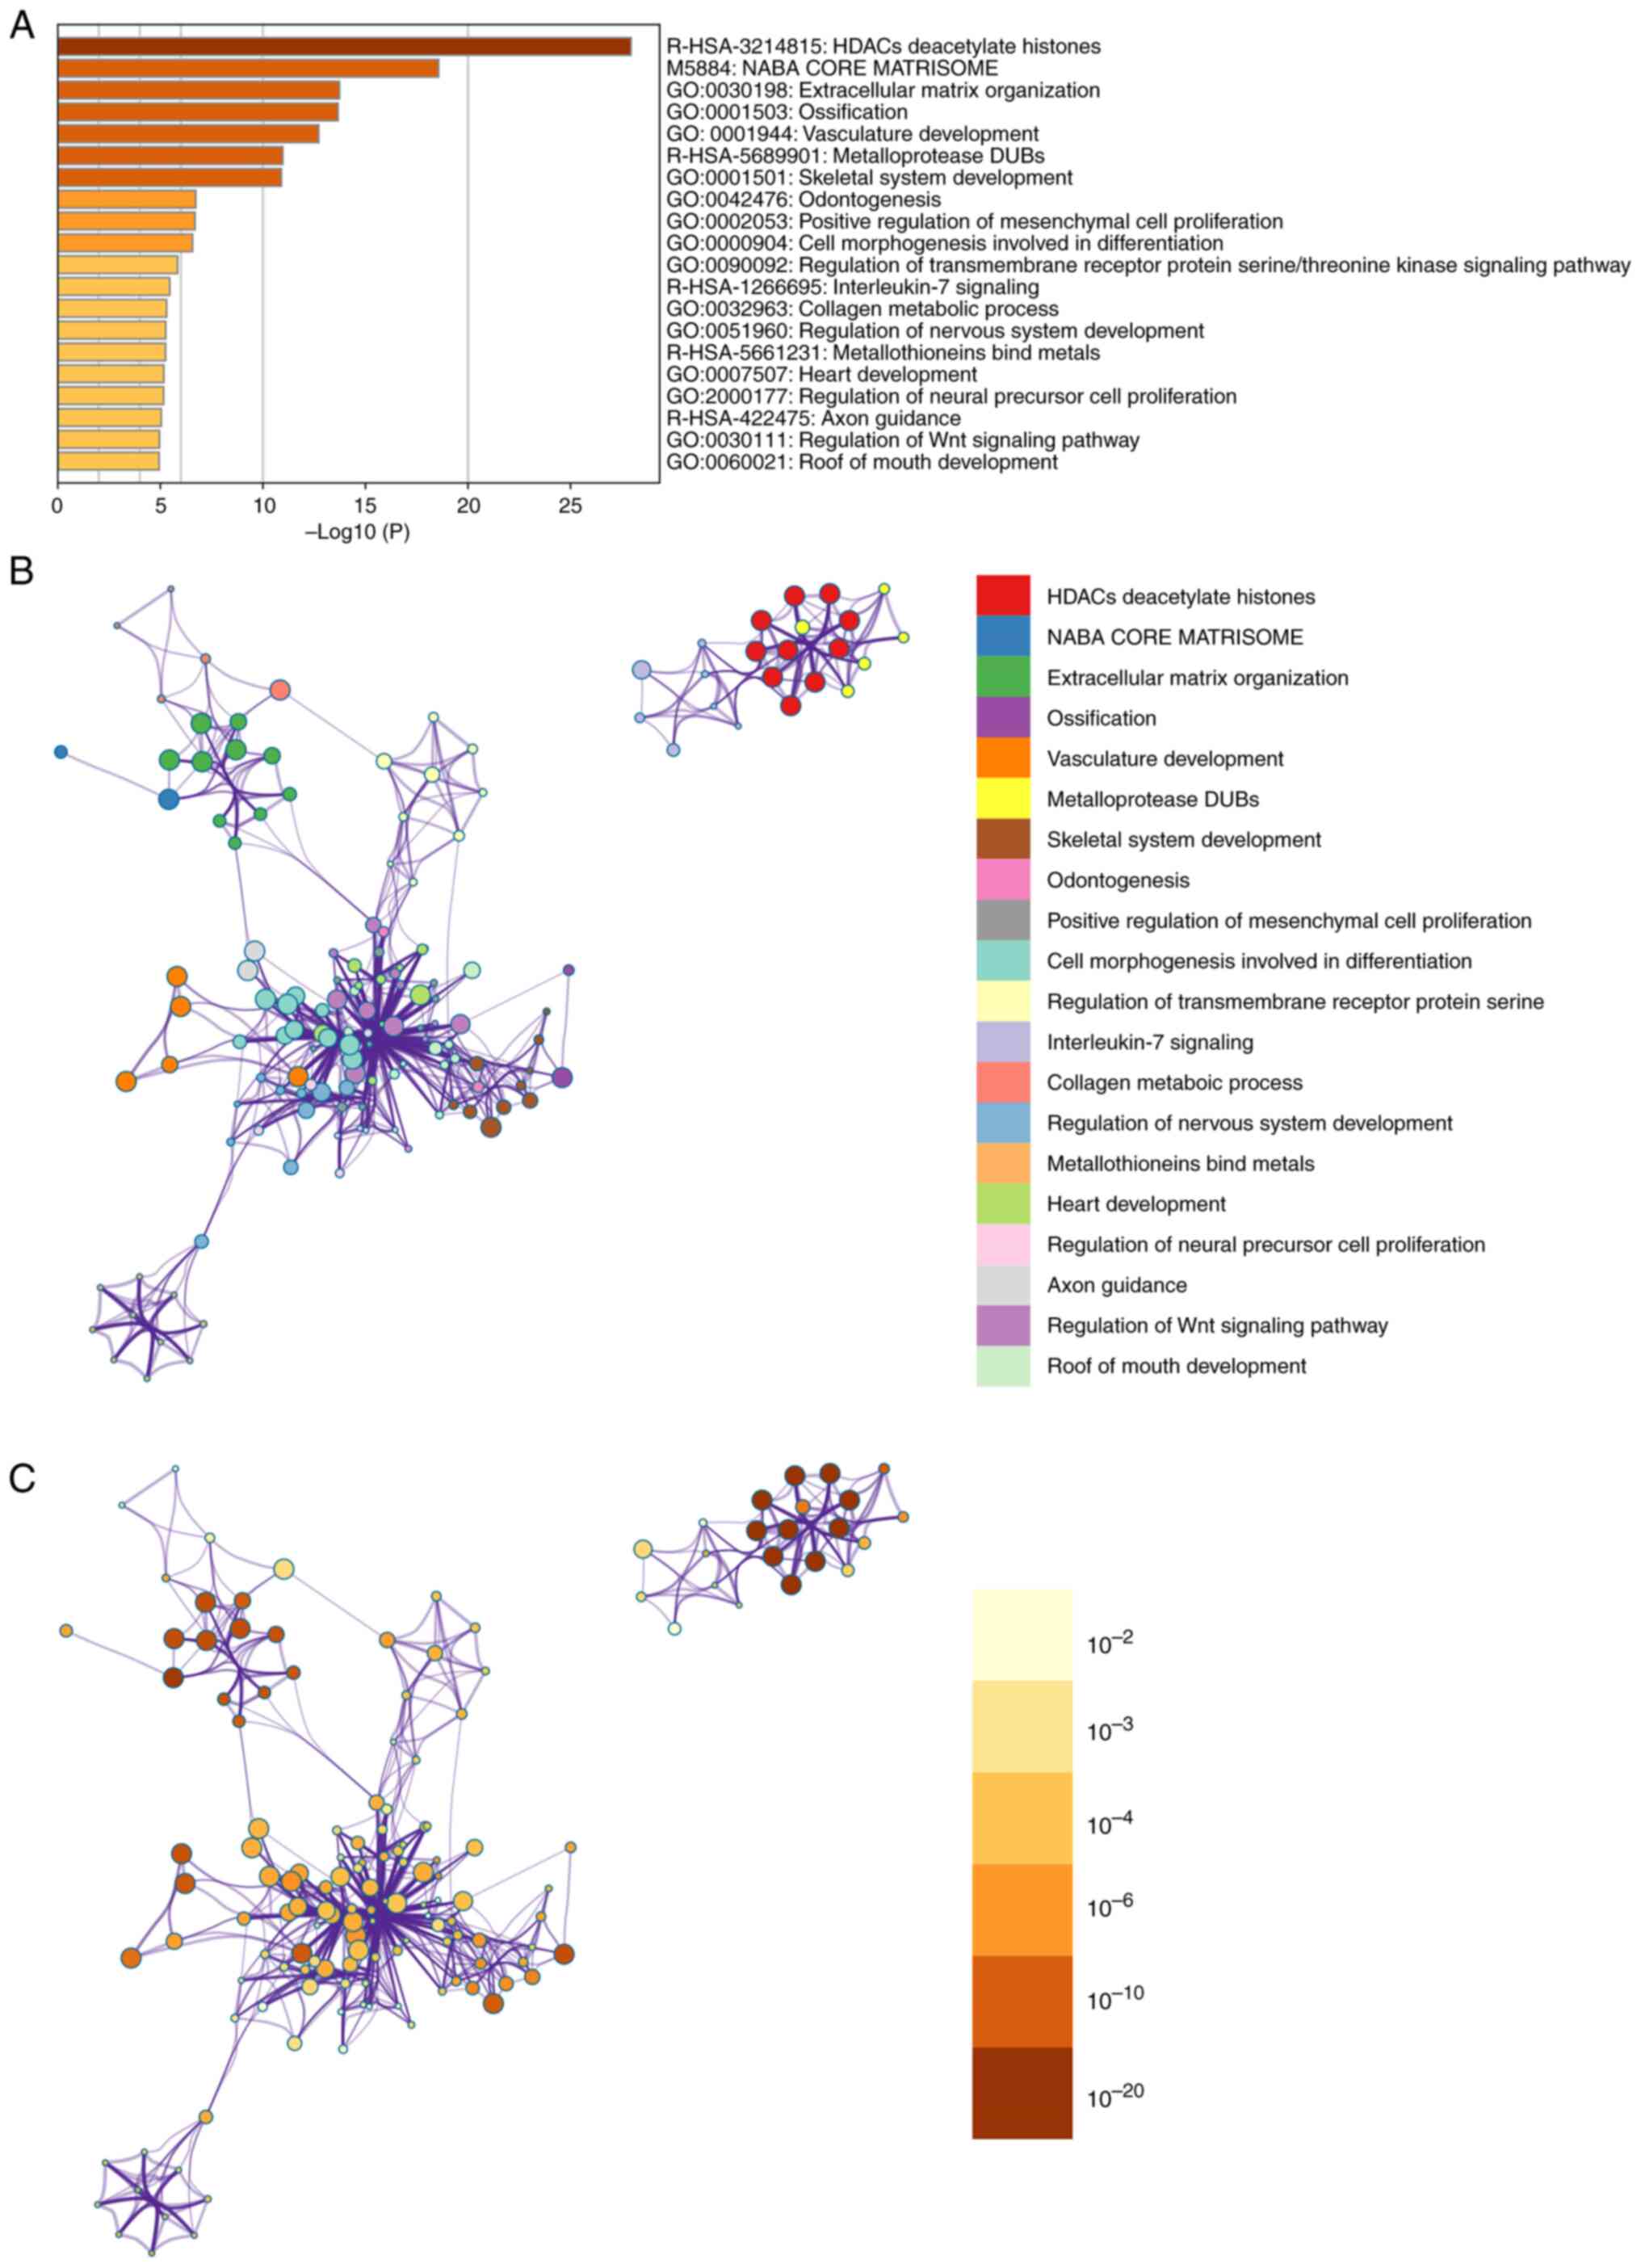
Metascape enrichment analysis
Metascape enrichment includes GO enrichment terms
(Fig. 3A) and enrichment networks
colored with enrichment terms and P-values (Figs. 3B and C, and 4). Fig.
3A) is a bar graph of enriched terms across input gene lists,
colored by P-values. The enrichment results included skeletal
system development, ossification, cell morphogenesis involved in
differentiation, collagen metabolic process and metallothioneins
bind metals. Fig. 3B shows the
network of enriched terms. The enriched results were colored with
cluster ID, where nodes sharing the same cluster ID are typically
close to each other. In Fig. 3C,
the enrichment result items are colored with P-values. Items with
more genes in them tend to have more significant P-values.
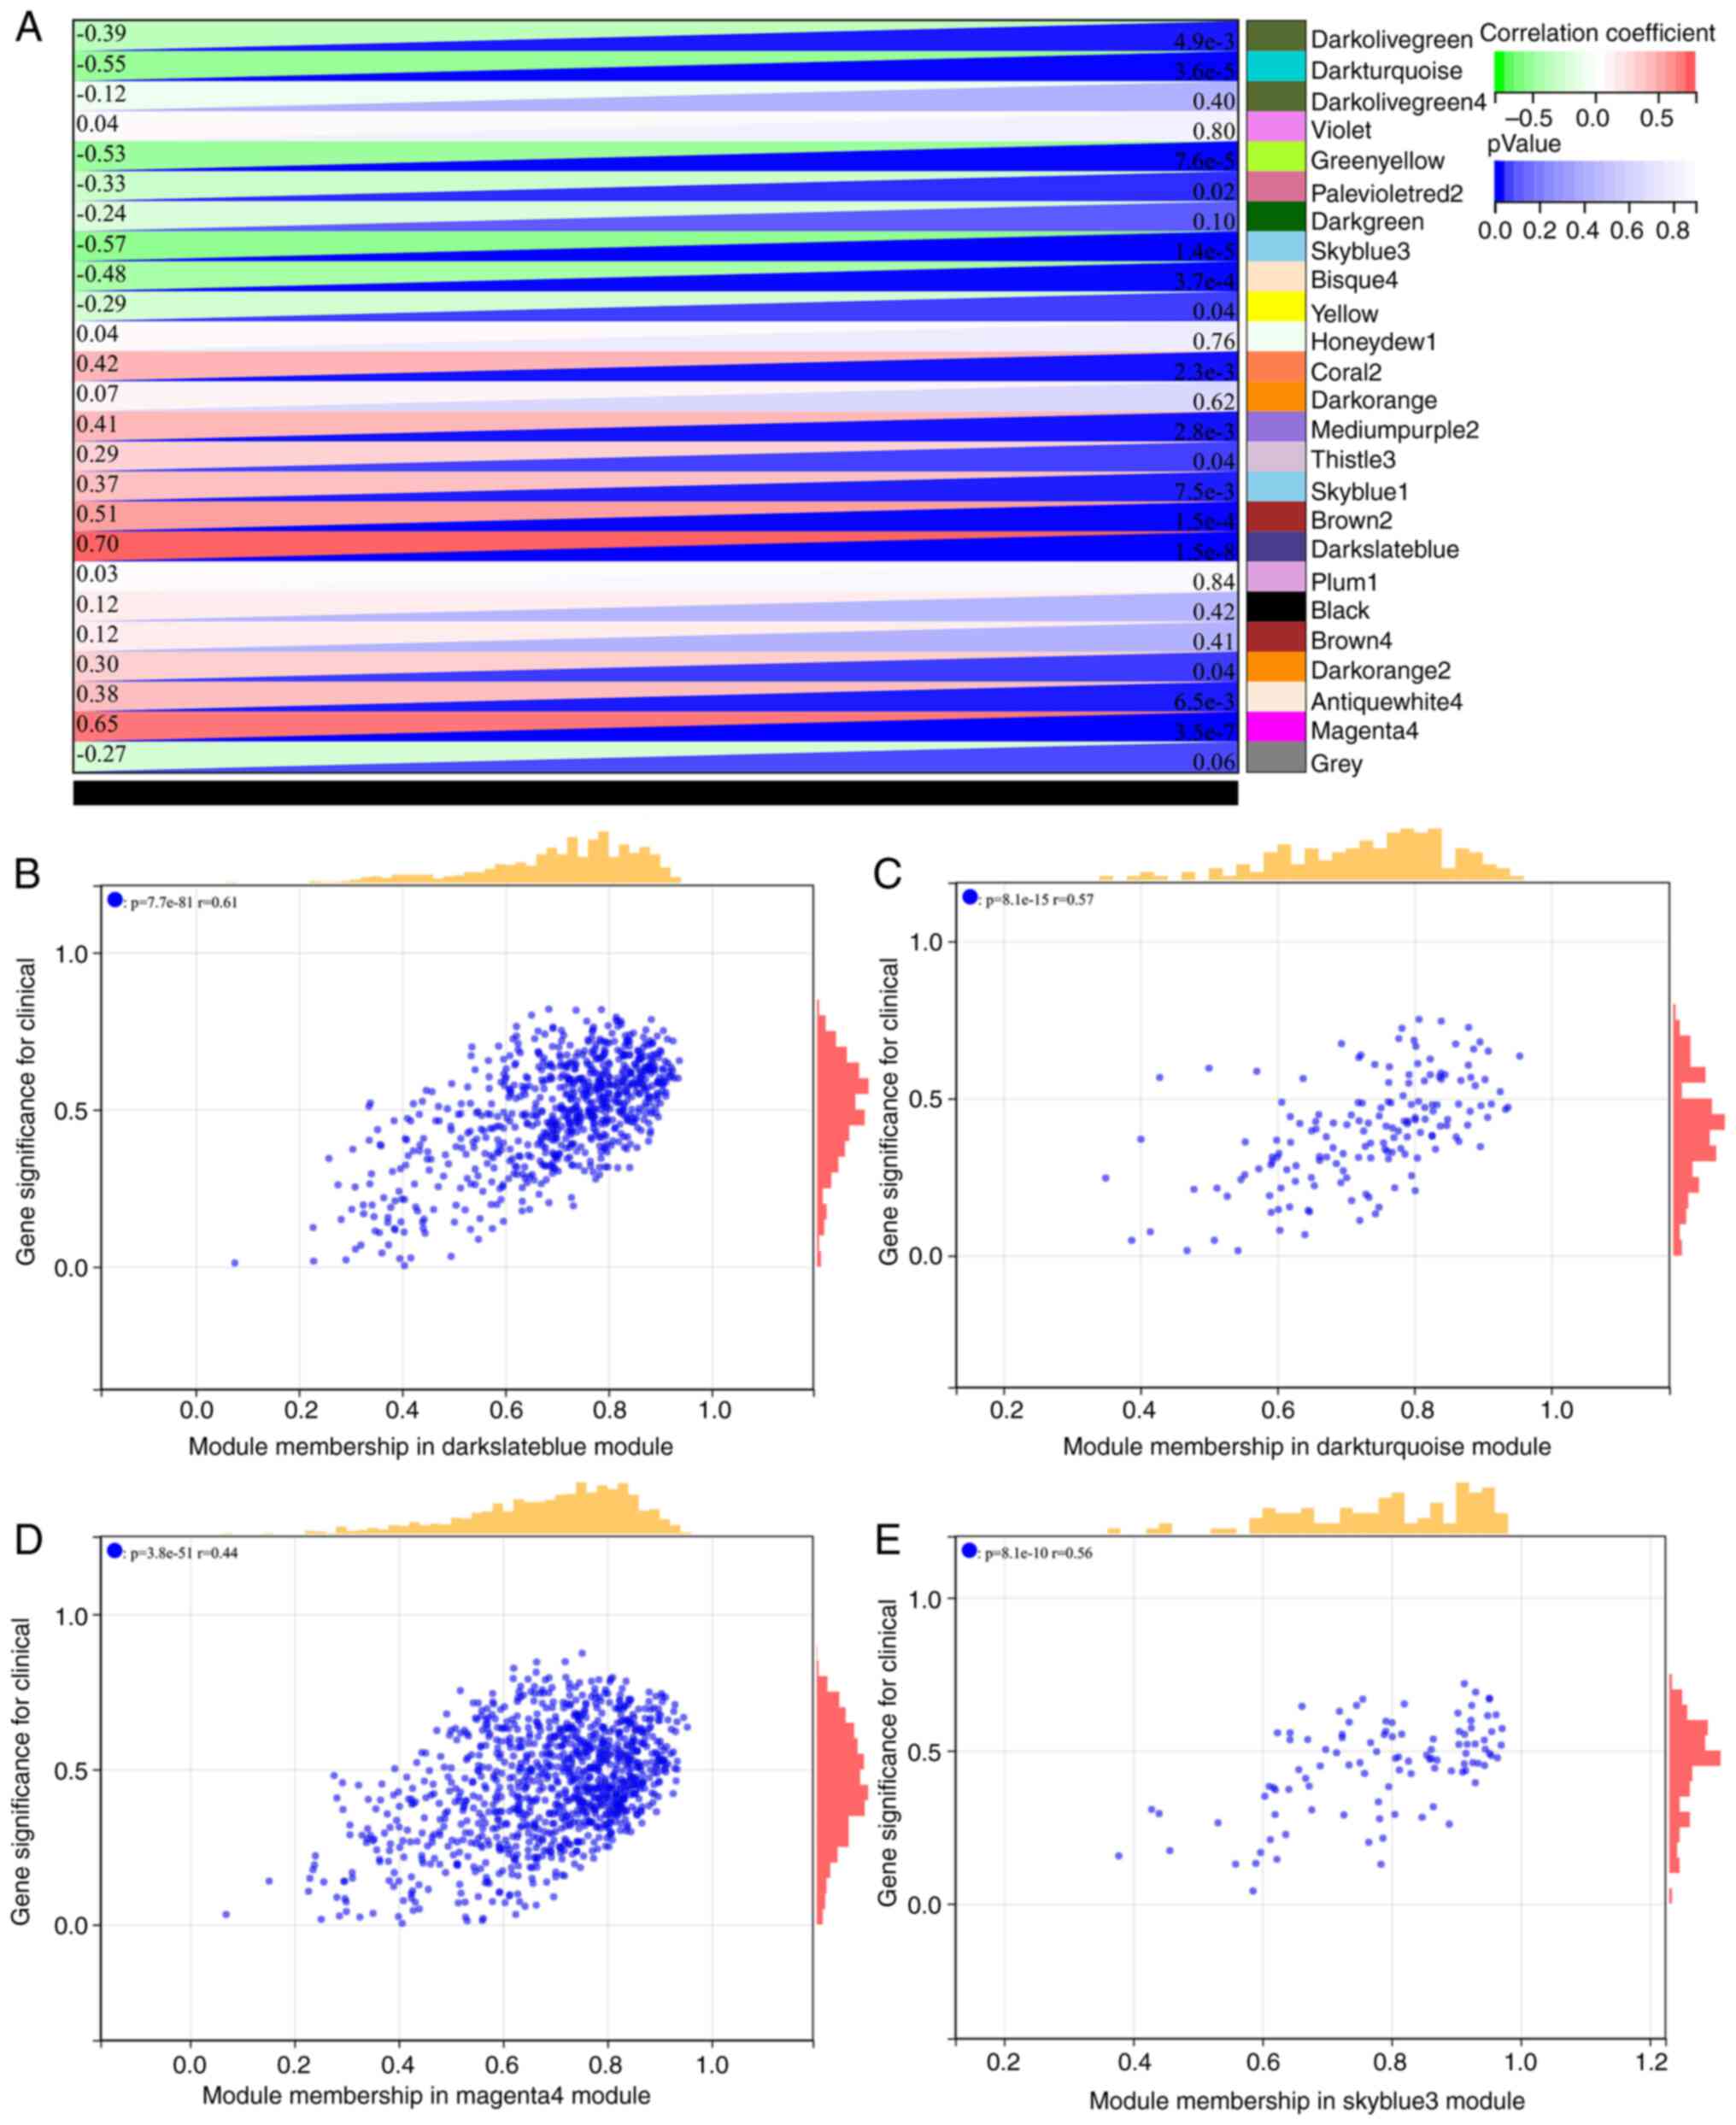
WGCNA
The selection of the soft threshold power is an
important step in WGCNA. Network topology analysis was used to
determine the soft threshold power. The soft threshold power in
WGCNA was set to 9, which is the lowest power for a scaleless
topology fitting index of 0.9 (Fig.
5A and B). A hierarchical
clustering tree of all genes was constructed, and 25 important
modules were generated (Fig. 5C).
The interaction between these modules was then analyzed (Fig. 5D). The module phenotypic
correlation heat map (Fig. 6A) and
the GS MM correlation scatter map of the related hub gene (Fig. 6B-E) were generated. The correlation
between module feature vectors and gene expression was used to
obtain the MM. According to the cutoff criterion (|MM|>0.8),
four genes with high connectivity were identified as hub genes in
clinically significant modules. The Venn diagram was mapped and
intersected using the differential genes screened by WGCNA and
DEGs, and the results are shown in Fig. 1B.
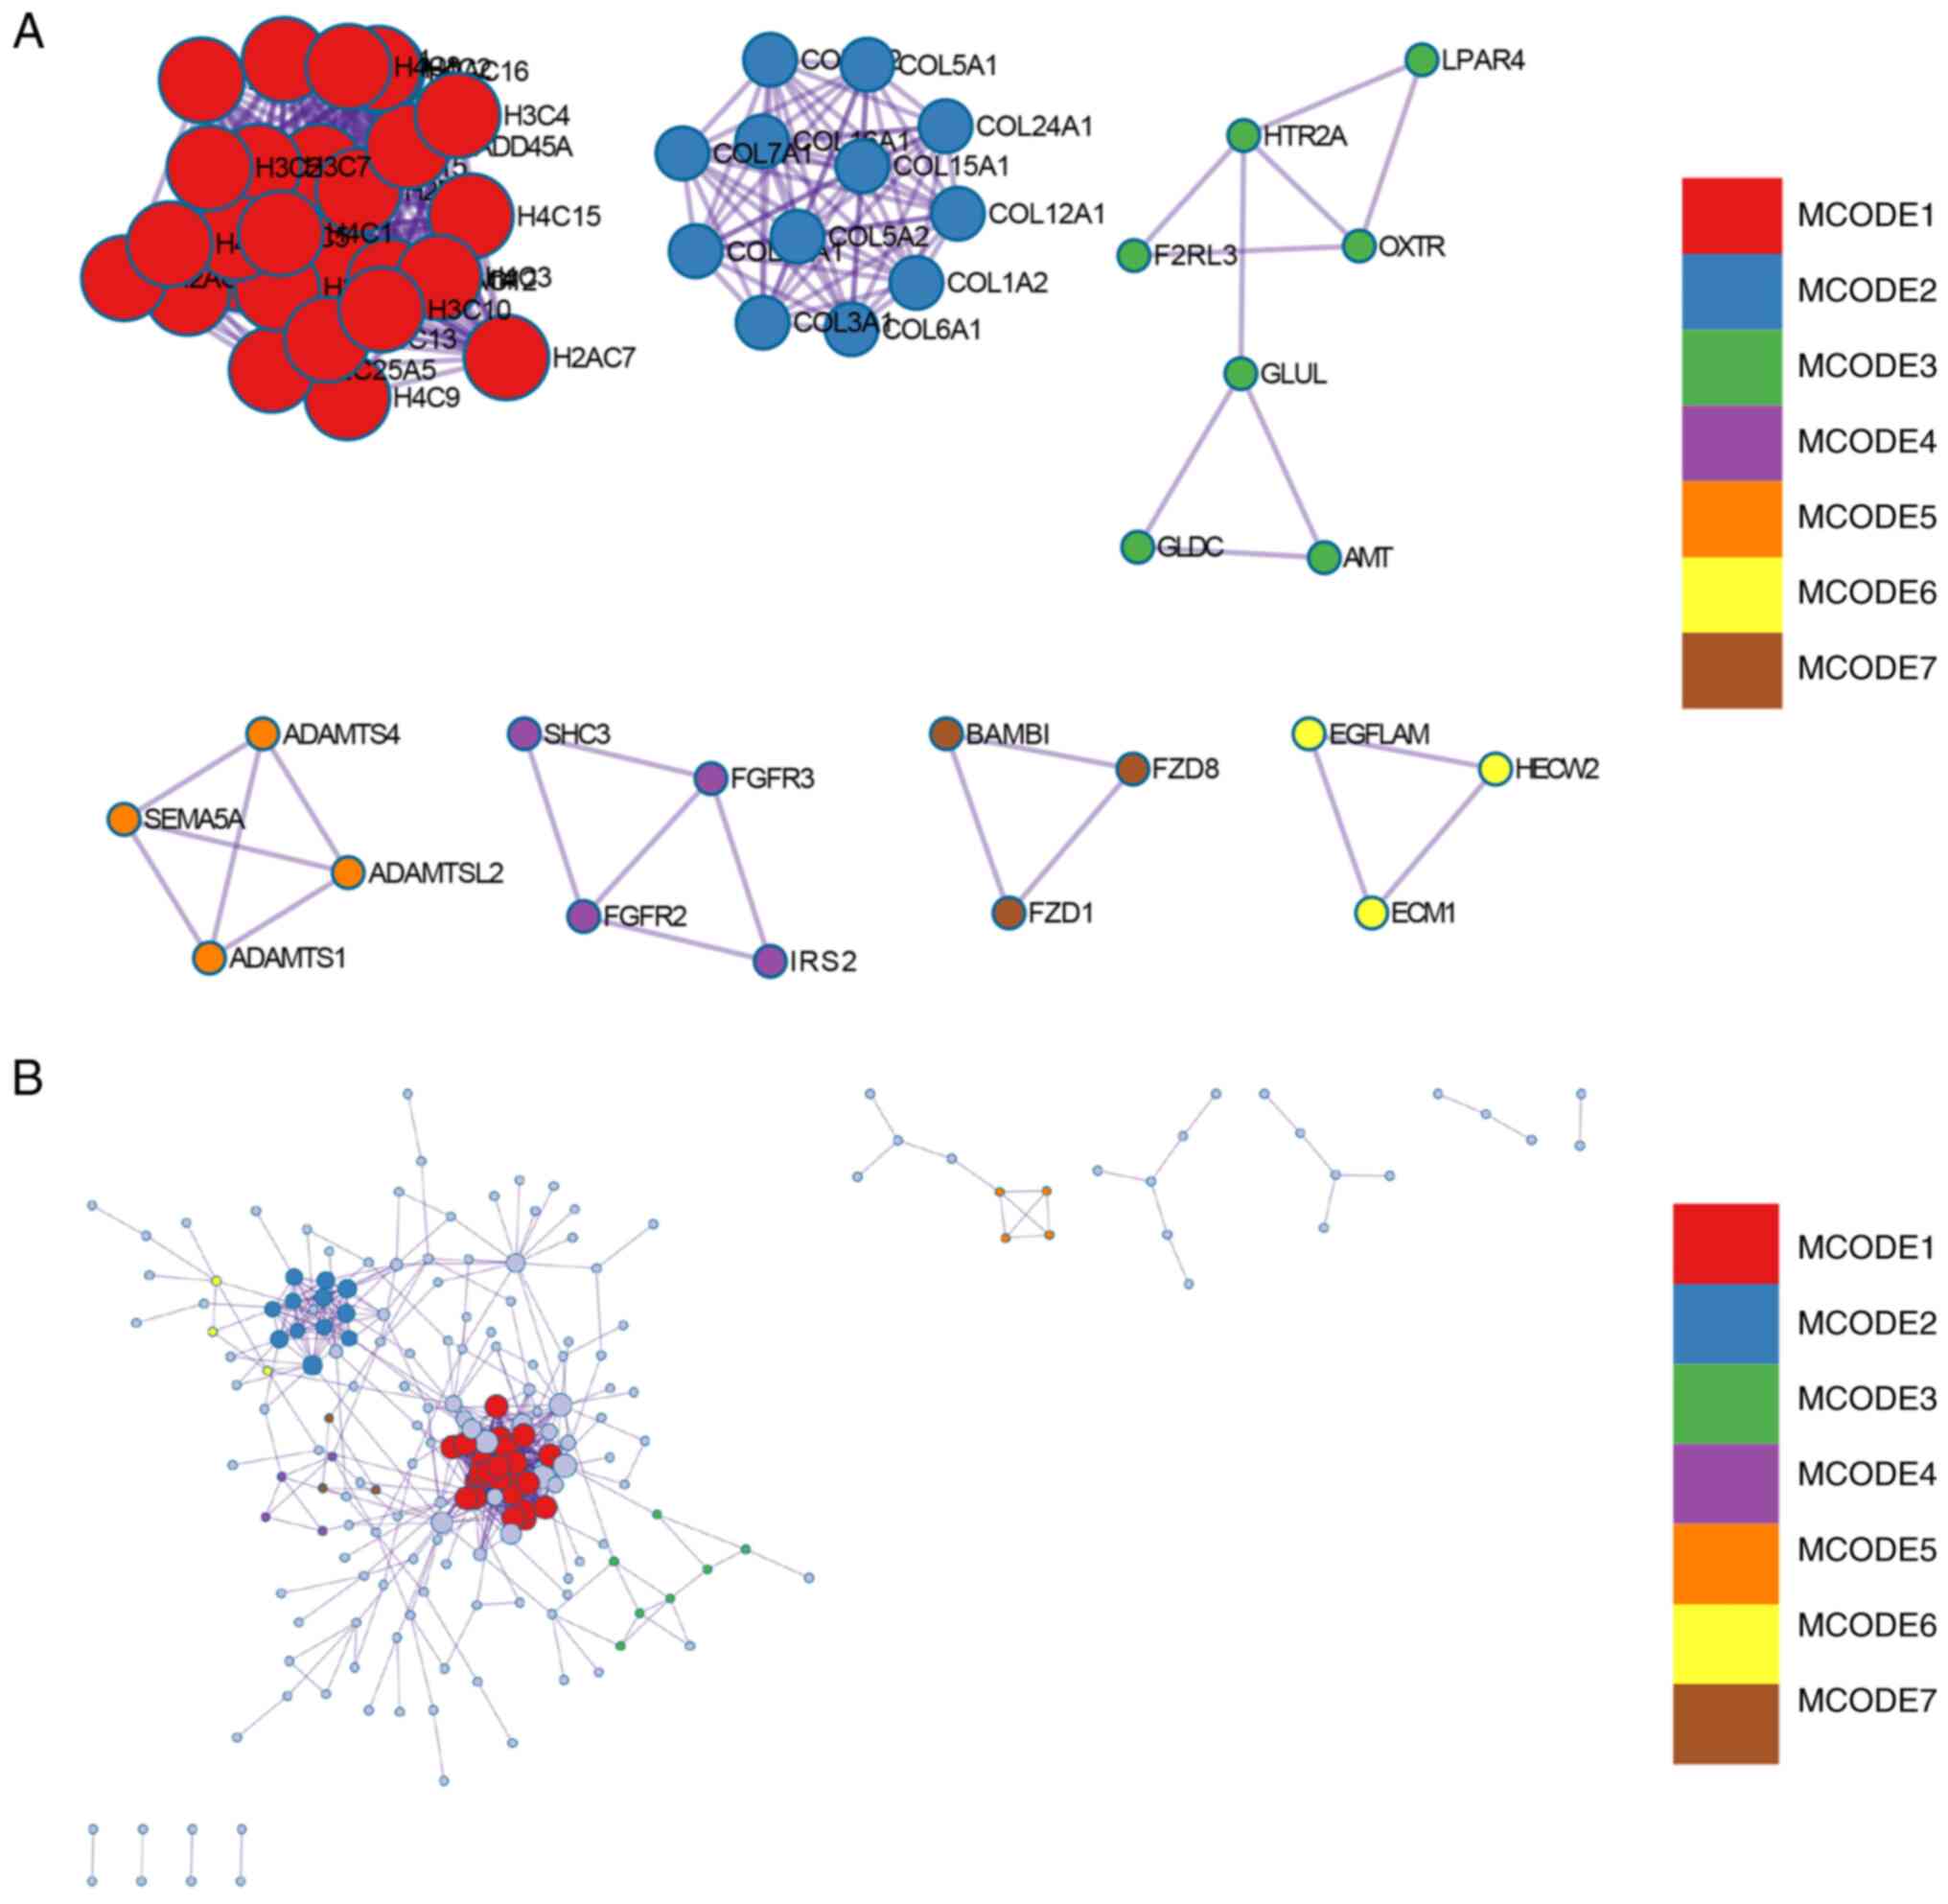
Construction and analysis of the PPI
networks
The PPI network of DEGs was constructed using STRING
and analyzed using Cytoscape (Fig.
7A). Overall, two core gene clusters were obtained (Fig. 7B and C), and three different algorithms were
used to identify central genes (Fig.
7D-F). Based on the intersection of the Venn diagram seven core
genes (COL6A2, COL5A2, COL12A1, COL5A1, COL6A1, LUM, COL3A1) were
obtained (Fig. 7G).
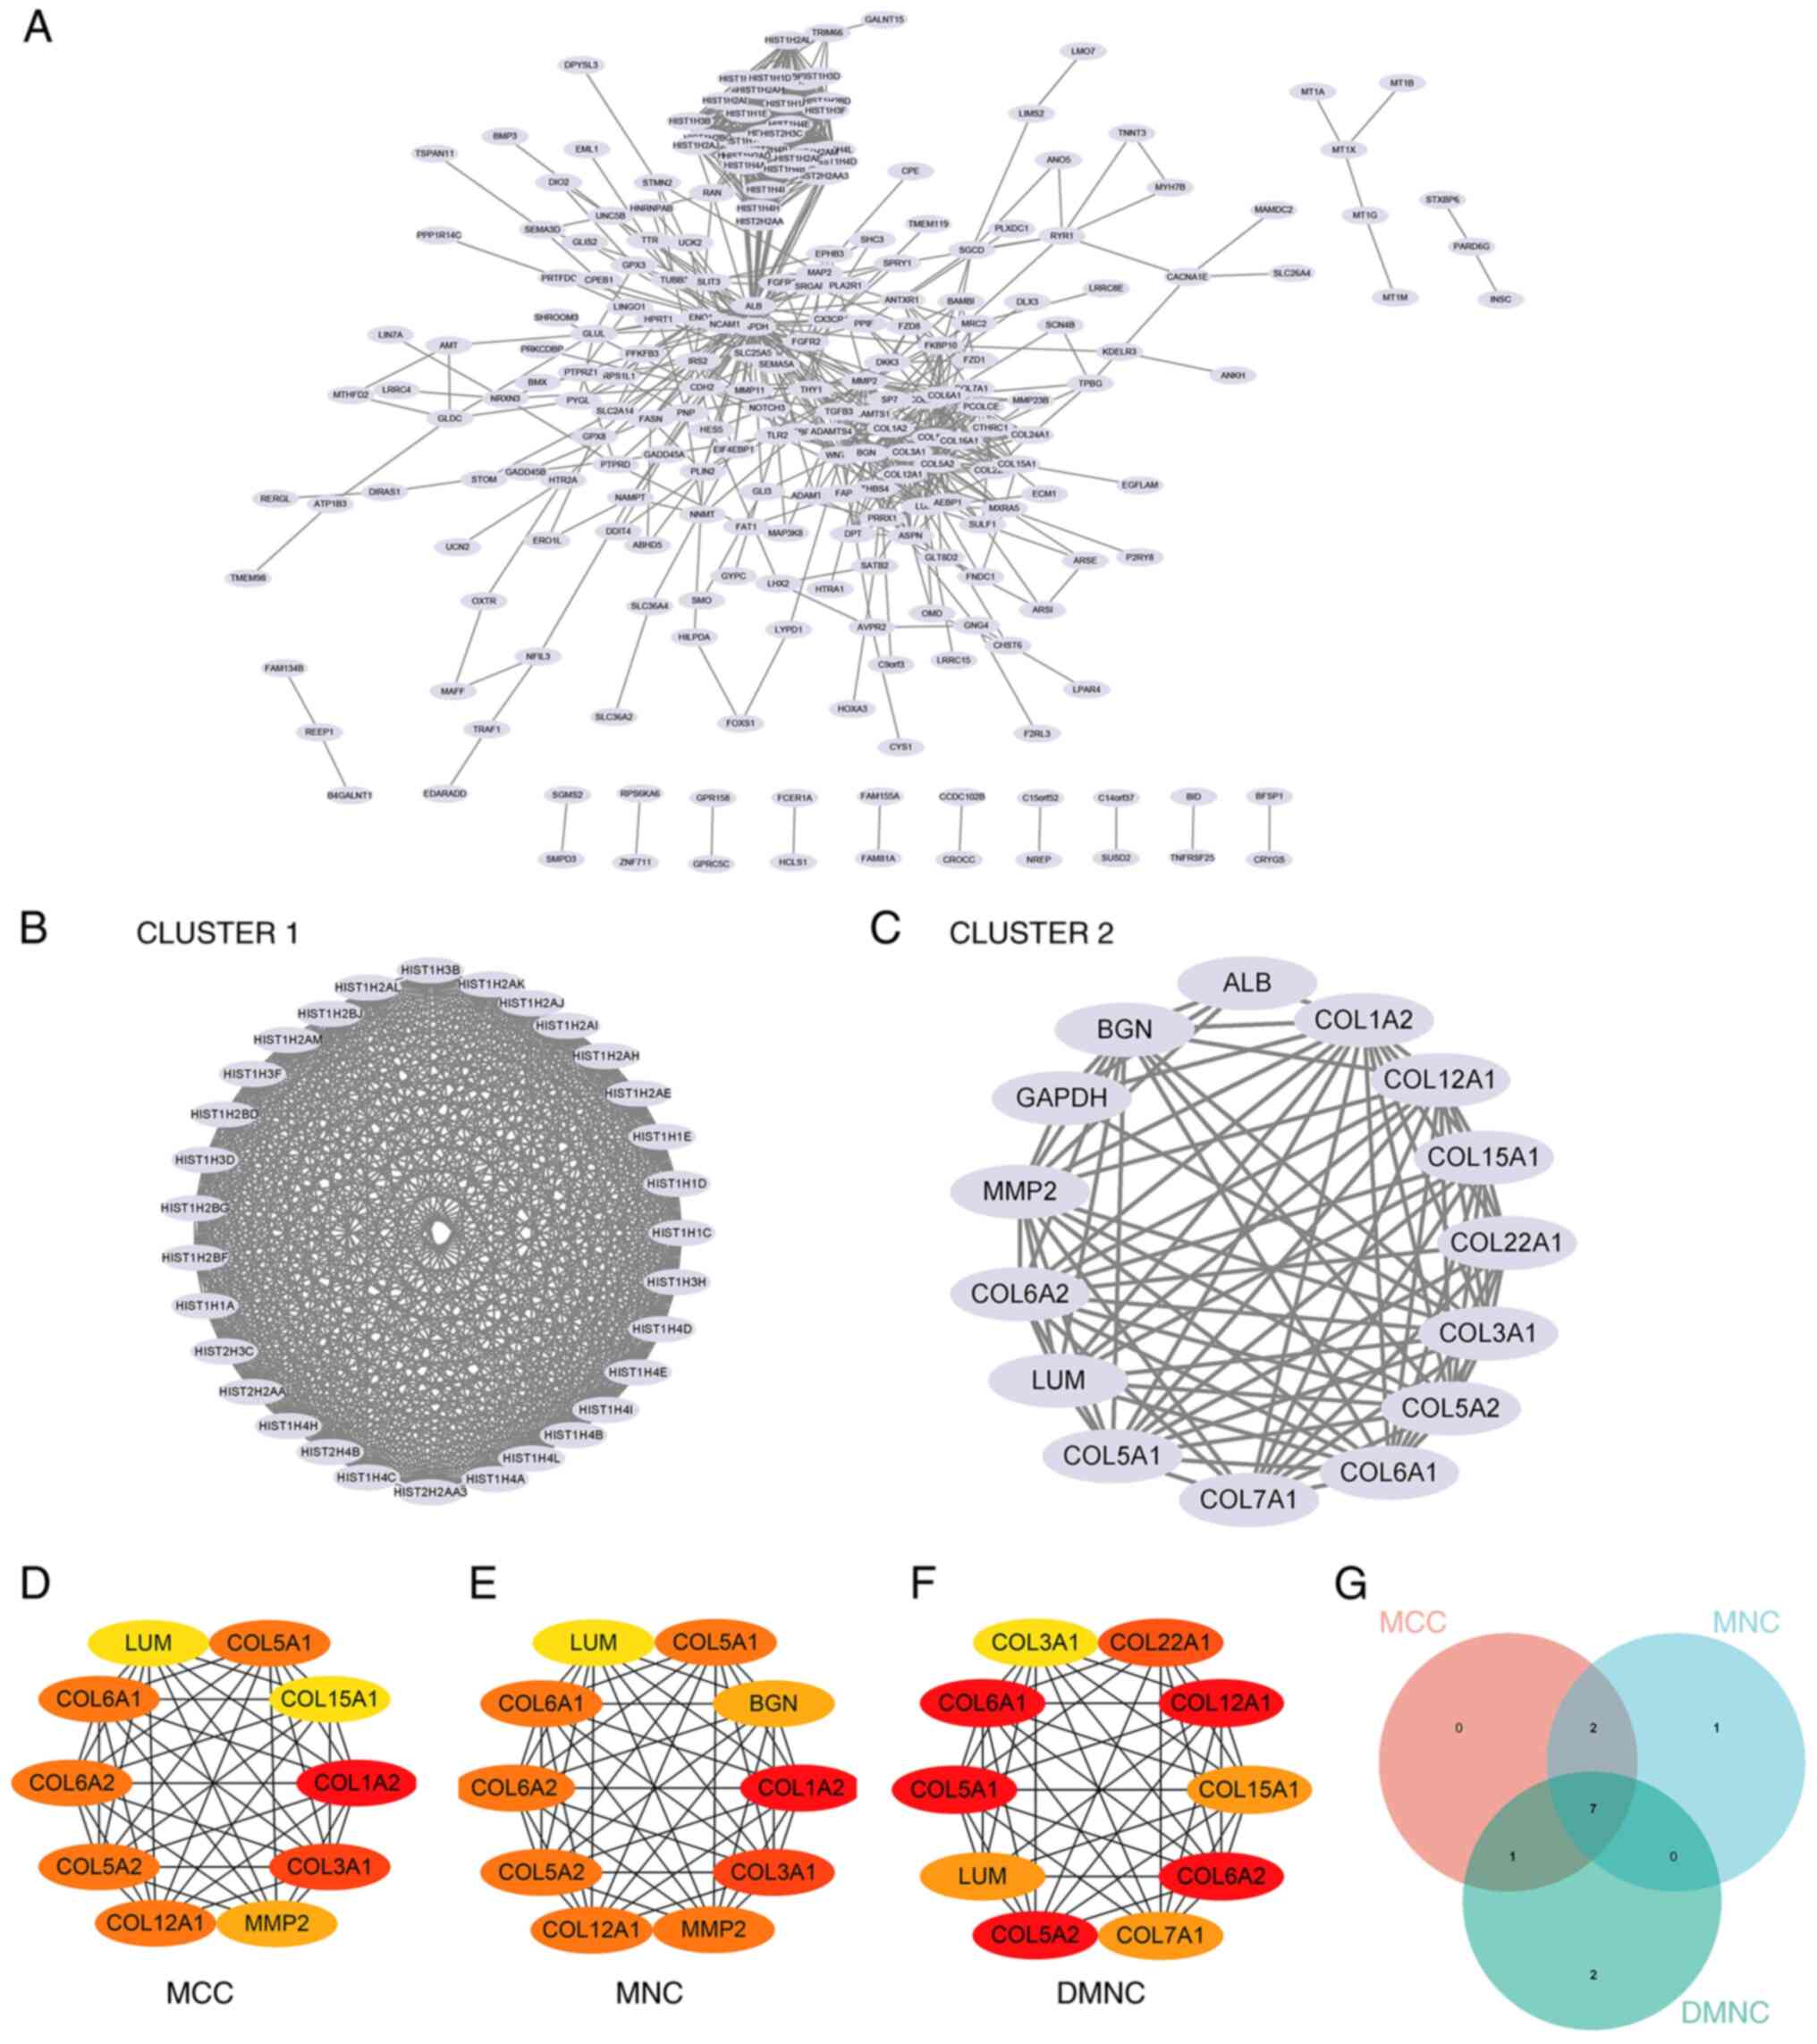 | Figure 7Construction and analysis of the PPI
networks. (A) PPI network of DEGs. (B) Core gene group: CLUSTER1.
(C) Core gene group: CLUSTER1. (D) MCC recognizes central genes.
(E) MNC recognizes central genes. (F) DMNC recognizes central
genes. (G) A Venn diagram was used to obtain the seven core genes:
COL6A2, COL5A2, COL12A1, COL5A1, COL6A1, LUM and COL3A1. PPI,
protein-protein interaction; DEG, differentially expressed gene;
MCC, maximal clique centrality; MNC, maximum neighborhood
component; DMNC, density of MNC. |
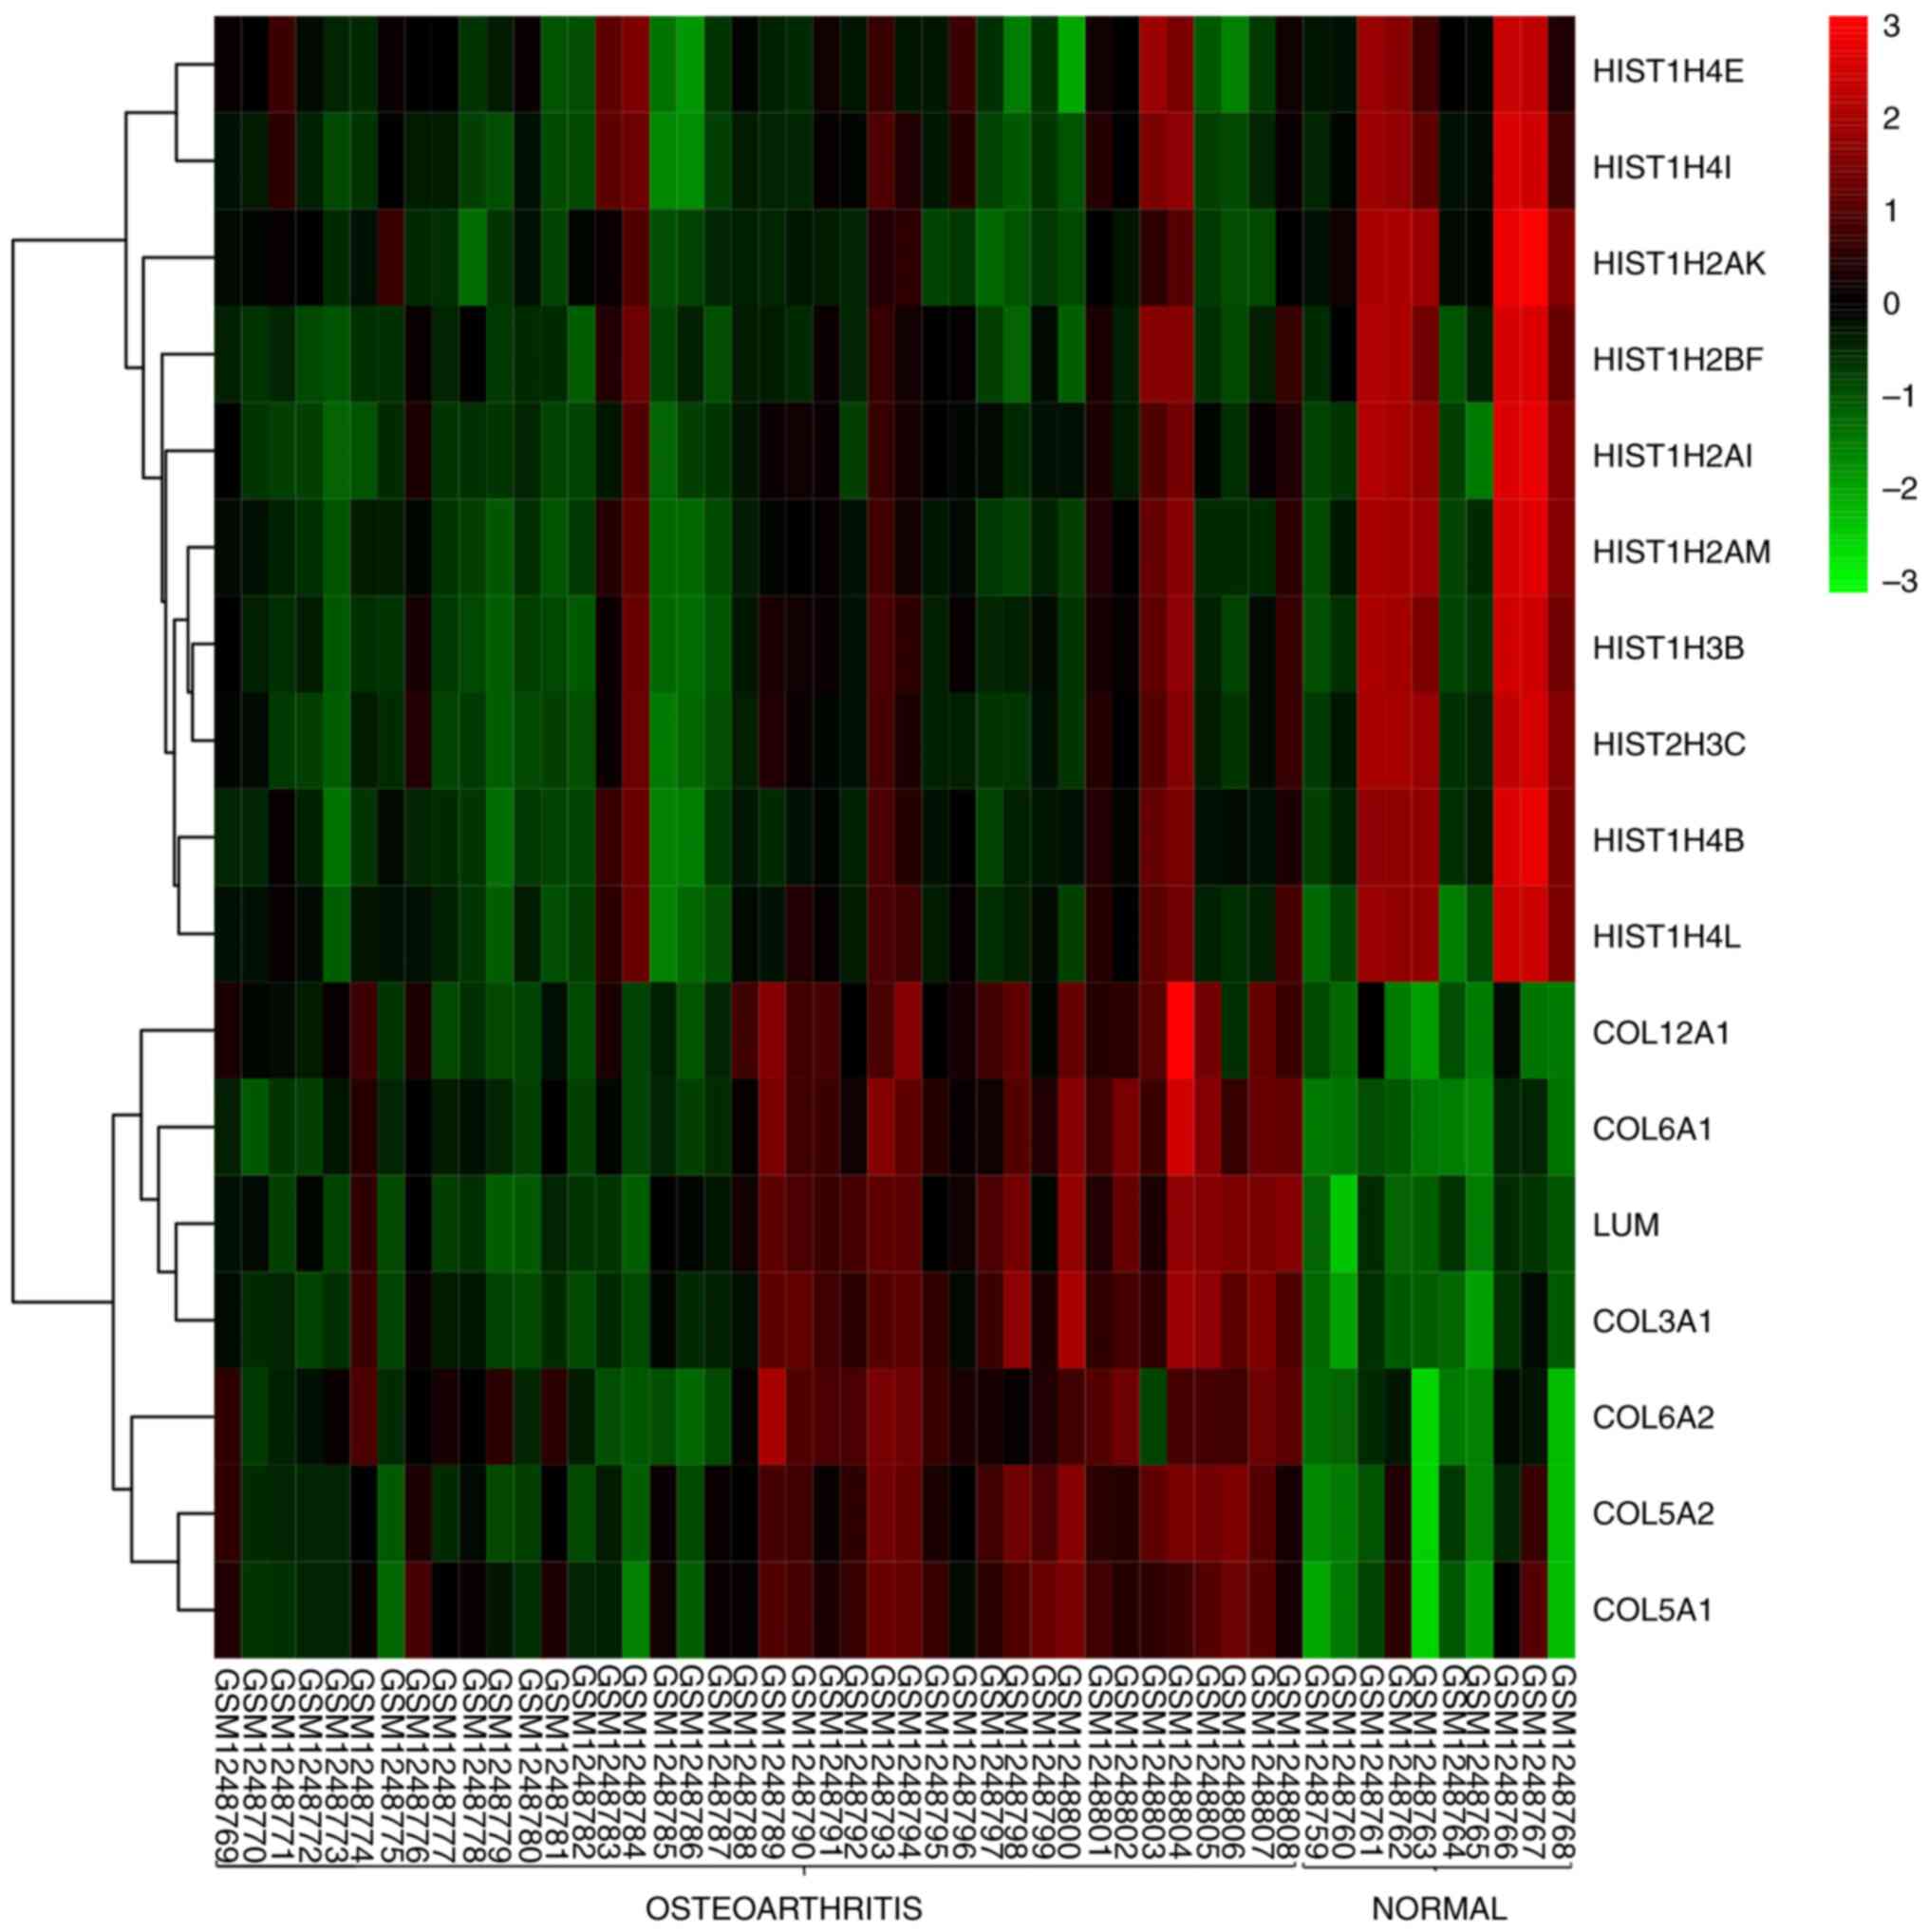
Gene expression calorimetry
The difference in the expression of core genes
between subchondral bone and normal tissue samples from OA is shown
in the heat map (Fig. 8). The
results showed that HIST1H4E, HIST1H4I, HIST1H2AK, HIST1H2BF,
HIST1H2AI, HIST1H2AM, HIST1H3B, HIST1H3C, HIST1H4B and HIST1H4L
were not significantly different in OA and normal tissues. The
expression levels of COL6A2, COL5A2, COL12A1, COL5A1, COL6A1, LUM
and COL3A1 were higher in OA tissues and lower in normal tissues,
showing significant differences.
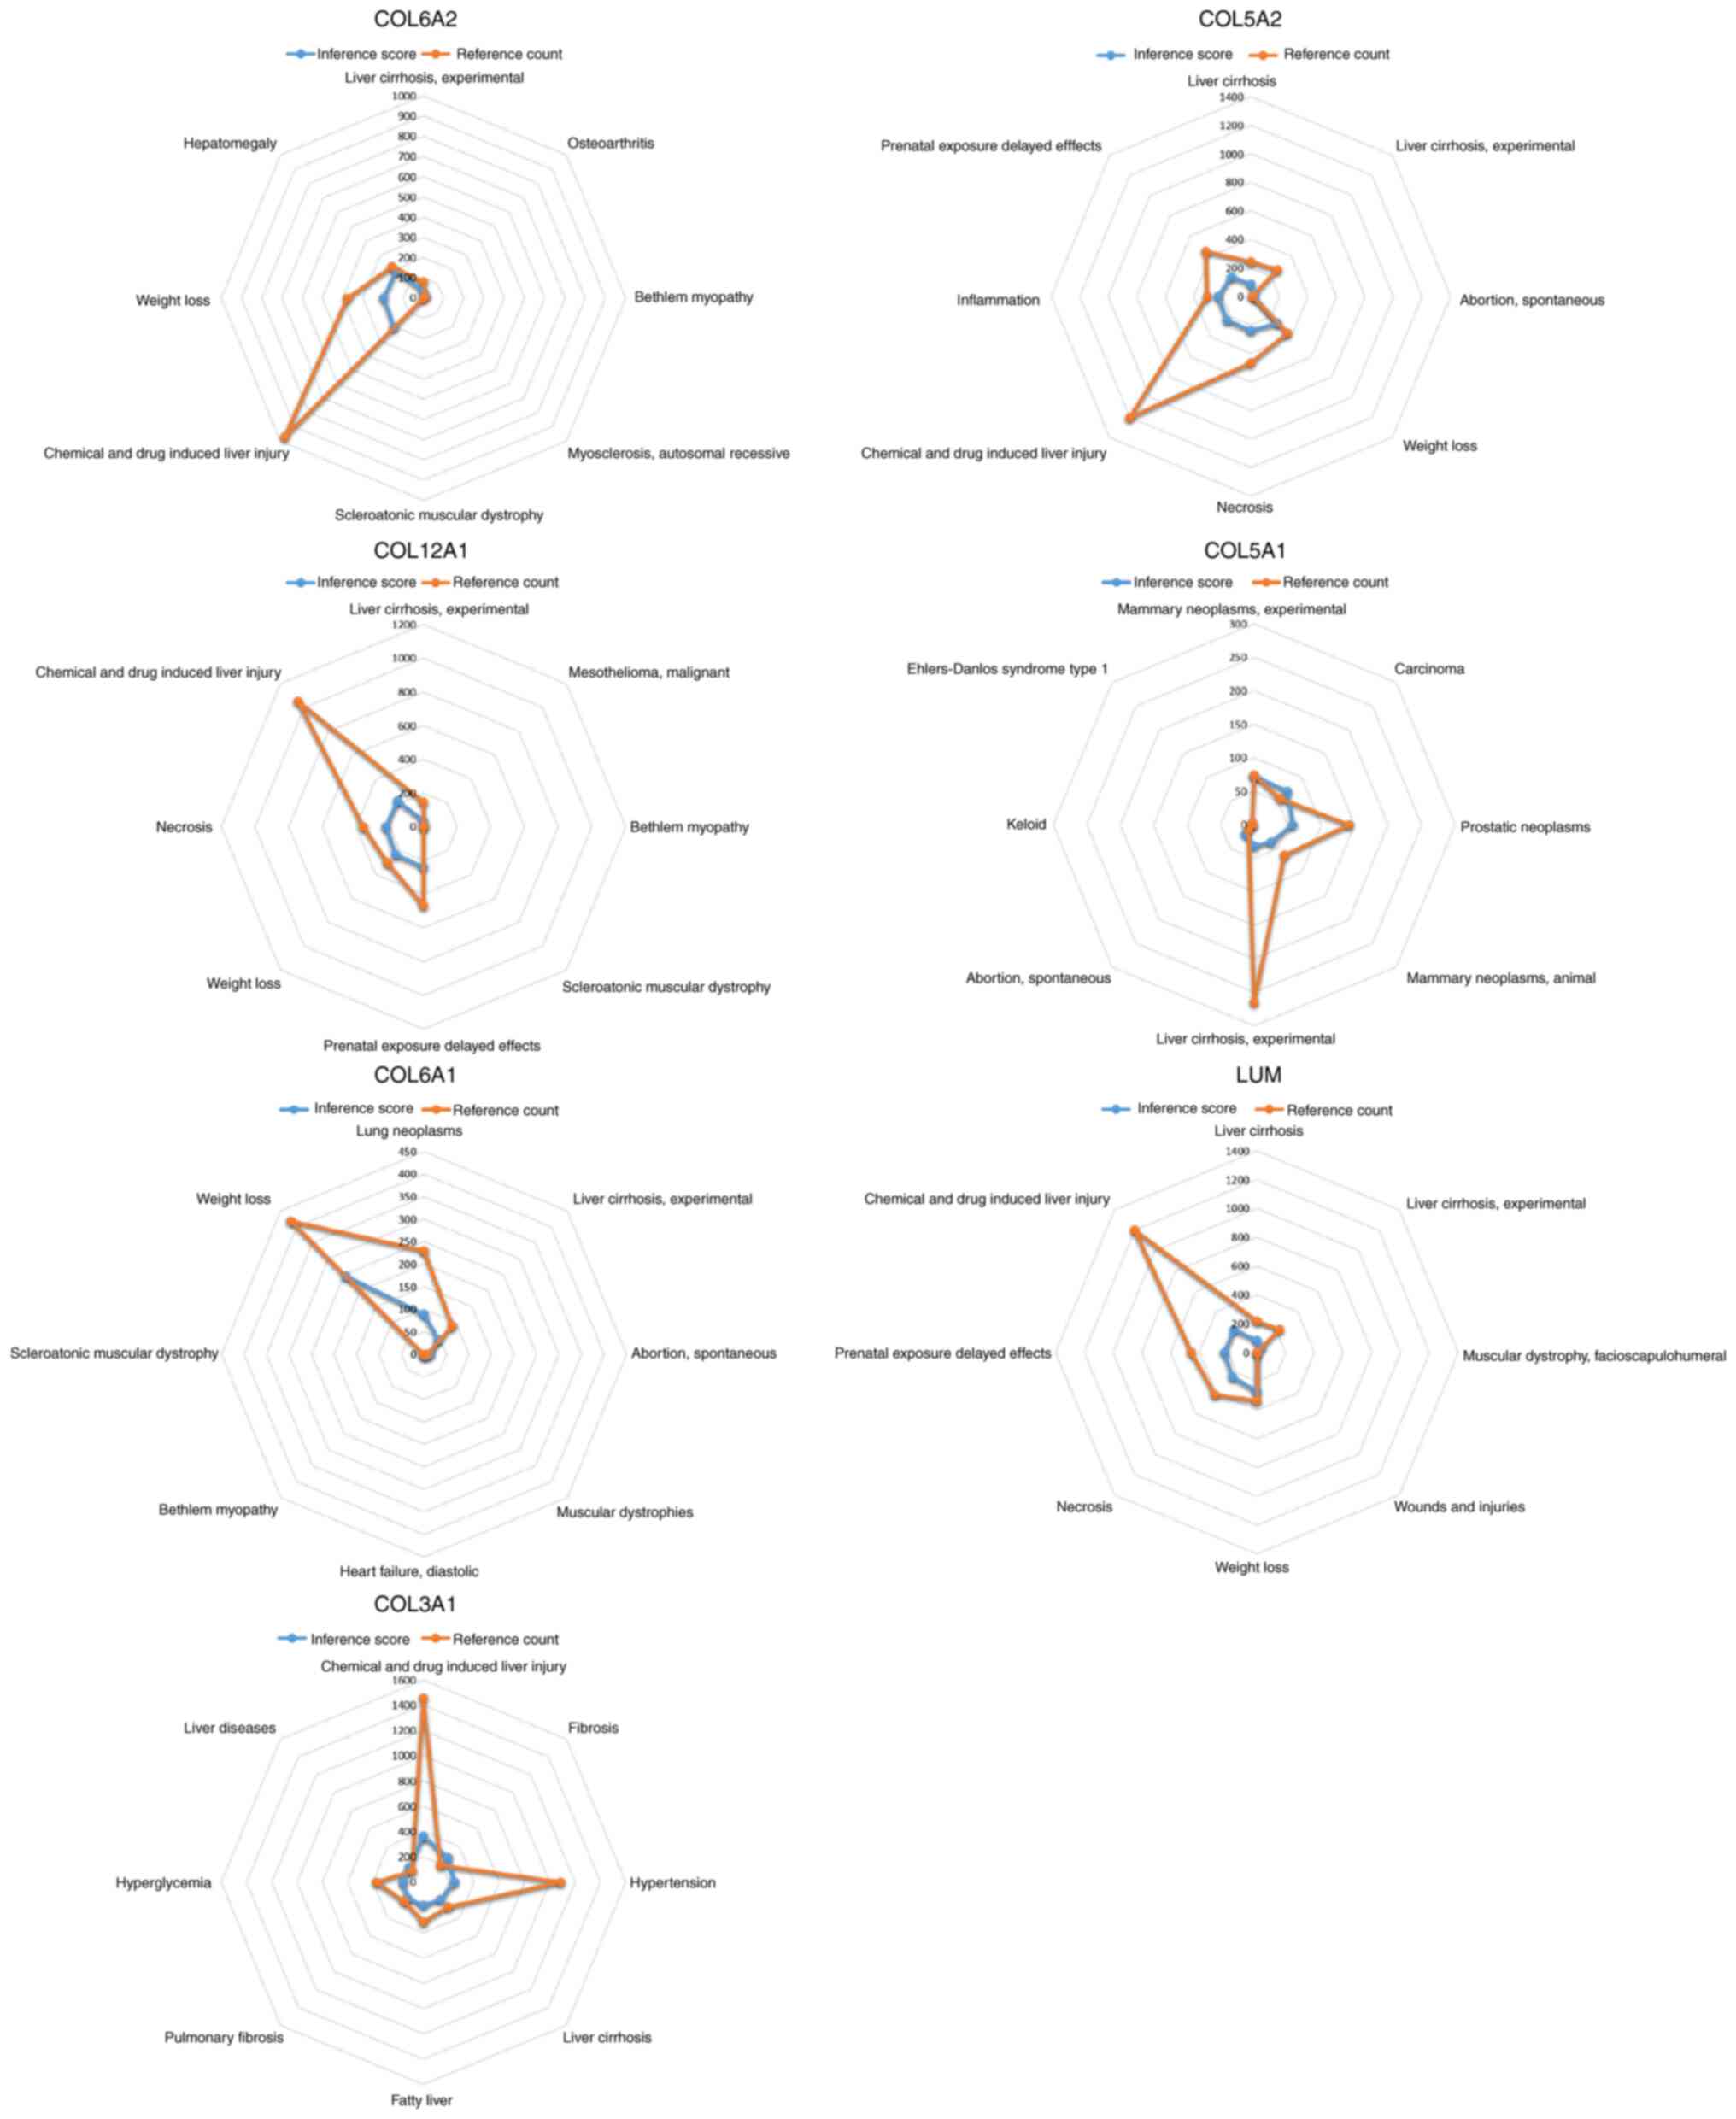
CTD analysis
In the present study, the list of hub genes was
imported into the CTD website to search for diseases related to
core genes, to ascertain the association between these genes and
diseases. The seven genes (COL6A2, COL5A2, COL12A1, COL5A1, COL6A1,
LUM and COL3A1) were found to be associated with OA, chemical and
drug induced liver injury, scleroatonic muscular dystrophy, liver
cirrhosis experiments, prostate tumors, hypertension and fatty
liver disease (Fig. 9).
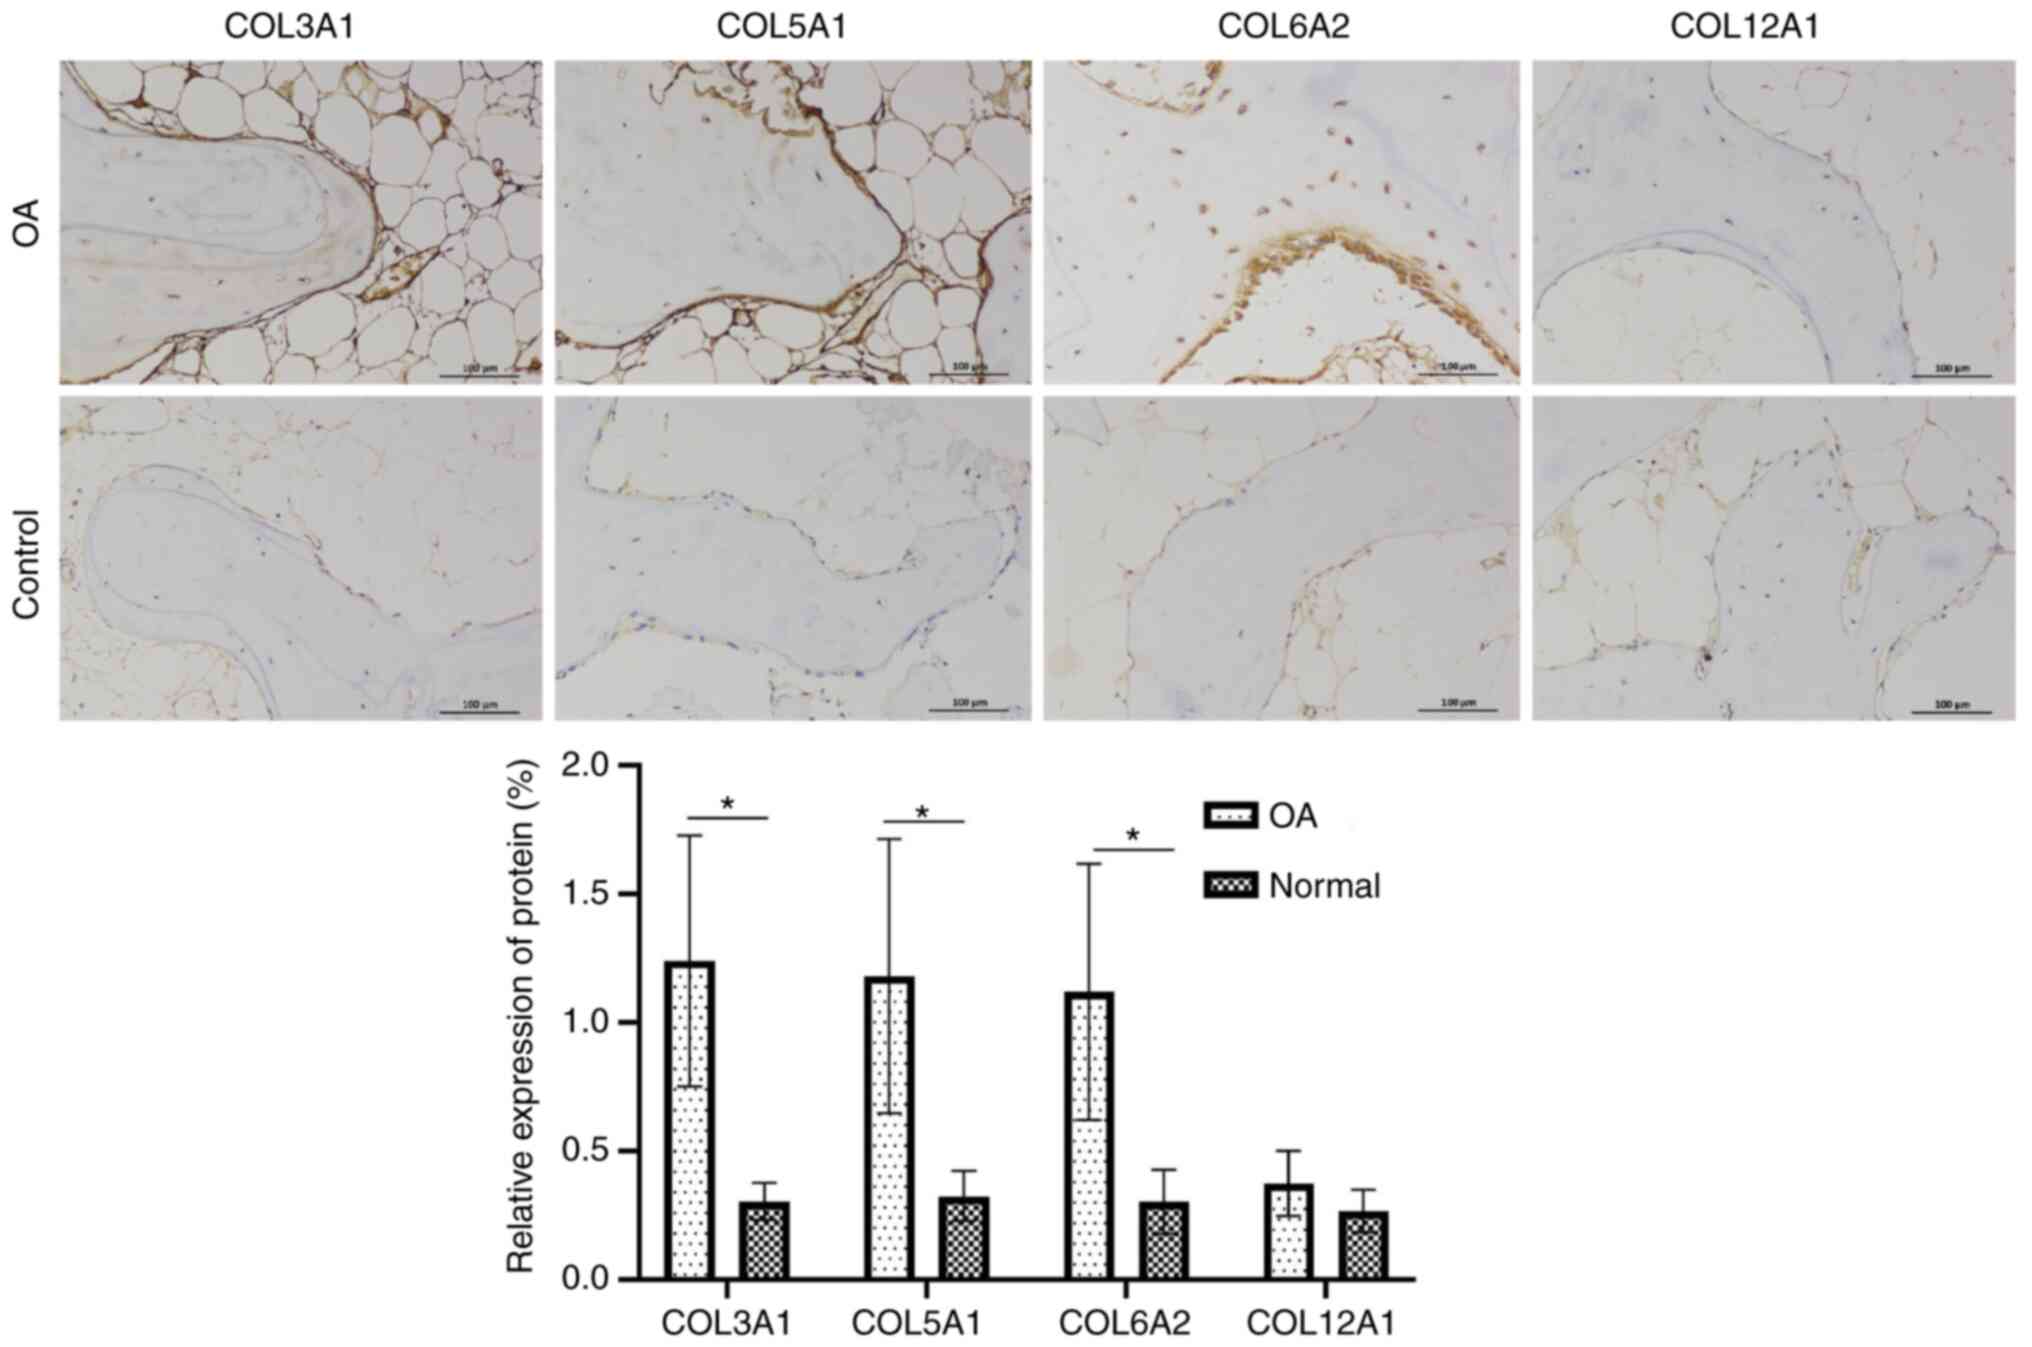
Immunohistochemical staining
The expression levels of COL3A1, COL5A1 and COL6A2
in OA subchondral bone tissue were significantly higher compared
with that in healthy tissues, but the expression of COL12A1 did not
differ notably; all stained markers were highly expressed in the
surrounding tissues. A representative example of
immunohistochemical staining is shown in Fig. 10.
miRNAs related to hub genes
The relevant miRNAs of the hub genes in the current
study obtained from TargetScan are listed in Table I.
 | Table IA summary of miRNAs that regulate hub
genes. |
Table I
A summary of miRNAs that regulate hub
genes.
| Gene | miRNA |
|---|
| COL6A2 | hsa-miR-29a-3p,
hsa-miR-29b-3p, hsa-miR-29c-3p |
| COL5A2 | hsa-miR-4458,
hsa-let-7d-5p, hsa-let-7b-5p |
| COL12A1 | hsa-miR-15a-5p,
hsa-miR-497-5p, hsa-miR-6838-5p |
| COL5A1 | hsa-miR-26b-5p,
hsa-miR-26a-5p, hsa-miR-1297 |
| COL6A1 | hsa-miR-130a-5p,
hsa-miR-23c, hsa-miR-23b-3p |
| LUM | hsa-miR-494-3p |
| COL3A1 | hsa-miR-29c-3p,
hsa-miR-29b-3p, hsa-miR-29a-3p |
Discussion
OA is a common joint degenerative disease, and it
carries a heavy financial burden on patients, families and society
(23-25).
As the population ages and the incidence of obesity increases, the
incidence of OA is increasing (26). Studies have revealed that OA
gradually progresses with age, especially in menopausal women, in
which the primary mechanism may be an imbalance between the repair
and destruction of the subchondral bone (27,28).
Thus, OA should be considered a syndrome instead of a single
disease (29). In recent years,
understanding of the causes and pathogenesis of OA pain has
improved (26). An increasing
number of studies are showing that numerous diseases can be treated
with targeted drugs (22,30,31),
therefore, understanding the molecular mechanism underlying the
development and progression of OA is of utmost importance. The
results of the present study showed that the expression levels of
COL3A1, COL5A1 and COL6A2 in OA subchondral bone tissues were
higher compared with those in healthy tissues, but COL12A1
expression was not significantly increased; all stained markers
were highly expressed in the surrounding non-OA tissues. These
results verified the findings of the bioinformatics analysis, as it
is not possible to separate the subchondral bone tissue alone
during sequencing.
COL12A1, COL6A1, COL6A2, COL5A1, COL5A2 and COL3A1
are all members of the Collagen gene family. The Collagen
superfamily proteins are crucial for maintaining the integrity of
various tissues, such as ligaments, blood vessels and cartilage
(23). Collagen is an
extracellular matrix protein with a triple helical domain as its
common structural element. Collagen is the primary component of the
bone. Therefore, collagen dysfunction may lead to bone and joint
diseases (32). Collagen XII is
assembled from three identical α-chains encoded by the COL12A1
gene. To the best of our knowledge, there have been no studies of
COL12A1 in OA; however, previous studies have found that COL12A1
deletions cause hypotonia, joint hypermobility, degenerative joint
diseases and progressive scoliosis (33,34).
Collagen VI, which is formed of a heterotrimer of α1, α2 and α3
chains encoded by COL6A1, COL6A2 and COl6A3, is the primary
structural component of microfibers. Collagen VI mediates the
development of OA by regulating the properties of the pericellular
matrix, chondrocyte swelling and mechanical transduction of
articular cartilage (35).
Collagen VI, required for bone remodeling and development, may play
a decisive role in growth plate bone formation and evidence has
shown that Collagen VI is involved in the early stages of
IL-4-related bone formation by regulating collagen I mineralization
(36,37). Christensen et al (38) found that Col6a1-/- mice
had osteoporosis in the subchondral bone.
Collagen V is the small fibrous collagen found in
ligaments, tendons and other tissues (39). COL5A1 and COL5A2 encode the α1 and
α2 chains of type V collagen. Collagen V is found in tissues
containing type I collagen and may play an important role in
regulating the assembly of the profile-shaped fibers made up of
type I and Type V collagen (40).
Type V collagen has been found to be increased in certain patients
with brittle bone disease and in patients with osteogenesis
imperfecta, and it may interfere with the normal bone
mineralization process (41).
COL3A1 encodes the pre-α1 chain of type III collagen, an important
structural protein that is classified as one of the major fibrillar
collagens (42). Collagen III has
a variety of important physiological functions (43). COL3A1 is involved in the process of
OA by mediating inflammation through participation in the PI3K/AKT,
NF-κB and IL-17 signaling pathway, extracellular matrix receptor
interactions and other inflammatory signaling pathways (44), moreover, previous studies have
shown that type III collagen is positively associated with
subchondral bone osteogenesis (45,46).
At present, some studies have described the
relationship between COL3A1, COL5A1 and COL6A1 and OA. Fang et
al (47) used comprehensive
bioinformatics analysis to identify the DEGs and pathways of
abnormal hydroxy-methylation in OA, and to identify the molecular
mechanisms of OA and genes related to the genetic susceptibility of
OA. It was found that COL3A1, COL5A1 and COL6A1 were the top 10 hub
genes. A study by Han et al (48) showed that COL3A1 is one of seven
hub genes in patients with OA, and these genes play an important
role, being widely involved in immune response, apoptosis,
inflammation and bone development. Li et al (49) used the CIBERSORT method to explore
the potential biomarkers of OA, and found that COL3A1 and matrix
metalloproteinase 9 (MMP9) are essential in the development of OA,
and they confirmed their findings using PCR and western blotting.
Further analysis also revealed that the expression of COL3A1 and
IL-1β are positively correlated (49). Similarly, COL3A1 is also considered
to be a potential diagnostic biomarker for OA in the study by Zhang
et al (50). In a study by
Xu et al (51), by
constructing a PPI network, it was found that COL5A1 is a hub gene
of OA and may play an important role in the pathogenesis of OA. Xu
et al (51) found that
COL5A1 expression is upregulated in patients with OA. Based on the
results of PCR, it was determined that COL5A1 may serve as a
diagnostic marker and drug target for the detection/management of
OA. Gu et al (52) used
WGCNA on the tissue of 40 patients with OA and 10 normal patients
(a similar method was used in the present study), and showed that
the expression levels of COL3A1 and COL6A1 were statistically
significantly different, and both were identified as hub genes in
patients with OA. Studies of COL6A2 and COL12A1 on subchondral bone
in OA have not been explored previously, to the best of our
knowledge. The results of the present study found that the
aforementioned hub genes may serve as biomarkers and potential
therapeutic targets influencing the occurrence and development of
OA.
The present review of the literature shows that the
results of the present corroborate and expand upon what was
previously known, and these findings provide promising evidence and
a potential attractive direction for future research on novel
targets for the diagnosis and immunotherapy of OA, as well as is
assisting in determining the potential biological mechanisms in the
pathogenesis of OA.
Although comprehensive and rigorous analysis was
performed using bioinformatics-based tools, the present study has
some limitations. For example, no animal experiments using gene
overexpression or knockout studies were performed to further verify
the function of these genes. Therefore, in future studies, further
in vivo experiments should be performed to validate the
findings of the present study. In conclusion, COL12A1, COL6A2,
COL6A1, COL5A2, COL5A1 and COL3A1 may serve as novel biomarkers
and/or therapeutic targets for the detection/management of OA.
Acknowledgements
Not applicable.
Funding
Funding: No funding was received.
Availability of data and materials
The datasets used and/or analyzed during the current
study are available from the corresponding author on reasonable
request.
Authors' contributions
YZ and FW designed the study. YN, YP and XP
performed the experiments and analyzed the data. YZ and YN wrote
the manuscript. YN and XP searched the literature and revised the
manuscript. All authors read and approved the final manuscript. YZ
and FW confirm the authenticity of all the raw data.
Ethics approval and consent to
participate
This study was performed in line with the principles
of the Declaration of Helsinki. Approval was granted by the
Academic Ethics Committee of the Third Hospital of Hebei Medical
University (approval no. Z2021-063-2). Written informed consent was
obtained from all individual participants included in this
study.
Patient consent for publication
All patients provided their written informed consent
for publication.
Competing interests
The authors declare that they have no competing
interests.
References
|
1
|
Vina ER and Kwoh CK: Epidemiology of
osteoarthritis: Literature update. Curr Opin Rheumatol. 30:160–167.
2018.PubMed/NCBI View Article : Google Scholar
|
|
2
|
Sacitharan PK: Ageing and Osteoarthritis.
Subcell Biochem. 91:123–159. 2019.PubMed/NCBI View Article : Google Scholar
|
|
3
|
van den Bosch M: Osteoarthritis year in
review 2020: Biology. Osteoarthritis Cartilage. 29:143–150.
2021.PubMed/NCBI View Article : Google Scholar
|
|
4
|
Abramoff B and Caldera FE: Osteoarthritis:
Pathology, diagnosis, and treatment options. Med Clin North Am.
104:293–311. 2020.PubMed/NCBI View Article : Google Scholar
|
|
5
|
Sandell LJ: Etiology of osteoarthritis:
Genetics and synovial joint development. Nat Rev Rheumatol.
8:77–89. 2012.PubMed/NCBI View Article : Google Scholar
|
|
6
|
Sakalauskienė G and Jauniškienė D:
Osteoarthritis: Etiology, epidemiology, impact on the individual
and society and the main principles of management. Medicina
(Kaunas). 46:790–797. 2010.PubMed/NCBI
|
|
7
|
Schönbach C, Li J, Ma L, Horton P, Sjaugi
MF and Ranganathan S: A bioinformatics potpourri. BMC Genomics. 19
(Suppl 1)(S920)2018.PubMed/NCBI View Article : Google Scholar
|
|
8
|
Akalin PK: Introduction to bioinformatics.
Mol Nutr Food Res. 50:610–619. 2006.PubMed/NCBI View Article : Google Scholar
|
|
9
|
Pitsillides AA and Beier F: Cartilage
biology in osteoarthritis-lessons from developmental biology. Nat
Rev Rheumatol. 7:654–663. 2011.PubMed/NCBI View Article : Google Scholar
|
|
10
|
van der Kraan PM and van den Berg WB:
Chondrocyte hypertrophy and osteoarthritis: Role in initiation and
progression of cartilage degeneration. Osteoarthritis Cartilage.
20:223–232. 2012.PubMed/NCBI View Article : Google Scholar
|
|
11
|
Mazur CM, Woo JJ, Yee CS, Fields AJ,
Acevedo C, Bailey KN, Kaya S, Fowler TW, Lotz JC, Dang A, et al:
Osteocyte dysfunction promotes osteoarthritis through
MMP13-dependent suppression of subchondral bone homeostasis. Bone
Res. 7(34)2019.PubMed/NCBI View Article : Google Scholar
|
|
12
|
Chou CH, Wu CC, Song IW, Chuang HP, Lu LS,
Chang JH, Kuo SY, Lee CH, Wu JY, Chen YT, et al: Genome-wide
expression profiles of subchondral bone in osteoarthritis.
Arthritis Res Ther. 15(R190)2013.PubMed/NCBI View
Article : Google Scholar
|
|
13
|
Ritchie ME, Phipson B, Wu D, Hu Y, Law CW,
Shi W and Smyth GK: Limma powers differential expression analyses
for RNA-sequencing and microarray studies. Nucleic Acids Res.
43(e47)2015.PubMed/NCBI View Article : Google Scholar
|
|
14
|
Langfelder P and Horvath S: WGCNA: An R
package for weighted correlation network analysis. BMC
Bioinformatics. 9(559)2008.PubMed/NCBI View Article : Google Scholar
|
|
15
|
Shannon P, Markiel A, Ozier O, Baliga NS,
Wang JT, Ramage D, Amin N, Schwikowski B and Ideker T: Cytoscape: A
software environment for integrated models of biomolecular
interaction networks. Genome Res. 13:2498–2504. 2003.PubMed/NCBI View Article : Google Scholar
|
|
16
|
Chen S, Yang D, Lei C, Li Y, Sun X, Chen
M, Wu X and Zheng Y: Identification of crucial genes in abdominal
aortic aneurysm by WGCNA. PeerJ. 7(e7873)2019.PubMed/NCBI View Article : Google Scholar
|
|
17
|
Gene Ontology Consortium: Going forward.
Nucleic Acids Res. 43:D1049–D1056. 2015.PubMed/NCBI View Article : Google Scholar
|
|
18
|
Kanehisa M and Goto S: KEGG: Kyoto
encyclopedia of genes and genomes. Nucleic Acids Res. 28:27–30.
2000.PubMed/NCBI View Article : Google Scholar
|
|
19
|
Yu G, Wang LG, Han Y and He QY:
clusterProfiler: An R package for comparing biological themes among
gene clusters. OMICS. 16:284–287. 2012.PubMed/NCBI View Article : Google Scholar
|
|
20
|
Qing J, Li C, Hu X, Song W, Tirichen H,
Yaigoub H and Li Y: Differentiation of T Helper 17 cells may
mediate the abnormal humoral immunity in IgA nephropathy and
inflammatory bowel disease based on shared genetic effects. Front
Immunol. 13(916934)2022.PubMed/NCBI View Article : Google Scholar
|
|
21
|
Davis AP, Wiegers TC, Johnson RJ, Sciaky
D, Wiegers J and Mattingly CJ: Comparative Toxicogenomics Database
(CTD): Update 2023. Nucleic Acids Res. 51:D1257–D1262.
2023.PubMed/NCBI View Article : Google Scholar
|
|
22
|
Mu W, Xu B, Ma H, Li J, Ji B, Zhang Z,
Amat A and Cao L: Halofuginone attenuates osteoarthritis by
rescuing bone remodeling in subchondral bone through oral gavage.
Front Pharmacol. 9(269)2018.PubMed/NCBI View Article : Google Scholar
|
|
23
|
Myllyharju J and Kivirikko KI: Collagens
and collagen-related diseases. Ann Med. 33:7–21. 2001.PubMed/NCBI View Article : Google Scholar
|
|
24
|
Kadler KE, Baldock C, Bella J and
Boot-Handford RP: Collagens at a glance. J Cell Sci. 120:1955–1958.
2007.PubMed/NCBI View Article : Google Scholar
|
|
25
|
Hunter DJ, Schofield D and Callander E:
The individual and socioeconomic impact of osteoarthritis. Nat Rev
Rheumatol. 10:437–441. 2014.PubMed/NCBI View Article : Google Scholar
|
|
26
|
Hunter DJ and Bierma-Zeinstra S:
Osteoarthritis. Lancet. 393:1745–1759. 2019.PubMed/NCBI View Article : Google Scholar
|
|
27
|
Peshkova M, Lychagin A, Lipina M, Di
Matteo B, Anzillotti G, Ronzoni F, Kosheleva N, Shpichka A, Royuk
V, Fomin V, et al: Gender-related aspects in osteoarthritis
development and progression: A review. Int J Mol Sci.
23(2767)2022.PubMed/NCBI View Article : Google Scholar
|
|
28
|
Goldring SR: Alterations in periarticular
bone and cross talk between subchondral bone and articular
cartilage in osteoarthritis. Ther Adv Musculoskelet Dis. 4:249–258.
2012.PubMed/NCBI View Article : Google Scholar
|
|
29
|
Deveza LA and Loeser RF: Is osteoarthritis
one disease or a collection of many. Rheumatology (Oxford). 57
(Suppl_4):iv34–iv42. 2018.PubMed/NCBI View Article : Google Scholar
|
|
30
|
Hirsch FR, Scagliotti GV, Mulshine JL,
Kwon R, Curran WJ Jr, Wu YL and Paz-Ares L: Lung cancer: Current
therapies and new targeted treatments. Lancet. 389:299–311.
2017.PubMed/NCBI View Article : Google Scholar
|
|
31
|
Wang L, Qin W, Huo YJ, Li X, Shi Q, Rasko
J, Janin A and Zhao WL: Advances in targeted therapy for malignant
lymphoma. Signal Transduct Target Ther. 5(15)2020.PubMed/NCBI View Article : Google Scholar
|
|
32
|
Carter EM and Raggio CL: Genetic and
orthopedic aspects of collagen disorders. Curr Opin Pediatr.
21:46–54. 2009.PubMed/NCBI View Article : Google Scholar
|
|
33
|
Zou Y, Zwolanek D, Izu Y, Gandhy S,
Schreiber G, Brockmann K, Devoto M, Tian Z, Hu Y, Veit G, et al:
Recessive and dominant mutations in COL12A1 cause a novel
EDS/myopathy overlap syndrome in humans and mice. Hum Mol Genet.
23:2339–2352. 2014.PubMed/NCBI View Article : Google Scholar
|
|
34
|
Hicks D, Farsani GT, Laval S, Collins J,
Sarkozy A, Martoni E, Shah A, Zou Y, Koch M, Bönnemann CG, et al:
Mutations in the collagen XII gene define a new form of
extracellular matrix-related myopathy. Hum Mol Genet. 23:2353–2363.
2014.PubMed/NCBI View Article : Google Scholar
|
|
35
|
Komori T, Ji Y, Pham H, Jani P, Kilts TM,
Kram V, Li L and Young MF: Type VI collagen regulates endochondral
ossification in the temporomandibular joint. JBMR Plus.
6(e10617)2022.PubMed/NCBI View Article : Google Scholar
|
|
36
|
Keene DR, Sakai LY and Burgeson RE: Human
bone contains type III collagen, type VI collagen, and fibrillin:
Type III collagen is present on specific fibers that may mediate
attachment of tendons, ligaments, and periosteum to calcified bone
cortex. J Histochem Cytochem. 39:59–69. 1991.PubMed/NCBI View Article : Google Scholar
|
|
37
|
Alexopoulos LG, Youn I, Bonaldo P and
Guilak F: Developmental and osteoarthritic changes in
Col6a1-knockout mice: Biomechanics of type VI collagen in the
cartilage pericellular matrix. Arthritis Rheum. 60:771–779.
2009.PubMed/NCBI View Article : Google Scholar
|
|
38
|
Christensen SE, Coles JM, Zelenski NA,
Furman BD, Leddy HA, Zauscher S, Bonaldo P and Guilak F: Altered
trabecular bone structure and delayed cartilage degeneration in the
knees of collagen VI null mice. PLoS One. 7(e33397)2012.PubMed/NCBI View Article : Google Scholar
|
|
39
|
Birk DE: Type V collagen: Heterotypic type
I/V collagen interactions in the regulation of fibril assembly.
Micron. 32:223–237. 2001.PubMed/NCBI View Article : Google Scholar
|
|
40
|
Willard K, Mannion S, Saunders CJ, Collins
M and September AV: The interaction of polymorphisms in
extracellular matrix genes and underlying miRNA motifs that
modulate susceptibility to anterior cruciate ligament rupture. J
Sci Med Sport. 21:22–28. 2018.PubMed/NCBI View Article : Google Scholar
|
|
41
|
Harumiya S, Gibson MA and Koshihara Y:
Antisense suppression of collagen VI synthesis results in reduced
expression of collagen I in normal human osteoblast-like cells.
Biosci Biotechnol Biochem. 66:2743–2747. 2002.PubMed/NCBI View Article : Google Scholar
|
|
42
|
Miller EJ, Epstein EH Jr and Piez KA:
Identification of three genetically distinct collagens by cyanogen
bromide cleavage of insoluble human skin and cartilage collagen.
Biochem Biophys Res Commun. 42:1024–1029. 1971.PubMed/NCBI View Article : Google Scholar
|
|
43
|
Kuivaniemi H and Tromp G: Type III
collagen (COL3A1): Gene and protein structure, tissue distribution,
and associated diseases. Gene. 707:151–171. 2019.PubMed/NCBI View Article : Google Scholar
|
|
44
|
Li J and Zheng J: Theaflavins prevent
cartilage degeneration via AKT/FOXO3 signaling in vitro. Mol
Med Rep. 19:821–830. 2019.PubMed/NCBI View Article : Google Scholar
|
|
45
|
Müller PK, Raisch K, Matzen K and Gay S:
Presence of type III collagen in bone from a patient with
osteogenesis imperfecta. Eur J Pediatr. 125:29–37. 1977.PubMed/NCBI View Article : Google Scholar
|
|
46
|
Pope FM, Nicholls AC, Eggleton C, Narcissi
P, Hey EN and Parkin JM: Osteogenesis imperfecta (lethal) bones
contain types III and V collagens. J Clin Pathol. 33:534–538.
1980.PubMed/NCBI View Article : Google Scholar
|
|
47
|
Fang Y, Wang P, Xia L, Bai S, Shen Y, Li
Q, Wang Y, Zhu J, Du J and Shen B: Aberrantly hydroxymethylated
differentially expressed genes and the associated protein pathways
in osteoarthritis. PeerJ. 7(e6425)2019.PubMed/NCBI View Article : Google Scholar
|
|
48
|
Han Y, Wu J, Gong Z, Zhou Y, Li H, Chen Y
and Qian Q: Identification and development of the novel 7-genes
diagnostic signature by integrating multi cohorts based on
osteoarthritis. Hereditas. 159(10)2022.PubMed/NCBI View Article : Google Scholar
|
|
49
|
Li S, Wang H, Zhang Y, Qiao R, Xia P, Kong
Z, Zhao H and Yin L: COL3A1 and MMP9 serve as potential diagnostic
biomarkers of osteoarthritis and are associated with immune cell
infiltration. Front Genet. 12(721258)2021.PubMed/NCBI View Article : Google Scholar
|
|
50
|
Zhang Y, Yang Y, Wang C, Wan S, Yao Z,
Zhang Y, Liu J and Zhang C: Identification of diagnostic biomarkers
of osteoarthritis based on multi-chip integrated analysis and
machine learning. DNA Cell Biol: Oct 16, 2020 doi:
10.1089/dna.2020.5552 (Epub ahead of print).
|
|
51
|
Xu WB, Kotheeranurak V, Zhang HL, Feng JY,
Liu JW, Chen CM, Lin GX and Rui G: Identification of the
circRNA-miRNA-mRNA regulatory network in osteoarthritis using
bioinformatics analysis. Front Genet. 13(994163)2022.PubMed/NCBI View Article : Google Scholar
|
|
52
|
Gu HY, Yang M, Guo J, Zhang C, Lin LL, Liu
Y and Wei RX: Identification of the biomarkers and pathological
process of osteoarthritis: Weighted Gene Co-expression network
analysis. Front Physiol. 10(275)2019.PubMed/NCBI View Article : Google Scholar
|