Introduction
Diabetic nephropathy (DN) has a high morbidity and
mortality rate worldwide, and it is the most prevalent contributor
to end-stage renal disease (ESRD) (1). In China, the present authors have
identified an increasing number of patients with
non-dialysis-dependent chronic kidney disease (CKD) who have
diabetes, as assessed through analysis of data retrieved from the
Hospital Quality Monitoring System (2). DN has become the leading cause of
ESRD, exceeding glomerulonephritis (3). In addition, CKD is the twelfth
leading cause of disease mortality (4) and another study showed that
co-payments are a particular problem for patients with CKD, leading
them to discontinue the medication or stop the dialysis treatment
(5). Therefore, the development of
biomarkers is significant for the early diagnosis and delayed
progression of DN, which can reduce the number of patients with
ESRD (6,7) and even eliminate the need for
alternative treatments in some patients, reducing suffering and
improving quality of life and prognosis.
The kidney is the organ with the second highest
oxygen consumption; therefore, it is extremely sensitive to
mitochondrial dysfunction (8,9).
Renal hypoxia may play an essential role in the progression of DN
and it emerged as a common cause of several renal diseases in
previous studies (10,11). The mitochondrial (mt)DNA has a
critical function in regulating the progression of DN (12). Under oxidative stress due to excess
reactive oxygen species (ROS), the mtDNA is not protected by
histones and it lacks repair mechanisms throughout almost the
entire coding region, making it highly susceptible to damage and
mutations (13). The excessive
production of ROS that is harmful to mtDNA may also impair the
function of the mitochondrial electron transport chain and cause
mitochondrial dysfunction, among other issues (8,14).
Numerous cells may be affected by diabetes-induced mitochondrial
damage, including renal tubular cells that contain abundant
mitochondria. DN is a complex disease that is still not fully
understood, but mitochondrial impairment is undoubtedly one of the
critical causes in the development of DN, regardless of its
underlying causes (8-11).
The presence of mtDNA in the urine may be due to its
release from renal parenchymal cells into the urine after kidney
injury (15). Urinary mtDNA may
indicate kidney damage, including DN (16) and non-diabetic kidney disease
(17). In addition, urine samples
can be easily collected using non-invasive procedures and have the
advantage of large sample volumes (18). Therefore, the present authors
intended to investigate whether mtDNA in urine can be used as a
non-invasive biomarker to help diagnose early DN.
Materials and methods
Study subjects
The present study enrolled a total of 165 patients
with type 2 diabetes mellitus (T2DM), including 48 patients with
T2DM without DN, who were admitted to the Fourth Affiliated
Hospital of Harbin Medical University between August 2021 and
October 2021. Patients with T2DM but without DN had no elevated
indicators of any abnormal kidney injury. The degree of renal
impairment in patients with T2DM was grouped according to the
estimated glomerular filtration rate (eGFR) or
albumin-to-creatinine ratio (ACR). The renal impairment was defined
as the eGFR <90 ml/min/1.73 m2 or ACR ≥300 mg/g.
The three groups were classified according to
clinical eGFR staging: eGFR ≥90, eGFR 60-89 and eGFR ≤59
ml/min/1.73 m2. Three groups were classified according
to clinical ACR staging: ACR <30, ACR 30-299 and ACR ≥300
mg/g.
Patients with T2DM met the 1999 World Health
Organization diagnostic criteria for DM (19). The aforementioned criteria exclude
other serious diseases such as malignancy, infections, infectious
diseases, pregnancy and medications that affect glucose or
albuminuria. Also excluded were different types of diabetic and
non-diabetic nephropathy.
The eGFR was estimated using the Cockcroft-Gault
(CG) formula: [140-age (years) x body weight (kg)]/creatinine
(µmol/l) x0.85 (if female) ml/min/1.73 m2).
ACR was calculated using the formula: ACR=mAlb/Ucr
(mg/g).
The present study conformed to the provisions of the
Declaration of Helsinki and was approved by the Clinical Medical
Research Ethics Committee of the Fourth Affiliated Hospital of
Harbin Medical University (2022-WZYSLLSC-30). All patients gave
written informed consent for urine and blood collection and the
analysis was approved by the ethic committee.
Data collection
General information regarding all the study subjects
was collected, including age and sex. In addition, BMI (weight, kg;
height, m), systolic blood pressure (SBP) and diastolic blood
pressure (DBP) were also measured.
Sample collection
A blood sample (4 ml) was collected using
venipuncture and patients were fasting for >8 h before the
measurement of fasting glucose (FPG; Glucose-hexokinase activity
detection kit, Beckman Coulter, Inc.) and morning urine specimens
were collected from the same patient on the same day. Other
biochemical analyses included blood urea (Urea), uric acid (UA),
cystatin C (Cys-C) and serum creatinine (Scr) were measured in
blood samples [Beckman Coulter Uric Acid and Urea reagents (Beckman
Coulter, Inc.); CysC and Scr assay kits (Medconn Diagnostics)].
Glycated hemoglobin (HbA1c) was measured in blood samples (Bio-Rad
CDM; Bio-Rad Laboratories, Inc.). Urine samples were collected for
routine examination of urine creatinine (Ucr), microalbumin (mAlb)
(Beckman AU5800; Beckman Coulter, Inc.) and urinary sediment (DIRUI
FUS-2000; Dirui Industrial Co., Ltd.).
Urinary mtDNA preparation
Urine samples were centrifuged at 7,584 x g for 10
min at 4˚C; then, the supernatant was separated, frozen and kept at
-80˚C until further analysis. Purified mtDNA was isolated from 200
µl urine supernatant using Nucleic Acid Extraction Kit (magnetic
bead method; Zybio, Inc.), according to the manufacturer's
instructions. Subsequently, the mtDNA fragments were detected using
the LightCycler® 480 real-time PCR detection system
[Roche Diagnostics (Shanghai) Co., Ltd.]. A standard curve from
101 to 104 copies/ml was created using a 10x
serial dilution of a standard sample [purified 400 base pairs (bp)
mitochondrial clones (accession number of sequence >OR062
595.1); Sangon Biotech Co., Ltd.] as a positive quantification
reference. Each sample was analyzed three times, the results were
averaged and the corresponding concentration was extrapolated from
the standard calibration curve. Finally, the ratio of urinary mtDNA
was normalized to its corresponding Ucr for each subject to
quantify the urinary mtDNA of each individual. Amplification
reactions contained a total volume of 20 µl including 10 µl 2X Ace
Taq Master Mix (Vazyme Biotech Co., Ltd.), 1 µl of EvaGreen
(Biotium, Inc.), 0.6 µl of forward and reverse primers (Sangon
Biotech, Co., Ltd.), 3.4 µl ddH2O and 5 µl mtDNA. The
amplification reactions of mt89DNA primers were carried out at 95˚C
for 5 min, followed by 40 cycles at 95˚C for 20 sec, 56˚C for 20
sec and 72˚C for 20 sec. The amplification reactions of mt349DNA
primers were carried out at 95˚C for 5 min, followed by 45 cycles
at 95˚C for 30 sec, 54˚C for 30 sec, and 72˚C for 30 sec. To assess
the expression of mtDNA in urine, the results were expressed as
mtDNA activity equivalent to 1 g of creatinine (U/g Ucr) (20). Primer sequences are shown in
Table I.
 | Table Imt89DNA and mt349DNA primer
sequences |
Table I
mt89DNA and mt349DNA primer
sequences
| Primer | Sequence | Length | Number of
sequence |
|---|
| mt89 upstream |
5'-CCTTACCACGCTACTCCTACC-3' | 89 bp | >OR062595.1 |
| mt89
downstream |
5'-GCTTTGAAGGCTCTTGGTCTG-3' | | |
| mt349 upstream |
5'-AAGAGCCTTCAAAGCCCTCAG-3' | 349 bp | >OR062595.1 |
| mt349
downstream |
5'-TGGCTGAGTGAAGCATTGGAC-3' | | |
Statistical analysis
The software used for statistical analysis was SPSS
version 25.0 (IBM Corp.) and GraphPad Prism version 9.0 (GraphPad
Software; Dotmatics). Normally distributed data were expressed as
mean ± standard deviation, while variables with skewed distribution
were expressed as median (interquartile range). Comparisons between
more than two groups were made using the Kruskal-Wallis test
followed by Dunn's multiple comparisons test or a one-way analysis
of variance (ANOVA) followed by Tukey's post hoc test. Spearman
correlation analysis was used to determine the correlation of other
clinical variables. Factors correlated with early DN were assessed
by univariate logistic regression analysis and multivariate
logistic regression analysis comparing urinary mtDNA with other
clinical variables. P<0.05 was considered to indicate a
statistically significant difference.
Results
Patients' baseline
characteristics
patients with T2DM were divided into three groups
according to eGFR: eGFR≥90, eGFR 60-89 and eGFR≤59 ml/min/1.73
m2 groups. The basic clinical characteristics of the
three groups are summarized in Table
II. As renal function decreased, eGFR decreased due to
glomerular impairment. ACR increased due to elevated mAlb and
decreased Ucr. Scr, Urea and Cys-C increased due to decreased
filtration. Age was higher in patients with poorer renal function,
accompanied by an increase in SBP.
| Table IIBaseline clinical characteristics in
patients with T2DM in different eGFR groups. |
Table II
Baseline clinical characteristics in
patients with T2DM in different eGFR groups.
| | eGFR (ml/min/1.73
m2) | |
|---|
| Parameter | ≥90 (n=116) | 60-89 (n=34) | ≤59 (n=15) | P-value |
|---|
| Age (years) |
52.54±9.69a | 66.47±6.96 | 71.73±9.92 | <0.001 |
| Sex | | | | |
| Male | 32 | 18 | 8 | |
| Female | 84 | 16 | 7 | |
| BMI
(kg/m2) |
26.87±3.46b |
24.08±2.47a | 24.62±3.15 | <0.001 |
| SBP (mm Hg) |
136.88±19.97a,b | 146.47±20.63 | 153.33±20.31 | 0.002 |
| DBP (mm Hg) |
86.65±12.57b | 81.12±10.48 | 80.80±15.59 | 0.032 |
| eGFR (ml/min/1.73
m2) | 123.01
(105.26-148.70)a,b | 76.69
(67.49-81.08)a | 48.36
(20.87-53.67) | <0.001 |
| FPG (mmol/l) | 8.04
(6.58-10.55) | 7.03
(5.70-8.97) | 7.96
(4.56-10.38) | 0.097 |
| HbA1c (%) | 9.00
(7.50-10.40) | 7.85
(7.20-9.33) | 7.85
(6.93-9.05) | 0.022 |
| mAlb (mg/l) | 11.95
(7.09-33.43) | 12.10
(4.89-46.88) | 596.00
(3.61-1,190.00) | 0.074 |
| Ucr (mmol/l) | 9.00
(5.74-11.95)a,b | 5.73
(3.98-7.76) | 4.34
(2.82-6.23) | <0.001 |
| ACR (mg/g) | 12.10
(6.43-35.25)a | 16.70
(7.75-59.08)a | 1,231.20
(15.50-3,480.30) | 0.005 |
| Scr (µmol/l) | 61.25
(54.78-70.55)a,b | 68.60
(59.15-83.33)a | 109.80
(80.00-369.10) | <0.001 |
| Urea (mmol/l) | 5.49
(4.84-6.35)a | 5.73
(4.82-6.93)a | 8.72
(7.46-16.39) | <0.001 |
| UA (µmol/l) | 331.9
(272.23-401.13) | 314.25
(282.03-375.45) | 393.20
(328.20-491.20) | 0.096 |
| Cys-C (mg/l) | 0.92
(0.79-1.04)a | 0.97
(0.84-1.14)a | 1.74
(1.28-2.94) | <0.001 |
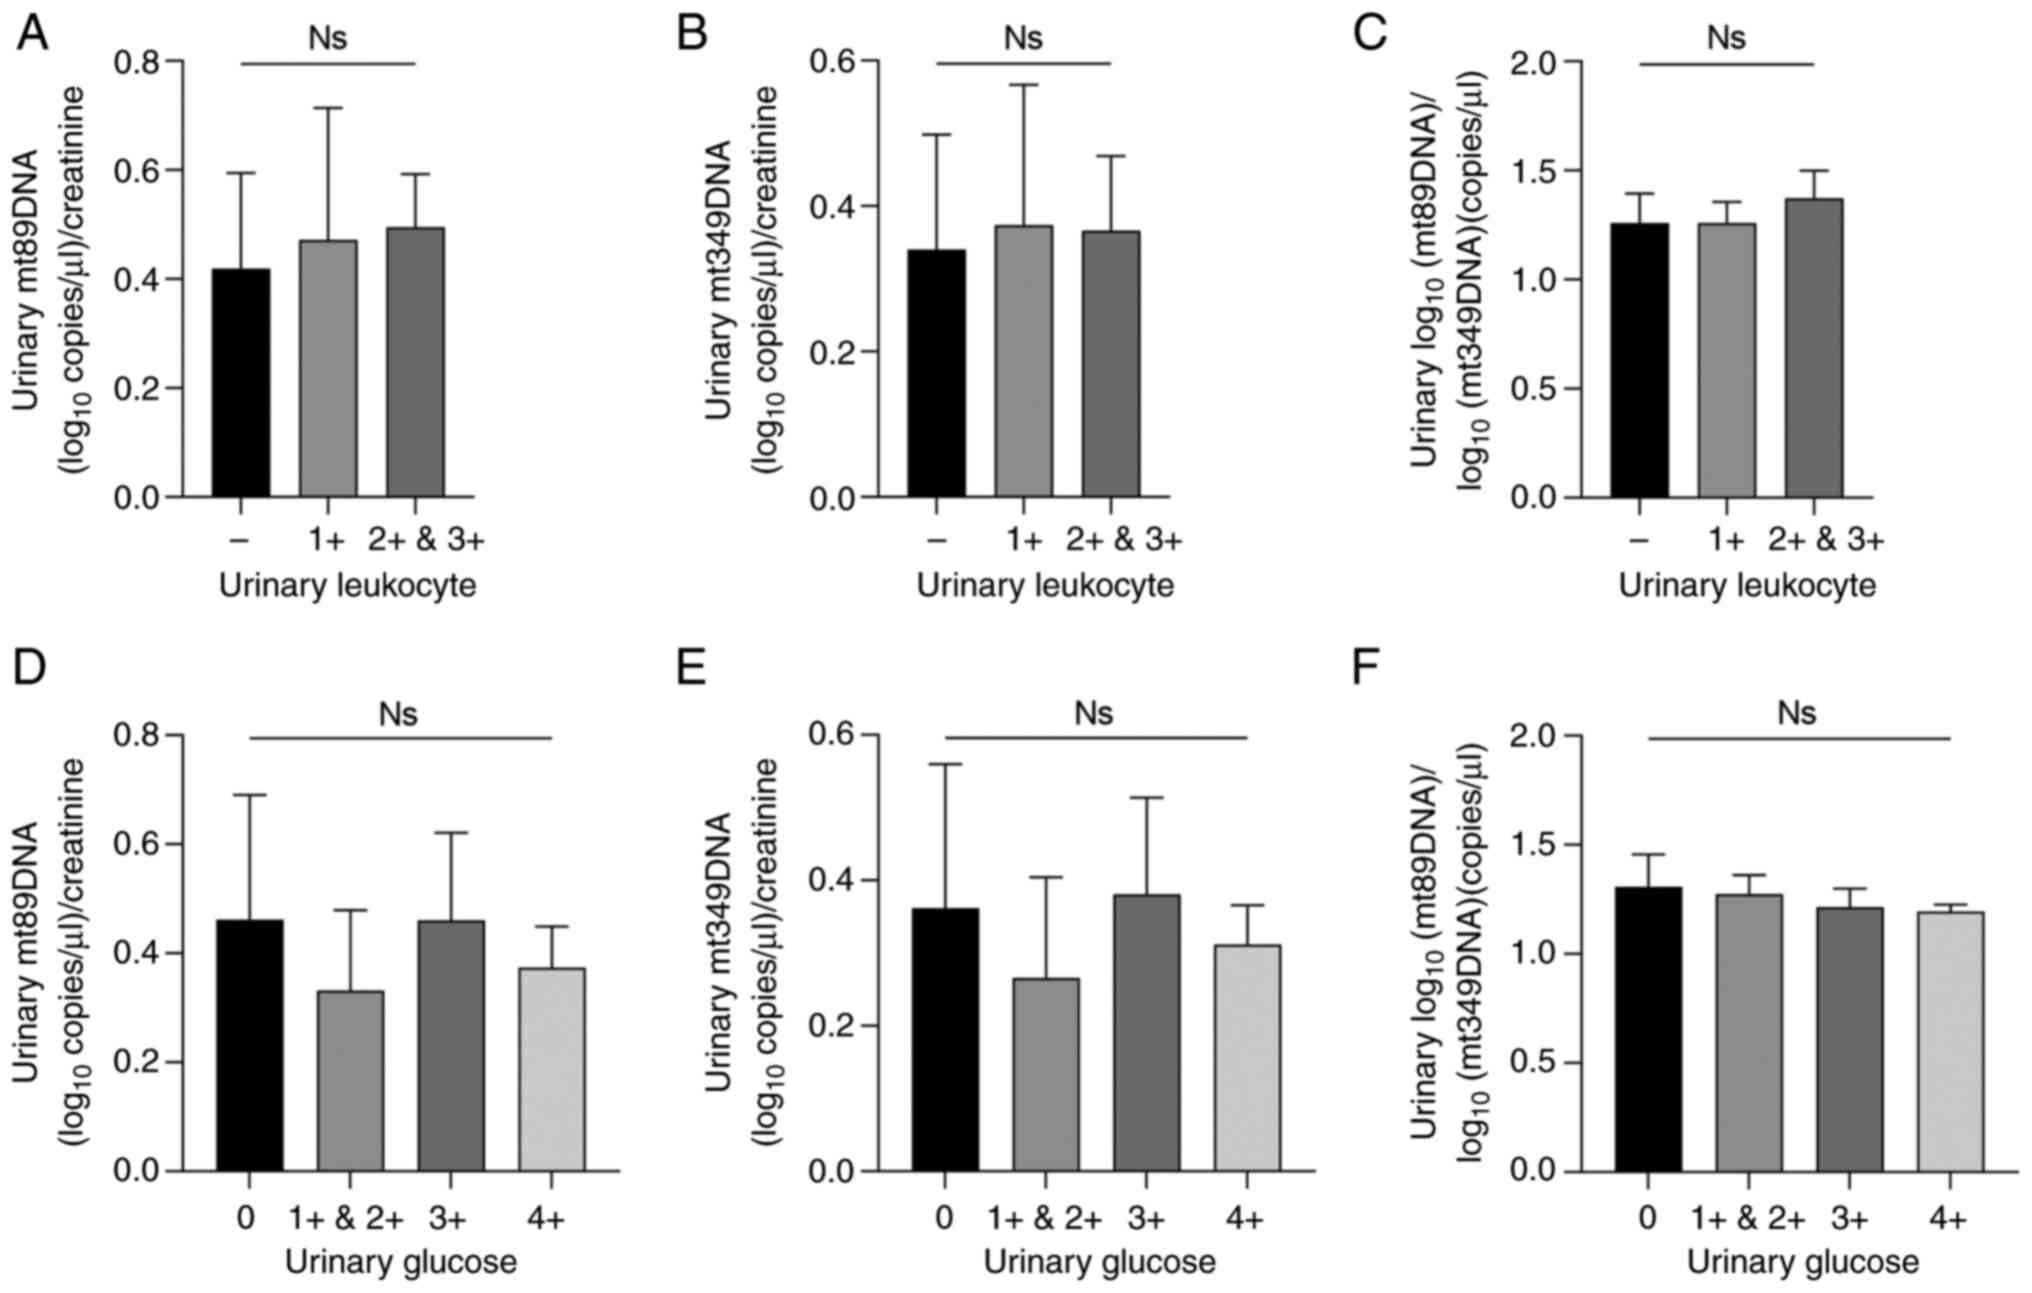
Urinary leukocytes and urinary glucose
do not interfere with urinary mtDNA levels
Fresh urine from patients with T2DM but without DN
was collected for qualitative testing of urinary leukocytes and
glucose levels. According to the test strips, the urinary leukocyte
positive degree was divided into - to 3+ and urinary glucose
positive degree was divided into - to 4+. In patients with T2DM but
without DN, there was no significant difference in urinary mtDNA
levels, indicating that urinary leukocytes and urinary glucose did
not affect urinary mtDNA levels (P>0.05; Fig. 1A-F). Comparisons were performed
using one-way ANOVA followed by Tukey's post hoc test.
Elevated urinary mtDNA levels in
patients with T2DM with mild kidney injury
To study the change in mtDNA level, the degree of
renal impairment in patients with T2DM was grouped by clinical eGFR
staging. The levels of urinary mt89DNA and mt349DNA at eGFR 60-89
ml/min/1.73 m2 [0.56 (0.42-0.84) x109 and
0.45 (0.32-0.74) x109 copies/g, respectively] were
higher than those at eGFR ≥90 [0.37 (0.27-0.55) x109
copies/g and 0.29 (0.21-0.47) x109 copies/g,
respectively] ml/min/1.73 m2 (P=0.005 and P=0.015,
respectively), which showed an increase in urinary mtDNA levels
during the mild kidney injury.
Levels of urinary mt89DNA and mt349DNA at eGFR ≤59
ml/min/1.73 m2 [0.92 (0.64-1.61)x109 and 0.68
(0.46-1.20)x109 copies/g, respectively] were higher than
those at eGFR ≥90 ml/min/1.73 m2 (P<0.001 for both).
The levels of urinary mt89DNA and mt349DNA at eGFR ≤59 ml/min/1.73
m2 were higher than those at eGFR 60-89 ml/min/1.73
m2 (P<0.017 and P<0.025, respectively). The
aforementioned results suggest that urinary mtDNA levels further
increase with the severity of kidney injury (Fig. 2A and B). The ratio of mt89DNA to mt349 in urine
was not significantly different in different groups [1.23
(1.18-1.30)x109 vs. 1.26 (1.21-1.36) x109 vs.
1.34 (1.21-1.39)x109 copies/g, respectively] (Fig. 2C).
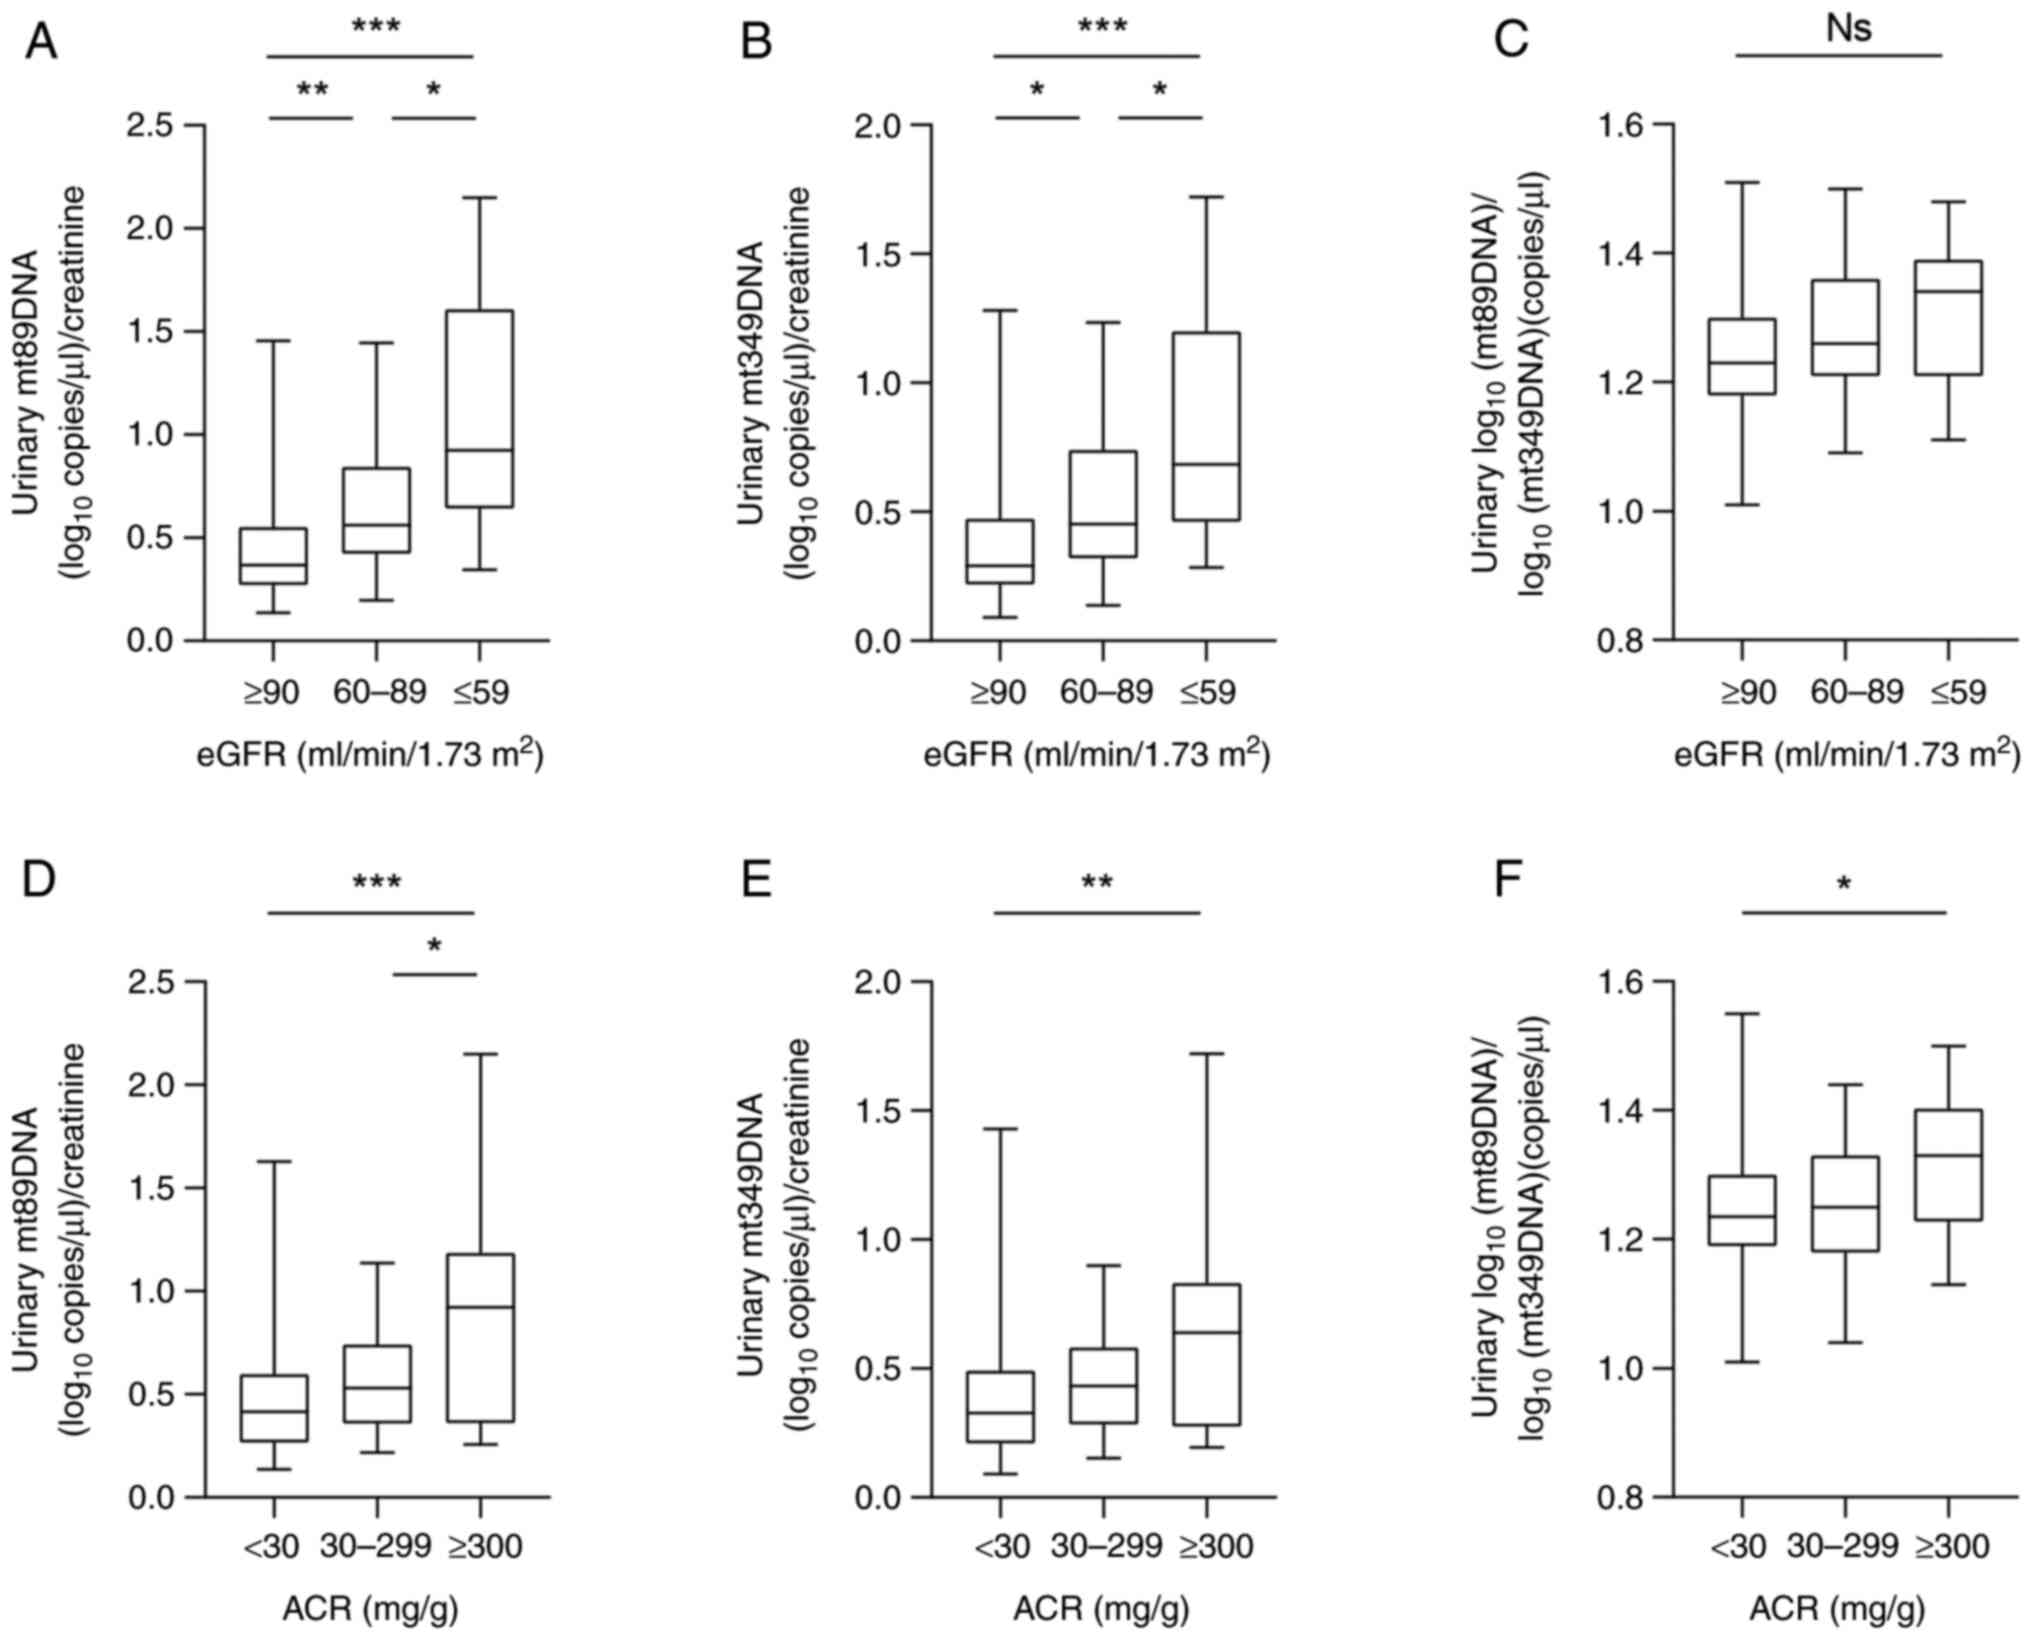 | Figure 2Increased urinary mtDNA levels in
patients with T2DM with mild kidney injury. (A) Urinary mt89DNA
levels in patients with T2DM were staged based on eGFR, with eGFR
≥90 (n=116), eGFR 60-89 (n=34) and eGFR ≤59 ml/min/1.73
m2 (n=15). (B) Urinary mt349DNA levels in patients with
T2DM were staged based on eGFR. (C) Comparison of the ratio of
mt89DNA to mt349 levels in the urine of patients with T2DM
according to eGFR staging. (D) Urinary mt89DNA levels in patients
with T2DM were staged based on ACR, with ACR ≥300 (n=111), ACR
30-299 (n=36) and ACR <30 mg/g (n=18). (E) Urinary mt349DNA
levels in patients with T2DM were staged based on ACR. Data are
presented as median with inter-quartile range. (F) Comparison of
the ratio of mt89DNA to mt349 levels in the urine of patients with
T2DM according to ACR staging. Comparisons were performed using the
Kruskal-Wallis test followed by Dunn's multiple comparisons test.
*P<0.05, **P<0.01 and
***P<0.001. mtDNA, mitochondrial DNA; T2DM, type 2
diabetes mellitus; eGFR, estimated glomerular filtration rate; ACR,
albumin-to-creatinine ratio; Ns, non-significant. |
When patients with T2DM were grouped according to
clinical ACR staging, urinary mt89DNA levels were higher in ACR
≥300 mg/g [0.93 (0.36-1.19)x109 copies/g] than those in
ACR <30 mg/g [0.42 (0.27-0.60)x109 copies/g] and ACR
30-299 mg/g [0.52 (0.36-0.71)x109 copies/g; P=0.001 and
P<0.037, respectively]. Urinary mt349DNA levels were higher in
ACR ≥300 mg/g [0.64 (0.27-0.83)x109 copies/g] than those
in ACR <30 mg/g [0.33 (0.21-0.49)x109 copies/g;
P=0.004; Fig. 2D and E]. The ratio of urinary mt89DNA to mt349
was higher in ACR ≥300 mg/g than that in ACR <30 mg/g [1.33
(1.23-1.40)x109 vs. 1.23 (1.19-1.30)x109
copies/g; P=0.038; Fig. 2F].
Comparisons were performed using the Kruskal-Wallis test followed
by Dunn's multiple comparisons test.
Correlation of urinary mtDNA with
clinical variables in patients with T2DM
Urinary mtDNA expression and clinical variables in
patients with T2DM were correlated using Spearman correlation
analysis (Tables III and
IV). Urinary mt89DNA was
negatively correlated with eGFR (ρ=-0.437; P<0.001) and
positively correlated with Cys-C (ρ=0.177; P=0.025). Urinary
mt349DNA was negatively correlated with eGFR (ρ=-0.390;
P<0.001).
| Table IIIUnivariate correlation between
urinary mt89DNA (log transformed data before analysis) and clinical
variables. |
Table III
Univariate correlation between
urinary mt89DNA (log transformed data before analysis) and clinical
variables.
| Clinical
variable | ρ correlation
coefficient | P-value |
|---|
| eGFR (ml/min/1.73
m2) | -0.437 | <0.001 |
| mAlb (mg/l) | -0.070 | 0.374 |
| Scr (µmol/l) | -0.023 | 0.773 |
| Urea (mmol/l) | 0.082 | 0.297 |
| UA (µmol/l) | -0.098 | 0.213 |
| Cys-C (mg/l) | 0.177 | 0.025 |
| Table IVUnivariate correlation between
urinary mt349DNA (log transformed data before analysis) and
clinical variables. |
Table IV
Univariate correlation between
urinary mt349DNA (log transformed data before analysis) and
clinical variables.
| Clinical
variable | ρ correlation
coefficient | P-value |
|---|
| eGFR (ml/min/1.73
m2) | -0.390 | <0.001 |
| mAlb (mg/l) | -0.101 | 0.199 |
| Scr (µmol/l) | -0.049 | 0.534 |
| Urea (mmol/l) | 0.060 | 0.448 |
| UA (µmol/l) | -0.112 | 0.156 |
| Cys-C (mg/l) | 0.144 | 0.070 |
Urinary mtDNA is a correlating factor
for early DN
The present study compared urinary mtDNA and
clinical variables between patients with T2DM in the eGFR ≥90
ml/min/1.73 m2 group and the eGFR 60-89 ml/min/1.73
m2 group to analyze correlated factors for early DN.
Through univariate logistic regression analysis, it
was found that the occurrence of early DN was positively associated
with urinary mt89DNA levels [odds ratio (OR), 1.330; 95% confidence
interval (CI), 1.175-1.507; P<0.001], positively associated with
mAlb and Urea levels (OR, 1.002; 95% CI, 1.001-1.003; P=0.003 and
OR, 1.418; 95% CI, 1.142-1.760; P=0.002), and positively correlated
with Cys-C levels (OR, 1.372; 95% CI, 1.179-1.597; P<0.001).
After multivariate adjustments, the occurrence of early DN was
positively associated with urinary mt89DNA (OR, 1.322; 95% CI,
1.152-1.516; P<0.001), and positively correlated with Cys-C
levels (OR, 1.319; 95% CI, 1.081-1.608; P=0.006; Table V).
| Table VCorrelated factors for eGFR ≥90
(ml/min/1.73 m2) and eGFR <90 (ml/min/1.73
m2) were analyzed using binary logistic regression. |
Table V
Correlated factors for eGFR ≥90
(ml/min/1.73 m2) and eGFR <90 (ml/min/1.73
m2) were analyzed using binary logistic regression.
| | Univariate | Multivariate |
|---|
| Clinical
variables | OR (95% CI) | P-value | OR (95% CI) | P-value |
|---|
| mt89DNA (per
108 copies/g) | 1.330
(1.175-1.507) | <0.001 | 1.322
(1.152-1.516) | <0.001 |
| mAlb (per 1
mg/l) | 1.002
(1.001-1.003) | 0.003 | 1.000
(0.999-1.001) | 0.938 |
| Urea (per 1
mmol/l) | 1.418
(1.142-1.760) | 0.002 | 1.208
(0.898-1.624) | 0.213 |
| UA (per 1
µmol/l) | 1.000
(0.997-1.004) | 0.923 | - | - |
| Cys-C (per 10
mg/l) | 1.372
(1.179-1.597) | <0.001 | 1.319
(1.081-1.608) | 0.006 |
Based on univariate logistic regression analysis, it
was found that the occurrence of early DN was positively associated
with urinary mt349DNA levels (OR, 1.328; 95% CI, 1.156-1.525;
P<0.001), positively associated with mAlb and Urea levels (OR,
1.002; 95% CI, 1.001-1.003; P=0.003 and OR, 1.418; 95% CI,
1.142-1.760; P=0.002) and Cys-C levels were positively correlated
(OR, 1.372; 95% CI, 1.179-1.597; P<0.001). After multivariate
adjustments, the occurrence of early DN was positively correlated
with urinary mt349DNA levels (OR, 1.337; 95% CI, 1.145-1.560;
P=0.002), and positively correlated with Cys-C levels (OR, 1.335;
95% CI, 1.097-1.626; P=0.004; Table
VI).
| Table VIcorrelate factors for eGFR ≥90
(ml/min/1.73 m2) and eGFR <90 (ml/min/1.73
m2) were analyzed using binary logistic regression. |
Table VI
correlate factors for eGFR ≥90
(ml/min/1.73 m2) and eGFR <90 (ml/min/1.73
m2) were analyzed using binary logistic regression.
| | Univariate | Multivariate |
|---|
| Clinical
variables | OR (95% CI) | P-value | OR (95% CI) | P-value |
|---|
| mt349DNA (per
108 copies/g) | 1.328
(1.156-1.525) | <0.001 | 1.337
(1.145-1.560) | 0.002 |
| mAlb (per 1
mg/l) | 1.002
(1.001-1.003) | 0.003 | 1.000
(0.999-1.001) | 0.979 |
| Urea (per 1
mmol/l) | 1.418
(1.142-1.760) | 0.002 | 1.208
(0.898-1.625) | 0.212 |
| UA (per 1
µmol/l) | 1.000
(0.997-1.004) | 0.923 | - | - |
| Cys-C (per 10
mg/l) | 1.372
(1.179-1.597) | <0.001 | 1.335
(1.097-1.626) | 0.004 |
Discussion
Usually, DN is diagnosed several years after the
onset of the disease, during which various organ damage has
occurred. On the other hand, the early diagnosis of DN provides the
possibility of renal protective therapy, which can significantly
delay the progression to ESRD (21,22).
Currently, the typical clinical indicators used to
assess the diagnosis and progression of DN are Scr, eGFR, Cys-C and
mAlb (23). mAlb is known to be
the earliest marker of DN. However, mAlb is nonspecific and is
involved in exercise, urinary tract injury and acute disease
(11,24-26).
In cases where a patient refuses to undergo a kidney biopsy, the DN
diagnosis requires a combination of several non-invasive indicators
to be accurate. Therefore, there is a need to explore new
non-invasive biomarkers that would benefit DN patients (23,27,28).
A previous study reported that mitochondrial
dysfunction can affect key cellular functions (29). The kidney is an organ rich in
mitochondria and damage to the parenchymal cells of the kidney can
lead to mtDNA leakage into the urine (15,30).
Cell free DNA (cfDNA), refers to highly fragmented DNA that is
present in the human blood circulation and is free from cells. As
an ultra-noninvasive tool for liquid biopsy, urinary cfDNA has
unique advantages in molecular profiling of tumors, which is
considered to have a complementary and synergistic effect on serum
and plasma in diagnosis, progression surveillance, treatment
monitoring and prognosis for both urological and non-urological
cancers (31). The present study
used urine as a biomarker because it is simple to extract and can
be screened in patients (32).
Alterations in mitochondria may be the underlying
cause of various complex diseases. A previous study implicated
mtDNA in triggering and maintaining inflammation in the heart
(33). mtDNA in urine was linked
to chronic obstructive pulmonary disease (30). Urinary mtDNA may serve as a
potential marker for bladder cancer (34). In addition, studies have associated
mitochondrial disorders with some kidney diseases. For example, the
prognosis of non-diabetic chronic kidney disease is associated with
urinary mtDNA (35). Another study
showed that urinary mtDNA can be used to assess renal mitochondrial
damage in patients with vascular hypertension undergoing renal
revascularization (36). However,
to the best of the authors' knowledge, there are only a few reports
on patients with DN related to urinary mtDNA.
The size of cfDNA is ~40-bp. Longer DNA fragments
>200 bp or even >10 kbp are derived from necrotic cells.
Shorter DNA fragments <100 bp result from apoptotic cells,
including circulating tumor-specific cell-free DNA, mtDNA and
bacterial DNA (37). Therefore,
two mtDNA primers with different lengths, namely mt89DNA and
mt349DNA, were chosen in the present study to compare the changes
of mtDNA levels following kidney damage caused by DN. Although a
small amount of DNA is theoretically released by leukocytes in the
urine, urine specimens collected in the present study were
centrifuged to exclude the effect of most leukocytes and the
experimental results showed that urinary leukocytes did not affect
the urinary mtDNA levels. This result suggests that urinary mtDNA
may originate more from renal cell damage than from leukocytes. In
addition, the results of the current study showed that urinary
glucose levels also did not affect urinary mtDNA levels. In a
previous study from the present authors, the expression of
circulating mt89DNA and mt349DNA was not specific and was detected
at low levels, suggesting that the mtDNA in the urine mainly
originated from kidney injury than from circulation (38). However, this finding needs to be
further demonstrated through renal pathology biopsy.
It has been shown that high plasma glucose leads to
mitochondrial dysfunction through the activation of several
metabolic pathways (8) and
oxidative stress caused by damage to the kidney itself, which leads
to mtDNA damage. Therefore, mtDNA expression is different in
different degrees of kidney injury (39).
The present study showed that the mtDNA levels in
the urine were already elevated in case of mild kidney injury. As
the degree of renal injury progressed, mtDNA levels increased
further. mtDNA ratios increased with the degree of renal damage
(Fig. 2). These results may
indicate the predominance of apoptotic forms of kidney injury.
Furthermore, when kidney injury is moderate or severe, apoptotic
cells are produced in large numbers, leading to a significant
release of small fragments of mtDNA. Even though mtDNA in urine
correlated weakly with other indicators of kidney injury, it
correlated negatively with eGFR, suggesting that mtDNA levels in
urine are related to kidney function (Tables III and IV).
An important change in early DN reaching the later
stages of DN is a decrease in eGFR. Thus, the present study
compared urinary mtDNA and clinical variables in patients with T2DM
in the eGFR ≥90 and eGFR <90 ml/min/1.73 m2 groups to
analyze correlated factors for early DN. The results showed that
the occurrence of early DN was positive correlated with urinary
mtDNA, mAlb, Urea and Cys-C levels following univariate logistic
regression analysis, and only positive correlated with urinary
mtDNA and Cys-C levels following multivariate adjustment. This
finding may provide new clues for the diagnosis of early DN; using
clinical variables in combination with urinary mtDNA is useful
(Tables V and VI).
Preventing or improving mitochondrial dysfunction
can prevent and treat DN (10).
Mitochondrial damage is involved in the pathological process of DN
and the use of antioxidants as therapeutics will provide a way for
the clinical treatment of DN (40).
The diagnosis of early DN is challenging. Most
patients do not undergo renal biopsy but rely more on the combined
analysis of non-invasive biomarkers of each renal injury, which is
more reliable for the diagnosis of early DN (3). In patients with T2DM, urinary mtDNA
is associated with renal impairment and urinary mtDNA is one of the
factors associated with early DN (38). Therefore, the detection of urinary
mtDNA is useful for the diagnosis of early DN.
There are several shortcomings to the present study.
First, the sample size was insufficient, especially for patients
with severe kidney injury. Second, it would have been more
convincing if long-term follow-ups were started from the early
stages of the disease and kidney biopsy samples collected from the
patients with T2DM to assess the role of urinary mtDNA in DN
progression. Third, the age of subjects in healthy control group
were generally lower than that in type 2 diabetic patients. The
present study found that the level of mtDNA in type 2 diabetes
patients without kidney damage was higher compared with that in the
healthy control group (data not shown), which may be due to
oxidative stress caused by diabetes leading to mitochondrial
damage, leading to an increase in the level of mtDNA. However, due
to differences in age, the results may be biased, so we did not
present this result in this article and only made a preliminary
comparison. Therefore, the present findings need to be verified by
further studies. Animal experiments will be performed to verify the
correlation of mtDNA in DN.
Although urine mtDNA cannot be used as a specific
marker for DN in the clinic, it is clearly correlated with DN. The
kidney is the second organ with the highest oxygen consumption in
the body and is rich in mitochondria (8,9).
mtDNA release is caused by early cell injury and the early
development of DN can be caused by mitochondrial damage such as
oxidative stress in kidney cells thus affecting the production of
urinary mtDNA (12,13). When other influencing factors are
excluded, urinary mtDNA combined with other clinical indicators of
kidney injury may help the diagnosis of early DN (Table V and VI). Injury-released mtDNA is involved in
the occurrence and development of T2DM. In patients with T2DM,
urinary mtDNA increases in the early stages of DN and urinary mtDNA
is one of the factors associated with early DN; therefore, it can
be used as a non-invasive biomarker and combined with other
clinical indicators of kidney injury to help diagnose early DN.
Acknowledgements
Not applicable.
Funding
Funding: No funding was received.
Availability of data and materials
The datasets used and/or analyzed during the current
study are available from the corresponding author on reasonable
request.
Authors' contributions
HL designed the study. LX and XY interpreted results
and drafted the manuscript. YS tested urinary mtDNA in the samples.
JZ and CW collected samples, and were involved in the acquisition
and analysis of data. HL and LX confirm the authenticity of all the
raw data. All authors read and approved the final manuscript.
Ethics approval and consent to
participate
The study conforms to the provisions of the
Declaration of Helsinki and was approved by the Clinical Medical
Research Ethics Committee of the Fourth Affiliated Hospital of
Harbin Medical University (approval no. 2022-WZYSLLSC-30). All
patients gave written informed consent for urine and blood
collection and the analysis was approved by the ethic
committee.
Patient consent for publication
Not applicable.
Competing interests
The authors declare that they have no competing
interests.
References
|
1
|
Jha V, Garcia-Garcia G, Iseki K, Li Z,
Naicker S, Plattner B, Saran R, Wang AY and Yang CW: Chronic kidney
disease: Global dimension and perspectives. Lancet. 382:260–272.
2013.PubMed/NCBI View Article : Google Scholar
|
|
2
|
Yang C, Wang H, Zhao X, Matsushita K,
Coresh J, Zhang L and Zhao MH: CKD in China: Evolving spectrum and
public health implications. Am J Kidney Dis. 76:258–264.
2020.PubMed/NCBI View Article : Google Scholar
|
|
3
|
Zhang L, Long J, Jiang W, Shi Y, He X,
Zhou Z, Li Y, Yeung RO, Wang J, Matsushita K, et al: Trends in
chronic kidney disease in China. N Engl J Med. 375:905–906.
2016.PubMed/NCBI View Article : Google Scholar
|
|
4
|
World Health Organization. The top 10
causes of death. WHO. 2020-12-09.
|
|
5
|
Morton RL and Shah KK: Kidney health in
the context of economic development. Nat Rev Nephrol. 17:5–6.
2021.PubMed/NCBI View Article : Google Scholar
|
|
6
|
Luyckx VA, Cherney DZI and Bello AK:
Preventing CKD in developed countries. Kidney Int Rep. 5:263–277.
2020.PubMed/NCBI View Article : Google Scholar
|
|
7
|
Fu H, Liu S, Bastacky SI, Wang X, Tian XJ
and Zhou D: Diabetic kidney diseases revisited: A new perspective
for a new era. Mol Metab. 30:250–263. 2019.PubMed/NCBI View Article : Google Scholar
|
|
8
|
Wei PZ and Szeto CC: Mitochondrial
dysfunction in diabetic kidney disease. Clin Chim Acta.
496:108–116. 2019.PubMed/NCBI View Article : Google Scholar
|
|
9
|
Bhargava P and Schnellmann RG:
Mitochondrial energetics in the kidney. Nat Rev Nephrol.
13:629–646. 2017.PubMed/NCBI View Article : Google Scholar
|
|
10
|
Schiffer TA and Friederich-Persson M:
Mitochondrial reactive oxygen species and kidney hypoxia in the
development of diabetic nephropathy. Front Physiol.
8(211)2017.PubMed/NCBI View Article : Google Scholar
|
|
11
|
Miranda-Diaz AG, Pazarin-Villasenor L,
Yanowsky-Escatell FG and Andrade-Sierra J: Oxidative stress in
diabetic nephropathy with early chronic kidney disease. J Diabetes
Res. 2016(7047238)2016.PubMed/NCBI View Article : Google Scholar
|
|
12
|
Tang Z, Zeng F and Zhang XZ: Human
genetics of diabetic nephropathy. Ren Fail. 37:363–371.
2015.PubMed/NCBI View Article : Google Scholar
|
|
13
|
Che R, Yuan Y, Huang S and Zhang A:
Mitochondrial dysfunction in the pathophysiology of renal diseases.
Am J Physiol Renal Physiol. 306:F367–F378. 2014.PubMed/NCBI View Article : Google Scholar
|
|
14
|
Galvan DL, Green NH and Danesh FR: The
hallmarks of mitochondrial dysfunction in chronic kidney disease.
Kidney Int. 92:1051–1057. 2017.PubMed/NCBI View Article : Google Scholar
|
|
15
|
Zhang M, Zhang Y, Wu M, Li Z and Li X, Liu
Z, Hu W, Liu H and Li X: Importance of urinary mitochondrial DNA in
diagnosis and prognosis of kidney diseases. Mitochondrion.
61:174–178. 2021.PubMed/NCBI View Article : Google Scholar
|
|
16
|
Wei PZ, Kwan BC, Chow KM, Cheng PM, Luk
CC, Li PK and Szeto CC: Urinary mitochondrial DNA level is an
indicator of intra-renal mitochondrial depletion and renal scarring
in diabetic nephropathy. Nephrol Dial Transplant. 33:784–788.
2018.PubMed/NCBI View Article : Google Scholar
|
|
17
|
Wei Z, Kwan BC, Chow KM, Cheng PM, Luk CC,
Lai KB, Li PK and Szeto CC: Urinary mitochondrial DNA level as a
biomarker of tissue injury in non-diabetic chronic kidney diseases.
BMC Nephrol. 19(367)2018.PubMed/NCBI View Article : Google Scholar
|
|
18
|
Padilla-Martinez F, Wojciechowska G,
Szczerbinski L and Kretowski A: Circulating nucleic acid-based
biomarkers of type 2 diabetes. Int J Mol Sci.
23(295)2021.PubMed/NCBI View Article : Google Scholar
|
|
19
|
Alberti KG and Zimmet PZ: Definition,
diagnosis and classification of diabetes mellitus and its
complications. Part 1: Diagnosis and classification of diabetes
mellitus. Provisional report of a WHO consultation. Diabetic Med.
15:539–553. 1998.PubMed/NCBI View Article : Google Scholar
|
|
20
|
Zhang WZ, Rice MC, Hoffman KL, Oromendia
C, Barjaktarevic IZ, Wells JM, Hastie AT, Labaki WW, Cooper CB,
Comellas AP, et al: Association of urine mitochondrial DNA with
clinical measures of COPD in the SPIROMICS cohort. JCI insight.
5(e133984)2020.PubMed/NCBI View Article : Google Scholar
|
|
21
|
Żyłka A, Gala-Błądzińska A, Rybak K,
Dumnicka P, Drożdż R and Kuśnierz-Cabala B: Role of new biomarkers
for the diagnosis of nephropathy associated with diabetes type 2.
Folia Med Cracov. 55:21–33. 2015.PubMed/NCBI
|
|
22
|
Kim K, Lee J, Park J, Lee E, Moon J, Lee
S, Lee JS, Kim JH and Kim HS: Identification of novel biomarker for
early detection of diabetic nephropathy. Biomedicines.
9(457)2021.PubMed/NCBI View Article : Google Scholar
|
|
23
|
Satirapoj B: Tubulointerstitial biomarkers
for diabetic nephropathy. J Diabetes Res.
2018(2852398)2018.PubMed/NCBI View Article : Google Scholar
|
|
24
|
Fiseha T: Urinary biomarkers for early
diabetic nephropathy in type 2 diabetic patients. Biomark Res.
3(16)2015.PubMed/NCBI View Article : Google Scholar
|
|
25
|
Yu SM and Bonventre JV: Acute kidney
injury and progression of diabetic kidney disease. Adv Chronic
Kidney Dis. 25:166–180. 2018.PubMed/NCBI View Article : Google Scholar
|
|
26
|
Higgins GC and Coughlan MT: Mitochondrial
dysfunction and mitophagy: The beginning and end to diabetic
nephropathy? Br J Pharmacol. 171:1917–1942. 2014.PubMed/NCBI View Article : Google Scholar
|
|
27
|
Said SM and Nasr SH: Silent diabetic
nephropathy. Kidney Int. 90:24–26. 2016.PubMed/NCBI View Article : Google Scholar
|
|
28
|
Lee S and Choi ME: Urinary biomarkers for
early diabetic nephropathy: Beyond albuminuria. Pediatr Nephrol.
30:1063–1075. 2014.PubMed/NCBI View Article : Google Scholar
|
|
29
|
Czajka A, Ajaz S, Gnudi L, Parsade CK,
Jones P, Reid F and Malik AN: Altered mitochondrial function,
mitochondrial DNA and reduced metabolic flexibility in patients
with diabetic nephropathy. EBioMedicine. 2:499–512. 2015.PubMed/NCBI View Article : Google Scholar
|
|
30
|
Zhang WZ, Rice MC, Hoffman KL, Oromendia
C, Barjaktarevic IZ, Wells JM, Hastie AT, Labaki WW, Cooper CB,
Comellas AP, et al: Association of urine mitochondrial DNA with
clinical measures of COPD in the SPIROMICS cohort. JCI Insight.
5(e133984)2020.PubMed/NCBI View Article : Google Scholar
|
|
31
|
Lu T and Li J: Clinical applications of
urinary cell-free DNA in cancer: Current insights and promising
future. Am J Cancer Res. 7:2318–2332. 2017.PubMed/NCBI
|
|
32
|
Gluhovschi C, Gluhovschi G, Petrica L,
Timar R, Velciov S, Ionita I, Kaycsa A and Timar B: Urinary
biomarkers in the assessment of early diabetic nephropathy. J
Diabetes Res. 2016(4626125)2016.PubMed/NCBI View Article : Google Scholar
|
|
33
|
Oka T, Hikoso S, Yamaguchi O, Taneike M,
Takeda T, Tamai T, Oyabu J, Murakawa T, Nakayama H, Nishida K, et
al: Mitochondrial DNA that escapes from autophagy causes
inflammation and heart failure. Nature. 485:251–255.
2012.PubMed/NCBI View Article : Google Scholar
|
|
34
|
Chang HW, Tsui KH, Shen LC, Huang HW, Wang
SN and Chang PL: Urinary cell-free DNA as a potential tumor marker
for bladder cancer. Int J Biol Markers. 22:287–294. 2007.PubMed/NCBI View Article : Google Scholar
|
|
35
|
Chang CC, Chiu PF, Wu CL, Kuo CL, Huang
CS, Liu CS and Huang CH: Urinary cell-free mitochondrial and
nuclear deoxyribonucleic acid correlates with the prognosis of
chronic kidney diseases. BMC Nephrol. 20(391)2019.PubMed/NCBI View Article : Google Scholar
|
|
36
|
Eirin A, Herrmann SM, Saad A, Abumoawad A,
Tang H, Lerman A, Textor SC and Lerman LO: Urinary mitochondrial
DNA copy number identifies renal mitochondrial injury in
renovascular hypertensive patients undergoing renal
revascularization: A pilot study. Acta Physiol (Oxf).
226(e13267)2019.PubMed/NCBI View Article : Google Scholar
|
|
37
|
Kustanovich A, Schwartz R, Peretz T and
Grinshpun A: Life and death of circulating cell-free DNA. Cancer
Biol Ther. 20:1057–1067. 2019.PubMed/NCBI View Article : Google Scholar
|
|
38
|
Cao H, Wu J, Luo J, Chen X, Yang J and
Fang L: Urinary mitochondrial DNA: A potential early biomarker of
diabetic nephropathy. Diabetes Metab Res Rev.
35(e3131)2019.PubMed/NCBI View Article : Google Scholar
|
|
39
|
Lin Y, Chang Y, Yang S, Wu K and Chu T:
Update of pathophysiology and management of diabetic kidney
disease. J Formos Med Assoc. 117:662–675. 2018.PubMed/NCBI View Article : Google Scholar
|
|
40
|
Ceriello A, Ihnat MA and Thorpe JE:
Clinical review 2: The ‘metabolic memory’: is more than just tight
glucose control necessary to prevent diabetic complications? J Clin
Endocrinol Metab. 94:410–415. 2009.PubMed/NCBI View Article : Google Scholar
|