Introduction
Neovascular age-related macular degeneration (nAMD),
also known as exudative AMD, is a progressive retinal disease
characterized by the development of choroidal and/or subretinal
neovascularization. This condition is frequently accompanied by
serous and hemorrhagic complications, including bleeding in the
subretinal or retinal pigment epithelium (RPE) region, as well as
the presence of lipid exudation and the accumulation of subretinal
fluid. The abnormal structural characteristics of
neovascularization trigger a cascade of pathological processes such
as exudation, bleeding, organization, and fibrotic scarring,
ultimately culminating in the loss of central vision (1,2).
Anti-vascular endothelial growth factor (anti-VEGF)
treatment has emerged as the primary and most effective therapeutic
approach for nAMD in the clinical setting. This strategy is
grounded in the recognition that VEGF plays a crucial role in
ocular neovascularization (3-5).
First-line intravitreal-injectable anti-VEGF drugs employed for the
treatment of nAMD include ranibizumab (manufactured by Genentech,
Inc. and Novartis International AG). Ranibizumab is a humanized
recombinant monoclonal antibody fragment designed to inhibit human
vascular endothelial growth factor A. Additionally, aflibercept
(manufactured by Regeneron Pharmaceuticals Inc. and Bayer
Healthcare Company Ltd.) and conbercept (KH902; marketed as Lumitin
and developed by Chengdu Kanghong Biotech, Ltd.) are both soluble
fusion protein agents (6).
While anti-VEGF drugs are generally effective in
inhibiting the leakage and bleeding associated with macular
neovascularization (MNV) in most nAMD patients, responses to
anti-VEGF therapy can vary among individuals with MNV. This
heterogeneity implies that the pathological basis for this
condition is multifactorial in nature. The diagnosis of MNV is
typically established using fluorescein angiography (FA) or
indocyanine green angiography (ICGA), which dynamically display
abnormal vessels and observe vascular leakage. Optical coherence
tomography angiography (OCTA), renowned for its high sensitivity in
detecting MNV in nAMD, serves as a rapid, safe, non-invasive, and
repeatable imaging modality capable of providing detailed
visualizations of different MNV types (7,8).
Additionally, OCTA allows for the detection and quantification of
quantitative information regarding MNV flow and area (9).
Studies have elucidated the morphological features
of MNV in nAMD and classified them into types such as ‘tangled’ or
‘glomerulus’ and ‘seafan’ or ‘Medusa’ using OCTA (10,11).
Researchers have examined the evolution of OCTA qualitative and
quantitative biomarkers, encompassing branching capillaries,
anastomoses and loops, peripheral arcade and hypointense halo for
MNV, following anti-VEGF therapy (12,13).
However, the variations in OCTA quantitative data for different
morphological patterns of MNV following anti-VEGF treatment and
their clinical implications remain to be elucidated.
Moreover, the structural and mechanistic differences
between conbercept and ranibizumab have not been thoroughly
explored in terms of OCTA quantitative outcomes for various
morphological patterns of MNV in nAMD. No study to date has
reported on the OCTA quantitative outcomes of different
morphological patterns of MNV for nAMD treated with intravitreal
conbercept (IVC) compared with intravitreal ranibizumab (IVR).
Additionally, the relationship between these OCTA quantitative
parameters and visual prognosis after different anti-VEGF drug
treatments is still under evaluation and remains inconclusive.
The primary objective of the present study was to
analyze the outcomes of quantitative parameters identified through
OCTA examination following a ‘3+PRN’ regimen of IVC or IVR in
patients exhibiting various morphological patterns of MNV.
Additionally, the present study aimed to compare the visual
prognosis associated with different MNV morphologies following IVC
or IVR treatment. Notably, this investigation represented the first
attempt, to the to the best of the authors' knowledge, to assess
changes in quantitative parameters among distinct MNV patterns
identified by OCTA in nAMD patients treated with conbercept.
Materials and methods
Study design
This prospective, interventional case series study
was carried out at Shaanxi Provincial People's Hospital in Xi'an,
China. The study received approval from the ethics committee of
Shaanxi Provincial People's Hospital [Xi'an, China; approval no.
2022 no. (R002)], and it was conducted in accordance with the
principles outlined in the Declaration of Helsinki. Prior to the
intravitreal injection of anti-VEGF agents, written informed
consent was obtained from each study subject. It was crucial to
emphasize that we had access to information allowing the
identification of individual participants both during and after the
data collection process.
Study subjects
The present study enrolled 39 patients diagnosed
with nAMD who underwent IVR or IVC at Shaanxi Provincial People's
Hospital between April 2022 and August 2023. Only treatment-naïve
patients, those who had not previously received any treatment for
nAMD, were included in the present study. The inclusion criteria
for patients with nAMD were as follows: i) Age ≥50 years; ii)
OCT/OCTA revealing intra/subretinal fluid (IRF/SRF) or retinal
pigment epithelium detachment (PED); iii) MNV identified by FA,
ICGA, and OCTA [diagnosed and classified by the same retina
specialist (Jing Li)]; and iv) the patient clearly displaying
either the ‘Medusa,’ ‘seafan,’ or ‘tangled’ type of MNV. Exclusion
criteria for this study included: i) Systemic and ocular diseases
causing changes in fundus vasculopathy (e.g., diabetic retinopathy,
retinal vascular obstruction); ii) another ocular maculopathy
causing MNV [e.g., polypoidal choroidal vasculopathy (PCV), myopic
maculopathy, central serous chorioretinopathy, and macular
telangiectasia]; iii) hazy media causing refractive stroma and
inability to cooperate with the examination; and iv) a history of
previous eye surgery or therapy except for cataract (e.g.,
vitrectomy, photodynamic therapy, other drug injection).
Treatment
A total of 26 eyes of 23 patients received treatment
with conbercept (0.5 mg/0.05 ml), while 18 eyes of 16 patients were
treated with ranibizumab (0.5 mg/0.05 ml). The intravitreal
injection procedure was consistently performed by the same retina
specialist (Jing Li). The treatment protocols adhered to the
‘3+PRN’ regimen. All intravitreal injections were conducted as
strict aseptic operations following topical administration using
povidone-iodine. A topical antibiotic, levofloxacin, was
administered 3 days before or after the injection. Comprehensive
preoperative and postoperative ophthalmologic examinations were
conducted for all patients, including slit-lamp biomicroscopy and
dilated fundus examination.
Data collection, image acquisition and
analysis
The baseline characteristics of all enrolled
patients, encompassing age, sex and past medical history, were
meticulously recorded. Best-corrected visual acuity (BCVA) was
measured and documented by the same clinician, with subsequent
conversion according to the minimum resolution angle logarithm
(logMAR) visual acuity.
Central macular thickness (CMT), defined as the
distance between the internal limiting membrane (ILM) and the RPE,
was measured using a 512x128 scanning mode. The depth enhancement
technique, combined with the artifact removal model, was employed
to track the retina within the deep macular 6x6 mm² region until
two scans of satisfactory quality were obtained (14). The OCT-based optical
microangiography (OMAG) algorithm facilitated the detection of
amplitude and phase changes between continuous B-scans at the same
position, enabling quantification of motion contrast and generating
the OCTA image (15).
The OCTA images were analyzed using the built-in
OCTA software. The RPE layer was manually divided to extract the
optimal profile image, and the boundary line was fine-tuned
manually to exhibit the clearest MNV morphology. A total of six
images at the same RPE level were acquired to minimize errors. The
images were saved in a standardized format and then imported into
ImageJ (v1.54a) software (National Institutes of Health) for
thresholding and binarization of pixel intensity.
Each image was magnified 800 times, and the MNV
blood vessel area was measured by manually sketching the visible
blood vessels with a line of 1 pixel wide. The vascular density
ratio was defined as the ratio of the total pixel area within the
scanned 6x6 mm² area occupied by vessels in red pixels. The scale
conversion relationship was established as 68.8335 (pixel)=1
mm.
All patients, including those diagnosed with nAMD
and MNV, underwent comprehensive examinations conducted by the same
retina specialist (Jing Li), using OCTA and OCT imaging (CIRRUS
HD-OCT model 5000 with AngioPlex®; Carl Zeiss Meditec
AG). Baseline and structural data were collected before the
injection (T1) and at 1 (T2), 7 (T3), 30 (T4), 60 (T5) and 90 days
(T6) post anti-VEGF treatment and subsequently analyzed.
Comparisons were made between pre-treatment and post-treatment
measurements for BCVA, MNV vascular area (MNV-VA), MNV vascular
density (MNV-VD) ratio, and CMT.
Morphological patterns of the MNV complex on OCTA
were systematically examined and categorized into four groups: i)
The ‘Medusa’ pattern, characterized by branching vessels radiating
in all directions from the main vessel trunk at the center; ii) the
‘seafan’ pattern, defined as a lesion with branching vessels
radiating from one side of the main vessel trunk; iii) the
‘tangled’ pattern, described as a lesion with globular structures
of entwined vessels without a discernible main vessel trunk
(16); and iv) the ‘other’
pattern, encompassing lesions with irregular vessels that cannot be
attributed to the aforementioned three forms but remain
measurable.
Statistical analysis
All statistical analyses were performed using SPSS
26.0 (IBM Corp.). Non-parametric statistical methods were employed,
including the Wilcoxon signed-rank test for comparing within-group
differences in different morphology groups before and after
treatment, Fisher's exact test for categorical variables, and
Friedman's test for continuous variables.
To evaluate differences among the four OCTA pattern
groups after baseline correction, the present study employed
backward elimination of generalized estimating equation (GEE)
modeling. Confidence intervals (CIs) were computed using GEE
modeling, incorporating the elapsed time since enrollment,
treatment assignment and the interaction between time and treatment
in the model. In all models, the variable of disease severity was
introduced into the constructed GEE model and, after model
evaluation, this non-significant contributing factor (impact) was
removed by gradually eliminating it. Meanwhile, the present study
adjusted for age, sex, BMI, hypertension, diabetes, coronary heart
disease and smoking exposure. Potential confounders were selected a
priori. Models were fully adjusted for all covariates
simultaneously. P<0.05 was considered to indicate a
statistically significant difference.
Results
The baseline characteristics of the study
participants are summarized in Table
I. No significant differences in age or sex were observed
between the IVC treatment group and the IVR treatment group. The
analysis included 39 nAMD patients, comprising 17 men and 22 women,
with a total of 44 eyes of interest exhibiting MNV. Stratification
revealed 26 eyes from 23 patients in the IVC group and 18 eyes from
16 patients in the IVR group.
 | Table IBaseline characteristics of
neovascular age-related macular degeneration patients receiving
intravitreal conbercept or ranibizumab. |
Table I
Baseline characteristics of
neovascular age-related macular degeneration patients receiving
intravitreal conbercept or ranibizumab.
| Characteristic | Intravitreal
conbercept | Intravitreal
ranibizumab | P-value |
|---|
| No. of eyes
(patients) | 26(23) | 18(16) | - |
| Age, years | 71.15±10.04 | 71.61±11.05 | 0.895 |
| Sex
(male:female) | 13:10 | 4:12 | 0.099 |
| BMI,
kg/m2 | 23.62±3.23 | 23.87±3.60 | 0.784 |
| HBP | 13 (50%) | 11 (61.1%) | 0.547 |
| DM | 7 (26.9%) | 2 (11.1.%) | 0.270 |
| IRF | 9 (34.6%) | 9 (50%) | 0.361 |
| SRF | 11 (42.3%) | 8 (44.4%) | 1.000 |
| Mean BCVA
(LogMA) | 0.97±0.50 | 0.94±0.54 | 0.831 |
| Mean CMT, µm | 293.71±145.60 | 328.72±144.80 | 0.527 |
| Mean MNV-VA,
mm2 | 1.34±1.14 | 0.87±0.71 | 0.166 |
| Mean MNV-VD
ratio | 0.40±0.10 | 0.39±0.06 | 0.596 |
In the IVC group, the median age of patients was 61
years (range, 50-83), with 13 males and 10 females. The mean BCVA,
CMT, MNV-VA, and MNV-VD ratio values were 0.97±0.50 logMAR,
293.71±145.60 µm, 1.34±1.14 mm² and 0.40±0.10, respectively. Among
the 26 eyes displaying a distinct MNV complex on OCTA, the Medusa,
seafan, tangled, and other patterns were identified in nine eyes
(34.6%), nine eyes (34.6%), five eyes (19.2%) and three eyes
(11.5%), respectively.
The IVR group consisted of four men and 12 women,
with a mean age of 71.61±11.05 years (range 51-91). Baseline BCVA,
CMT, MNV-VA, and MNV-VD ratio values in this group were 0.94±0.54
logMAR, 328.72±144.80 µm, 0.87±0.71 mm², and 0.39±0.06,
respectively. Among the 18 eyes with MNV in this group, the Medusa,
seafan, tangled, and other patterns were observed in three eyes
(16.7%), seven eyes (38.9%), five eyes (27.8%) and three eyes
(16.7%), respectively. All enrolled patients were monitored for 3
months, and no ocular or systemic adverse events were recorded.
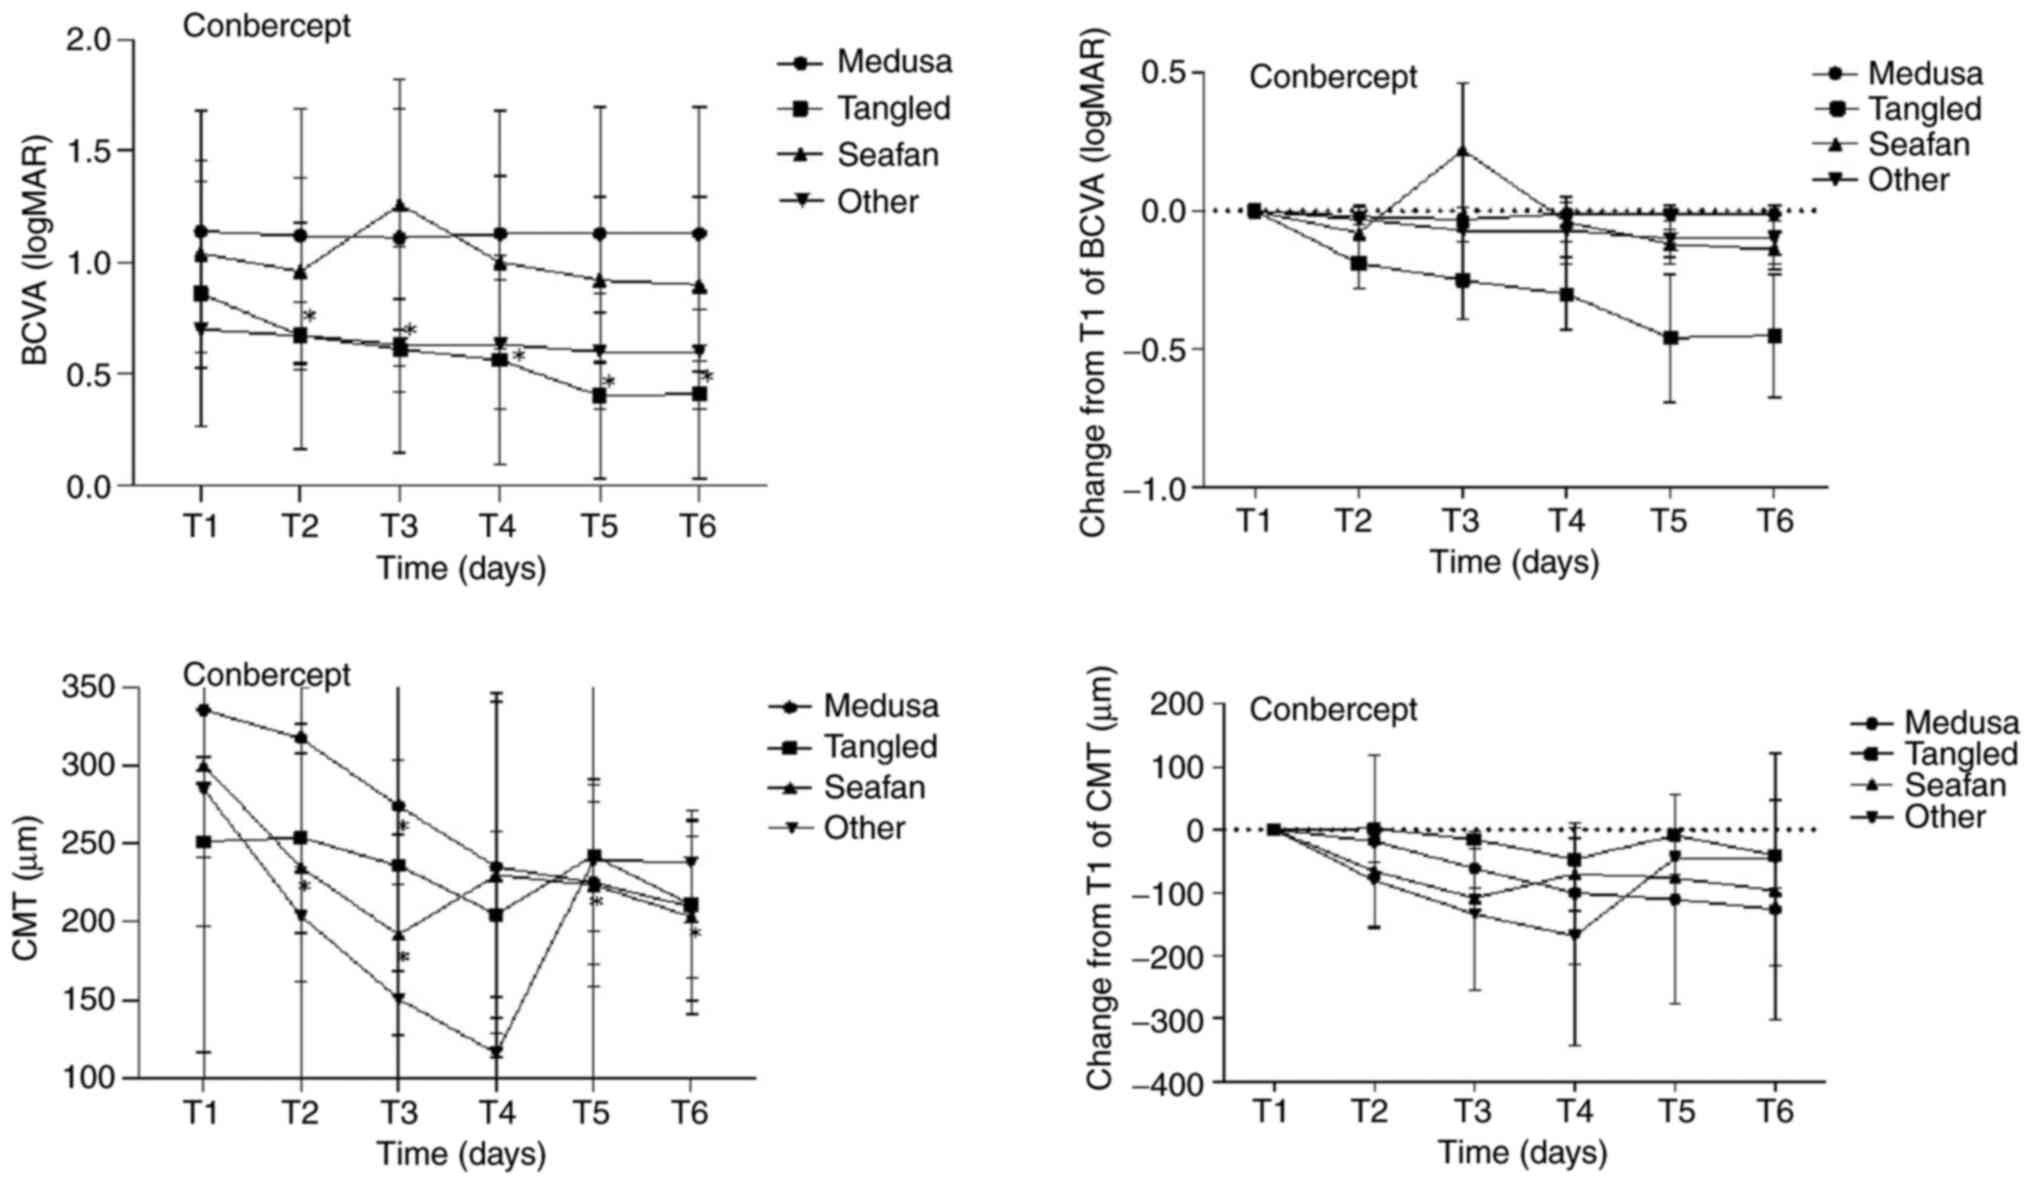
Comparisons of outcomes in the IVC
treatment group
A total of 26 eyes of 23 patients underwent primary
IVC treatment. At the 90-day follow-up, the mean BCVA in the
overall cohort improved from 0.97±0.50 logMAR at baseline to
0.78±0.53 logMAR at the last visit (P=0.004). Significant
reductions were observed in the mean CMT (from 293.71±145.60 µm to
211.94±51.11 µm; P=0.007), the mean MNV-VA (from 1.34±1.14 mm² to
0.79±0.59 mm²; P=0.001), and the mean MNV-VD ratio (from 0.40±0.10
to 0.34±0.12; P=0.037) post-treatment compared with baseline.
Specifically, the mean BCVA of eyes with the tangled
pattern improved from 0.86±0.60 logMAR at baseline to 0.41±0.38
logMAR at the last visit (P=0.002). Notably, the improvement in
BCVA was significantly higher in patients with the tangled pattern
compared with the other three patterns. The change associated with
the tangled pattern was -0.43±0.13 (95% CI, -0.7 to -0.17; P=0.001)
compared with the Medusa pattern group, -0.30±0.13 (95% CI, -0.57
to -0.04; P=0.023) compared with the seafan pattern group, and
-0.34±0.13 (95% CI, -0.61 to -0.08; P=0.01) compared with the other
pattern group.
While the mean CMTs of the four MNV patterns
decreased following treatment, there was no significant difference
in the total change of CMT between the different pattern groups
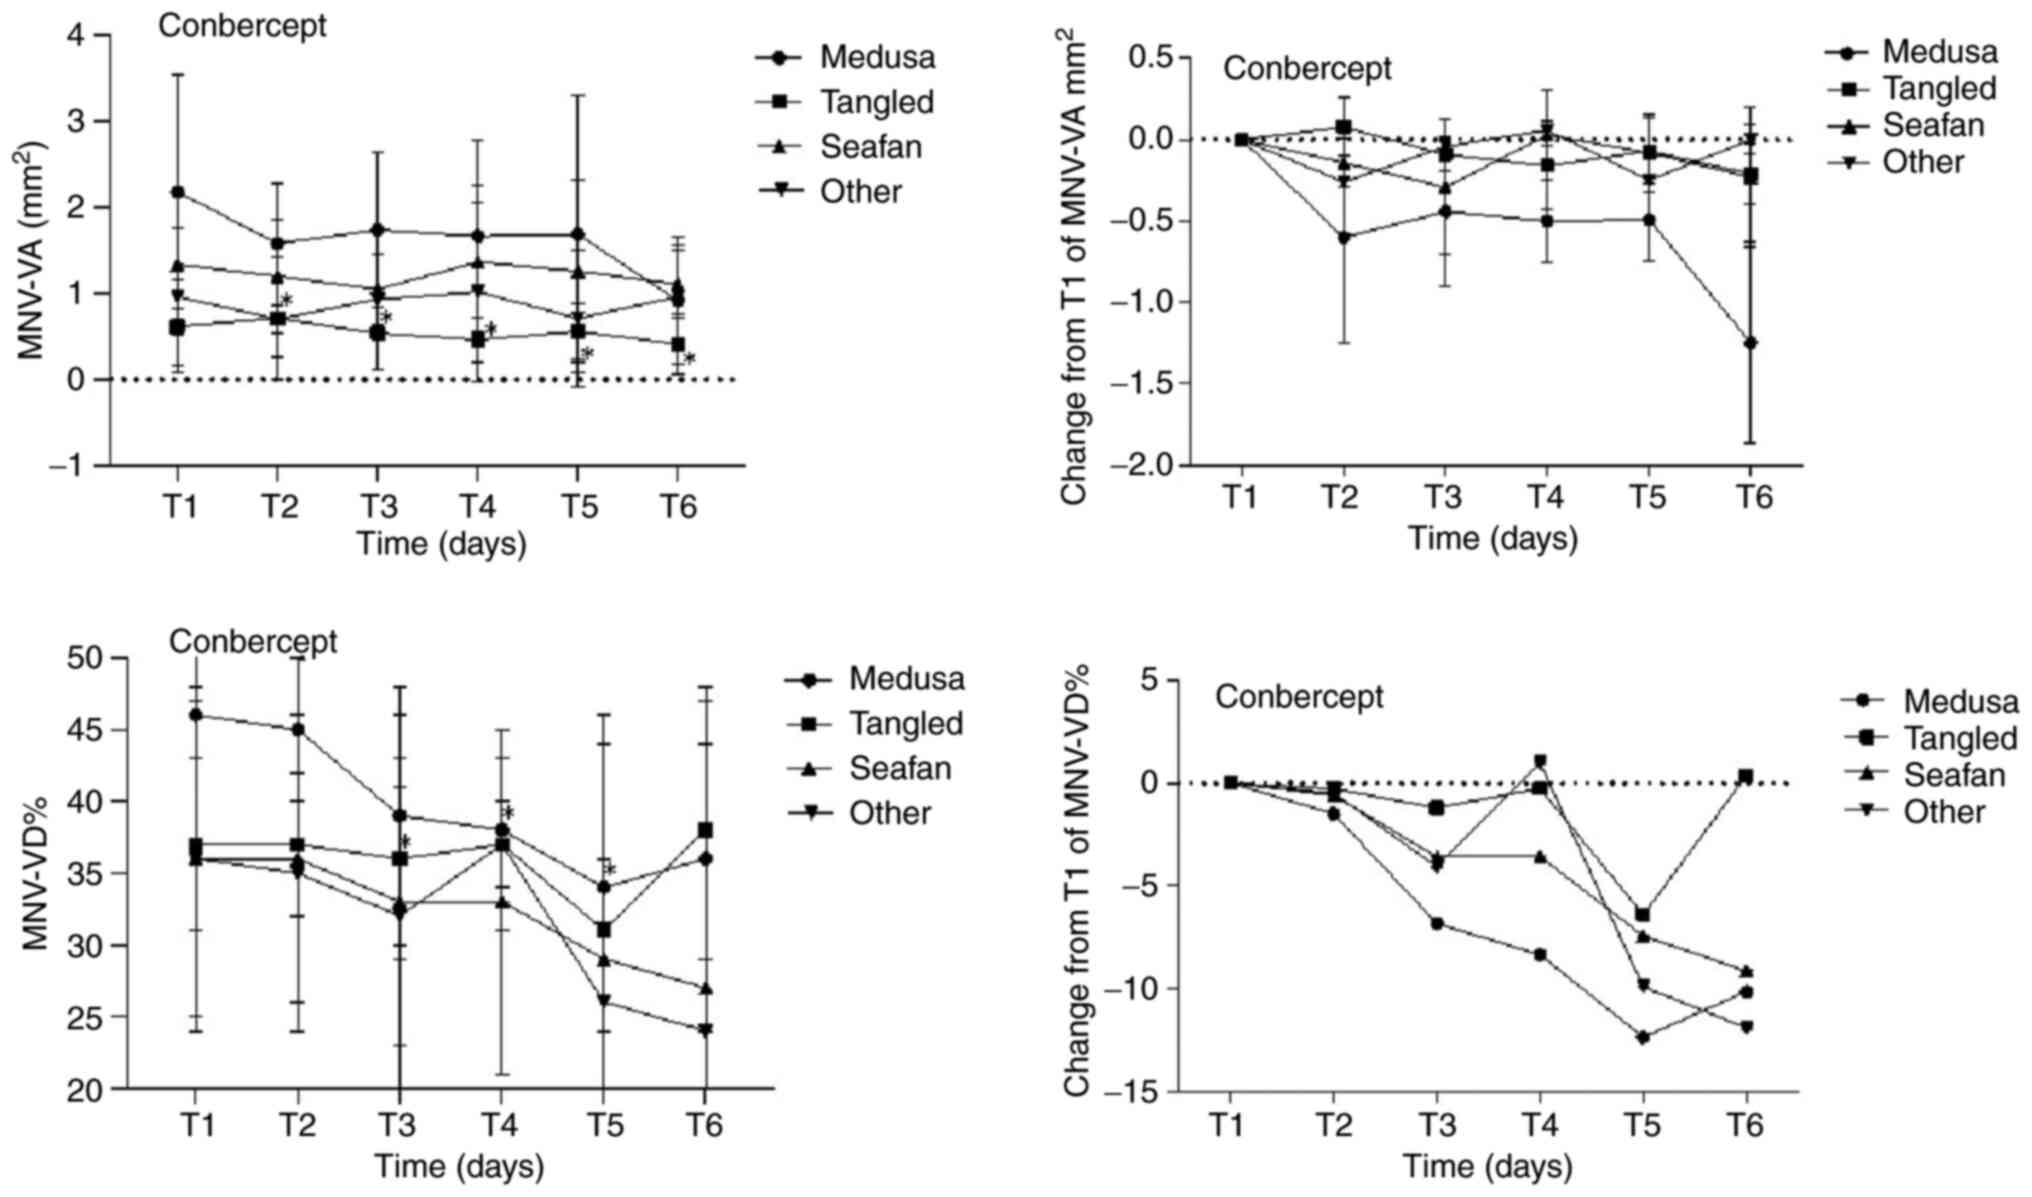
(P=0.052). Regarding MNV parameters, eyes with the Medusa pattern
showed a significant reduction in mean MNV-VA at the last visit
(from 2.18±1.36 mm² to 0.92±0.74 mm²; P=0.008). The change degree
analysis indicated that the reduction in the Medusa pattern group
was -1.04±0.40 mm² (95% CI, -1.82 to -0.27; P=0.008) compared with
the tangled pattern group, -1.03±0.50 mm² (95% CI, -2 to -0.05;
P=0.038) compared with the seafan pattern group, and -1.25±0.41 mm²
(95% CI, -2.05 to -0.45; P=0.002) compared with the other pattern
group. Consequently, patients with the Medusa pattern in the IVC
group experienced the most substantial reduction in mean
MNV-VA.
The mean MNV-VD ratios for all four MNV patterns
showed a decrease at the last visit after treatment compared with
baseline, with the most notable reduction observed in the Medusa
pattern group. However, these changes in all MNV patterns did not
reach statistical significance (P=0.107). Figs. 1 and 2, and Table
II, Table III, Table IV and Table V illustrate the comparisons of
BCVA, CMT, and MNV parameters between pre- and post-IVC treatment
at various time points in the four MNV pattern groups on OCTA.
Tables II and IV describe the mean, while Tables III and V reflect the difference in change
compared with baseline. Additionally, Fig. 3 presents an illustrative case of a
patient with a tangled pattern MNV.
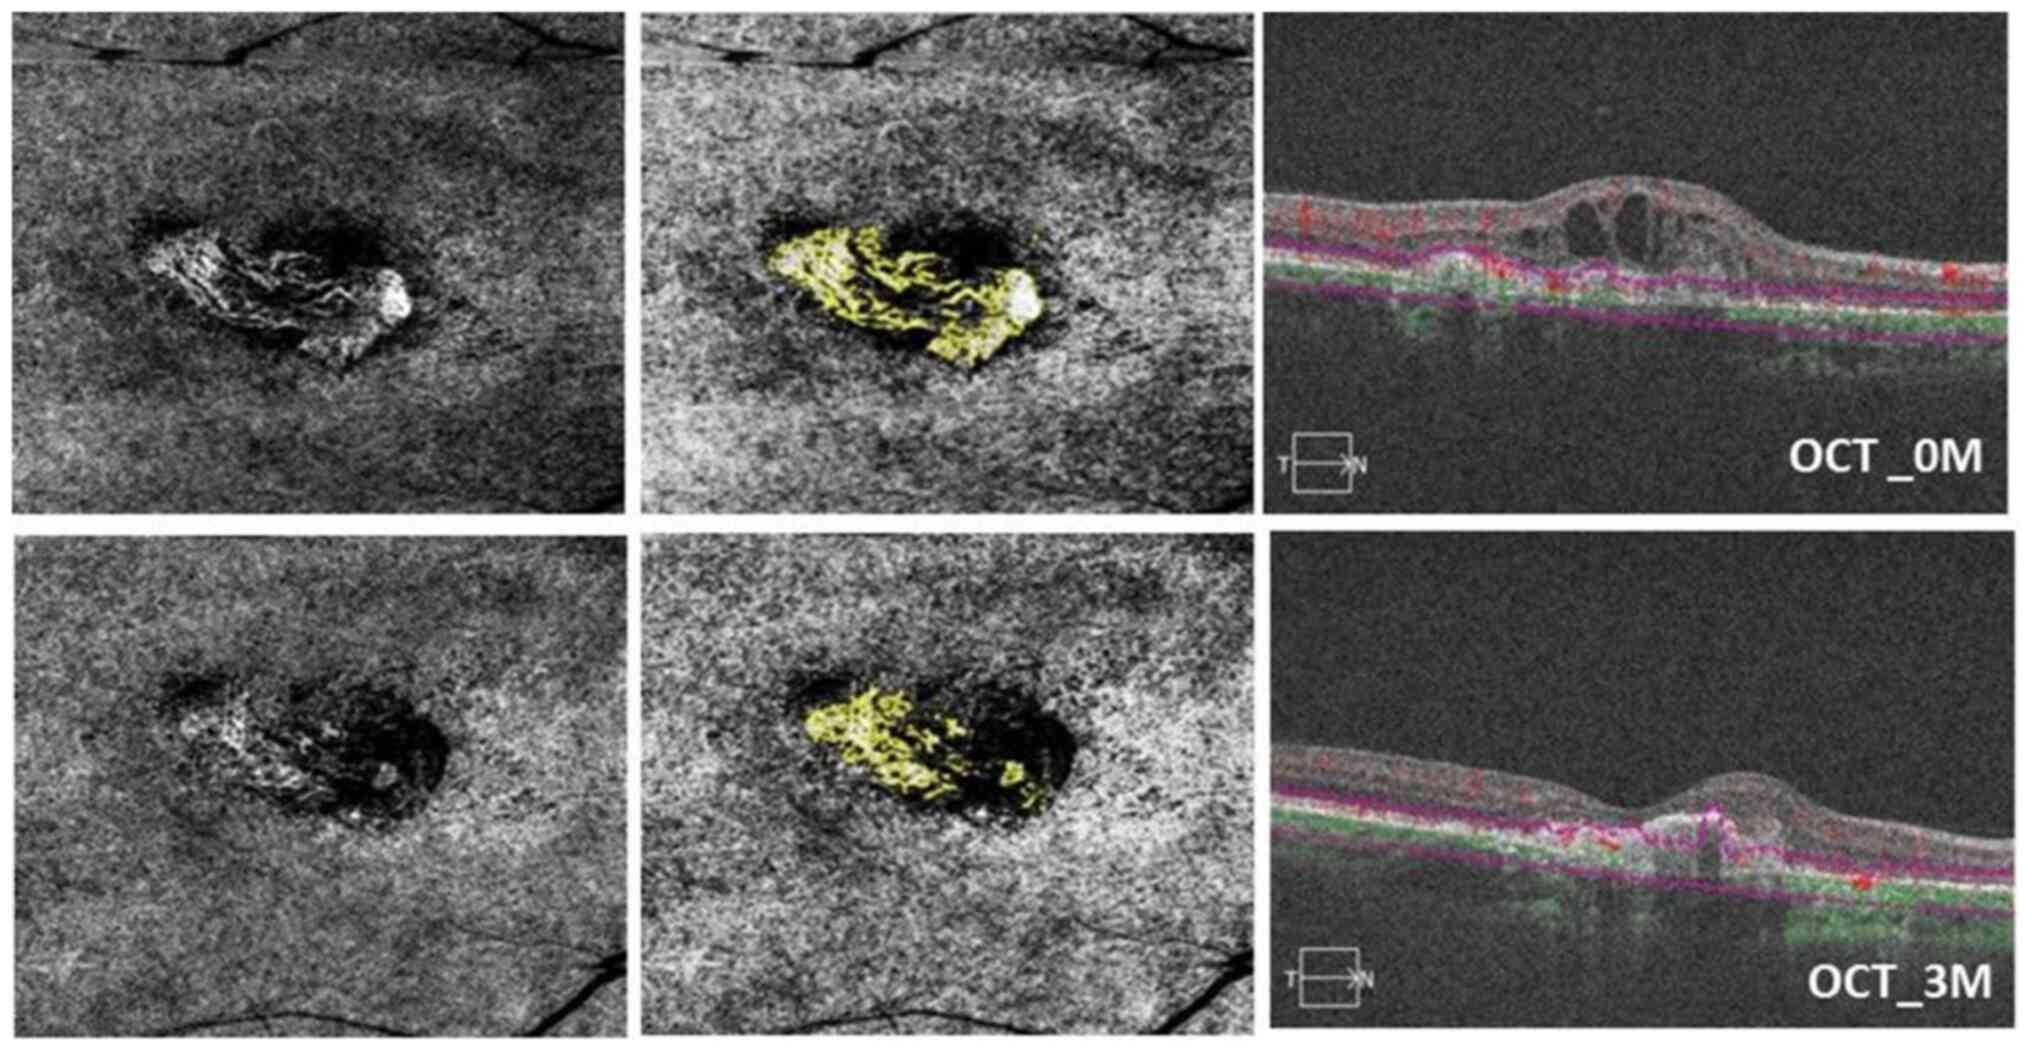 | Figure 3OCTA images of a 52-year-old female
patient with a tangled pattern of MNV who underwent IVC therapy in
the right eye. Baseline visual acuity was 1.2 logMAR; status, after
three conbercept injections in 90 days. In the top left, a 6x6
spectral-domain OCTA image displays the neovascular complex with
tangled lesions, showing no main vascular entanglement compared
with an OCTA en face projection image taken after conbercept
injection (bottom left). In the top center, the analysis results of
ImageJ software correspond to post-treatment (bottom center). The
top right OCT image shows the presence of subretinal fluid. In the
bottom right, subretinal fluid was reduced, and BCVA improved to
0.8 logMAR after conbercept injection at 3 months (90 days). The
MNV-VA decreased from 1.467 mm² (baseline) to 0.315 mm² (90 days).
OCTA, optical coherence tomography angiography; MNV, macular
neovascularization; IVC, intravitreal conbercept; MAR, minimum
resolution angle; MNV-VA, MNV vascular area. |
| Table IIMean BCVA and CMT of four MNV
morphologies at different times after intravitreal conbercept
treatment. |
Table II
Mean BCVA and CMT of four MNV
morphologies at different times after intravitreal conbercept
treatment.
| | Medusa (n=9) | Tangled (n=9) | Seafan (n=5) | Other (n=3) |
|---|
| Time
(post-injection) | BCVA (logMAR) | P-value | CMT (µm) | P-value | BCVA (logMAR) | P-value | CMT (µm) | P-value | BCVA (logMAR) | P-value | CMT (µm) | P-value | BCVA (logMAR) | P-value | CMT (µm) | P-value |
|---|
| T1 (0 day) | 1.14±0.54 | | 335.56±219.14 | | 0.86±0.60 | | 251.28±54.19 | | 1.04±0.32 | | 300.20±58.66 | | 0.70±0.17 | | 284.67±195.09 | |
| T2 (1 day) | 1.12±0.57 | 0.157 | 317.11±182.09 | 0.499 | 0.67±0.51 | 0.026 | 253.78±61.48 | 0.859 | 0.96±0.42 | 0.18 | 234.63±72.90 | 0.043 | 0.67±0.15 | 0.317 | 203.67±123.09 | 0.109 |
| T3 (7 days) | 1.11±0.58 | 0.083 | 274.11±186.71 | 0.012 | 0.61±0.46 | 0.018 | 235.67±67.55 | 0.214 | 1.26±0.56 | 0.102 | 191.58±63.92 | 0.043 | 0.63±0.21 | 0.157 | 150.67±73.19 | 0.18 |
| T4 (30 days) | 1.13±0.55 | 0.317 | 235.00±106.13 | 0.11 | 0.56±0.47 | 0.024 | 204.67±53.12 | 0.086 | 1.00±0.39 | 0.317 | 229.72±116.20 | 0.225 | 0.63±0.29 | 0.317 | 115.67±22.50 | 0.18 |
| T5 (60 days) | 1.13±0.57 | 0.655 | 224.85±52.20 | 0.214 | 0.40±0.37 | 0.012 | 242.44±48.80 | 0.374 | 0.92±0.37 | 0.063 | 223.40±64.62 | 0.043 | 0.60±0.26 | 0.18 | 239.53±155.73 | 0.285 |
| T6 (90 days) | 1.13±0.57 | 0.786 | 209.42±44.89 | 0.173 | 0.41±0.38 | 0.007 | 210.72±60.72 | 0.051 | 0.90±0.39 | 0.066 | 203.20±62.85 | 0.043 | 0.60±0.26 | 0.18 | 237.77±26.79 | 0.593 |
| Table IIIChanges from baseline in mean BCVA
and CMT of four MNV morphologies at different times after
intravitreal conbercept treatment. |
Table III
Changes from baseline in mean BCVA
and CMT of four MNV morphologies at different times after
intravitreal conbercept treatment.
| |
Change from
baseline |
|---|
| | Medusa (n=9) | Tangled (n=9) | Seafan (n=5) | Other (n=3) |
|---|
| Time
(post-injection) | BCVA (logMAR) | P-value | CMT (µm) | P-value | BCVA (logMAR) | P-value | CMT (µm) | P-value | BCVA (logMAR) | P-value | CMT (µm) | P-value | BCVA (logMAR) | P-value | CMT (µm) | P-value |
|---|
| T2 (1 day) | -0.02±0.01 | 0.157 | -18.44±16.88 | 0.499 | -0.19±0.07 | 0.026 | 2.49±9.76 | 0.859 | -0.08±0.05 | 0.18 | -65.57±9.67 | 0.043 | -0.03±0.03 | 0.317 | -81.00±34.29 | 0.109 |
| T3 (7 days) | -0.03±0.02 | 0.083 | -61.44±17.66 | 0.012 | -0.24±0.08 | 0.018 | -15.62±10.83 | 0.214 | 0.22±0.12 | 0.102 | -108.62±16.41 | 0.043 | -0.07±0.03 | 0.157 | -134.00±59.38 | 0.180 |
| T4 (30 days) | -0.01±0.01 | 0.317 | -100.56±52.49 | 0.11 | -0.30±0.09 | 0.024 | -46.62±27.29 | 0.086 | -0.04±0.04 | 0.317 | -70.48±45.88 | 0.225 | -0.07±0.05 | 0.317 | -169.00±81.37 | 0.180 |
| T5 (60 days) | -0.01±0.02 | 0.655 | -110.71±73.17 | 0.214 | -0.46±0.13 | 0.012 | -8.84±11.37 | 0.374 | -0.12±0.03 | 0.063 | -76.8±19.11 | 0.043 | -0.10±0.05 | 0.180 | -45.14±27.61 | 0.285 |
| T6 (90 days) | -0.01±0.05 | 0.786 | -126.14±72.97 | 0.173 | -0.44±0.13 | 0.007 | -40.56±16.16 | 0.051 | -0.14±0.05 | 0.066 | -97.00±13.60 | 0.043 | -0.10±0.05 | 0.180 | -46.90±87.75 | 0.593 |
| Table IVMean MNV-VA and MNV-VD of four MNV
morphologies at different times after intravitreal conbercept
treatment. |
Table IV
Mean MNV-VA and MNV-VD of four MNV
morphologies at different times after intravitreal conbercept
treatment.
| | Medusa (n=9) | Tangled (n=9) | Seafan (n=5) | Other (n=3) |
|---|
| Time
(post-injection) | MNV-VA
(mm2) | P-value | MNV-VD ratio | P-value | MNV-VA
(mm2) | P-value | MNV-VD ratio | P-value | MNV-VA
(mm2) | P-value | MNV-VD ratio | P-value | MNV-VA
(mm2) | P-value | MNV-VD ratio | P-value |
|---|
| T1 (0 day) | 2.18±1.36 | | 0.46±0.09 | | 0.62±0.53 | | 0.37±0.06 | | 1.34±0.82 | | 0.36±0.11 | | 0.36±0.12 | 0.109 | -81.00±34.29 | 0.109 |
| T2 (1 day) | 1.58±0.71 | 0.066 | 0.45±0.05 | 0.678 | 0.71±0.71 | 0.953 | 0.37±0.05 | 0.499 | 1.20±0.67 | 0.5 | 0.36±0.10 | 0.5 | 0.35±0.11 | 0.109 | -81.00±34.29 | 0.109 |
| T3 (7 days) | 1.74±0.90 | 0.441 | 0.39±0.09 | 0.139 | 0.54±0.43 | 0.161 | 0.36±0.07 | 0.008 | 1.05±0.41 | 0.5 | 0.33±0.13 | 0.043 | 0.32±0.09 | 0.1 | -134.00±59.38 | 0.18 |
| T4 (30 days) | 1.67±1.11 | 0.26 | 0.38±0.05 | 0.021 | 0.46±0.26 | 0.314 | 0.37±0.06 | 0.327 | 1.37±0.88 | 0.893 | 0.33±0.12 | 0.043 | 0.37±0.03 | 0.593 | -169.00±81.37 | 0.18 |
| T5 (60 days) | 1.69±1.61 | 0.26 | 0.34±0.10 | 0.038 | 0.56±0.33 | 0.859 | 0.31±0.13 | 0.173 | 1.26±1.06 | 0.5 | 0.29±0.17 | 0.5 | 0.26±0.10 | 0.109 | -45.14±27.61 | 0.285 |
| T6 (90 days) | 0.92±0.74 | 0.008 | 0.36±0.12 | 0.139 | 0.41±0.34 | 0.066 | 0.38±0.09 | 0.859 | 1.11±0.39 | 0.5 | 0.27±0.17 | 0.465 | 0.24±0.05 | 1 | -46.90±87.75 | 0.593 |
| Table VChanges from baseline in mean MNV-VA
and MNV-VD of four MNV morphologies at different times after
intravitreal conbercept treatment. |
Table V
Changes from baseline in mean MNV-VA
and MNV-VD of four MNV morphologies at different times after
intravitreal conbercept treatment.
| |
Change from
baseline |
|---|
| | Medusa (n=9) | Tangled (n=9) | Seafan (n=5) | Other (n=3) |
|---|
| Time
(post-injection) | MNV-VA
(mm2) | P-value | MNV-VD ratio | P-value | MNV-VA
(mm2) | P-value | MNV-VD ratio | P-value | MNV-VA
(mm2) | P-value | MNV-VD ratio | P-value | MNV-VA
(mm2) | P-value | MNV-VD ratio | P-value |
|---|
| T2 (1 day) | -0.60±0.25 | 0.066 | -1.49±2.10 | 0.678 | 0.08±0.11 | 0.953 | -0.28±1.23 | 0.499 | -0.14±0.22 | 0.5 | -0.60±1.08 | 0.5 | -0.03±0.03 | 0.109 | -81.00±34.29 | 0.109 |
| T3 (7 days) | -0.44±0.37 | 0.441 | -6.81±4.39 | 0.139 | -0.09±0.09 | 0.161 | -1.20±0.37 | 0.008 | -0.29±0.29 | 0.5 | -3.57±1.17 | 0.043 | -0.07±0.03 | 0.100 | -134.00±59.38 | 0.180 |
| T4 (30 days) | -0.50±0.47 | 0.26 | -8.35±3.68 | 0.021 | -0.16±0.13 | 0.314 | -0.26±0.21 | 0.327 | 0.03±0.50 | 0.893 | -3.56±1.22 | 0.043 | -0.07±0.05 | 0.593 | -169.00±81.37 | 0.180 |
| T5 (60 days) | -0.49±0.53 | 0.26 | -12.35±4.75 | 0.038 | -0.07±0.12 | 0.859 | -6.39±3.33 | 0.173 | -0.08±0.64 | 0.5 | -7.43±8.18 | 0.5 | -0.10±0.05 | 0.109 | -45.14±27.61 | 0.285 |
| T6 (90 days) | -1.25±0.38 | 0.008 | -10.13±5.88 | 0.139 | -0.21±0.10 | 0.066 | 0.37±2.17 | 0.859 | -0.23±0.31 | 0.5 | -9.12±7.55 | 0.465 | -0.10±0.05 | 1.000 | -46.90±87.75 | 0.593 |
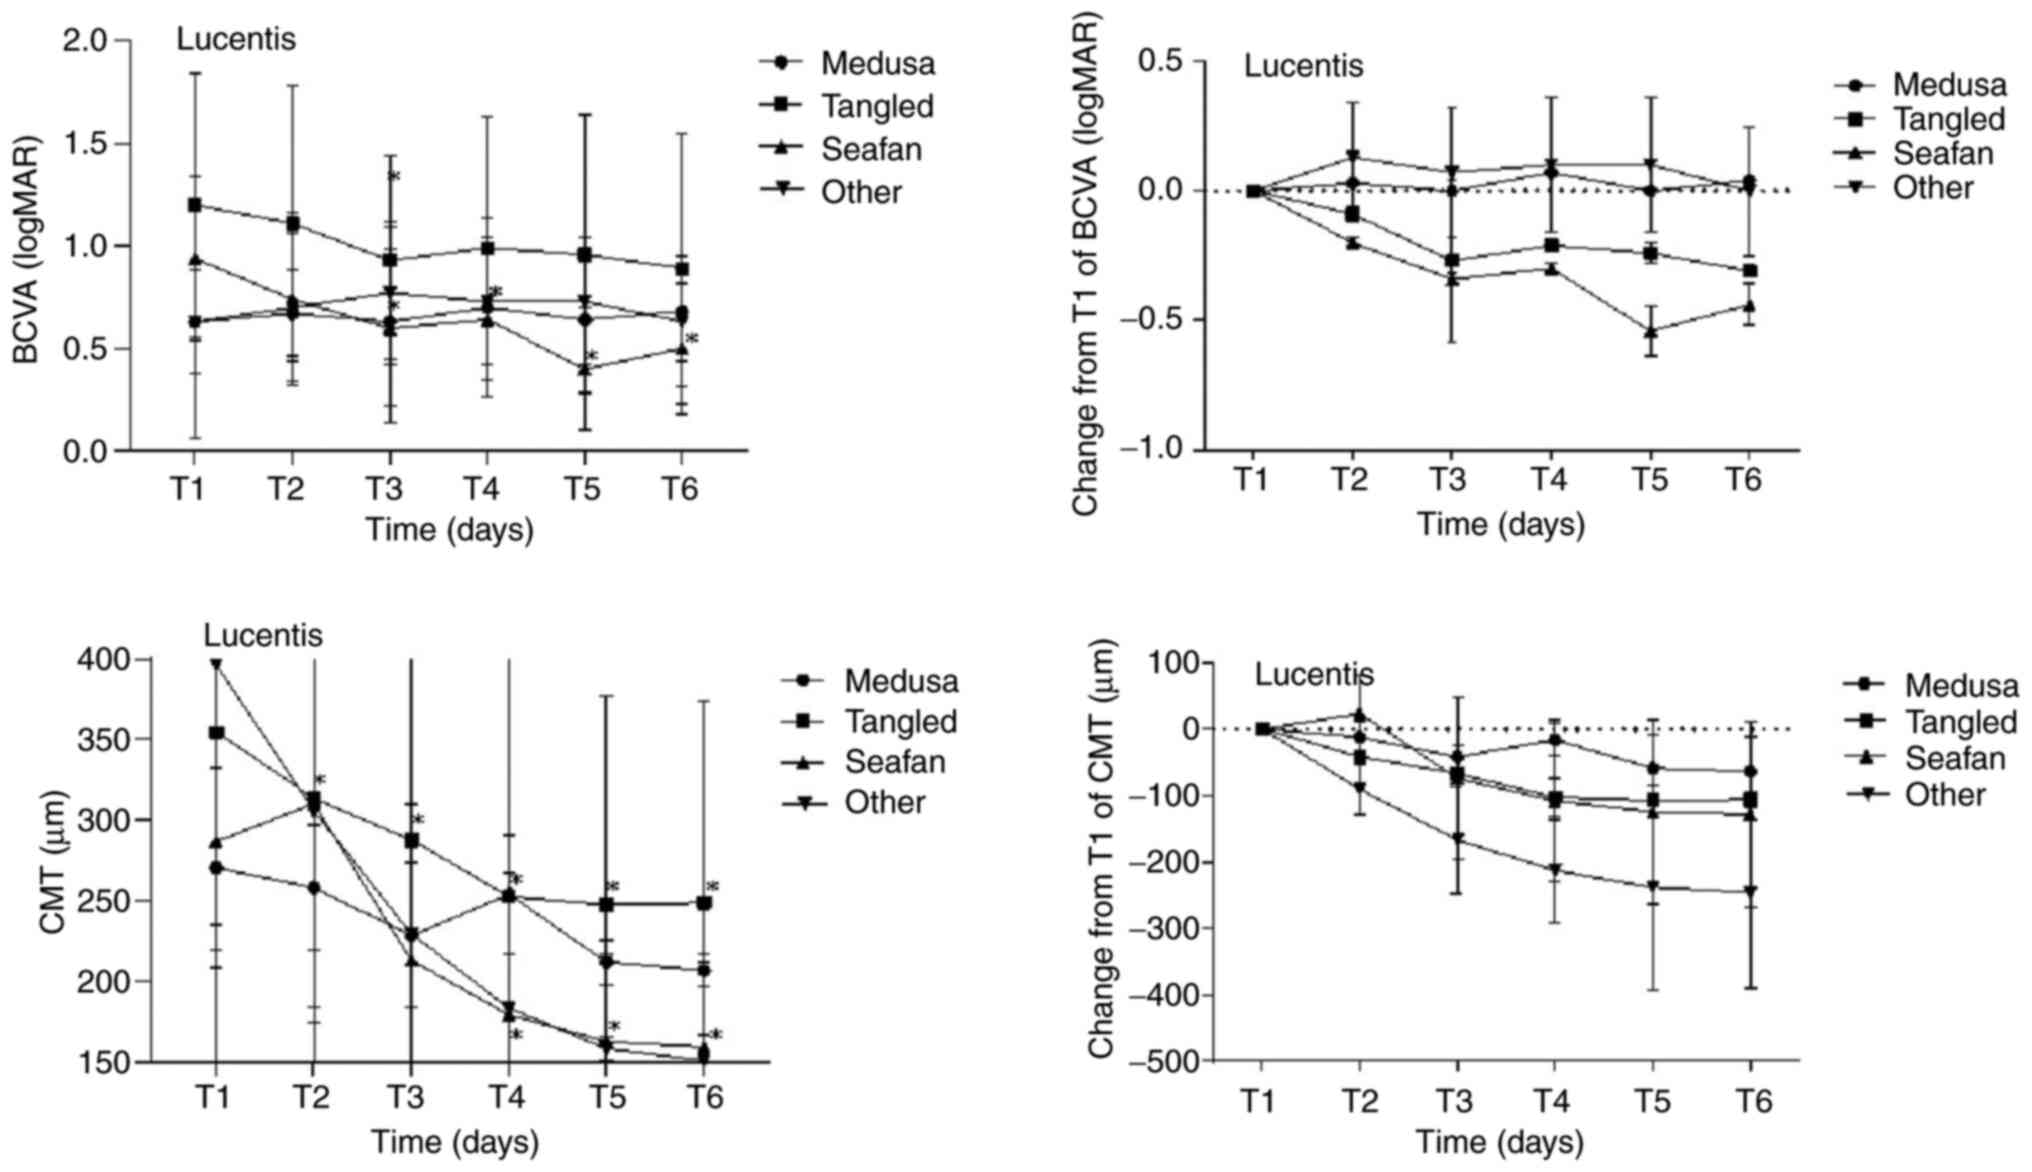
Comparisons of outcomes in the IVR
treatment group
A total of 18 eyes of 16 patients underwent primary
IVR treatment. At the 90-day follow-up, the mean BCVA in the
overall cohort improved from 0.94±0.54 logMAR at baseline to
0.70±0.47 logMAR at the last visit (P=0.014). Notable reductions
were observed in the mean CMT (from 328.72±144.80 µm to
200.51±90.29 µm; P=0.001), the mean MNV-VA (from 0.87±0.71 mm² to
0.47±0.35 mm²; P=0.133), and the mean MNV-VD ratio (from 0.39±0.06
to 0.31±0.11; P=0.05).
The improvements in mean BCVA and CMT between pre-
and post-treatment were statistically significant in the overall
cohort, whereas changes in mean MNV-VA and MNV-VD ratio were not.
The mean BCVA of eyes with the seafan pattern improved from
0.94±0.40 logMAR at baseline to 0.50±0.32 logMAR at the last visit
(P=0.042). The improvement in BCVA was significantly greater for
the seafan pattern compared with the other three patterns.
Specifically, the change in the seafan pattern group was -0.48±0.10
(95% CI, -0.69 to -0.28; P=0.00) compared with the Medusa pattern
group, -0.13±0.18 (95% CI, -0.48 to 0.22; P=0.469) compared with
the tangled pattern group, and -0.44±0.20 (95% CI, -0.61 to -0.08;
P=0.01) compared with the other pattern group.
The mean CMT in all four MNV pattern groups
exhibited a decrease post-treatment, with the most prominent
reduction observed in the other pattern group. However, there was
no statistically significant difference in the total change in CMT
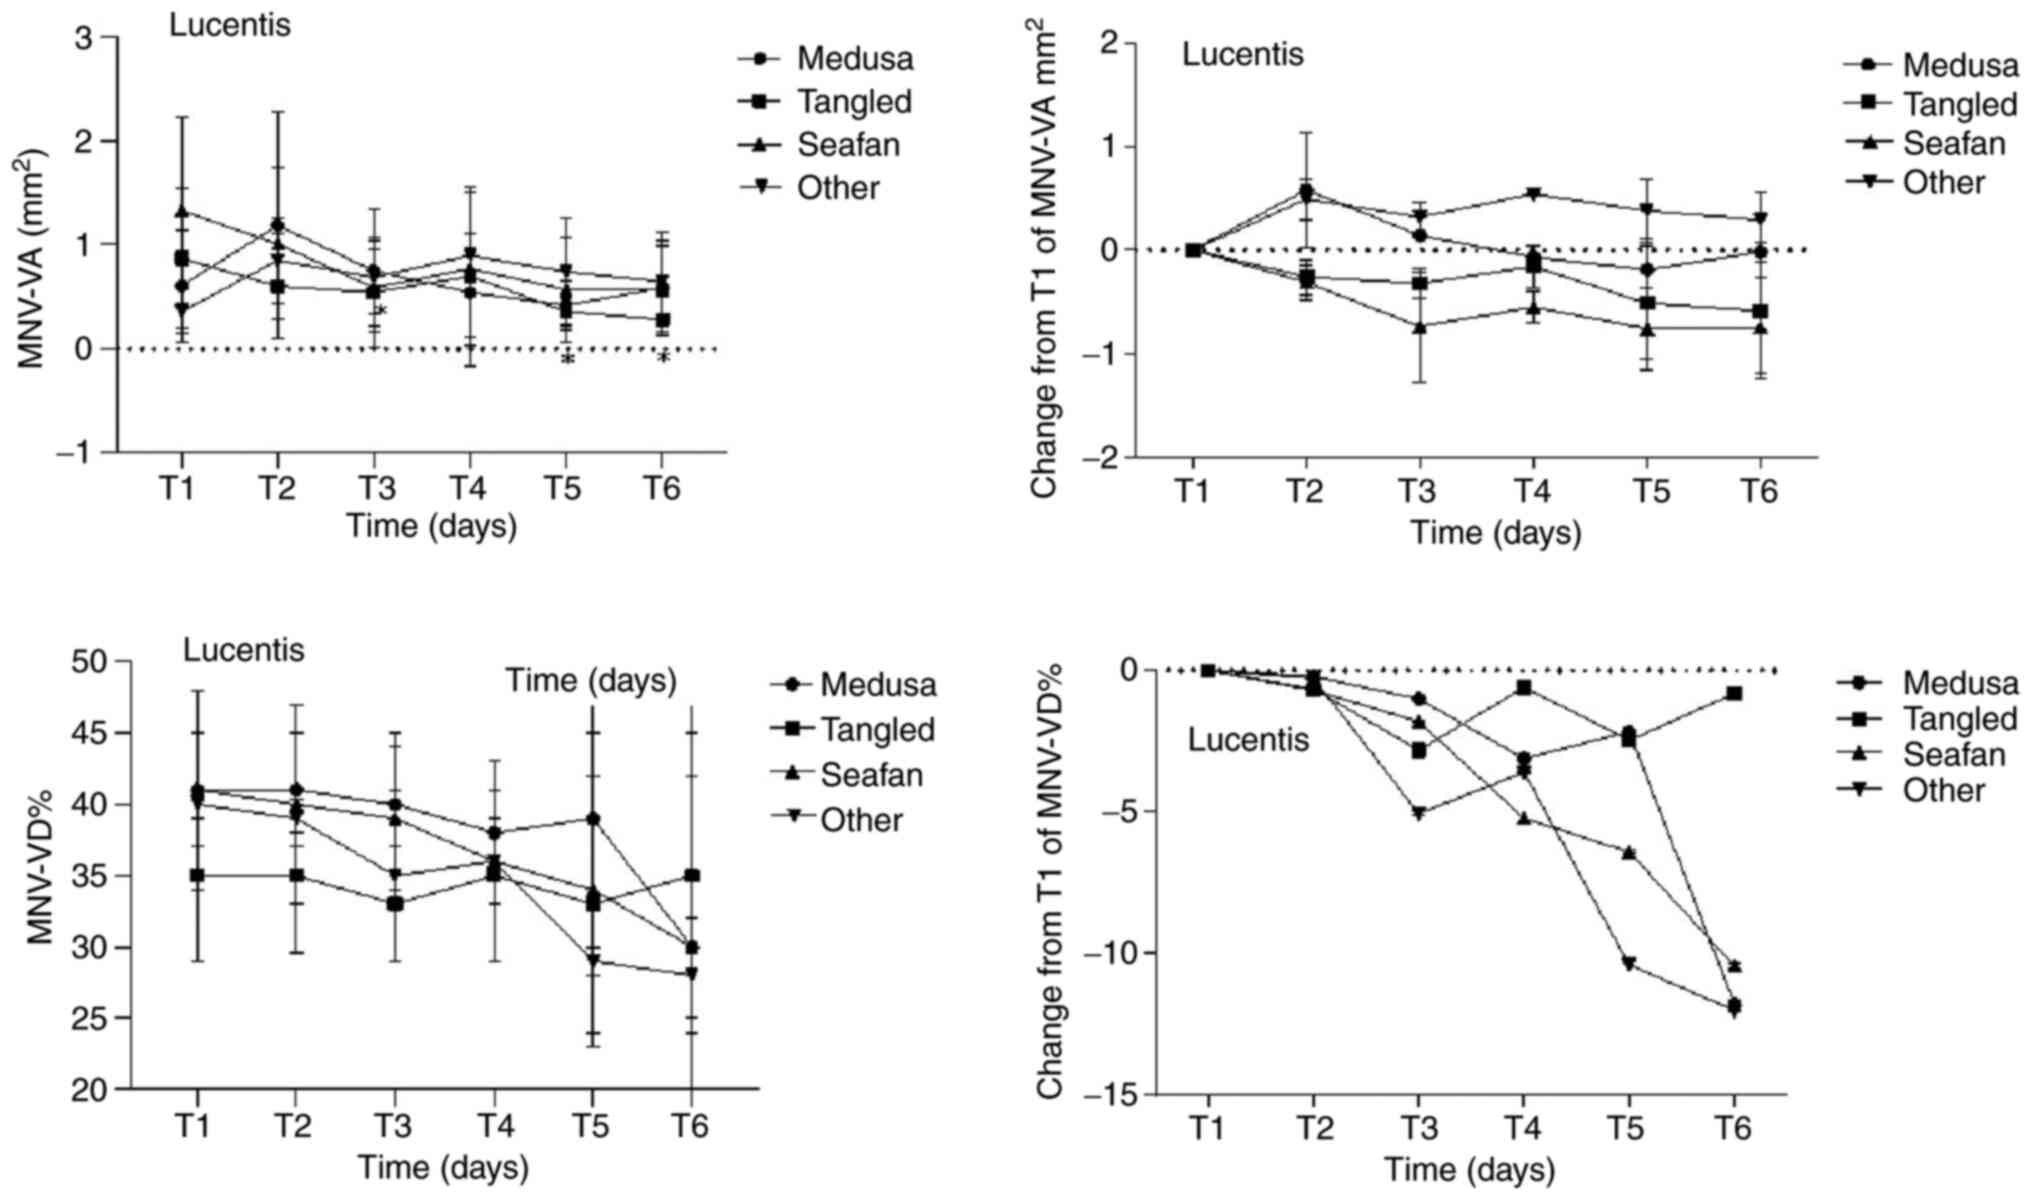
among the various pattern groups (P=0.114). Regarding MNV
parameters, the mean MNV-VA for all four pattern groups decreased
after treatment, with the most substantial reduction observed in
the seafan pattern group (from 1.33±0.90 mm² to 0.57±0.41 mm²;
P=0.225). The degree of reduction in the seafan pattern group was
-0.73±0.44 mm² (95% CI, -1.6 to 0.13; P=0.095) compared with the
Medusa pattern group, -0.16±0.45 mm² (95% CI, -1.05 to 0.73;
P=0.722) compared with the tangled pattern group, and -1.04±0.41
mm² (95% CI, -1.85 to -0.23; P=0.012) compared with the other
pattern group.
The mean MNV-VD ratios for all four pattern groups
exhibited a decrease at the last visit after treatment, with the
most significant reduction observed in the other pattern group
(from 0.40±0.01 to 0.28±0.04; P=0.109). However, there was no
statistically significant difference in the total change in the
MNV-VD ratio among the different pattern groups. Figs. 4 and 5, and Table
VI, Table VII, Table VIII and Table IX depict the comparisons of BCVA,
CMT, and MNV parameters between pre- and post-treatment at various
time points in the four MNV pattern groups on OCTA. Additionally,
Fig. 6 illustrates a
representative case of a patient with a seafan pattern MNV.
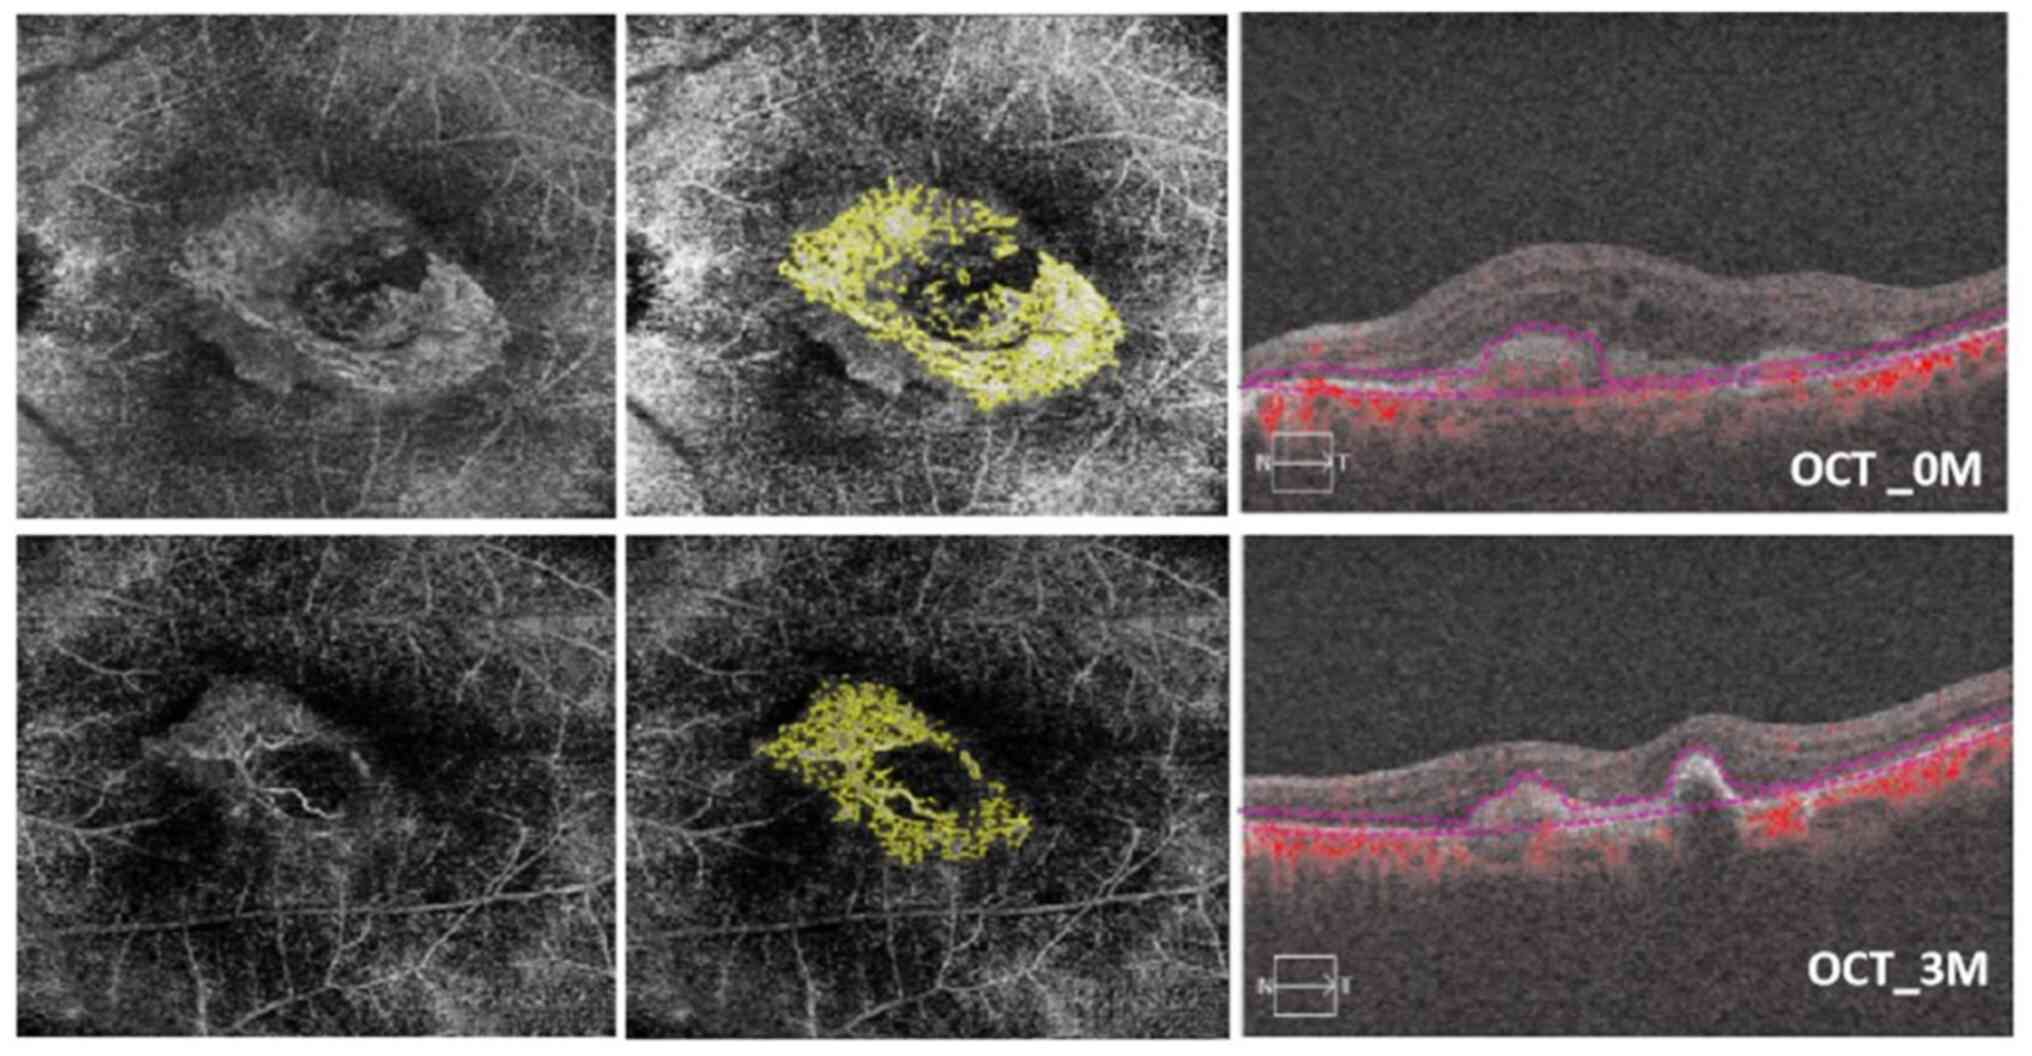 | Figure 6OCTA images of an 83-year-old male
patient with seafan pattern MNV who underwent IVR therapy in the
right eye. Baseline visual acuity was 1.3 logMAR after three
ranibizumab injections in 90 days. In the top left, a 6x6
spectral-domain OCTA image displays the neovascular complex with
globular lesions, showing no main vascular entanglement compared
with an OCTA en face projection image after ranibizumab
injection (bottom left). In the top center, the analysis results of
ImageJ software correspond to post-treatment (bottom center). The
top right OCT image shows the presence of subretinal fluid. In the
bottom right, subretinal fluid and subretinal hyper-reflective
material were reduced; meanwhile, the BCVA improved to 0.9 logMAR
after ranibizumab injection at 3 months (90 days). The MNV-VA
decreased from 2.283 mm² (baseline) to 1.375 mm² (90 days) OCTA,
optical coherence tomography angiography; MNV, macular
neovascularization; IVR, intravitreal ranibizumab; MAR, minimum
resolution angle; MNV-VA, MNV vascular area; BCVA, best-corrected
visual acuity. |
| Table VIMean BCVA and CMT of four MNV
morphologies at different times after intravitreal ranibizumab
treatment. |
Table VI
Mean BCVA and CMT of four MNV
morphologies at different times after intravitreal ranibizumab
treatment.
| | Medusa (n=3) | Tangled (n=7) | Seafan (n=5) | Other (n=3) |
|---|
| Time
(post-injection) | BCVA (logMAR) | P-value | CMT (µm) | P-value | BCVA (logMAR) | P-value | CMT (µm) | P-value | BCVA (logMAR) | P-value | CMT (µm) | P-value | BCVA (logMAR) | P-value | CMT (µm) | P-value |
|---|
| T1 (0 day) | 0.63±0.25 | | 270.33±62.27 | | 1.20±0.64 | | 354.71±136.05 | | 0.94±0.40 | | 286.80±192.45 | | 0.63±0.57 | | 396.33±161.25 | |
| T2 (1 day) | 0.67±0.21 | 0.317 | 258.00±39.23 | 1 | 1.11±0.67 | 0.157 | 313.43±139.30 | 0.018 | 0.74±0.42 | 0.063 | 310.4±250.75 | 0.684 | 0.70±0.36 | 0.655 | 306.00±122.53 | 0.109 |
| T3 (7 days) | 0.63±0.49 | 1 | 228.40±44.83 | 0.109 | 0.93±0.51 | 0.026 | 287.71±138.56 | 0.018 | 0.60±0.38 | 0.041 | 212.8±70.26 | 0.138 | 0.77±0.32 | 0.414 | 229.33±81.05 | 0.109 |
| T4 (30 days) | 0.70±0.44 | 0.655 | 253.90±37.34 | 0.109 | 0.99±0.64 | 0.173 | 252.43±165.07 | 0.028 | 0.64±0.38 | 0.039 | 179.00±70.78 | 0.043 | 0.73±0.31 | 0.655 | 183.33±83.72 | 0.109 |
| T5 (60 days) | 0.64±0.35 | 0.785 | 211.77±14.07 | 0.109 | 0.96±0.68 | 0.147 | 247.43±129.26 | 0.018 | 0.40±0.30 | 0.043 | 162.52±54.81 | 0.043 | 0.73±0.31 | 0.655 | 158.33±7.57 | 0.109 |
| T6 (90 days) | 0.68±0.24 | 0.18 | 206.54±10.12 | 0.109 | 0.89±0.66 | 0.09 | 248.73±125.54 | 0.018 | 0.50±0.32 | 0.042 | 159.28±52.33 | 0.043 | 0.63±0.32 | 1 | 150.67±16.01 | 0.109 |
| Table VIIChanges from baseline in mean BCVA
and CMT of four MNV morphologies at different times after
intravitreal ranibizumab treatment. |
Table VII
Changes from baseline in mean BCVA
and CMT of four MNV morphologies at different times after
intravitreal ranibizumab treatment.
| |
Change from
baseline |
|---|
| | Medusa (n=3) | Tangled (n=7) | Seafan (n=5) | Other (n=3) |
|---|
| Time
(post-injection) | BCVA (logMAR) | P-value | CMT (µm) | P-value | BCVA (logMAR) | P-value | CMT (µm) | P-value | BCVA (logMAR) | P-value | CMT (µm) | P-value | BCVA (logMAR) | P-value | CMT (µm) | P-value |
|---|
| T2 (1 day) | 0.03±0.03 | 0.317 | -12.33±16.60 | 1 | -0.09±0.05 | 0.157 | -41.29±6.57 | 0.018 | -0.20±0.07 | 0.063 | 23.60±24.05 | 0.684 | 0.07±0.14 | 0.655 | -90.33±28.78 | 0.109 |
| T3 (7 days) | 0.00±0.14 | 1 | -41.94±33.08 | 0.109 | -0.27±0.09 | 0.026 | -67.00±18.34 | 0.018 | -0.34±0.06 | 0.041 | -74.00±51.83 | 0.138 | 0.13±0.12 | 0.414 | -167.00±62.36 | 0.109 |
| T4 (30 days) | 0.07±0.10 | 0.655 | -16.44±16.27 | 0.109 | -0.21±0.12 | 0.173 | -102.29±36.08 | 0.028 | -0.30±0.06 | 0.039 | -107.80±53.73 | 0.043 | 0.10±0.12 | 0.655 | -213.00±97.16 | 0.109 |
| T5 (60 days) | 0.00±0.05 | 0.785 | -58.57±29.18 | 0.109 | -0.24±0.12 | 0.147 | -107.29±32.49 | 0.018 | -0.54±0.09 | 0.043 | -124.28±64.82 | 0.043 | 0.10±0.12 | 0.655 | -238±77.76 | 0.109 |
| T6 (90 days) | 0.04±0.03 | 0.18 | -63.80±24.79 | 0.109 | -0.31±0.15 | 0.09 | -105.98±27.50 | 0.018 | -0.44±0.10 | 0.042 | -127.53±68.48 | 0.043 | 0.00±0.17 | 1.000 | -245.67±75.42 | 0.109 |
| Table VIIIMean MNV-VA and MNV-VD of four MNV
morphologies at different times after intravitreal ranibizumab
treatment. |
Table VIII
Mean MNV-VA and MNV-VD of four MNV
morphologies at different times after intravitreal ranibizumab
treatment.
| | Medusa (n=3) | Tangled (n=7) | Seafan (n=5) | Other (n=3) |
|---|
| Time
(post-injection) | MNV-VA
(mm2) | P-value | MNV-VD ratio | P-value | MNV-VA
(mm2) | P-value | MNV-VD ratio | P-value | MNV-VA
(mm2) | P-value | MNV-VD ratio | P-value | MNV-VA
(mm2) | P-value | MNV-VD ratio | P-value |
|---|
| T1 (0 day) | 0.61±0.54 | | 0.41±0.04 | | 0.87±0.67 | | 0.35±0.06 | | 1.33±0.90 | | 0.41±0.07 | | 0.36±0.21 | | 0.40±0.01 | |
| T2 (1 day) | 1.19±1.09 | 0.18 | 0.41±0.04 | 0.109 | 0.60±0.50 | 0.091 | 0.35±0.054 | 0.463 | 1.01±0.73 | 0.225 | 0.40±0.07 | 0.5 | 0.85±0.41 | 0.109 | 0.39±0.01 | 0.285 |
| T3 (7 days) | 0.75±0.59 | 1 | 0.40±0.05 | 0.109 | 0.54±0.53 | 0.018 | 0.33±0.04 | 0.128 | 0.59±0.37 | 0.08 | 0.39±0.05 | 0.893 | 0.69±0.35 | 0.109 | 0.35±0.06 | 0.109 |
| T4 (30 days) | 0.54±0.43 | 0.593 | 0.38±0.05 | 0.109 | 0.70±0.87 | 0.398 | 0.35±0.06 | 0.31 | 0.77±0.74 | 0.08 | 0.36±0.07 | 0.5 | 0.90±0.20 | 0.109 | 0.36±0.03 | 0.109 |
| T5 (60 days) | 0.42±0.24 | 0.593 | 0.39±0.09 | 0.593 | 0.36±0.12 | 0.043 | 0.33±0.09 | 0.735 | 0.57±0.50 | 0.08 | 0.34±0.11 | 0.5 | 0.74±0.52 | 0.109 | 0.29±0.01 | 0.109 |
| T6 (90 days) | 0.59±0.45 | 1 | 0.30±0.12 | 0.109 | 0.28±0.06 | 0.043 | 0.35±0.10 | 1 | 0.57±0.41 | 0.225 | 0.30±0.17 | 0.345 | 0.65±0.48 | 0.109 | 0.28±0.04 | 0.109 |
| Table IXChanges from baseline in mean MNV-VA
and MNV-VD of four MNV morphologies at different times after
intravitreal ranibizumab treatment. |
Table IX
Changes from baseline in mean MNV-VA
and MNV-VD of four MNV morphologies at different times after
intravitreal ranibizumab treatment.
| |
Change from
baseline |
|---|
| | Medusa (n=3) | Tangled (n=7) | Seafan (n=5) | Other (n=3) |
|---|
| Time
(post-injection) | MNV-VA
(mm2) | P-value | MNV-VD ratio | P-value | MNV-VA
(mm2) | P-value | MNV-VD ratio | P-value | MNV-VA
(mm2) | P-value | MNV-VD ratio | P-value | MNV-VA
(mm2) | P-value | MNV-VD ratio | P-value |
|---|
| T2 (1 day) | 0.58±0.44 | 0.18 | -0.20±0.14 | 0.109 | -0.26±0.13 | 0.091 | -0.65±0.64 | 0.463 | -0.31±0.21 | 0.225 | -0.68±1.01 | 0.5 | 0.49±0.21 | 0.109 | -0.27±0.15 | 0.285 |
| T3 (7 days) | 0.14±0.20 | 1 | -1.01±0.38 | 0.109 | -0.32±0.11 | 0.018 | -2.80±1.92 | 0.128 | -0.74±0.32 | 0.08 | -1.80±2.62 | 0.893 | 0.32±0.14 | 0.109 | -5.04±2.35 | 0.109 |
| T4 (30 days) | -0.07±0.09 | 0.593 | -3.11±0.43 | 0.109 | -0.16±0.18 | 0.398 | -0.62±1.60 | 0.31 | -0.55±0.24 | 0.08 | -5.20±3.83 | 0.5 | 0.54±0.00 | 0.109 | -3.59±1.74 | 0.109 |
| T5 (60 days) | -0.19±0.18 | 0.593 | -2.16±2.5 | 0.593 | -0.51±0.21 | 0.043 | -2.46±3.99 | 0.735 | -0.76±0.34 | 0.08 | -6.41±7.14 | 0.5 | 0.38±0.15 | 0.109 | -10.38±0.37 | 0.109 |
| T6 (90 days) | -0.02±0.20 | 1 | -11.79±4.27 | 0.109 | -0.59±0.23 | 0.043 | -0.80±3.82 | 1 | -0.75±0.39 | 0.225 | -10.44±9.31 | 0.345 | 0.29±0.13 | 0.109 | -12.02±1.17 | 0.109 |
Comparisons between the two treatment
groups
The mean BCVA, CMT, and MNV parameters of the two
groups did not exhibit significant differences between
pre-injection and the last visit (90 days) after injection. These
data are presented in Table X.
| Table XMean BCVA, CMT and MNV parameters
obtained from neovascular age-related macular degeneration patients
before and after intravitreal injection. |
Table X
Mean BCVA, CMT and MNV parameters
obtained from neovascular age-related macular degeneration patients
before and after intravitreal injection.
| | Mean BCVA
(LogMAR) | Mean CMT (µm) | Mean MNV-VA
(mm2) | Mean MNV-VD
ratio |
|---|
| Group | Baseline | 90 days | Baseline | 90 days | Baseline | 90 days | Baseline | 90 days |
|---|
| Conbercept
(n=26) | 0.97±0.50 | 0.78±0.53 | 293.71±145.60 | 211.94±51.11 | 1.34±1.14 | 0.79±0.59 | 0.40±0.10 | 0.34±0.12 |
| Ranibizumab
(n=18) | 0.94±0.54 | 0.70±0.47 | 328.72±144.80 | 200.51±90.29 | 0.87±0.71 | 0.47±0.35 | 0.39±0.06 | 0.31±0.11 |
| P-value | 0.831 | 0.639 | 0.527 | 0.527 | 0.166 | 0.086 | 0.596 | 0.573 |
Discussion
MNV, formerly known as choroidal neovascularization
(CNV), represents a pathological manifestation of nAMD. The updated
nomenclature system categorizes MNV into three types: Type 1 MNV
encompasses occult CNV and PCV, type 2 MNV corresponds to classic
CNV and type 3 MNV primarily involves neovascularization
originating from the deep capillary plexus of the retinal
circulation and extending towards the outer retina (17). This revision to the standardized
nomenclature system reflects the integration of insights derived
from recent advancements in imaging technology.
In contemporary fundus disease diagnostics,
multimodal imaging technology plays a crucial role. For
vascular-related retinal conditions, particularly nAMD, a leading
cause of irreversible visual impairment in individuals aged >50
worldwide (18), OCTA has emerged
as the primary tool for MNV evaluation and analysis due to its
non-invasive and repeatable advantages. Previous studies have
highlighted that the detection rate of MNV is influenced by various
factors, such as PED, with type 2 MNV being more easily detectable
than type 1 MNV. Despite this, the sensitivity of MNV detection by
OCTA is comparable to that of ICGA (55-90%), and OCTA excels in
identifying the morphology and intricate details of MNV (11,19-22).
The present study enrolled 39 patients with
clinically active lesions, achieving an MNV detection rate of 100%
using OCTA. Moreover, a well-defined and clearly distinguishable
neovascular complex morphology was identified in 38 out of 44 eyes
(86.3%). These findings aligned with the results of previous
studies (13,19-22).
Various studies have characterized and assessed MNV
based on morphological features detected by OCTA. El Ameen et
al (23) identified two
distinct type 2 morphologies: The Medusa and the glomerulus
patterns, typically associated with a main branch. De Carlo et
al (24) have used a fiber
descriptor for MNV morphology. A study conducted by Kuehlewein
et al (25) found that
among highly organized CNV lesions observed through OCTA, 55%
exhibit the Medusa type, 21% the seafan type and 24% an indistinct
type. However, these studies do not delve into the clinical
significance of these diverse patterns.
In a retrospective analysis of 184 eyes, Karacorlu
et al (26) associated type
1, type 2 and mixed-type neovascularization with nAMD using OCTA.
They found that all clinically active cases display well-defined
patterns, such as Medusa and seafan patterns. Conversely, 47% of
clinically inactive cases exhibit an ill-defined, unidentifiable
morphology. The findings of their study suggest that the
morphological characteristics observed through OCTA are not
inherently linked to clinical activity. However, a notable
exception is the association of long, dilated filamentous linear
vessels with chronicity and lesion inactivity.
Tew et al (16) further differentiated and reported
tangled pattern complexes with a main trunk or feeder vessel. In
their study of 140 eyes, they identified MNV in 78.6%, with 37.3%
displaying the Medusa pattern, 39.1% the seafan pattern and 23.6%
the tangled pattern. In the present study, 27.2% of eyes exhibited
the Medusa pattern, 36.3% the seafan pattern, 22.7% the tangled
pattern and 13.6% another pattern (i.e., ill-defined but measurable
MNV). Consistent with Tew et al (16), there was a higher proportion of
eyes with the seafan pattern in the present study (27).
Numerous researchers have examined the structural
parameters of MNV, seeking to determine whether variations in these
parameters are associated with the prognosis of anti-VEGF treatment
(10,28-30).
The present study revealed notable improvements in the overall
BCVAs across the four MNV pattern groups, coupled with a decrease
in structural parameters following anti-VEGF treatment. The two
drug treatment cohorts exhibited a statistically significant
reduction in CMT, accompanied by a corresponding increase in visual
acuity before and after treatment.
This observation aligned with findings from
established literature on nAMD, including the CATT study (27,31).
Regarding MNV parameters, both the MNV-VA and the MNV-VD ratio
showed a decrease after anti-VEGF treatment in the two drug groups.
However, these differences did not reach statistical significance.
The efficacy of anti-VEGF treatment across diverse MNV patterns has
been validated in several studies (16,32,33).
The present study observed a significant improvement in visual
acuity among patients with the tangled pattern at five
postoperative time points following conbercept injection. Notably,
the magnitude of BCVA improvement in this group surpassed that of
patients with the other three patterns. The reasons behind the
increased efficacy of conbercept in treating complex retinal
conditions involving tangled MNV remain somewhat unclear. It was
hypothesized that tangled MNV, characterized by vascular masses
lacking prominent vessels, might demonstrate heightened sensitivity
to conbercept, a fusion protein comprising VEGFR and a recombined
human IgG Fc gene. These findings aligned with the suggestion of
Tew et al (16) that MNV
lacking a main trunk vessel and presenting with improved baseline
vision are favorable indicators for visual prognosis. However, the
present study differed in that the baseline vision of patients with
the tangled pattern was suboptimal.
Furthermore, a significant reduction in both MNV-VA
and the MNV-VD ratio was observed among patients with the Medusa
pattern after conbercept injection, as compared with those with the
other three patterns. Notably, this decrease in MNV parameters did
not correspond to a simultaneous increase in visual acuity.
Additionally, the improvement in BCVA was minimal in the IVR group
throughout the entire experimental observation period. A previous
study reported that active MNV on OCTA features a higher incidence
of prominent central vessels, dense branching vessels and
peripheral arcades in active lesions (34). Thick central main vessels and
active lesions often indicate the chronic course of mature
neovascularization. Patients with this chronic, mature MNV type are
more likely to exhibit an incomplete response to anti-VEGF therapy
and may face challenges in achieving significant vision recovery.
The results of the present study aligned with the findings of
Levine et al (35),
suggesting that changes in area and density are associated with
decreases in the number and diameter of branching vessels.
Notably, the present study demonstrated significant
improvements in visual acuity and a decrease in MNV-VA among
patients with the seafan pattern in the ranibizumab treatment
group. While the change in BCVA improvement was markedly different,
the alteration in MNV-VA decrease did not reach statistical
significance. Kuehlewein et al (25) previously reported that patients
with the seafan pattern among type 1 MNV individuals exhibit
improved BCVA after ranibizumab therapy. They hypothesize that the
small molecular structure of ranibizumab may facilitate its
penetration through the RPE layer.
Furthermore, the observations of the present study
indicated a decrease in MNV-VA at T3 (7 days after the first
injection), followed by some recovery at T4 (30 days after the
first injection). This was accompanied by corresponding
fluctuations in visual acuity during the same periods. Lumbroso
et al (36) proposed a
‘cycle’ of MNV growth, where 24 h post-injection, OCTA shows a
reduction in neovascularization with vessels appearing ‘broken’.
Subsequent ‘pruning’ of thinner anastomotic stoma and ‘loss’ of
smaller vessels contributed to a reduction in the MNV-VA, making
the vascular trunk visible by the 7 to 10th day. As the MNV-VA
continued to decrease, re-proliferation of vessels was detected by
OCTA at 28-35 days post-injection, with some anastomoses and rings
reappearing in areas where vessels had previously ‘collapsed’. Told
et al (37) have also
concluded that anti-VEGF drugs can intermittently inhibit
angiogenesis, prompting neovascular buds of MNV to undergo a cycle
of germination, pruning, and leakage. The findings of the present
study aligned with this research.
Among the 44 eyes in the present study, six (13.6%)
exhibited other MNV types characterized by an ill-defined shape
that could be measured, primarily manifesting irregular
‘dendritic’, ‘filamentous’, and ‘circular’ patterns. The
significant decrease in CMT was notable. Long linear vessels are
classified as inactive lesions with minimal vascular leakage,
demonstrating a favorable response to anti-VEGF drugs as effective
anti-leakage agents (26,38-40).
In the present study, no statistical differences
were found between the two drug treatment groups in terms of BCVA,
CMT and MNV parameters. According to the ‘3+PRN’ regimen of
anti-VEGF drugs, the visual gain at 3 months post-injection can
serve as a predictor for long-term visual prognosis (16). Rush et al (41) proposed that changes in CNV size on
ICGA 2 months after anti-VEGF therapy can aid clinicians in
predicting the clinical course of nAMD subjects. An extensive
8-year clinical trial (42),
affirming that 3+PRN usage can sustain or enhance the vision of 50%
of neovascular AMD patients. Real-world studies further support the
efficacy of the 3+PRN regimen, indicating comparable visual
benefits to the 3+T&E regimen, albeit with fewer injections,
reduced economic burden and increased patient acceptability
(43-45).
The present study provided quantitative follow-up data for two
anti-VEGF drugs over 3 months, administered under the ‘3+PRN’
treatment regimen. It is planned to collect follow-up data for ≥12
months to validate our initial conclusions and hypotheses.
The current study presented several limitations that
warrant consideration. First, although the study adopted a
prospective design, the lack of randomization in the treatment
allocation for patients in the two groups, with treatments
administered based on patient preferences, introduced a potential
source of bias. Second, the cohort of treatment-naïve nAMD patients
included in the present study was relatively small and only six
eyes exhibited the other pattern of MNV. Additionally, the 3-month
follow-up duration was relatively short, resulting in potentially
weakened conclusions. The statistical challenge of identifying
significant findings amid a vast amount of data might also be a
factor in the present study. Undoubtedly, future studies with
larger sample sizes and longer follow-up periods are imperative to
strengthen the robustness of conclusions drawn. Third, technical
limitations, including projection artifacts, segmentation
artifacts, and motion artifacts, are inevitable when OCTA collects
data on deep neovascularization blood flow. This hinders the
ability of the present study to refine and correlate the shape of
MNV and the position of MNV (type 1/type 2/mixed MNV).
Acknowledgements
The authors extend their sincere gratitude to Dr
Yang Sun (Data Center, Shaanxi Provincial People's Hospital, Xi'an,
Shaanxi) for providing invaluable guidance on the statistical
methods employed in this manuscript. Dr Sun's expertise
significantly contributed to the rigor and accuracy of our
analyses.
Funding
Funding: The present study received support from the Natural
Science Foundation of Shaanxi Province (grant no. 2022JM-517) and
the Science and Technology Talents Support Program of Shaanxi
Provincial People's Hospital (grant no. 2021JY-37).
Availability of data and materials
The data generated in the present study may be
requested from the corresponding author.
Authors' contributions
JL conceived and executed the experiments, analyzed
the data and contributed to manuscript editing. ZY conducted the
experiments. XL analyzed the data. DL performed experiments and
analyzed data. JY and MD wrote and edited the manuscript. JL and JY
confirm the authenticity of all the raw data. All authors read and
approved the final manuscript.
Ethics approval and consent to
participate
The present study received approval from the Ethics
Committee of Shaanxi Provincial People's Hospital [Xi'an, China;
approval no. 2022 no.(R002)], in accordance with the Declaration of
Helsinki. Written informed consent was obtained from participants
as detailed in Materials and methods section of the present
study.
Patient consent for publication
Not applicable.
Competing interests
The authors declare that they have no competing
interests.
References
|
1
|
Jonasson F, Fisher DE, Eiriksdottir G,
Sigurdsson S, Klein R, Launer LJ, Harris T, Gudnason V and Cotch
MF: Five-year incidence, progression, and risk factors for
age-related macular degeneration: The age, gene/environment
susceptibility study. Ophthalmology. 121:1766–1772. 2014.PubMed/NCBI View Article : Google Scholar
|
|
2
|
Afarid M, Azimi A and Malekzadeh M:
Evaluation of serum interferons in patients with age-related
macular degeneration. J Res Med Sci. 24(24)2019.PubMed/NCBI View Article : Google Scholar
|
|
3
|
Apte RS, Chen DS and Ferrara N: VEGF in
signaling and disease: Beyond discovery and development. Cell.
176:1248–1264. 2019.PubMed/NCBI View Article : Google Scholar
|
|
4
|
Kim KJ, Li B, Winer J, Armanini M, Gillett
N, Phillips HS and Ferrara N: Inhibition of vascular endothelial
growth factor-induced angiogenesis suppresses tumour growth in
vivo. Nature. 362:841–844. 1993.PubMed/NCBI View
Article : Google Scholar
|
|
5
|
Schlottmann PG, Alezzandrini AA, Zas M,
Rodriguez FJ, Luna JD and Wu L: New treatment modalities for
neovascular age-related macular degeneration. Asia Pac J Ophthalmol
(Phila). 6:514–519. 2017.PubMed/NCBI View Article : Google Scholar
|
|
6
|
Nguyen QD, Das A, Do DV, Dugel PU, Gomes
A, Holz FG, Koh A, Pan CK, Sepah YJ, Patel N, et al: Brolucizumab:
Evolution through preclinical and clinical studies and the
implications for the management of neovascular age-related macular
degeneration. Ophthalmology. 127:963–976. 2020.PubMed/NCBI View Article : Google Scholar
|
|
7
|
Borrelli E, Parravano M, Sacconi R,
Costanzo E, Querques L, Vella G, Bandello F and Querques G:
Guidelines on optical coherence tomography angiography imaging:
2020 Focused update. Ophthalmol Ther. 9:697–707. 2020.PubMed/NCBI View Article : Google Scholar
|
|
8
|
Borrelli E, Sarraf D, Freund KB and Sadda
SR: OCT angiography and evaluation of the choroid and choroidal
vascular disorders. Prog Retin Eye Res. 67:30–55. 2018.PubMed/NCBI View Article : Google Scholar
|
|
9
|
Jia Y, Bailey ST, Wilson DJ, Tan O, Klein
ML, Flaxel CJ, Potsaid B, Liu JJ, Lu CD, Kraus MF, et al:
Quantitative optical coherence tomography angiography of choroidal
neovascularization in age-related macular degeneration.
Ophthalmology. 121:1435–1444. 2014.PubMed/NCBI View Article : Google Scholar
|
|
10
|
Ashraf M, Souka A and Adelman RA:
Age-related macular degeneration: Using morphological predictors to
modify current treatment protocols. Acta Ophthalmol. 96:120–133.
2018.PubMed/NCBI View Article : Google Scholar
|
|
11
|
Inoue M, Jung JJ, Balaratnasingam C,
Dansingani KK, Dhrami-Gavazi E, Suzuki M, de Carlo TE, Shahlaee A,
Klufas MA, El Maftouhi A, et al: A comparison between optical
coherence tomography angiography and fluorescein angiography for
the imaging of type 1 neovascularization. Invest Ophthalmol Vis
Sci. 57:OCT314–OCT323. 2016.PubMed/NCBI View Article : Google Scholar
|
|
12
|
Hsu CR, Lai TT, Hsieh YT, Ho TC, Yang CM
and Yang CH: Combined quantitative and qualitative optical
coherence tomography angiography biomarkers for predicting active
neovascular age-related macular degeneration. Sci Rep.
11(18068)2021.PubMed/NCBI View Article : Google Scholar
|
|
13
|
Arrigo A, Aragona E, Bordato A, Amato A,
Borghesan F, Bandello F and Parodi MB: Quantitative optical
coherence tomography angiography parameter variations after
treatment of macular neovascularization secondary to age-related
macular degeneration. Retina. 41:1463–1469. 2021.PubMed/NCBI View Article : Google Scholar
|
|
14
|
Shin YI, Kim JM, Lee MW, Jo YJ and Kim JY:
Characteristics of the foveal microvasculature in asian patients
with dry age-related macular degeneration: An optical coherence
tomography angiography study. Ophthalmologica. 243:145–153.
2020.PubMed/NCBI View Article : Google Scholar
|
|
15
|
Su L, Ji YS, Tong N, Sarraf D, He X, Sun
X, Xu X and Sadda SR: Quantitative assessment of the retinal
microvasculature and choriocapillaris in myopic patients using
swept-source optical coherence tomography angiography. Graefes Arch
Clin Exp Ophthalmol. 258:1173–1180. 2020.PubMed/NCBI View Article : Google Scholar
|
|
16
|
Tew TB, Lai TT, Hsieh YT, Ho TC, Yang CM
and Yang CH: Comparison of different morphologies of choroidal
neovascularization evaluated by ocular coherence tomography
angiography in age-related macular degeneration. Clin Exp
Ophthalmol. 48:927–937. 2020.PubMed/NCBI View Article : Google Scholar
|
|
17
|
Spaide RF, Jaffe GJ, Sarraf D, Freund KB,
Sadda SR, Staurenghi G, Waheed NK, Chakravarthy U, Rosenfeld PJ,
Holz FG, et al: Consensus nomenclature for reporting neovascular
age-related macular degeneration data: Consensus on neovascular
age-related macular degeneration nomenclature study group.
Ophthalmology. 127:616–636. 2020.PubMed/NCBI View Article : Google Scholar
|
|
18
|
Takeuchi J, Kataoka K, Ito Y, Takayama K,
Yasuma T, Kaneko H and Terasaki H: Optical coherence tomography
angiography to quantify choroidal neovascularization in response to
aflibercept. Ophthalmologica. 240:90–98. 2018.PubMed/NCBI View Article : Google Scholar
|
|
19
|
Liang MC, de Carlo TE, Baumal CR, Reichel
E, Waheed NK, Duker JS and Witkin AJ: Correlation of spectral
domain optical coherence tomography angiography and clinical
activity in neovascular age-related macular degeneration. Retina.
36:2265–2273. 2016.PubMed/NCBI View Article : Google Scholar
|
|
20
|
Eandi CM, Ciardella A, Parravano M,
Missiroli F, Alovisi C, Veronese C, Morara MC, Grossi M, Virgili G
and Ricci F: Indocyanine green angiography and optical coherence
tomography angiography of choroidal neovascularization in
age-related macular degeneration. Invest Ophthalmol Vis Sci.
58:3690–3696. 2017.PubMed/NCBI View Article : Google Scholar
|
|
21
|
Coscas GJ, Lupidi M, Coscas F, Cagini C
and Souied EH: Optical coherence tomography angiography versus
traditional multimodal imaging in assessing the activity of
exudative age-related macular degeneration: A new diagnostic
challenge. Retina. 35:2219–2228. 2015.PubMed/NCBI View Article : Google Scholar
|
|
22
|
Roberts PK, Nesper PL, Gill MK and Fawzi
AA: Semiautomated quantitative approach to characterize treatment
response in neovascular age-related macular degeneration: A
real-world study. Retina. 37:1492–1498. 2017.PubMed/NCBI View Article : Google Scholar
|
|
23
|
El Ameen A, Cohen SY, Semoun O, Miere A,
Srour M, Quaranta-El Maftouhi M, Oubraham H, Blanco-Garavito R,
Querques G and Souied EH: Type 2 neovascularization secondary to
age-related macular degeneration imaged by optical coherence
tomography angiography. Retina. 35:2212–2218. 2015.PubMed/NCBI View Article : Google Scholar
|
|
24
|
de Carlo TE, Bonini Filho MA, Chin AT,
Adhi M, Ferrara D, Baumal CR, Witkin AJ, Reichel E, Duker JS and
Waheed NK: Spectral-domain optical coherence tomography angiography
of choroidal neovascularization. Ophthalmology. 122:1228–1238.
2015.PubMed/NCBI View Article : Google Scholar
|
|
25
|
Kuehlewein L, Bansal M, Lenis TL, Iafe NA,
Sadda SR, Bonini Filho MA, De Carlo TE, Waheed NK, Duker JS and
Sarraf D: Optical coherence tomography angiography of type 1
neovascularization in age-related macular degeneration. Am J
Ophthalmol. 160:739–748.e2. 2015.PubMed/NCBI View Article : Google Scholar
|
|
26
|
Karacorlu M, Sayman Muslubas I, Arf S,
Hocaoglu M and Ersoz MG: Membrane patterns in eyes with choroidal
neovascularization on optical coherence tomography angiography. Eye
(Lond). 33:1280–1289. 2019.PubMed/NCBI View Article : Google Scholar
|
|
27
|
Comparison of Age-related Macular
Degeneration Treatments Trials (CATT) Research Group. Martin DF,
Maguire MG, Fine SL, Ying GS, Jaffe GJ, Grunwald JE, Toth C,
Redford M and Ferris FL III: Ranibizumab and bevacizumab for
treatment of neovascular age-related macular degeneration: Two-year
results. Ophthalmology. 119:1388–1398. 2012.PubMed/NCBI View Article : Google Scholar
|
|
28
|
Told R, Reumueller A, Schranz M, Brugger
J, Weigert G, Reiter GS, Sacu S and Schmidt-Erfurth U: OCTA
biomarker search in patients with nAMD: Influence of retinal fluid
on time-dependent biomarker response. Curr Eye Res. 48:600–604.
2023.PubMed/NCBI View Article : Google Scholar
|
|
29
|
Faatz H, Rothaus K, Ziegler M, Book M,
Spital G, Lange C and Lommatzsch A: The architecture of macular
neovascularizations predicts treatment responses to anti-VEGF
therapy in neovascular AMD. Diagnostics (Basel).
12(2807)2022.PubMed/NCBI View Article : Google Scholar
|
|
30
|
Arya M, Rashad R, Sorour O, Moult EM,
Fujimoto JG and Waheed NK: Optical coherence tomography angiography
(OCTA) flow speed mapping technology for retinal diseases. Expert
Rev Med Devices. 15:875–882. 2018.PubMed/NCBI View Article : Google Scholar
|
|
31
|
Kanadani TCM, Veloso CE and Nehemy MB:
Subfoveal choroidal thickness in eyes with neovascular age-related
macular degeneration treated with anti-vascular endothelial growth
factor agents. Ophthalmologica. 240:200–207. 2018.PubMed/NCBI View Article : Google Scholar
|
|
32
|
Miere A, Butori P, Cohen SY, Semoun O,
Capuano V, Jung C and Souied EH: Vascular remodeling of choroidal
neovascularization after anti-vascular endothelial growth factor
therapy visualized on optical coherence tomography angiography.
Retina. 39:548–557. 2019.PubMed/NCBI View Article : Google Scholar
|
|
33
|
Miere A, Semoun O, Cohen SY, El Ameen A,
Srour M, Jung C, Oubraham H, Querques G and Souied EH: Optical
coherence tomography angiography features of subretinal fibrosis in
age-related macular degeneration. Retina. 35:2275–2284.
2015.PubMed/NCBI View Article : Google Scholar
|
|
34
|
Al-Sheikh M, Iafe NA, Phasukkijwatana N,
Sadda SR and Sarraf D: Biomarkers of neovascular activity in
age-related macular degeneration using optical coherence tomography
angiography. Retina. 38:220–230. 2018.PubMed/NCBI View Article : Google Scholar
|
|
35
|
Levine ES, Custo Greig E, Mendonça LSM,
Gulati S, Despotovic IN, Alibhai AY, Moult E, Muakkassa N,
Quaranta-El Maftouhi M, El Maftouhi A, et al: The long-term effects
of anti-vascular endothelial growth factor therapy on the optical
coherence tomography angiographic appearance of neovascularization
in age-related macular degeneration. Int J Retina Vitreous.
6(39)2020.PubMed/NCBI View Article : Google Scholar
|
|
36
|
Lumbroso B, Rispoli M and Savastano MC:
Longitudinal optical coherence tomography-angiography study of type
2 naive choroidal neovascularization early response after
treatment. Retina. 35:2242–2251. 2015.PubMed/NCBI View Article : Google Scholar
|
|
37
|
Told R, Reiter GS, Schranz M, Reumueller
A, Hacker V, Mittermueller TJ, Roberts PK, Sacu S and
Schmidt-Erfurth U: Correlation of retinal thickness and
swept-source optical coherence tomography angiography derived
vascular changes in patients with neovascular age-related macular
degeneration. Curr Eye Res. 46:1002–1009. 2021.PubMed/NCBI View Article : Google Scholar
|
|
38
|
Arrigo A, Aragona E, Bordato A, Amato A,
Borghesan F, Bandello F and Battaglia Parodi M: Morphological and
functional relationship between OCTA and FA/ICGA quantitative
features in AMD-related macular neovascularization. Front Med
(Lausanne). 8(758668)2021.PubMed/NCBI View Article : Google Scholar
|
|
39
|
Ahmed M, Syrine BM, Nadia BA, Anis M,
Karim Z, Mohamed G, Hachemi M, Fethi K and Leila K: Optical
coherence tomography angiography features of macular
neovascularization in wet age-related macular degeneration: A
cross-sectional study. Ann Med Surg (Lond).
70(102826)2021.PubMed/NCBI View Article : Google Scholar
|
|
40
|
Carnevali A, Cicinelli MV, Capuano V,
Corvi F, Mazzaferro A, Querques L, Scorcia V, Souied EH, Bandello F
and Querques G: Optical coherence tomography angiography: A useful
tool for diagnosis of treatment-Naïve quiescent choroidal
neovascularization. Am J Ophthalmol. 169:189–198. 2016.PubMed/NCBI View Article : Google Scholar
|
|
41
|
Rush RB, Rush SW, Aragon AV II and Ysasaga
JE: Evaluation of choroidal neovascularization with indocyanine
green angiography in neovascular age-related macular degeneration
subjects undergoing intravitreal bevacizumab therapy. Am J
Ophthalmol. 158:337–344. 2014.PubMed/NCBI View Article : Google Scholar
|
|
42
|
Horner F, Lip PL, Clark H, Chavan R,
Sarmad A and Mushtaq B: Real-world visual and clinical outcomes for
patients with neovascular age-related macular degeneration treated
with intravitreal ranibizumab: An 8-year observational cohort
(AMD8). Clin Ophthalmol. 13:2461–2467. 2019.PubMed/NCBI View Article : Google Scholar
|
|
43
|
Jacob J, Brié H, Leys A, Levecq L,
Mergaerts F, Denhaerynck K, Vancayzeele S, Van Craeyveld E, Abraham
I and MacDonald K: Six-year outcomes in neovascular age-related
macular degeneration with ranibizumab. Int J Ophthalmol. 10:81–90.
2017.PubMed/NCBI View Article : Google Scholar
|
|
44
|
Gillies MC, Campain A, Barthelmes D,
Simpson JM, Arnold JJ, Guymer RH, McAllister IL, Essex RW, Morlet N
and Hunyor AP: Fight Retinal Blindness Study Group. Long-term
outcomes of treatment of neovascular age-related macular
degeneration: Data from an observational study. Ophthalmology.
122:1837–1845. 2015.PubMed/NCBI View Article : Google Scholar
|
|
45
|
Rofagha S, Bhisitkul RB, Boyer DS, Sadda
SR and Zhang K: SEVEN-UP Study Group. Seven-year outcomes in
ranibizumab-treated patients in ANCHOR, MARINA, and HORIZON: A
multicenter cohort study (SEVEN-UP). Ophthalmology. 120:2292–2299.
2013.PubMed/NCBI View Article : Google Scholar
|