Introduction
Venous thromboembolism, clinically including deep
vein thrombosis (DVT) and pulmonary thromboembolism (PE), is one of
the most common cardiovascular diseases, second only to myocardial
infarction and stroke (1). The
annual incidence of PE ranged from 39 per 100,000 (in Hong Kong) to
115 per 100,000 population (in the United States) (2). There is a large number of
predisposing factors associated with acute PE (APE) including DVT,
lower-limb fractures, joint replacements, surgery, spinal cord
injury, cancer and other weak risk factors (3,4). The
most common symptoms of APE include dyspnea, chest pain, cough,
hemoptysis, syncope and fever (5).
Due to the wide range of non-specific clinical symptoms and signs,
rapid and accurate diagnosis of APE is a big challenge (6). Computed tomography pulmonary
angiography (CTPA) has been the gold standard for the diagnosis of
APE (7,8). This method visualizes the clot in the
pulmonary artery as a filling defect in the lumen. However,
compared with CTPA, chest non-contrasted CT (NC-CT) is a convenient
and cost-effective procedure and often performed for the evaluation
of non-specific chest symptoms in emergency cases. Chest NC-CT is
not considered to be an effective method for APE diagnosis,
however, some studies reported that the hyperdense lumen sign on
chest NC-CT might be a sign of APE (9,10).
In addition, chest NC-CT has recently been used in patients with
COVID-19 pneumonia, and the incidence of APE was relatively high in
patients with COVID-19 pneumonia (11). The aim of the present study was to
review imaging features of APE on chest NC-CT, and comprehensively
analyze the value of NC-CT in detecting APE.
Materials and methods
Study population
This is a single-center retrospectively
observational study which was approved by the ethics committees of
China-Japan Friendship Hospital (Beijing, China; approval no.
2022-KY-048-1) and performed in accordance with the Declaration of
Helsinki. Informed consent was waived for this retrospective study.
All patients who first underwent chest NC-CT and then CTPA within
24 h between January 2018 and October 2022 were enrolled in this
study. Patients with poor image quality of CTPA due to severe
motion artifacts or the low-contrasted enhancement of pulmonary
artery were excluded. Patients who were diagnosed with chronic PE
(CPE), chronic thromboembolic pulmonary hypertension,
non-thrombotic PE, pulmonary artery sarcoma and Takayasu arteritis
as shown in their electronic medical records were excluded. The
clinical information of all patients was recorded using their
medical charts and all patients were treated at standard clinical
practice. Clinical characteristics of the patients are given in
Table I.
 | Table IClinical characteristics in patients
with and without APE. |
Table I
Clinical characteristics in patients
with and without APE.
| Clinical
characteristic | APE (n=110) | Non-APE (n=163) | P-value |
|---|
| Age, years, mean
(SD) | 65.3 (18.2) | 63.6 (17.9) | 0.444 |
| Men, n (%) | 54 (49.1) | 77 (47.2) | 0.764 |
| Dyspnoea, n (%) | 44 (40.0) | 55 (33.7) | 0.291 |
| Chest pain, n
(%) | 25 (22.7) | 36 (22.1) | 0.901 |
| Cough/sputum, n
(%) | 20 (18.2) | 26 (16.0) | 0.629 |
| Hemoptysis, n
(%) | 8 (7.3) | 9 (5.5) | 0.557 |
| Fever, n (%) | 15 (13.6) | 20 (12.3) | 0.740 |
| Syncope, n (%) | 6 (5.5) | 10 (6.1) | 0.814 |
| D-dimer (mg/l),
median (IQR) | 5.6 (2.7-13.8) | 1.8 (0.9-3.8) |
<0.001a |
| CRP (mg/l), median
(IQR) | 24.9 (9.8-67.9) | 14.0 (3.3-81.9) | 0.057 |
| NT-proBNP (pg/ml),
median (IQR) | 338.0
(72.0-1817.5) | 437.5
(102.8-2035.3) | 0.428 |
| Hemodynamic
instability, n (%) | 3 (2.7) | 0 (0) | N/A |
| DVT of lower limbs, n
(%) | 59 (53.6) | 21 (12.9) |
<0.001a |
| Fractures, n (%) | 8 (7.3) | 4 (2.5) | 0.109 |
| Immobilization, n
(%) | 16 (14.5) | 12 (7.4) | 0.055 |
| Surgery, n (%) | 3 (2.7) | 5 (3.1) | 1.000 |
| Malignant tumors, n
(%) | 11 (10.0) | 18 (11.0) | 0.784 |
| In-hospital death, n
(%) | 0 (0) | 2 (1.2) | N/A |
CT scan protocols
All patients underwent both chest NC-CT and CTPA on
multidetector CT [Toshiba Aquilion ONE 320 (Canon Medical Systems
Corporation) or GE Revolution CT (GE Healthcare)] within 24 h. All
the scans ranged from pulmonary apices to the diaphragm with a
craniocaudal direction. The slice thickness and interval of NC-CT
was 5 mm.
Parameters for CTPA scanning were as follows: 120
kV; 100-300 mA, 0.8 sec rotation time, 0.625-1-mm-thick slices, and
0.625-1-mm slice interval. Patients received a bolus of 70-ml
non-ionic contrast (Ultravist; 370 mg I/ml; Bayer AG), followed by
a 50-ml saline flush at a rate range of 4-4.5 ml/sec. The scanning
delay time was determined using the contrast agent automatic
detection trigger technique, which positioned the target at the
level of the main pulmonary artery with a predefined threshold of
100 Hounsfield units (Hu), and fixed 5-sec delay scanning.
Imaging analysis
All CTPA images were reviewed by a chest radiologist
with 12 years of experience on picture archiving and communication
systems (RG). APE was divided into central type and peripheral type
based on the clot distribution. Central APE was diagnosed when a
filling-defect was observed in the main pulmonary artery, left or
right pulmonary artery trunk and peripheral APE is defined as a
clot in the interlobar artery, lobar artery and segmental artery
(12).
All NC-CT images were reviewed by two radiologists
who were blinded to the original CT report, CTPA and clinical
diagnosis (MD and ML). The presence of APE and imaging findings
including the hyperdense lumen sign, peripheral wedge-shaped
opacity, mosaic attenuation, pleural effusion and pericardial
effusion were determined by the consensus of the two chest
radiologists who had 10 and 16 years of experience, respectively.
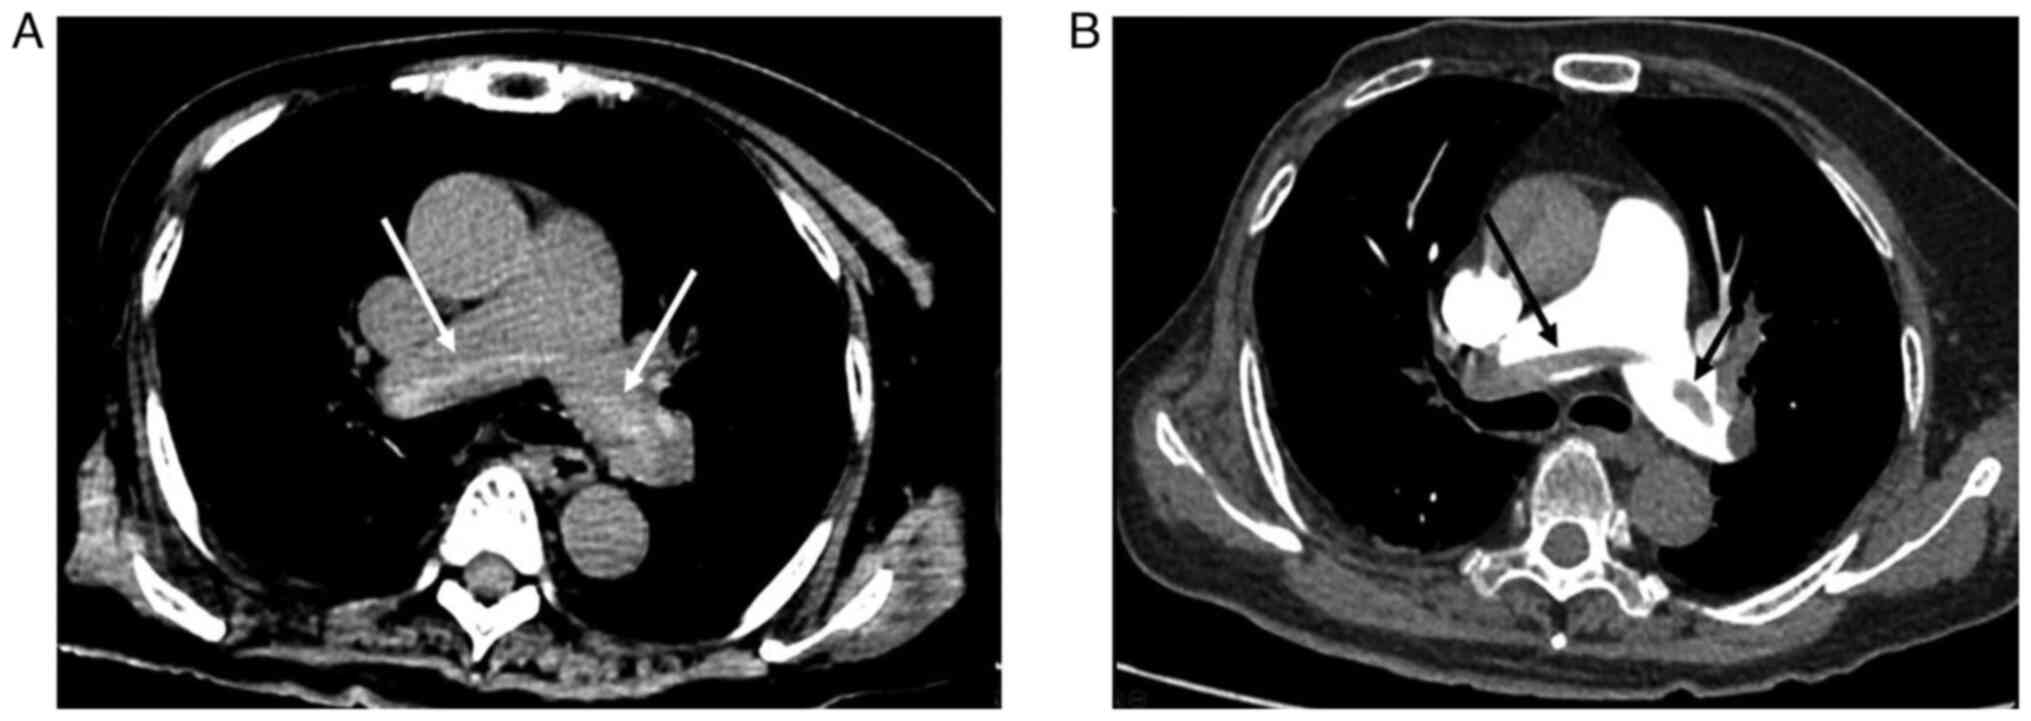
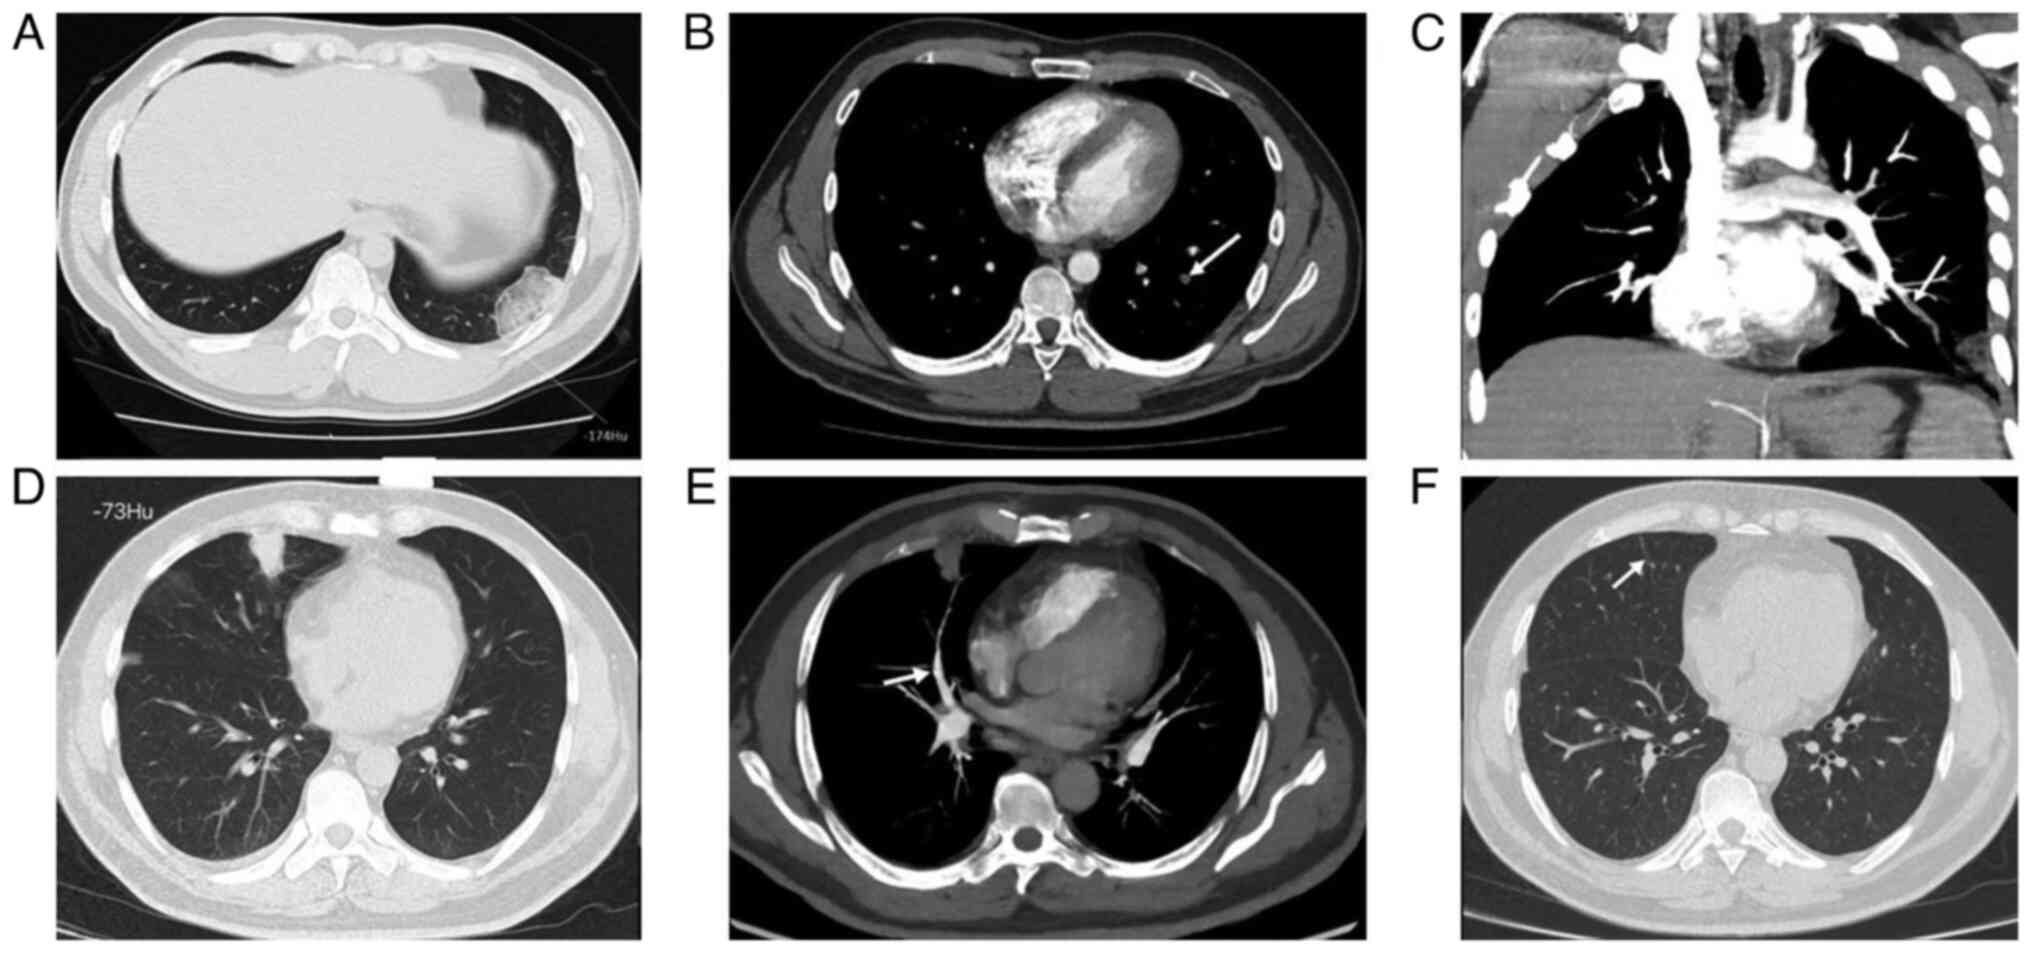
The hyperdense lumen sign is defined as a high-density foci in the
pulmonary artery on NC-CT (13),
that has a higher density than the blood in the heart cavity
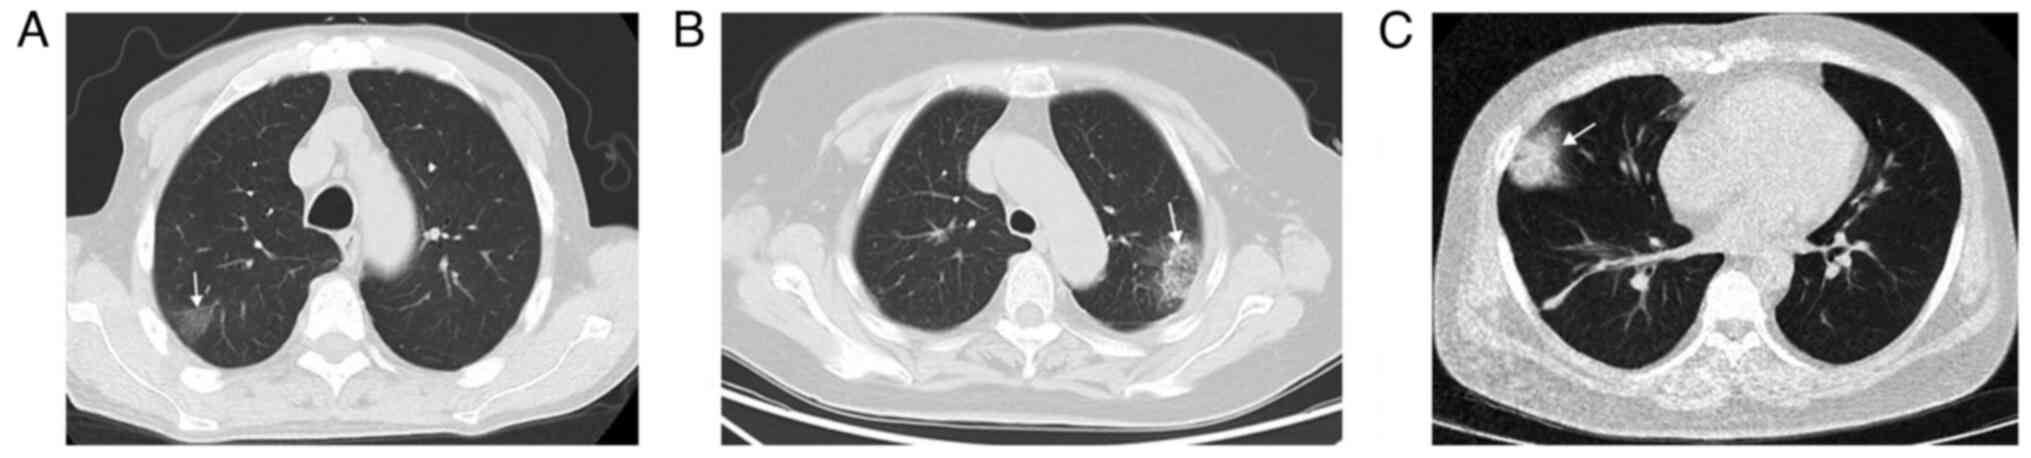
(Fig. 1). Peripheral wedge-shaped
opacity is a roughly triangular or wedge-shaped high-density area,
with a wide base attached to the pleural surface and the apex
pointing towards the hilum, which can be ground glass opacity,
mixed density, or complete solid density (14) (Fig.
2).
A radiologist with 7 years of experience reviewed
NC-CT and CTPA together (WX). If the hyperdense lumen sign on NC-CT
was confirmed as APE by CTPA, the attenuation value of the clot on
NC-CT was measured. This was completed by selecting the slice that
best displayed the high-density clot and placing a circular region
of interest (ROI) on it. The attenuation value of the blood pool
was measured by placing a circular ROI on the main pulmonary
artery, while referring to the CTPA image to avoid the area of the
clot. The area of peripheral wedge-shaped opacity was manually
circled on the lung window, which was used as ROI to measure the
average attenuation value. The average attenuation value on ROI was
recorded. The mean attenuation values between high-density clots
and the main pulmonary artery were compared, as well as the
attenuation value of peripheral wedge-shaped opacity between
patients with and without APE. The diameters of the main pulmonary
artery and ascending aorta and their ratio were measured and
compared between patients with and without APE.
Statistical analysis
Categorical data were expressed as percentage and
compared using χ2 test or Fisher's exact test.
Continuous variables were expressed as mean ± standard deviation
and a unpaired Student's t-test was performed. If continuous
variables did not conform to normal distribution, they were
expressed as median with an interquartile range and compared using
the Mann-Whitney U test. The aforementioned analysis was performed
using SPSS (version 17.0; SPSS Inc.). The receiver operating
characteristic (ROC) curve analysis was used to determine the area
under the curve (AUC) using MedCalc (version 20.019; MedCalc
Software Ltd). P<0.05 was considered to indicate a statistically
significant difference.
Results
Clinical characteristics
A total of 289 patients underwent NC-CT and CTPA
within 24 h. Of these, 16 patients were excluded due to poor image
quality (six patients) and CPE (10 patients), resulting in 273
patients (131 men and 142 women; mean age, 64.3±18.0 years, with a
range of 20-93 years) being included in the present study. The
clinical characteristics of patients with and without APE are shown
in Table I. Among the included
patients, there were 110 patients with APE and 163 patients without
APE. Among 59 patients with APE, DVT of lower limbs was present,
which was higher than that of patients without APE (P<0.001). No
in-hospital mortality was reported. Age, sex and clinical symptoms
between patients with APE and patients without APE were comparable
(P>0.05). The D-dimer of patients with APE was significantly
higher than that of patients without APE (P<0.001). When
referring to the age-adjusted D-dimer cut-off value (age x0.01
mg/l), there was a decrease of eight D-dimer positive cases for
patients >50 years old, who had no APE confirmed by CTPA. Both
C-reactive protein and N-terminal pro B-type natriuretic peptide
(NT-proBNP) were comparable between patients with APE and patients
without APE (P>0.05).
There were 49 patients with central APE and 61
patients with peripheral APE. Table
II shows that the age and sex of patients in the central and
peripheral APE groups were similar. D-dimer and NT-proBNP in
patients with central APE were significantly higher than those of
patients with peripheral APE (P<0.05).
| Table IIClinical characteristics in patients
with central and peripheral APE. |
Table II
Clinical characteristics in patients
with central and peripheral APE.
| Clinical
characteristics | Central APE
(n=49) | Peripheral APE
(n=61) | P-value |
|---|
| Age, years, mean
(SD) | 69.5 (15.3) | 61.4 (20.0) | 0.059 |
| Men, n (%) | 28 (57.1) | 26 (42.6) | 0.130 |
| Dyspnea, n (%) | 27 (55.1) | 17 (27.9) | 0.004a |
| Chest pain, n
(%) | 5 (10.2) | 20 (32.9) | 0.005a |
| Cough/sputum, n
(%) | 8 (16.3) | 12 (19.7) | 0.651 |
| Hemoptysis, n
(%) | 0 (0) | 8 (13.1) | 0.009a |
| Fever, n (%) | 5 (10.2) | 10 (16.4) | 0.347 |
| Syncope, n (%) | 5 (10.2) | 1 (1.6) | 0.123 |
| D-dimer (mg/l),
median (IQR) | 9.4 (4.4-16.1) | 3.1 (2.0-7.3) |
<0.001a |
| CRP (mg/l), median
(IQR) | 26.1
(10.2-65.3) | 24.4
(8.2-79.8) | 0.963 |
| NT-proBNP (pg/ml),
median (IQR) | 753 (205-3490) | 189 (40-956) | 0.001a |
Chest NC-CT findings and D-dimer in
patients with and without APE
Table III shows
chest NC-CT findings in patients with and without APE. The
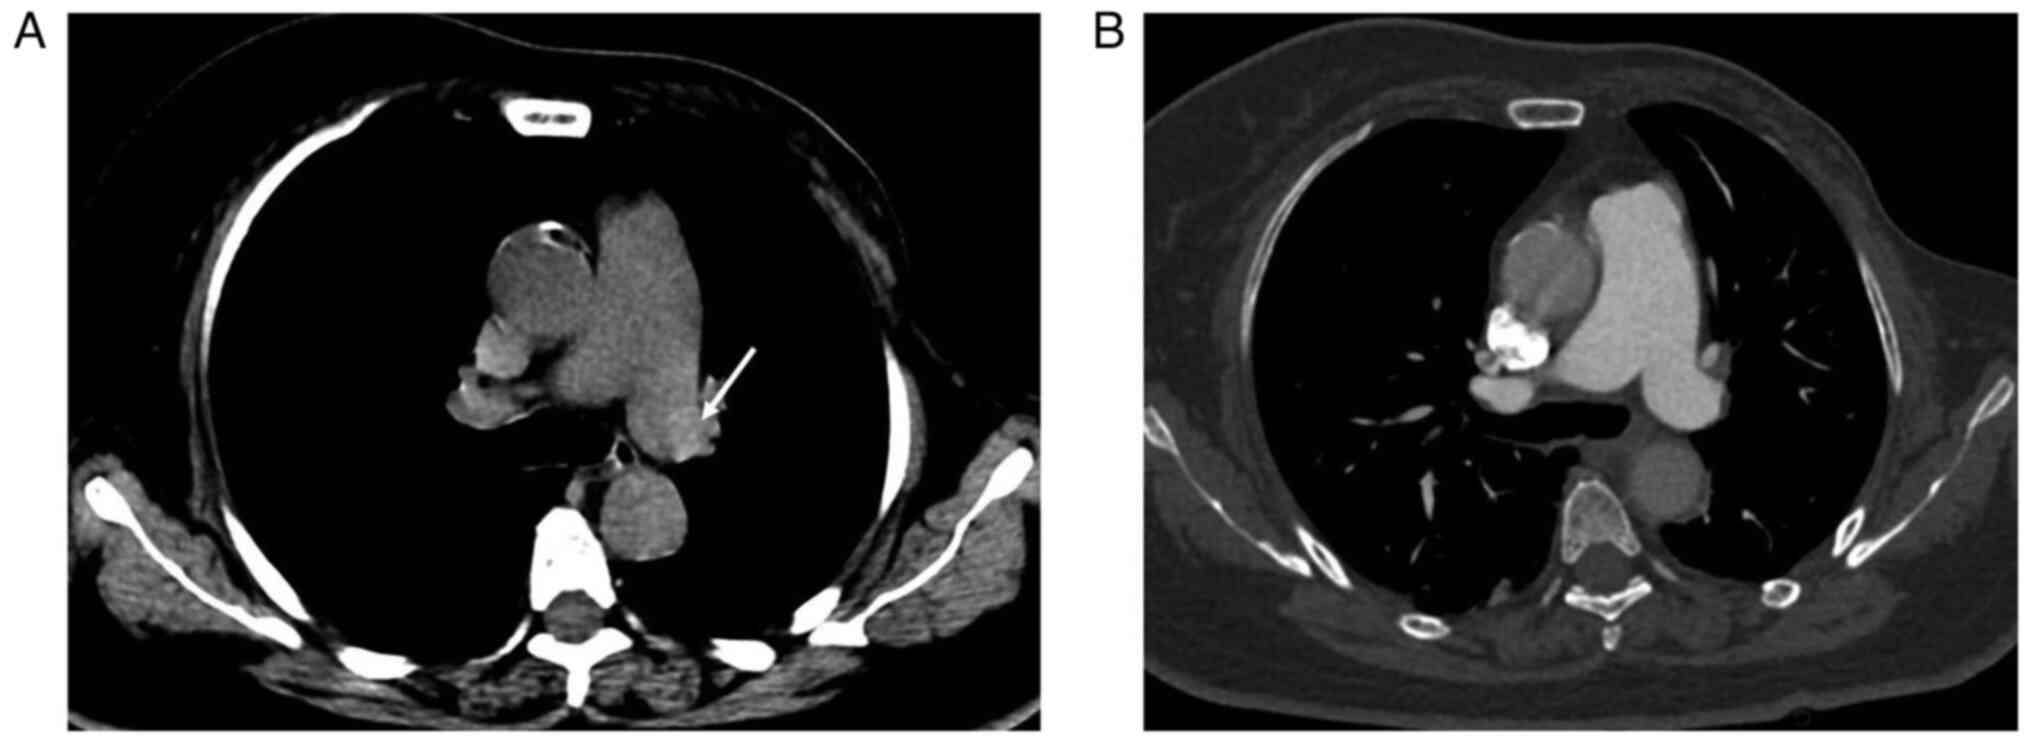
hyperdense lumen sign was found in 33/110 patients with APE on
NC-CT (Fig. 1), while the
hyperdense lumen sign was found in 4/163 patients without APE
(false positive; P<0.001; Fig.
3). Thus, the hyperdense lumen sign had a sensitivity and a
specificity of 30.0 and 97.6%, respectively, in detecting APE. The
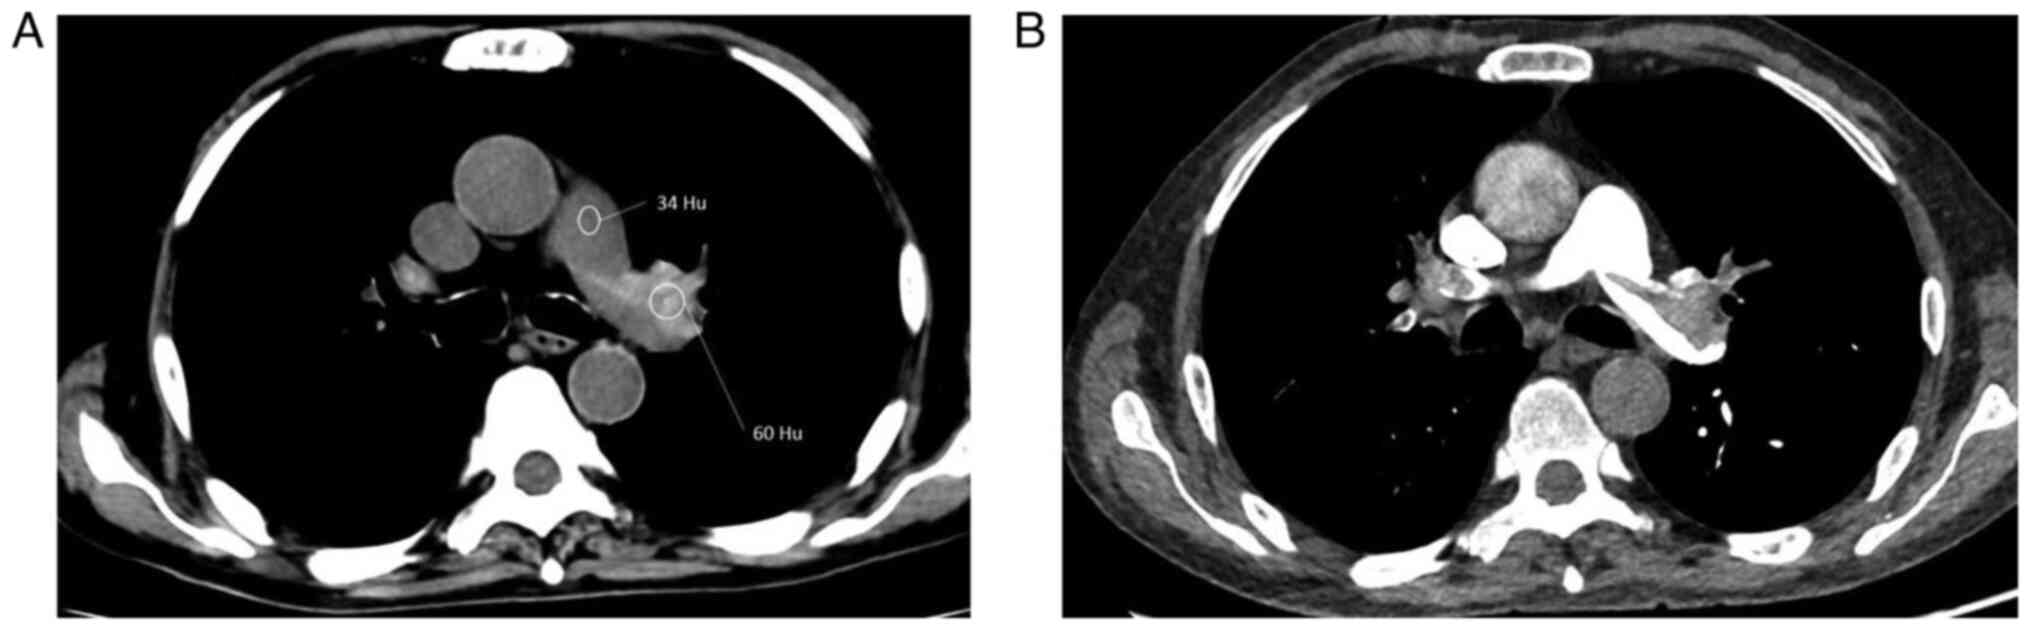
mean attenuation of high-density clots was significantly higher
than that of the main pulmonary artery (67.0±9.9 Hu vs. 37.8±6.6
Hu; P<0.001; Fig. 4). Although
the peripheral wedge-shaped opacity in 34 patients with APE (30.9%)
and 34 patients without APE (20.9%) was comparable, the mean
attenuation value of peripheral wedge-shaped opacity in patients
with APE was significantly lower than that of patients without APE
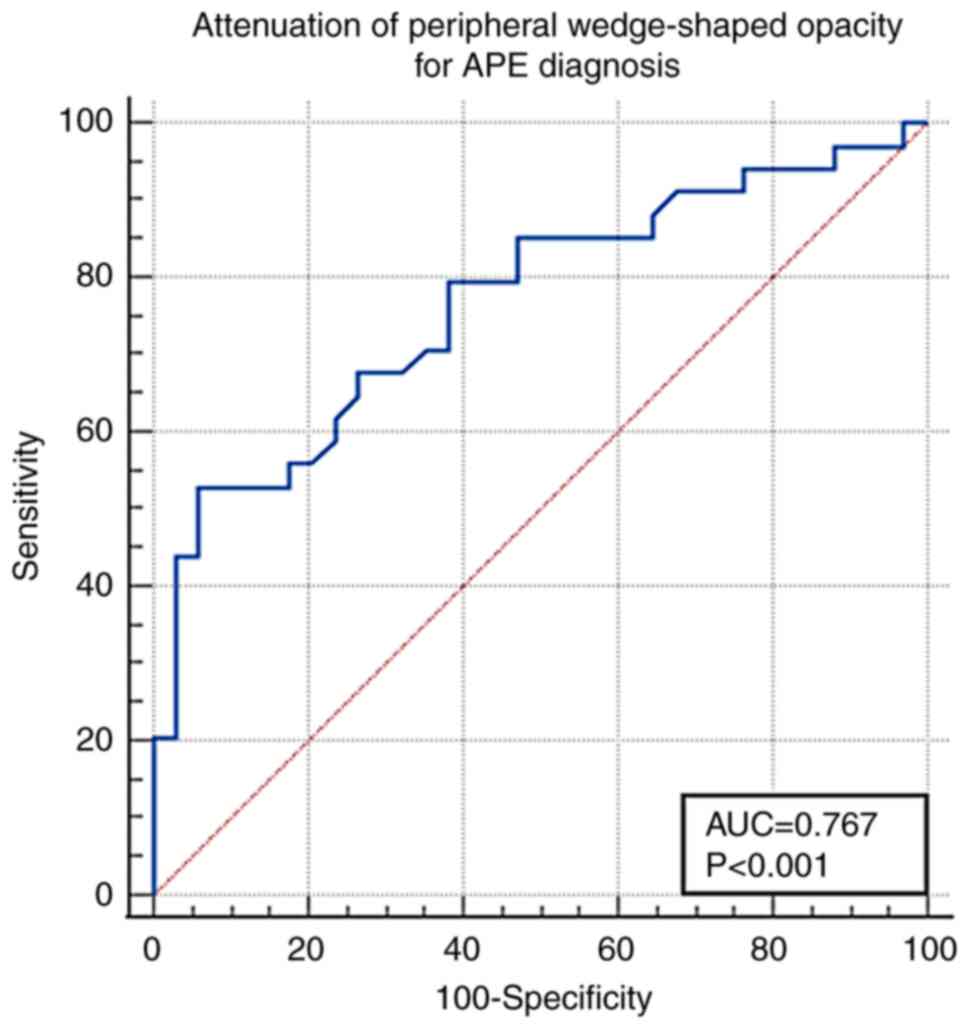
(Fig. 5). The cut-off value of the
peripheral wedge-shaped opacity attenuation for APE diagnosis was
-125 Hu [AUC, 0.767±0.058; 95% confidence interval (CI),
0.649-0.861; sensitivity, 52.9%; specificity, 94.1%; P<0.001;
Fig. 6].
| Table IIIComparison of chest NC-CT findings in
patients with and without APE. |
Table III
Comparison of chest NC-CT findings in
patients with and without APE.
| Imaging
findings | APE (n=110) | Non-APE
(n=163) | P-value |
|---|
| Hyperdense lumen
sign, n (%) | 33 (30.0) | 4 (2.5) |
<0.001a |
| Peripheral
wedge-shaped opacity, n (%) | 34 (30.9) | 34 (20.9) | 0.060 |
| Attenuation value
of peripheral wedge-shaped opacity (Hu), median (IQR) | -126.5
(-215.5-52.5) | -30.5
(-76.3-8.0) |
<0.001a |
| Mosaic attenuation,
n (%) | 12 (10.9) | 6 (3.7) | 0.018a |
| Pleural effusion, n
(%) | 25 (22.7) | 57 (35.0) | 0.030a |
| Pericardial
effusion, n (%) | 9 (8.2) | 37 (22.7) | 0.003a |
| MPAd, mm, median
(IQR) | 28.4
(25.4-32.5) | 27.7
(24.4-31.3) | 0.158 |
| AAd, mm, mean
(SD) | 33.1 (4.6) | 32.3 (4.4) | 0.213 |
| MPAd/AAd, median
(IQR) | 0.88
(0.81-0.97) | 0.86
(0.79-0.97) | 0.283 |
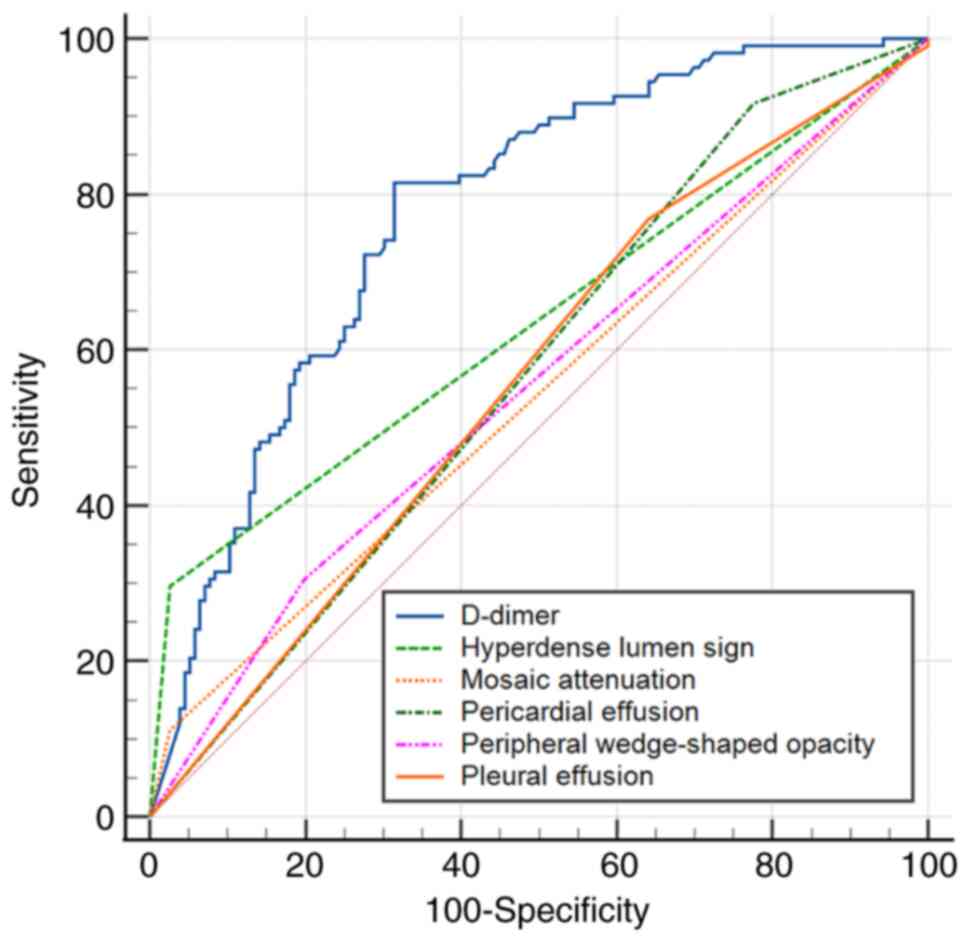
According to ROC, the cut-off value of D-dimer for
prediction of APE was 2.49 mg/l (AUC, 0.776±0.029; 95% CI,
0.721-0.825; sensitivity, 81.5%; specificity, 68.6%; P<0.001).
ROC (Fig. 7) indicated that the
AUC of the D-dimer was higher than that of the hyperdense lumen
sign (AUC, 0.635±0.023; 95% CI, 0.574-0.693), peripheral
wedge-shaped opacity (AUC, 0.549±0.036; 95% CI, 0.488-0.609),
mosaic attenuation (AUC, 0.543±0.017; 95% CI, 0.481-0.604), pleural
effusion (AUC, 0.562±0.028; 95% CI, 0.500-0.623), pericardial
effusion (AUC, 0.571±0.021; 95% CI, 0.508-0.631) in the diagnosis
of APE.
Chest NC-CT findings and D-dimer in
central and peripheral APE
Chest NC-CT findings in patients with central and
peripheral APE are shown in Table
IV, indicating that the frequency of hyperdense lumen sign in
central APE was higher than in peripheral APE (P<0.001), but
other CT findings revealed no statistical difference between the
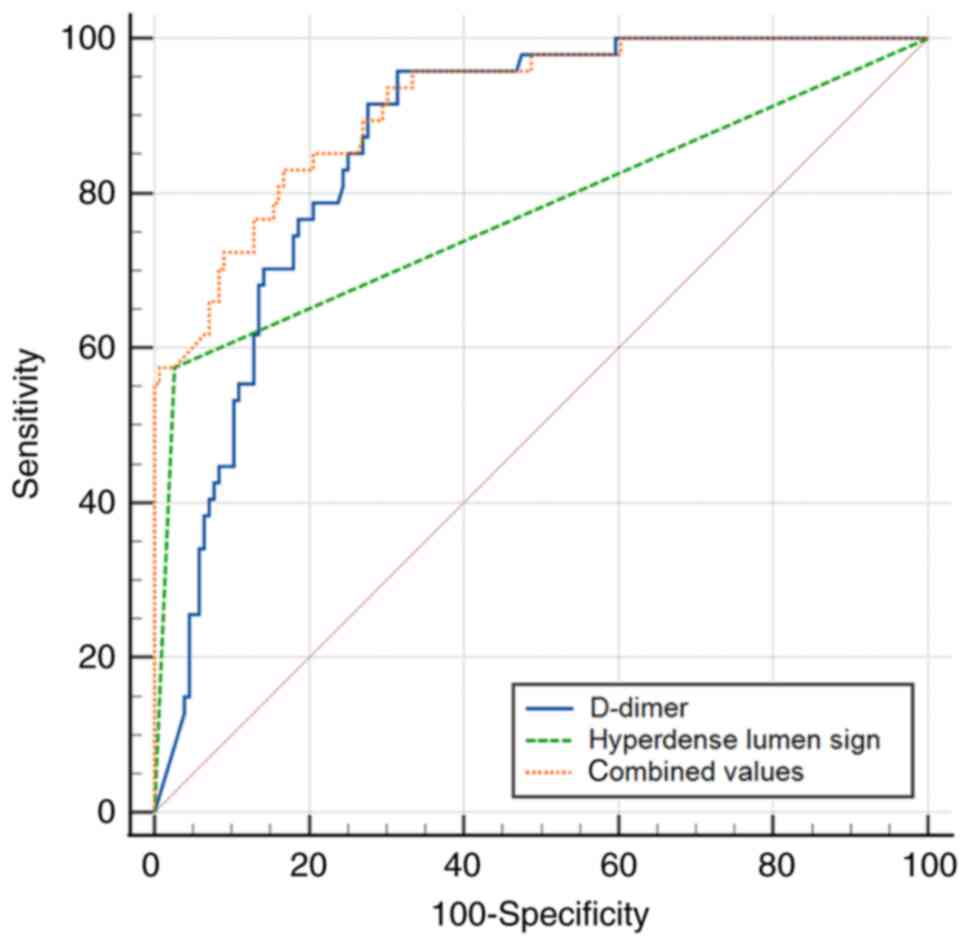
two groups. Table V indicated that
28 patients with central APE and five patients with peripheral APE
showed hyperdense lumen sign. The sensitivity and specificity of
the hyperdense lumen sign in detecting central APE were 57.1 and
97.6%, respectively, while they were 8.2 and 97.6%, respectively,
in detecting peripheral APE. Furthermore, the AUC of the
combination of the hyperdense lumen sign and D-dimer (AUC,
0.915±0.022; 95% CI, 0.868-0.950; sensitivity, 83.0%; specificity,
83.3%, P<0.001) was higher than either of them (Fig. 8) in detecting central APE.
| Table IVChest NC-CT findings in patients with
central and peripheral APE. |
Table IV
Chest NC-CT findings in patients with
central and peripheral APE.
| Imaging findings on
NC-CT | Central APE
(n=49) | Peripheral APE
(n=61) | P-value |
|---|
| Hyperdense lumen
sign, n (%) | 28 (57.1) | 5 (8.2) |
<0.001a |
| Mosaic attenuation,
n (%) | 7 (14.3) | 5 (8.2) | 0.309 |
| Peripheral
wedge-shaped opacity, n (%) | 14 (28.6) | 19 (31.1) | 0.769 |
| Pleural effusion, n
(%) | 8 (16.3) | 17 (27.9) | 0.151 |
| Pericardial
effusion, n (%) | 4 (8.2) | 5 (8.2) | 0.995 |
| MPAd, mm, median
(IQR) | 29.4
(26.4-33.0) | 27.0
(24.6-32.0) | 0.074 |
| AAd, mm, mean
(SD) | 33.6 (4.3) | 32.6 (4.8) | 0.283 |
| MPAd/AAd, mean
(SD) | 0.91 (0.15) | 0.88 (0.12) | 0.283 |
| Table VComparison of non-contrasted CT
findings and D-dimer in diagnosis of central APE and peripheral
APE. |
Table V
Comparison of non-contrasted CT
findings and D-dimer in diagnosis of central APE and peripheral
APE.
| APE type | Sign | AUC (95% CI) | Sensitivity
(%) | Specificity
(%) | Youden index | P-value |
|---|
| Central APE | Hyperdense lumen
sign | 0.702±0.036
(0.636-0.763) | 57.1 | 97.6 | 0.404 |
<0.001a |
| | Peripheral wedge-
shaped opacity | 0.535±0.036
(0.466-0.604) | 28.6 | 79.8 | 0.083 | 0.324 |
| | Mosaic
attenuation | 0.553±0.026
(0.483-0.621) | 14.3 | 96.3 | 0.106 | 0.044a |
| | Pleural
effusion | 0.596±0.033
(0.527-0.663) | 83.7 | 35.6 | 0.193 | 0.003a |
| | Pericardial
effusion | 0.573±0.026
(0.503-0.640) | 91.8 | 22.7 | 0.145 | 0.005a |
| | D-dimer (mg/l) | 0.863±0.026
(0.808-0.908) | 95.7 | 68.6 | 0.643 |
<0.001a |
| Peripheral APE | Hyperdense lumen
sign | 0.529±0.019
(0.461-0.596) | 8.2 | 97.6 | 0.057 | 0.125 |
| | Peripheral wedge-
shaped opacity | 0.554±0.034
(0.487-0.620) | 31.2 | 79.8 | 0.109 | 0.112 |
| | Mosaic
attenuation | 0.523±0.019
(0.455-0.590) | 8.2 | 96.3 | 0.045 | 0.239 |
| | Pleural
effusion | 0.536±0.035
(0.468-0.602) | 72.1 | 35.6 | 0.077 | 0.308 |
| | Pericardial
effusion | 0.573±0.024
(0.505-0.638) | 91.8 | 22.7 | 0.145 | 0.003a |
| | D-dimer(mg/l) | 0.708±0.037
(0.643-0.768) | 70.5 | 68.6 | 0.391 |
<0.001a |
Discussion
In the present study, the value of NC-CT in the
diagnosis of APE was evaluated, and the following findings were
reported: i) The hyperdense lumen sign had a sensitivity of 30.0%
and specificity of 97.6% in detecting APE; ii) the sensitivity and
specificity of the hyperdense lumen sign in detecting central APE
were 57.1 and 97.6%, respectively, while these were 8.2 and 97.6%
in detecting peripheral APE; the hyperdense lumen sign was found to
be a valuable diagnostic indicator for central APE, whereas it may
not be useful for diagnosing peripheral APE; iii) although the
peripheral wedge-shaped opacity on NC-CT was comparable between
patients with and without APE, the mean attenuation value of
peripheral wedge-shaped opacity in patients with APE was
significantly lower than that of patients without APE; and iv) the
age-adjusted D-dimer had higher specificity in excluding APE.
APE is one of most frequent acute cardiovascular
diseases (15). Identifying the
predisposing factors is important in the assessment of patients
with suspected APE. However, the predisposing factors were
comparable between patients with and without APE in the present
study, except DVT of lower limbs.
For the diagnosis of APE using NC-CT, the
effectiveness of the hyperdense lumen sign as an indicator has been
the subject of various studies. Tatco et al (10) reported an overall sensitivity and
specificity of the hyperdense lumen sign in detecting APE of 36 and
99%, respectively. By contrast, Ehsanbakhsh et al (13) reported a sensitivity of 42.5% and a
specificity of 98.6% of the hyperdense lumen sign in detecting APE.
However, Chien et al (16),
found that the sensitivity of NC-CT for diagnosis of central APE
was 72.9%, which is markedly higher than the results observed in
the present study. These discrepancies across different studies can
be attributed primarily to variations in sample sizes and the
inclusion criteria used. It is noteworthy that most existing
studies have concentrated on central APE, with only a limited
number of studies providing a comprehensive analysis that includes
both central and peripheral APE (10,13).
This divergence in focus and methodology underscores the complexity
of accurately diagnosing APE and highlights the need for further
research that encompasses a broader spectrum of APE manifestations.
The value of the hyperdense lumen sign in both central and
peripheral APE was first assessed. The sensitivity of the
hyperdense lumen sign in detecting peripheral APE was only 8.2% in
the current study. Calcified lymph nodes around the hilar are
particularly prone to cause the false hyperdense lumen sign. The
hyperdense lumen sign in the peripheral pulmonary artery is
affected by partial volume averaging, motion artifact and image
noise, resulting in a decline in the accuracy of the assessment.
Consequently, the hyperdense lumen sign on NC-CT is a valuable
indicator for central APE, however, its usefulness in detecting
peripheral APE is limited. Moreover, when the hyperdense lumen sign
and the D-dimer were combined, the diagnostic performance of
detecting central APE was substantially improved. This finding
indicates that patients presenting with hyperdense lumen sign in
the central pulmonary artery may not require further CTPA
examination.
The hyperdense lumen sign depends on the density
contrast between thrombus and blood. The findings of the present
study revealed that high-density clots within the main pulmonary
artery exhibited a mean attenuation value significantly greater
than that of blood, aligning with the observations made by Kanne
et al (9) who provided a
benchmark attenuation value for acute thrombosis. However, the
density of the clots is determined by their composition, mainly
including red blood cells and fibrin. When the thrombus contracts,
the water in it will decrease, which concentrates hemoglobin and
increases the attenuation value of the clot (16). With the degradation of red blood
cells and fibrin in the embolus, the density of the clot will
gradually decrease (17). The
average attenuation value of acute emboli <8 days old was ~66 Hu
on NC-CT, whereas those >8 days old had a lower attenuation of
55 Hu (18). Hematocrit is also an
important factor that affects the density of embolus and blood pool
(19). These factors collectively
contribute to the low sensitivity of the hyperdense lumen sign in
detecting central APE. The dynamic changes in emboli density over
time, influenced by their composition and the physiological
processes of contraction and degradation, present challenges in the
consistent detection of APE using the hyperdense lumen sign.
Understanding these intricacies is essential for interpreting NC-CT
images accurately and improving the diagnostic approach for
APE.
Among other CT abnormalities, peripheral
wedge-shaped opacity is frequently reported in APE. This is
considered to represent pulmonary infarction (20). In pulmonary infarction, the density
of the peripheral wedge-shaped opacity is often a mixture of ground
glass opacity and consolidation, and central lucencies are often
observed (21). However,
peripheral wedge-shaped opacity is not specific for diagnosing
pulmonary infarction as it can also be seen in pneumonia, tumors,
or other diseases. The current study found that the frequency of
peripheral wedge-shaped opacity between patients with and without
APE was similar, however, the mean attenuation value of peripheral
wedge-shaped opacity in patients with APE was significantly lower
than that in patients without APE. The peripheral wedge-shaped
opacity cut-off value for APE was -125 Hu (AUC, 0.767), with high
specificity. Thus, the peripheral wedge-shaped opacity in a mixture
of ground glass opacity and consolidation indicated the pulmonary
infarction which requires further CTPA confirmation. Mosaic
attenuation, pleural effusion and pericardial effusion are not
sufficient to distinguish APE from other diseases.
Previous studies have found that the increase of
D-dimer is closely associated with APE (22,23).
The current study also found that the D-dimer of patients with APE
was higher than that of patients without APE. Moreover, the D-dimer
of patients with central APE was also higher than that of patients
with peripheral APE. A large multinational study showed that
age-adjusted D-dimer had higher specificity in excluding APE
(24). In the current study,
D-dimer positive cases decreased according to the age-adjusted
D-dimer which minimized the need for CTPA, thereby decreasing
radiation exposure and complications associated with contrast
agents. Furthermore, when the hyperdense lumen sign and the D-dimer
were combined, the diagnostic performance for detecting central APE
was substantially improved. This finding indicated that patients
with the hyperdense lumen sign in central pulmonary artery and
increased D-dimer may not require further CTPA examination.
Compared with previous studies (9,10,13,17),
the present study provided a comprehensive evaluation of the value
of chest NC-CT in detecting APE, which included not only the
assessment of central APE but also peripheral APE, offering a more
complete analysis of the condition. It was found that combining the
hyperdense lumen sign with D-dimer levels improved the diagnostic
performance for detecting central APE, which was a novel approach
not widely explored in previous studies.
Although the current study included a relatively
large number of cases, there are some limitations. Since this is a
single-center retrospective study, a thinner slice thickness on
NC-CT cannot be obtained and only 5-mm-thick slices were used to
evaluate the hyperdense lumen sign, so hyperdense lumen sign in
peripheral APE must be underestimated. Magnetic resonance imaging
(MRI) has emerged as a valuable alternative to CTPA in the
evaluation of APE, particularly in patients with contraindications
to iodinated contrast or in pregnant or young patients (25). In a future study, the bright-blood
static steady-state free precession sequences in the diagnosis of
APE will be analyzed. Artificial Intelligence has been applied to
disease diagnosis based on CT or MRI. A deep learning model may be
developed for predicting APE based on NC-CT and clinical data in a
future study.
Although chest NC-CT cannot replace CTPA in
diagnosing APE, the hyperdense lumen sign had high specificity in
diagnosis of central APE. Patients with this sign on NC-CT and the
increased D-dimer may not require further CTPA. The lower
attenuation value of peripheral wedge-shaped opacity on NC-CT
strongly suggested APE and required CTPA confirmation. Age-adjusted
D-dimer had higher specificity in excluding APE.
Acknowledgements
Not applicable.
Funding
Funding: The present study was supported by the CAMS Innovation
Fund for Medical Sciences (grant no. 2022-I2M-C&T-B-109), the
National Natural Science Foundation of China (grant no. 82272081)
and the Medical and Health Science and Technology Innovation
Project of the Chinese Academy of Medical Science (grant no.
2021-I2M-1-049).
Availability of data and materials
The data generated in the present study may be
requested from the corresponding author.
Authors' contributions
ML participated in the research design. RG, MD, LX,
SZ and WX performed the experiments and collected data. RG, MD, LX
and SZ analyzed the data and were major contributors in writing the
manuscript. RG, MD, SZ, WX and ML confirm the authenticity of all
of the raw data. All authors read and approved the final
manuscript.
Ethics approval and consent to
participate
The present single-center, retrospective cohort
study was performed according to the Declaration of Helsinki and
was approved by the Ethics Committee of China-Japan Friendship
Hospital (approval no. 2022-KY-048). Informed consent was
waived.
Patient consent for publication
Not applicable.
Competing interests
The authors declare that they have no competing
interests.
References
|
1
|
Raskob GE, Angchaisuksiri P, Blanco AN,
Buller H, Gallus A, Hunt BJ, Hylek EM, Kakkar A, Konstantinides SV,
McCumber M, et al: Thrombosis: A major contributor to global
disease burden. Arterioscler Thromb Vasc Biol. 34:2363–2371.
2014.PubMed/NCBI View Article : Google Scholar
|
|
2
|
Wendelboe AM and Raskob GE: Global burden
of thrombosis: Epidemiologic aspects. Circ Res. 118:1340–1347.
2016.PubMed/NCBI View Article : Google Scholar
|
|
3
|
Anderson FA Jr and Spencer FA: Risk
factors for venous thromboembolism. Circulation. 107 (Suppl
1):I9–I16. 2003.PubMed/NCBI View Article : Google Scholar
|
|
4
|
Chew HK, Wun T, Harvey D, Zhou H and White
RH: Incidence of venous thromboembolism and its effect on survival
among patients with common cancers. Arch Intern Med. 166:458–464.
2006.PubMed/NCBI View Article : Google Scholar
|
|
5
|
Pollack CV, Schreiber D, Goldhaber SZ,
Slattery D, Fanikos J, O'Neil BJ, Thompson JR, Hiestand B, Briese
BA, Pendleton RC, et al: Clinical characteristics, management, and
outcomes of patients diagnosed with acute pulmonary embolism in the
emergency department: Initial report of EMPEROR (multicenter
emergency medicine pulmonary embolism in the real world registry).
J Am Coll Cardiol. 57:700–706. 2011.PubMed/NCBI View Article : Google Scholar
|
|
6
|
Raja AS, Greenberg JO, Qaseem A, Denberg
TD, Fitterman N and Schuur JD: Clinical Guidelines Committee of the
American College of Physicians. Evaluation of Patients With
Suspected Acute Pulmonary Embolism: Best practice advice from the
clinical guidelines committee of the American college of
physicians. Ann Intern Med. 163:701–711. 2015.PubMed/NCBI View
Article : Google Scholar
|
|
7
|
Stein PD, Fowler SE, Goodman LR,
Gottschalk A, Hales CA, Hull RD, Leeper KV Jr, Popovich J Jr, Quinn
DA, Sos TA, et al: Multidetector computed tomography for acute
pulmonary embolism. N Engl J Med. 354:2317–2327. 2006.PubMed/NCBI View Article : Google Scholar
|
|
8
|
Hou DJ, Tso DK, Davison C, Inacio J, Louis
LJ, Nicolaou S and Reimann AJ: Clinical utility of ultra high pitch
dual source thoracic CT imaging of acute pulmonary embolism in the
emergency department: Are we one step closer towards a non-gated
triple rule out? Eur J Radiol. 82:1793–1798. 2013.PubMed/NCBI View Article : Google Scholar
|
|
9
|
Kanne JP, Gotway MB, Thoongsuwan N and
Stern EJ: Six cases of acute central pulmonary embolism revealed on
unenhanced multidetector CT of the chest. AJR Am J Roentgenol.
180:1661–1664. 2003.PubMed/NCBI View Article : Google Scholar
|
|
10
|
Tatco VR and Piedad HH: The validity of
hyperdense lumen sign in non-contrast chest CT scans in the
detection of pulmonary thromboembolism. Int J Cardiovasc Imaging.
27:433–440. 2011.PubMed/NCBI View Article : Google Scholar
|
|
11
|
Roncon L, Zuin M, Barco S, Valerio L,
Zuliani G, Zonzin P and Konstantinides SV: Incidence of acute
pulmonary embolism in COVID-19 patients: Systematic review and
meta-analysis. Eur J Intern Med. 82:29–37. 2020.PubMed/NCBI View Article : Google Scholar
|
|
12
|
de Monyé W, van Strijen MJ, Huisman MV,
Kieft GJ and Pattynama PM: Suspected pulmonary embolism: Prevalence
and anatomic distribution in 487 consecutive patients. Advances in
new technologies evaluating the localisation of pulmonary embolism
(ANTELOPE) group. Radiology. 215:184–188. 2000.PubMed/NCBI View Article : Google Scholar
|
|
13
|
Ehsanbakhsh A, Hatami F, Valizadeh N,
Khorashadizadeh N and Norouzirad F: Evaluating the performance of
unenhanced computed tomography in the diagnosis of pulmonary
embolism. J Tehran Heart Cent. 16:156–161. 2021.PubMed/NCBI View Article : Google Scholar
|
|
14
|
Shah AA, Davis SD, Gamsu G and Intriere L:
Parenchymal and pleural findings in patients with and patients
without acute pulmonary embolism detected at spiral CT. Radiology.
211:147–153. 1999.PubMed/NCBI View Article : Google Scholar
|
|
15
|
Duffett L, Castellucci LA and Forgie MA:
Pulmonary embolism: Update on management and controversies. BMJ.
370(m2177)2020.PubMed/NCBI View Article : Google Scholar
|
|
16
|
Chien CH, Shih FC, Chen CY, Chen CH, Wu WL
and Mak CW: Unenhanced multidetector computed tomography findings
in acute central pulmonary embolism. BMC Med Imaging.
19(65)2019.PubMed/NCBI View Article : Google Scholar
|
|
17
|
Cobelli R, Zompatori M, Bresciani P and De
Luca G: Visualization of hypoattenuation clots on unenhanced CT of
the thorax. AJR Am J Roentgenol. 182:530–531. 2004.PubMed/NCBI View Article : Google Scholar
|
|
18
|
Yankelevitz DF, Gamsu G, Shah A, Rademaker
J, Shaham D, Buckshee N, Cham MD and Henschke CI: Optimization of
combined CT pulmonary angiography with lower extremity CT
venography. AJR Am J Roentgenol. 174:67–69. 2000.PubMed/NCBI View Article : Google Scholar
|
|
19
|
Foster M, Nolan RL and Lam M: Prediction
of anemia on unenhanced computed tomography of the thorax. Can
Assoc Radiol J. 54:26–30. 2003.PubMed/NCBI
|
|
20
|
Kaptein FHJ, Kroft LJM, Hammerschlag G,
Ninaber MK, Bauer MP, Huisman MV and Klok FA: Pulmonary infarction
in acute pulmonary embolism. Thromb Res. 202:162–169.
2021.PubMed/NCBI View Article : Google Scholar
|
|
21
|
Revel MP, Triki R, Chatellier G, Couchon
S, Haddad N, Hernigou A, Danel C and Frija G: Is it possible to
recognize pulmonary infarction on multisection CT images?
Radiology. 244:875–882. 2007.PubMed/NCBI View Article : Google Scholar
|
|
22
|
Kline JA, Hogg MM, Courtney DM, Miller CD,
Jones AE and Smithline HA: D-dimer threshold increase with pretest
probability unlikely for pulmonary embolism to decrease unnecessary
computerized tomographic pulmonary angiography. J Thromb Haemost.
10:572–581. 2012.PubMed/NCBI View Article : Google Scholar
|
|
23
|
Riley RS, Gilbert AR, Dalton JB, Pai S and
McPherson RA: Widely used types and clinical applications of
D-Dimer assay. Lab Med. 47:90–102. 2016.PubMed/NCBI View Article : Google Scholar
|
|
24
|
Righini M, Van Es J, Den Exter PL, Roy PM,
Verschuren F, Ghuysen A, Rutschmann OT, Sanchez O, Jaffrelot M,
Trinh-Duc A, et al: Age-adjusted D-dimer cutoff levels to rule out
pulmonary embolism: The ADJUST-PE study. JAMA. 311:1117–1124.
2014.PubMed/NCBI View Article : Google Scholar
|
|
25
|
Kalb B, Sharma P, Tigges S, Ray GL,
Kitajima HD, Costello JR, Chen Z and Martin DR: MR imaging of
pulmonary embolism: Diagnostic accuracy of contrast-enhanced 3D MR
pulmonary angiography, contrast-enhanced low-flip angle 3D GRE, and
nonenhanced free-induction FISP sequences. Radiology. 263:271–278.
2012.PubMed/NCBI View Article : Google Scholar
|