Introduction
Gastroenteropancreatic neuroendocrine neoplasms
(GEP-NENs) are a heterogeneous group of tumours that originate from
neuroendocrine cells within the gastrointestinal tract and
pancreas, which possess hormone-secreting functions (1). Within the gastrointestinal tract,
these cells are responsible for the secretion of digestive hormones
such as gastrin, glucagon and secretin. In the pancreas, the
endocrine cell population includes islet cells (such as α-cells and
β-cells), which produce hormones, such as insulin and glucagon
(2). In the 5th Edition of the
World Health Organization (WHO) classification of digestive system
tumours published in 2019(3),
GEP-NENs were classified as well-differentiated neuroendocrine
tumours (NET) grade 1 (NET G1), NET grade 2 (NET G2) and poorly
differentiated neuroendocrine carcinoma (NEC), with a high-grade
designation defined by a Ki-67 proliferation index of >20% and a
mitotic count of >20 per 2 mm2. This classification
system further stratified GEP-NENs into low-grade (LG) NENs,
including NET G1 and NET G2, and high-grade (HG) NENs, including
NET grade 3 (NET G3) and NEC. In the HG group, NET G3 (previously
referred to as ‘high-proliferative NET’) are classified as
well-differentiated neoplasms exhibiting morphological features
similar to LG NET, but with a Ki-67 proliferation index of >20%
(typically <55%). By contrast, NEC is characterised as a poorly
differentiated, high-grade malignancy composed of either small or
large cells, including small cell NEC (SCNEC) and large-cell NEC
(LCNEC).
Further subclassification of NET G3 or NEC with a
Ki-67 proliferation index of >20% may be necessary (4-6).
Notable differences in biological behaviour, treatment approaches
and prognosis have been observed between NET G3 subgroups with
Ki-67 index values of 20-55% and those with >55%. For instance,
the subgroup with a Ki-67 >55% is associated with significantly
shorter median overall survival time and typically requires
platinum-based chemotherapy, unlike the subgroup with a Ki-67 of
20-55%, which is managed with systemic non-platinum regimens
(5-8).
Despite the existence of well-defined criteria, HG-NENs exhibit
substantial heterogeneity owing to the distinct pathological and
molecular characteristics. These molecular differences, which are
explored in the following section, fundamentally underpin the
pathological distinction between well-differentiated NET G3 and
poorly differentiated NEC (9-11).
These histological subtypes vary considerably in epidemiology,
treatment strategies and clinical outcomes, reflecting their
diverse biological behaviours (3).
Advances in tumour immunology and molecular pathology have led to
the development of novel therapeutic approaches for HG-GEP NENs,
including molecular targeted therapies and immune checkpoint
inhibitors, such as programmed cell death protein 1 inhibitors
(12). However, the selection and
evaluation of appropriate treatment options require a comprehensive
assessment of multiple factors, such as tumour grade and stage,
cellular differentiation, primary tumour site, Ki-67 proliferation
index, molecular and immunohistochemical markers and NEC
subtype.
Advancements in molecular pathology have indicated
that HG-NENs have distinct molecular pathogenic mechanisms.
Whole-genome studies have identified at least four functional
pathways implicated in the molecular alterations of pancreatic NET:
DNA damage repair (involving genes such as MUTYH, CHEK2 and
BRCA2), chromatin remodelling (including ARID1A and
SMARCA4), telomere maintenance (notably DAXX and
ATRX genes) and the PI3K/mechanistic target of rapamycin
signalling pathway (involving EWSR fusion, PTEN and
HIF1/2) (10,11,13,14).
In rectal NET, recurrent mutations have been reported in genes such
as TP53, PTEN, CDKN2A, FBXW7 and
AKT1, with the mutational burden shown to increase with
tumour grade. However, the specific roles of the Ras/Raf/MAPK and
PI3K/AKT pathways in the pathogenesis of rectal NET remain unclear
(14-16).
Conversely, NEC exhibit entirely different molecular profiles from
GEP-NET. The most frequently altered genes in GEP-NEC include
TP53, RB1, KRAS, BRAF and APC.
In GEP-NET, RB1 mutations are absent (14,17,18).
While recurrent TP53 mutations have been identified in
certain subtypes, such as rectal NET, they remain uncommon across
the broader spectrum of GEP-NET; when present outside the rectum,
they are typically confined to a subset of NET G3(16).
CHEK1 is a crucial protein-coding gene in the
human genome (19). CHEK1
functions as a key regulatory factor involved in cell cycle
control, DNA damage repair and apoptosis inhibition (19-21);
this is essential for proper cell division and the maintenance of
genomic stability. The CHEK1-encoded protein belongs to the
protein kinase family and primarily monitors and facilitates DNA
damage repair within cells. CHEK1 has been implicated in
various malignancies (20-22),
including colorectal cancer (23),
multiple myeloma (24),
hepatocellular carcinoma (25),
lung adenocarcinoma (26) and lung
squamous cell carcinoma (27).
CHEK1 exhibits a dual role in tumour progression: While it
functions as a tumour suppressor in normal physiology by
safeguarding genomic integrity, it is paradoxically co-opted in the
neoplastic state to promote cell survival and induce therapy
resistance. Aberrant activation or overexpression of CHEK1
can suppress apoptosis and promote DNA repair, thereby enhancing
tumour cell survival and increasing resistance to therapeutic
interventions (19,20).
Over the years, CHEK1 has received
considerable attention in the field of tumour biology and the
development of therapeutic strategies, emerging as a potential
therapeutic target (21,22,28,29).
Several CHEK1-targeted inhibitors have been developed,
including SRA737(28), MK-8776
(VX-970) (29), LY2603618(21), AZD7762(30) and LY2606368(27). These inhibitors disrupt the tumour
cell cycle, thereby suppressing tumour cell proliferation, and have
been experimentally validated in various malignancies.
Specifically, LY2606368, AZD7762 and SRA737 have demonstrated
efficacy in preclinical models of gastrointestinal tumours,
including colorectal cancer, pancreatic cancer, GEP-NENs and small
cell lung cancer. Additionally, MK-8776 (VX-970), LY2603618 and
AZD7762 have demonstrated therapeutic potential in in vitro
and in vivo models of digestive system tumours (21,27-30).
The ability of CHEK1 inhibitors to effectively suppress
tumour cell growth and migration underscores their potential as
viable therapeutic agents.
Despite its well-established role in various
malignancies, the involvement of CHEK1 in HG-GEP NENs
remains largely uncharacterised. Previous studies have highlighted
the dual role of CHEK1 in tumourigenesis. The same
mechanism, CHEK1-mediated cell-cycle arrest, serves opposite
purposes. In normal cells it functions as a tumour-suppressive
process that preserves genomic integrity by permitting DNA repair,
whereas in cancer cells it is co-opted as a pro-survival mechanism
that enables tumour cells to withstand replication stress or
therapeutic pressure (19,21). Given the dual role of CHEK1
as a key regulatory protein downstream of MEK/ERK signalling
(31) and as a central effector of
the DNA-damage response (19), the
CHEK1 overexpression observed in NEC, an attribute
correlated with aggressive behaviour, supports its potential
utility as a molecular biomarker for subtyping HG-GEP NENs
(12).
The present study aimed to elucidate the clinical
and biological significance of CHEK1 in HG-GEP NENs, using a
combination of public transcriptomic data [Gene Expression Omnibus
(GEO): GSE211485] and an institutional cohort of 38 patient-derived
formalin-fixed paraffin-embedded (FFPE) tissue samples.
Differentially expressed genes (DEGs) were initially identified
through transcriptomic analysis, followed by validation of
CHEK1 expression in tumour tissue samples. An overview of
the study workflow is illustrated in Fig. 1A. Furthermore, the potential role
of CHEK1 in the pathogenesis and progression of HG-GEP NENs
was explored through associations with histological subtypes and
clinicopathological parameters. The specific objectives of the
present study were to: i) Determine the differential expression of
CHEK1 among histologically distinct HG-GEP NENs subtypes;
ii) explore its potential contribution to tumour biology; iii)
assess its diagnostic and prognostic utility; and iv) provide a
rationale for the future development of CHEK1-targeted
therapeutic strategies in this rare but aggressive disease.
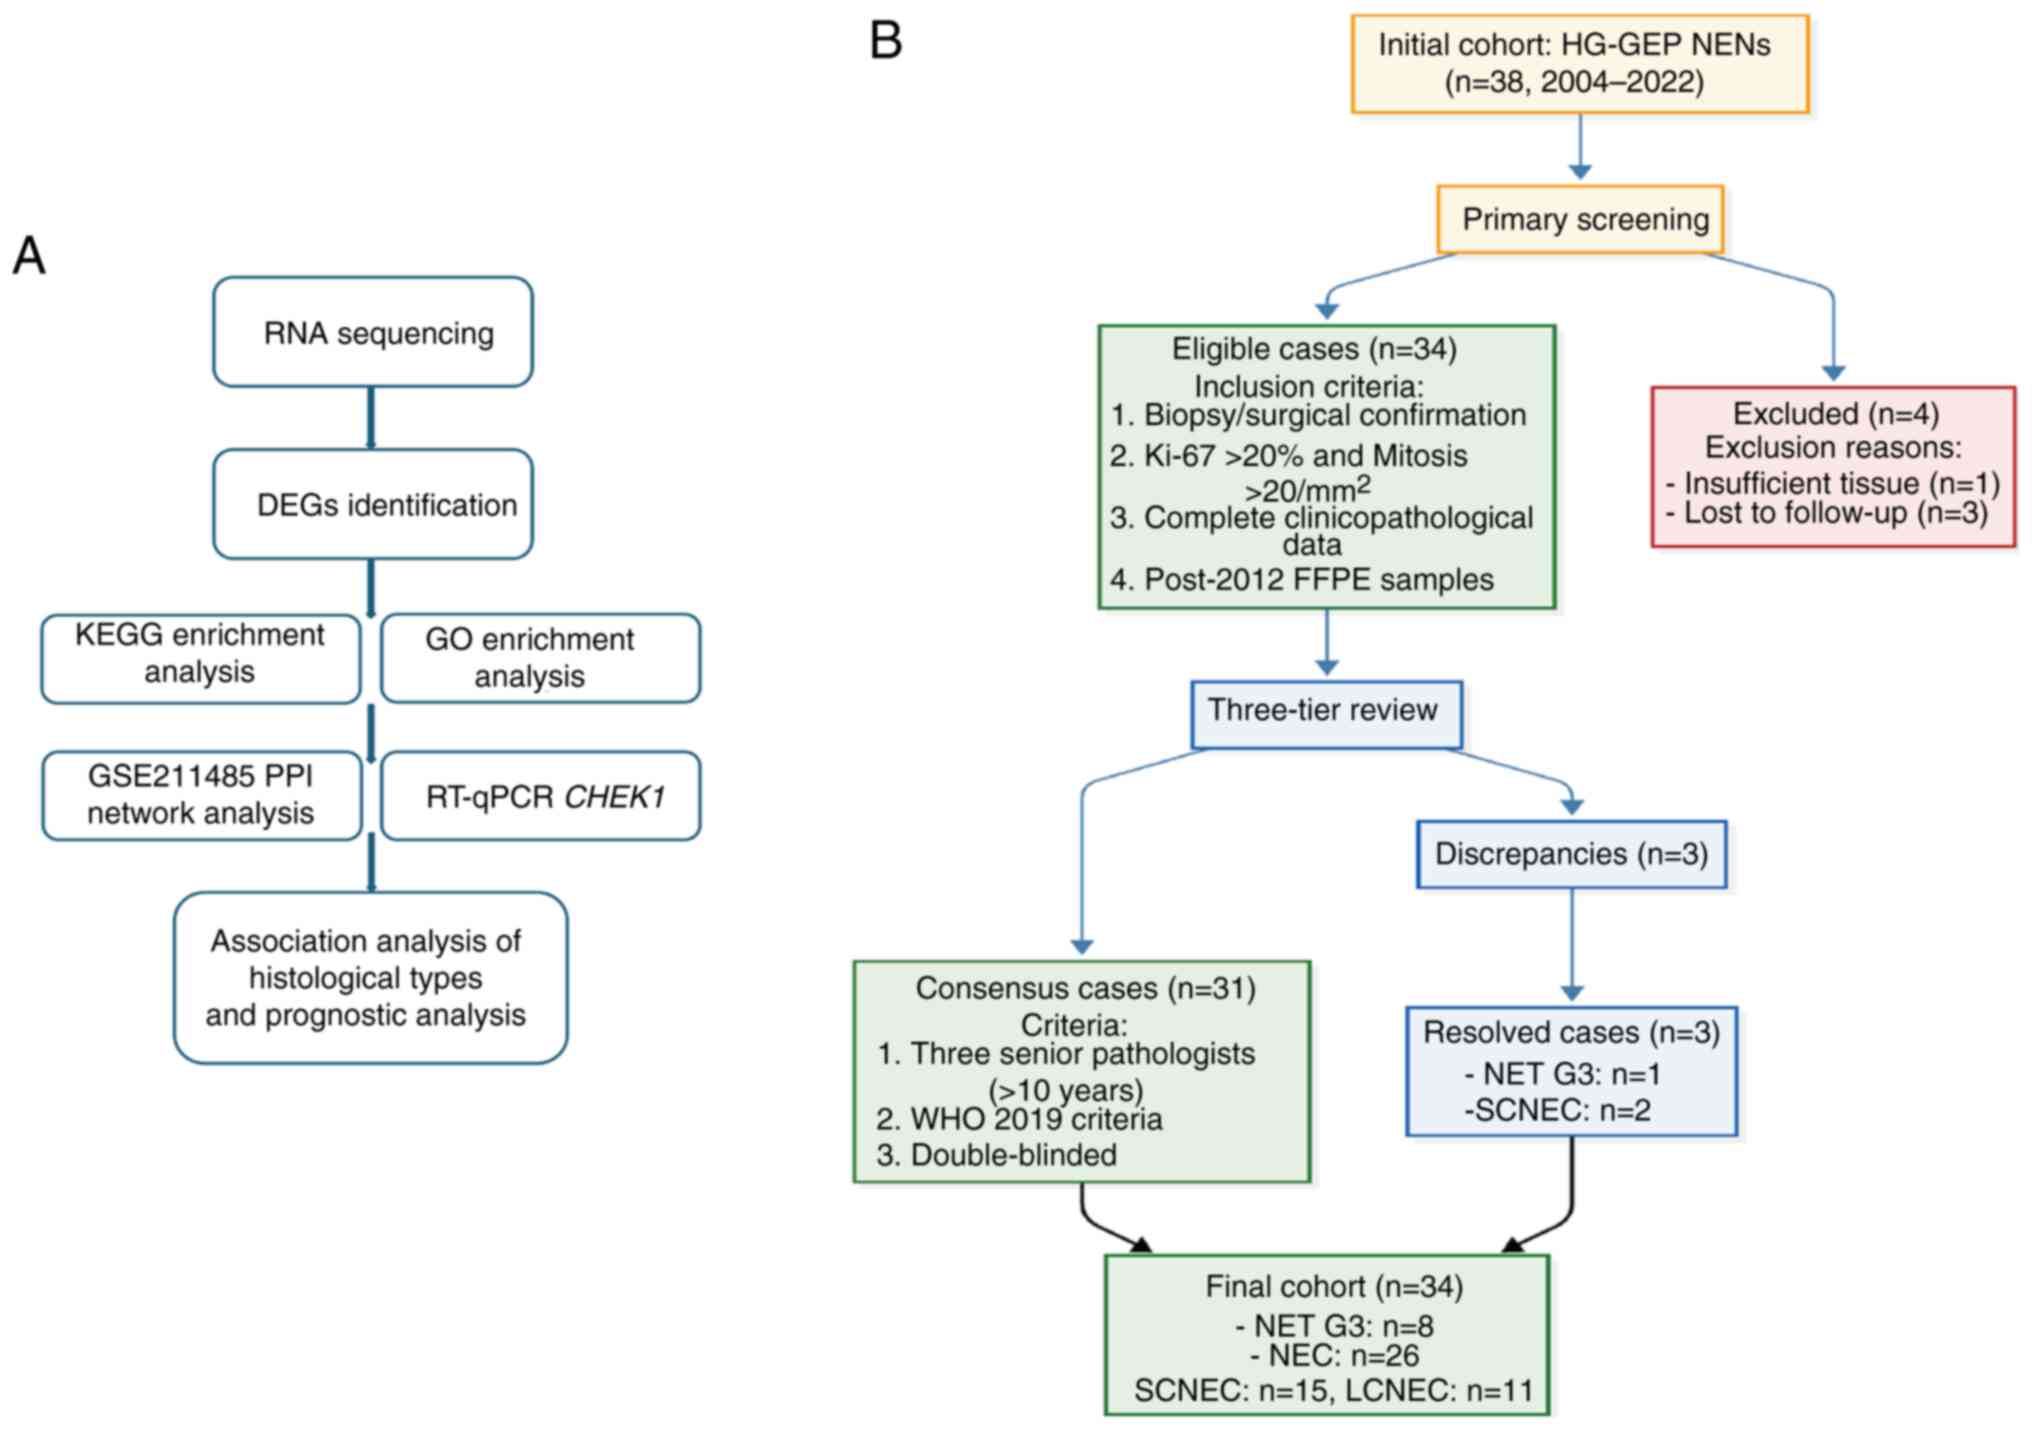 | Figure 1Workflow diagram and case selection
flowchart. (A) Workflow of the study. (B) Case inclusion and
screening flowchart. DEGs, differentially expressed genes; KEGG,
Kyoto Encyclopaedia of Genes and Genomes; GO, Gene Ontology; PPI,
protein-protein interaction; RT-qPCR, reverse
transcription-quantitative PCR; HG-GEP NENs, high-grade
gastroenteropancreatic neuroendocrine neoplasms; FFPE,
formalin-fixed paraffin-embedded; NET G3, neuroendocrine tumour
grade 3; NEC, neuroendocrine carcinoma; SCNEC, small cell NEC;
LCNEC, large-cell NEC; WHO, World Health Organisation;
CHEK1, checkpoint kinase 1. |
Materials and methods
Patient selection
The present study consecutively enrolled 38 patients
with HG-GEP NENs who underwent diagnostic or therapeutic procedures
(biopsy, puncture, surgery and/or consultation) at Beijing Luhe
Hospital, Capital Medical University (Beijing, China) between
January 2004 and May 2022. Inclusion criteria were as follows: i)
Histopathologically confirmed HG-GEP NENs according to the WHO
Classification Of Tumours Of The Digestive System (5th Edition,
2019) (3); ii) availability of
complete clinical data with a follow-up duration of >1 year; and
iii) availability of FFPE tumour tissue samples obtained after 2012
for molecular analysis. Patients not meeting all these criteria
were excluded. The FFPE tissues obtained during routine clinical
practice throughout this period were utilized for analysis. The
cohort consisted of 9 patients with NET G3 (7 male patients and 2
female patients; median age, 66.0±12.4 years). In addition, the
cohort also consisted of 29 patients with NEC who were further
stratified into: i) LCNEC, 11 cases (5 male patients and 6 female
patients; median age, 65.0±12.1 years); and ii) SCNEC, 18 cases (10
male patients and 8 female patients; median age, 65.0±9.6 years).
The overall population included 22 male patients and 16 female
patients (age range, 43-86 years; median age, 65.0±10.6 years). All
patients were independently reviewed and classified by three senior
pathologists according to the diagnostic criteria of the WHO
classification of tumours of the digestive system (5th edition,
2019) (3). Any diagnostic
discrepancies were resolved through multitiered consensus
discussions (Fig. 1B).
Pathological grading was performed based on comprehensive
histopathological evaluation. Clinical follow-up data regarding
recurrence, metastasis and survival status were obtained through
telephone interviews, with the follow-up period extending from the
date of initial tumour diagnosis until patient death. Complete
follow-up data were available for 35 patients, while 3 cases were
lost to follow-up. A total of 23 deaths were documented. Ethics
approval was provided by the Institutional Review Board of Beijing
Luhe Hospital, Capital Medical University (approval no.
2024-LHKY-107-01).
Identification of DEGs
Soldevilla et al (32) conducted transcriptome analyses via
next-generation sequencing on a cohort comprising 84 tumour tissue
samples from NENs of pulmonary and GEP origin. The resulting gene
dataset (GSE211485) was made publicly available through the GEO
database (https://www.ncbi.nlm.nih.gov/geo/). In that study, 15
patients diagnosed with GEP NET-G1 and GEP NET-G2 were assigned to
the LG-GEP NENs group, whereas 2 patients diagnosed with GEP-NEC
were assigned to the HG-GEP NENs group. The present study analysed
this dataset and DEG expression was assessed using R Studio
(version 2023.12.1+402; Posit Software, PBC, Boston, MA, USA) and
DESeq2 (version 1.40.2; Bioconductor Project). In this DESeq2 model
where the HG-GEP NENs group served as the baseline, a negative
log2FC indicates lower expression in the LG-GEP NENs group relative
to the HG-GEP NENs group, signifying upregulation in the high-grade
tumours. Batch effects were corrected using variance stabilising
transformation. DEGs were identified based on dual screening
criteria to ensure result reliability: i) Absolute log2 fold change
(FC) >1 with a false discovery rate of <0.05; and ii) FC>2
or <0.5 with P<0.05.
Gene Ontology (GO) and Kyoto
Encyclopaedia of Genes and Genomes (KEGG) enrichment analysis
GO and KEGG enrichment analyses of the identified
DEGs were performed using the R package ClusterProfiler. GO
enrichment analysis (http://geneontology.org/) was conducted across three
domains: Biological processes, cellular components and molecular
functions. KEGG enrichment analysis (https://www.genome.jp/kegg/) was performed to evaluate
five domains: Metabolic pathways, signalling pathways,
disease-related pathways, drug metabolism pathways and cellular
processes.
Protein-protein interaction (PPI)
network analysis
The identified DEGs were subjected to PPI network
analysis. Network visualisation was conducted using the Search Tool
for the Retrieval of Interacting Genes/Proteins database (version
12.0; https://string-db.org). Hub genes were
identified using the CytoHubba plugin in Cytoscape (v3.10.1;
https://cytoscape.org).
Prognostic analysis
A comprehensive analysis was conducted using data
from The Cancer Genome Atlas (TCGA) database (https://portal.gdc.cancer.gov/), utilizing the
TCGA-COAD and TCGA-READ datasets. Kaplan-Meier survival analysis
was performed using the R package survival (version 3.5-7;
https://cran.r-project.org/package=survival), with
patients stratified into high- and low-expression groups based on
the median expression level. The diagnostic performance of these
genes was examined using receiver operating characteristic (ROC)
curve analysis with the R package pROC (version 1.18.4; https://cran.r-project.org/package=pROC). Based on
these prognostic and diagnostic analyses, CHEK1 was
identified as the key target gene with significant diagnostic and
prognostic value.
Figures derived from TCGA-COAD and TCGA-READ were
generated using the GEPIA2 online analysis platform (http://gepia2.cancer-pku.cn/).
RNA extraction and reverse
transcription-quantitative PCR (RT-qPCR) detection
FFPE samples of patients diagnosed with HG-GEP NENs
after 2012 were selected for CHEK1 molecular detection. Four
samples from patients diagnosed prior to 2012 (three SCNEC and one
NET G3) were excluded from subsequent molecular analyses due to
insufficient RNA quality or quantity, resulting in 34 cases being
included in the RT-qPCR experiments. RNA was extracted from FFPE
tissue samples using the Nucleic Acid Extraction Reagent (Model:
FFPE RNA; cat. no. 8.02.0019; Xiamen Moyd Biotechnology Co., Ltd.,)
according to the manufacturer's protocol. Sections 5-10 µm in
thickness were placed in 1.5 ml DNase-/RNase-free centrifuge tubes.
To remove paraffin, 1 ml xylene was added to each tube, followed by
vortex mixing for 10 sec and incubation at 56˚C for 3 min. After a
second vortex mix, the samples were centrifuged at 13,000 x g for 2
min at 24˚C, and the supernatant was discarded. This step was
repeated if necessary to ensure complete deparaffinization.
Dehydration was then performed by adding 1 ml absolute ethanol,
vortexing and centrifuging at 13,000 x g for 2 min at 24˚C, after
which the supernatant was discarded. The pellets were air-dried at
56˚C until no ethanol residue remained. For RNA purification,
tissue lysis and digestion were initiated by adding 160 µl Buffer
RTL and 20 µl Proteinase K Solution to the pellets. The samples
were vortexed, briefly centrifuged at 13,000 x g for 10-15 sec at
24˚C and incubated at 56˚C for 30 min with agitation at 500 rpm,
followed by a second incubation at 80˚C for 30 min with agitation
at 500 rpm. After cooling to room temperature (~24˚C), on-site
prepared DNase I working mixture (30 µl per sample) was added to
digest genomic DNA, and the samples were incubated at 37˚C for 15
min. After centrifugation at 13,000 x g for 3 min at 24˚C, the
entire supernatant was transferred to a new tube. A total of 340 µl
Buffer RPB and 750 µl absolute ethanol was added, and the mixture
was vortexed. The solution was transferred to an RNA spin column
and centrifuged at 13,000 x g for 30 sec at 24˚C. The flow-through
was discarded. The remaining solution was loaded and centrifuged
again under the same conditions. The column was then washed
sequentially with 600 µl Wash Buffer A and 600 µl Wash Buffer B,
with centrifugation at 13,000 x g for 30 sec at 24˚C after each
wash. After a final centrifugation at 13,000 x g for 3 min at 24˚C
to dry the membrane, the RNA was eluted with 80-100 µl Buffer RTE
mixture by incubation at 56˚C for 2 min and centrifugation at
13,000 x g for 1 min at 24˚C. The purified RNA was dissolved in
RNase-free water, and its concentration and purity (A260/A280) were
determined using a SMA4000 spectrophotometer (Merinton Instrument,
Ltd.). cDNA was synthesized from the purified RNA using the
TransScript cDNA Synthesis Kit (TransGen Biotech Co., Ltd.)
according to the manufacturer's instructions. The reaction was
performed under the following thermocycling conditions: 25˚C for 10
min, 42˚C for 15 min and 85˚C for 5 sec, followed by hold at 4˚C.
For qPCR, each reaction contained 2 µl cDNA template, 10 µl SYBR
Green qPCR Master Mix (Thermo Fisher Scientific Inc.), 0.4 µM of
each forward and reverse primer and RNase-free water up to a total
volume of 20 µl. The thermocycling conditions were as follows:
Initial denaturation at 95˚C for 3 min, followed by 40 cycles of
95˚C for 15 sec, 60˚C for 30 sec and 72˚C for 30 sec. Amplification
specificity was verified through melting curve analysis. A
no-template control was included in each run to monitor potential
contamination of the reaction. Target gene expression was
normalised to the reference gene (GAPDH) threshold value,
and the relative gene expression level was calculated using the
2-ΔΔCq method (33).
The primer sequences used for amplification of the
target gene CHEK1 and the reference gene GAPDH were
as follows: CHEK1 forward, 5'-GTGTCAGAGTCTCCCAGTGGAT-3' and
reverse, 5'-GTTCTGGCTGAGAACTGGAGTAC-3'; and GAPDH forward,
5'-GGTGGTCTCCTCTGACTTCAACA-3' and reverse,
5'-GTTGCTGTAGCCAAATTCGTTGT-3'.
Statistical analysis
Transcriptomic (TPM) and corresponding clinical data
were obtained from TCGA-COAD and TCGA-READ datasets, which were
used as representative cohorts of digestive system tumours. Samples
annotated as ‘solid tissue normal’ were included as adjacent
non-tumourous tissues. As the numbers of tumour and normal samples
were not identical, the comparison of CHEK1 expression
between tumour and adjacent normal tissues was performed using an
unpaired two-tailed Student's t-test. Statistical analyses were
performed using SPSS (version 29.0; IBM Corp.) and R Studio
(version 2023.12.1+402; Posit Software). Categorical variables are
presented as number (n) and percentage (%), while continuous
variables are expressed as the mean ± standard deviation (SD) or
median with interquartile range (IQR), as appropriate. For
categorical analysis, gene expression levels were dichotomized into
‘high’ and ‘low’ groups based on the median expression value of the
entire cohort. Descriptive statistics, including χ2 and
Fisher's exact tests were employed for data summarization and
clinicopathological associations. Comparisons of continuous
variables between two groups were performed using an unpaired
two-tailed Student's t-test. For CHEK1 quantitative analysis
in the present cohort, which did not meet the assumptions of
parametric tests, non-parametric tests were applied. Specifically,
the Mann-Whitney U test was used for two-group comparisons, and the
Kruskal-Wallis test followed by Dunn's post hoc test was used for
comparisons across multiple groups. Survival assessment was
conducted using Kaplan-Meier analysis and log-rank tests, whereas
diagnostic performance was evaluated by ROC curve analysis. A post
hoc power analysis was performed based on the quantitative RT-qPCR
data of CHEK1 expression using the R pwr package (effect
size d=1.5), which demonstrated 65% statistical power. P<0.05
was considered to indicate a statistically significant
difference.
Results
Patients
A total of 38 patients with HG-GEP NENs were
included in the present study, comprising 9 patients (23.7%) with
NET G3 and 29 patients (76.3%) with NEC. The NEC group was further
subdivided into 11 patients (37.9% of NEC) with LCNEC and 18
patients (62.1% of NEC) with SCNEC. Complete follow-up data were
available for 35 patients (92.1%), whereas data for 2 patients
(5.3%) with NEC and 1 patient (2.6%) with NET G3 were unavailable.
The median survival time for the entire cohort was 10.0 months
(IQR, 5.0-25.0 months). When stratified by histological subtype,
the median survival time was 25.0 months (IQR, 15.5-42.0 months)
for the NET G3 group and 10.0 months (IQR, 5.0-21.5 months) for the
NEC group. Analysis of clinicopathological data was conducted as
described in our previous study (34). Immunohistochemical markers CLU and
TP53 significantly impacted survival outcomes, with CLU serving as
an independent prognostic factor. The immunohistochemical profile
provided diagnostic value for NET G3 subtyping, while conventional
demographic factors showed no significant associations with
survival.
Identification of DEGs
Specimens from 17 patients were analysed from the
GSE211485 dataset, including 15 patients with LG-GEP NENs and 2
patients with HG-GEP NENs. The baseline clinical characteristics of
the patients are presented in Table
I. Using DESeq2 with the HG-GEP NENs group designated as the
baseline, a total of 18,591 genes were assessed. Comparative
analysis identified 6 of these genes that were significantly
upregulated in the HG-GEP NENs group compared with those in the
LG-GEP NENs group (Fig. 2A;
Table II). The complete list of
these upregulated DEGs is provided in Table II.
 | Table IClinical characteristics of the
patients from the GSE211485 dataset. |
Table I
Clinical characteristics of the
patients from the GSE211485 dataset.
| Characteristic | LG-GEP NENs | HG-GEP NENs |
|---|
| Grade | GEP NET-G1 | GEP NET-G2 | GEP NEC |
|---|
| Patient number | 7 | 8 | 2 |
| Sex (male/female),
n | 5/2 | 2/6 | 2/0 |
| Primary tumour
site | | | |
| Small
intestine | 2 | 4 | 0 |
| Colon and
rectum | 1 | 2 | 1 |
| Stomach | 3 | 0 | 0 |
| Pancreas | 0 | 2 | 1 |
| Appendix | 1 | 0 | 0 |
| Survival
status | | | |
| Alive | 6 | 5 | 0 |
| Deceased | 1 | 3 | 2 |
| Table IISignificantly upregulated DEGs in
HG-GEP NENs compared with LG-GEP NENs. |
Table II
Significantly upregulated DEGs in
HG-GEP NENs compared with LG-GEP NENs.
| Gene ID | Adjusted
P-value | P-value | Log2 fold
change |
|---|
| CENPF | 0.0000298 |
1.25x10⁻⁹ | -2.1162718 |
| CHEK1 | 0.0015899 |
1.52x10⁻⁷ | -1.1901370 |
| RGPD3 | 0.0015899 |
2.00x10⁻⁷ | -1.6814988 |
| UBE2T | 0.0057300 |
9.60x10⁻⁷ | -1.6553494 |
| E2F7 | 0.0210587 |
4.41x10⁻⁶ | -1.0386288 |
| ITGB3BP | 0.0465996 |
1.10x10⁻⁵ | -1.3835926 |
GO and KEGG enrichment analysis of
DEGs
GO enrichment analysis demonstrated significant
enrichment of DEGs in biological processes related to ‘centromere
complex assembly’, ‘negative regulation of mitotic cell cycle’ and
‘negative regulation of mitotic cell cycle phase transition’;
cellular components related to ‘condensed chromosome’, ‘chromosomal
region’ and ‘kinetochore’; and molecular functions related to
‘protein C-terminus binding’, ‘dynein complex binding’, and
‘histone kinase activity’. KEGG enrichment analysis revealed
substantial enrichment in pathways associated with ‘Cell cycle’,
‘p53 signalling pathway’ and ‘Fanconi anemia pathway’ (Fig. 2B).
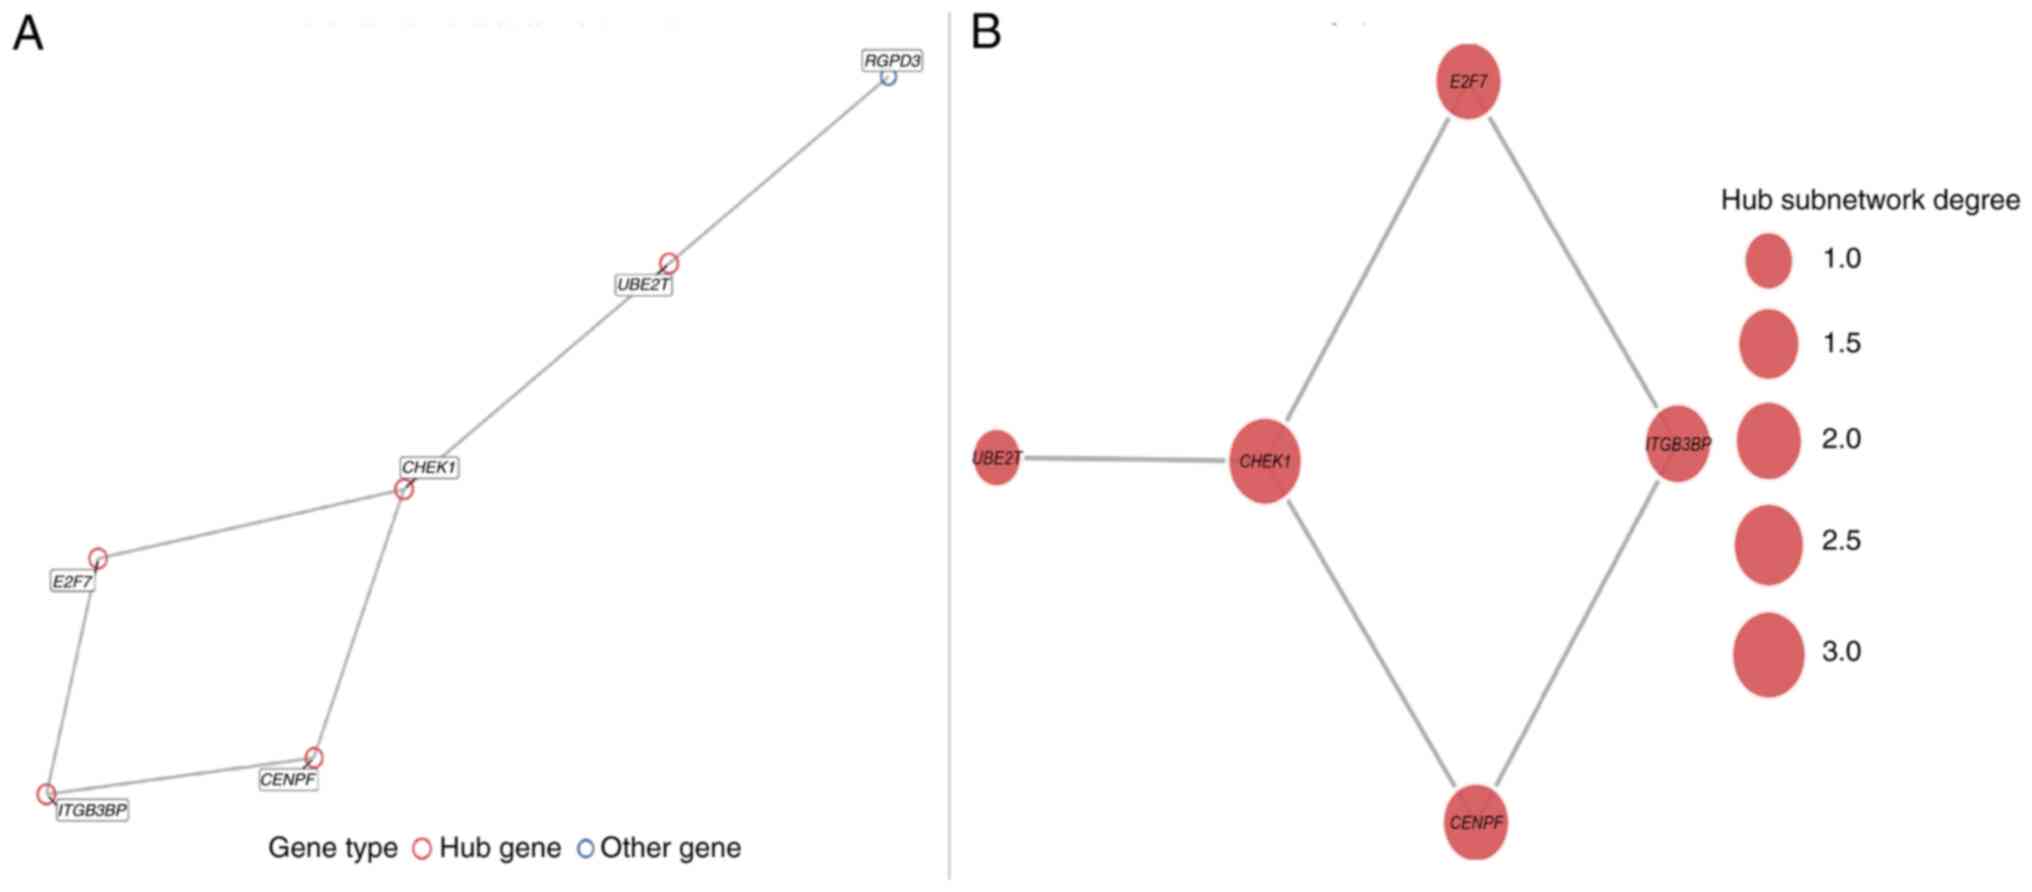
PPI network analysis of DEGs
Among the six significantly upregulated DEGs, five
genes (CENPF, CHEK1, UBE2T, E2F7 and
ITGB3BP) formed a tightly interconnected hub module in the
PPI network constructed using the STRING database (Fig. 3A and B). The identification of these hub genes
reveals their functional involvement in cell cycle regulation and
DNA damage repair pathways. Furthermore, the convergence of their
upregulated expression and central network position highlights
their coordinated role in promoting genomic instability and
uncontrolled proliferation, which are key mechanisms underlying
HG-GEP NENs progression. Collectively, these findings support the
value of further investigating these hub genes as potential
therapeutic targets.
Analysis using TCGA database
Owing to the rarity of HG-GEP NENs, corresponding
tumour classifications were unavailable in TCGA. Therefore,
transcriptomic and clinical data from TCGA-COAD and TCGA-READ
projects were utilized as relevant proxies for digestive system
tumours. Survival analysis demonstrated that high expression of
CHEK1 was significantly associated with poorer overall
survival (Log-rank P<0.05; Fig.
4A-E). Concurrently, ROC curve analysis indicated that
CHEK1 expression possessed high diagnostic accuracy for
distinguishing tumour from normal tissues (AUC >0.85; Fig. 4F). CHEK1 was selected for
further analysis since it emerged as the most prognostically and
diagnostically significant gene among the five hub genes in these
validation analyses. Among these, CHEK1 was significantly
overexpressed in digestive system tumour tissues compared with that
in adjacent normal tissues based on TCGA-COAD and TCGA-READ
datasets (P<0.001, unpaired Student's t-test; Fig. 4G), suggesting that CHEK1 may
serve as a diagnostically and prognostically relevant target gene
in digestive system malignancies.
![Prognostic and diagnostic analysis of
the DEGs identified from the GSE211485 dataset. (A-E) Kaplan-Meier
survival curves showing the association between the expression
levels of the five identified DEGs (A) CHEK1, (B)
CENPF, (C) E2F7, (D) ITGB3BP and (E)
UBE2T, and overall survival in patients with digestive
system tumours. The HR and 95% CIs were calculated using the
log-rank test. (F) ROC curve showing the diagnostic performance of
CHEK1 expression for distinguishing tumour from normal
tissues. The AUC indicates diagnostic accuracy. (G) Expression of
CHEK1 [log2 (TPM +1)] in digestive system tumour tissues
compared with adjacent normal tissues. Statistical significance is
indicated as ***P<0.001. DEGs, differentially
expressed genes; CI, confidence interval; AUC, area under the
curve; HR, hazard ratio; CHEK1, checkpoint kinase 1; FPR,
false-positive rate; TPR, true-positive rate; TPM, transcripts per
million.](/article_images/etm/31/1/etm-31-01-13001-g03.jpg) | Figure 4Prognostic and diagnostic analysis of
the DEGs identified from the GSE211485 dataset. (A-E) Kaplan-Meier
survival curves showing the association between the expression
levels of the five identified DEGs (A) CHEK1, (B)
CENPF, (C) E2F7, (D) ITGB3BP and (E)
UBE2T, and overall survival in patients with digestive
system tumours. The HR and 95% CIs were calculated using the
log-rank test. (F) ROC curve showing the diagnostic performance of
CHEK1 expression for distinguishing tumour from normal
tissues. The AUC indicates diagnostic accuracy. (G) Expression of
CHEK1 [log2 (TPM +1)] in digestive system tumour tissues
compared with adjacent normal tissues. Statistical significance is
indicated as ***P<0.001. DEGs, differentially
expressed genes; CI, confidence interval; AUC, area under the
curve; HR, hazard ratio; CHEK1, checkpoint kinase 1; FPR,
false-positive rate; TPR, true-positive rate; TPM, transcripts per
million. |
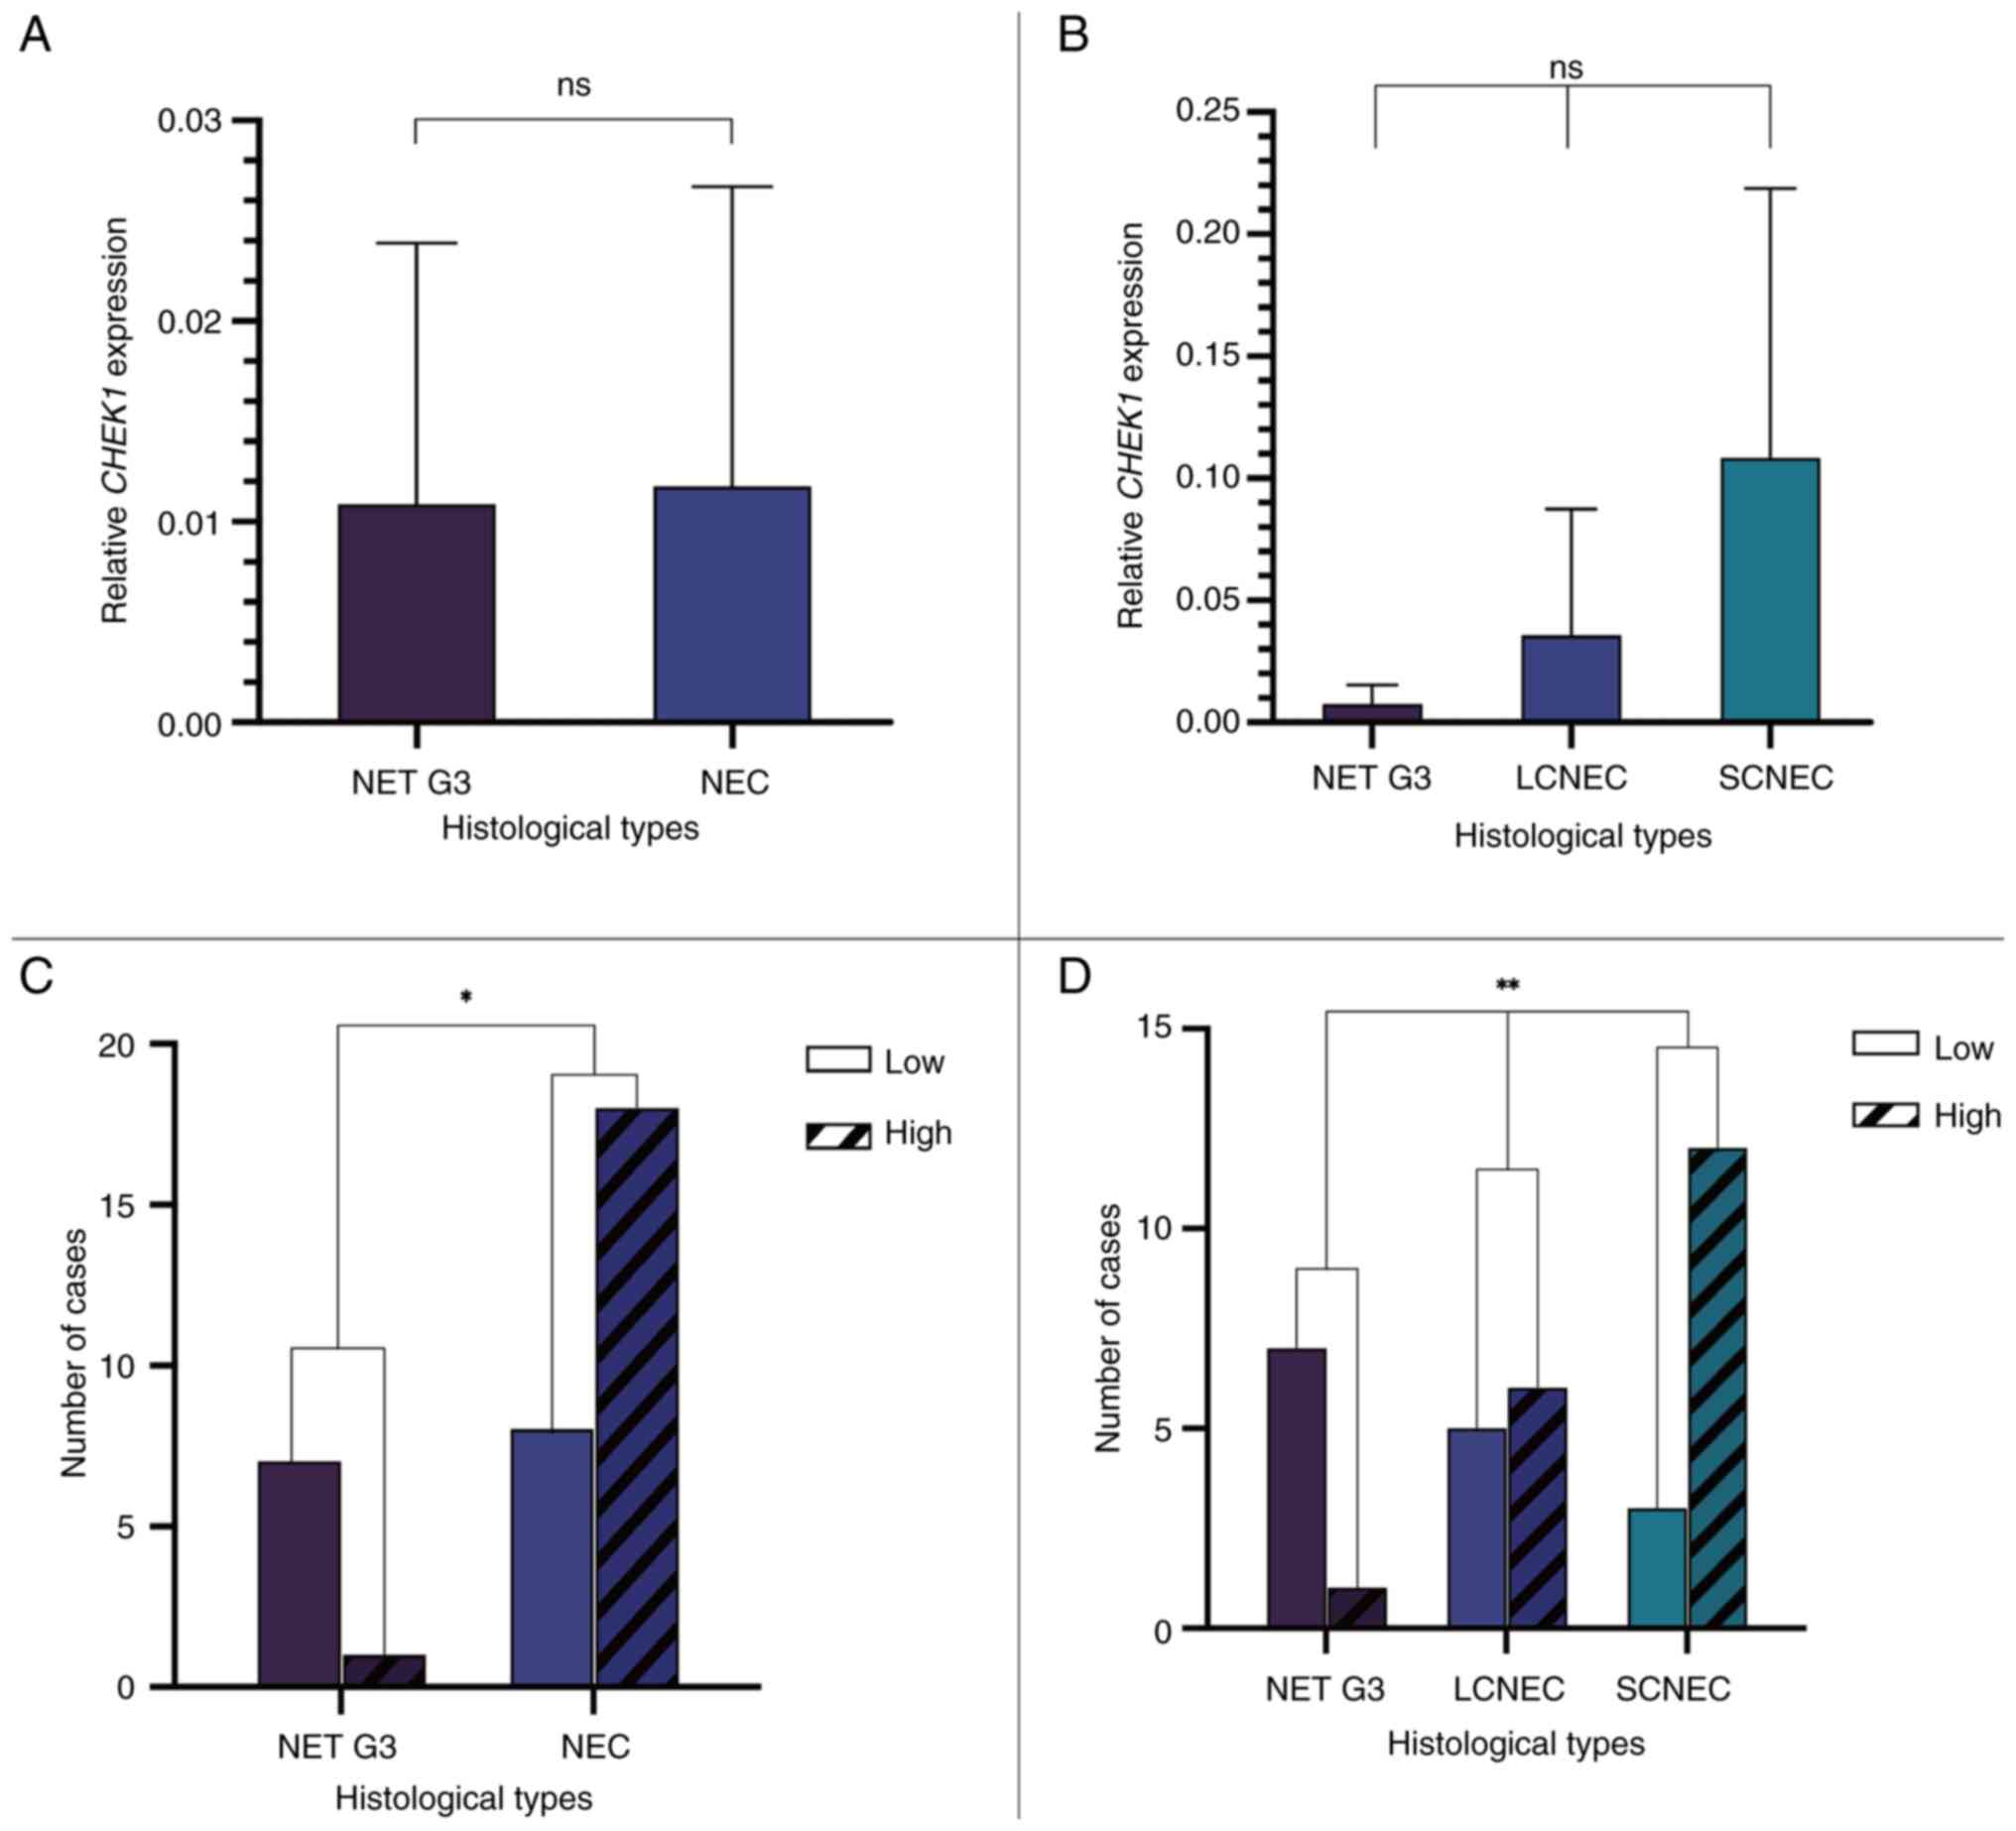
RT-qPCR detection of CHEK1 expression
in HG-GEP NENs
A total of 34 patients with HG-GEP NENs recruited in
the present study were included in the RT-qPCR analysis, excluding
3 patients with SCNEC and 1 patient with NET G3 diagnosed prior to
2012. Patients were classified into high- and low-CHEK1
expression groups based on the median expression level for
categorical analyses. RT-qPCR analysis revealed that CHEK1
expression was lower in the NET G3 group (n=8) compared with that
in the NEC group (n=26), although the difference was not
statistically significant (P=0.075; Fig. 5A). Further analysis among the NET
G3 (n=8), LCNEC (n=11) and SCNEC (n=15) subgroups revealed no
significant differences (P>0.05 for all pairwise comparisons;
Fig. 5B). Analysis between
histological subtypes indicated a significant difference between
the NET G3 and NEC groups (P=0.0113; Fig. 5C), with a higher proportion of
patients exhibiting high CHEK1 expression in the NEC group.
Further intergroup analysis demonstrated that the proportion of
patients exhibiting elevated CHEK1 expression was
significantly higher in the SCNEC subgroup compared with that in
the NET G3 and LCNEC groups (P=0.0075; Fig. 5D).
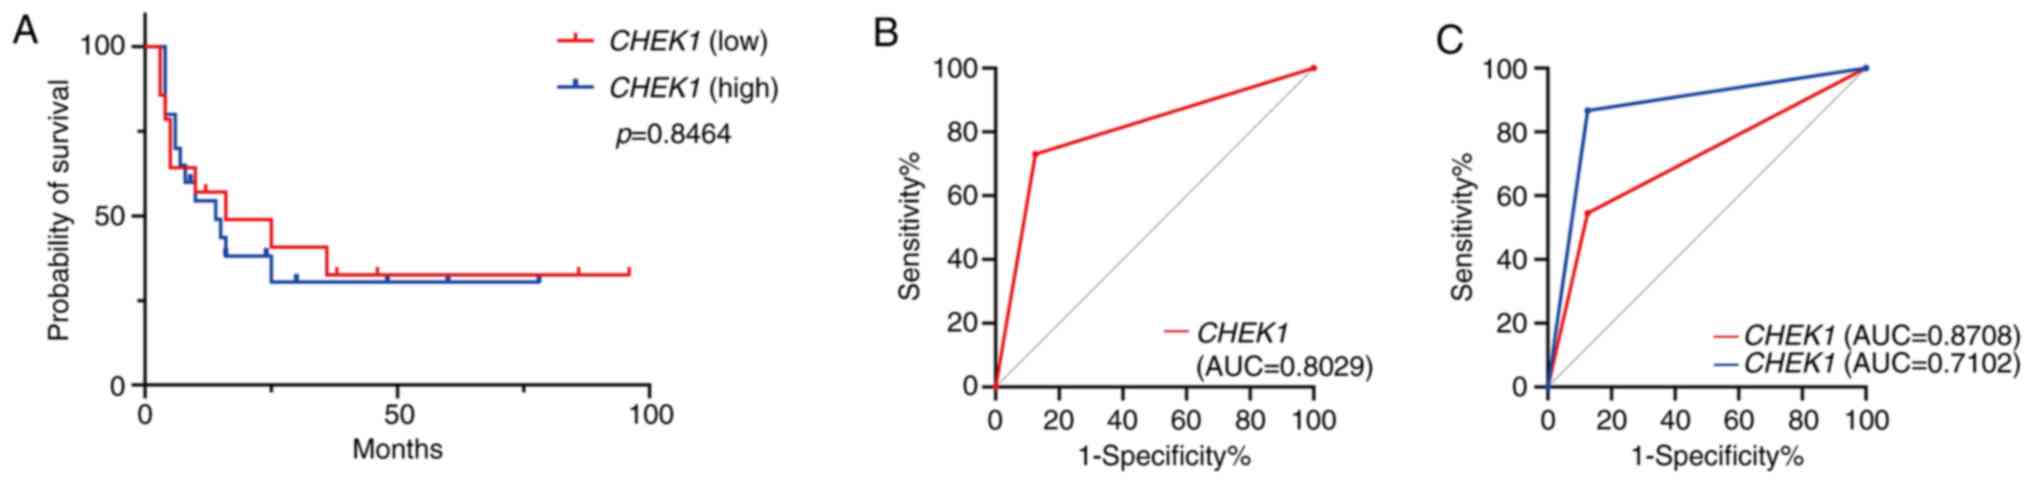
Prognostic and diagnostic analysis of
CHEK1 expression
The median survival time was 14 months in the
CHEK1 high-expression group and 16 months in the
low-expression group. The Kaplan-Meier survival analysis
demonstrated no significant difference in overall survival between
the high- and low-expression groups (P=0.8464, Fig. 6A). ROC curve analysis demonstrated
that high CHEK1 expression influenced the diagnostic
performance of NEC (AUC=0.8029; Fig.
6B). Further analysis, stratifying NEC cases into LCNEC and
SCNEC subtypes, revealed that high CHEK1 expression
contributed to the diagnosis of LCNEC and SCNEC, with a more
pronounced effect observed for SCNEC (AUC=0.8708) compared with
LCNEC (AUC=0.7102) (Fig. 6C and
Table III).
| Table IIIDiagnostic performance of
CHEK1 expression in high-grade gastroenteropancreatic
neuroendocrine neoplasms. |
Table III
Diagnostic performance of
CHEK1 expression in high-grade gastroenteropancreatic
neuroendocrine neoplasms.
| Pathological
category | AUC | Diagnostic
efficacy |
|---|
| NEC (overall) | 0.8029 | Moderate diagnostic
value |
| SCNEC | 0.8708 | Good diagnostic
value |
| LCNEC | 0.7102 | Limited diagnostic
value |
Discussion
The 2019 WHO Classification (5th Edition) introduced
revised diagnostic criteria for HG-GEP NENs (3,5),
defining them by a Ki-67 proliferation index of >20% and >20
mitoses per 2 mm². This revision underscores the dependence on
histopathological morphology for precisely distinguishing NET G3
from NEC, a process susceptible to interobserver variability. The
present study addresses this challenge by identifying a distinct
molecular signature in HG-GEP NENs, characterized by the
upregulation of cell cycle and DNA damage repair pathways.
Critically, significant overexpression of CHEK1 in NEC,
particularly the SCNEC subtype, was demonstrated. This finding
provides a molecular association for their aggressive clinical
behaviours, aligning with established literature that associates
NEC with poorer survival and platinum-based chemotherapy regimens,
in contrast to NET G3 (7,10,35,36).
Thus, the present findings not only validate the existing
pathological distinction but also provide a molecular pathological
basis for the divergent clinical phenotypes and treatment
responses, potentially informing future targeted therapeutic
strategies.
Macroscopically, NET G3 typically presents as solid
nodules with a protruding or polypoid appearance, moderate firmness
and grey-white or grey-yellow cut surface with well-defined borders
relative to the surrounding tissues. Conversely, NEC often exhibit
irregular ulcers or cauliflower-like protrusions, frequently
accompanied by haemorrhage or necrosis. NEC are fragile, prone to
fragmentation and are poorly demarcated from the adjacent tissues.
When located in the colorectal region, such tumours commonly
exhibit circumferential growth, leading to luminal narrowing and
obstruction. Microscopically, NET G3 resemble well-differentiated
NENs, characterised by organoid architectures or growth patterns
such as trabecular, ribbon-like or glandular arrangements.
Alternatively, NEC are defined by diffuse, sheet-like proliferation
with pronounced cellular atypia, poor differentiation and frequent
necrosis (3). In the present
study, tumour specimens were reclassified in accordance with the
latest WHO classification standards following a review by at least
three senior pathologists.
The differential expression of specific
immunohistochemical and molecular markers, such as somatostatin
receptor 2A (SSTR2A), p53, Rb (36,37)
and clusterin, may aid in distinguishing HG-GEP NENs (38). However, the identification of novel
molecular biomarkers remains essential for improving differential
diagnostic accuracy. This is particularly important given that, due
to the rarity of these neoplasms, most available data have been
obtained from patients with NEC, with NET G3 being even less
common. Furthermore, sequencing data within existing databases
remain limited.
In the present study, CHEK1 was identified as
a novel complementary diagnostic marker in accordance with the WHO
2019 criteria, demonstrating concordance with established
immunohistochemical markers (such as SSTR2A and p53) and
KRAS/BRAF mutational profiles (34). However, two critical limitations
warrant consideration. First, the transcriptomic dataset included
only two HG cases, thereby limiting the representativeness of the
sample. Second, due to the unavailability of HG-GEP NENs data in
TCGA, broader digestive system tumour datasets were utilised for
validation, which may have affected the specificity of the
findings.
Given the rarity of HG-GEP NENs and the limitations
of existing databases, several research priorities are proposed: i)
The establishment of multicentre collaborative networks to ensure
the inclusion of ≥20 cases per subtype (NET G3/LCNEC/SCNEC); ii)
the implementation of standardised diagnostic and research
protocols; and iii) the execution of integrated multi-omics
analyses on HG-GEP NEN samples. Furthermore, validation at the
protein level (such as through immunohistochemical analysis of
CHEK1 in HG-GEP NEN tissues) and functional assays using
HG-GEP NEN-derived cell lines will be essential to elucidate the
mechanistic role of CHEK1 in cell cycle dysregulation. These
comprehensive approaches will facilitate definitive validation of
the diagnostic utility of CHEK1 and deepen the understanding
of its biological function in these neoplasms, thereby contributing
to the development of more precise molecular classification
systems.
In conclusion, the present study demonstrated the
diagnostic value of CHEK1, thereby providing valuable
insights and guidance for future clinical pathology research and
practice. The findings suggest that CHEK1 may serve as a
novel molecular biomarker for the differential diagnosis of HG-GEP
NENs. However, the small sample size represents a significant
limitation of the present study, potentially restricting the
immediate applicability of the findings to clinical practice. To
fully elucidate the underlying molecular pathogenic mechanisms of
the identified genes, further biological investigations are
required. Moreover, large-scale clinicopathological studies are
necessary before these findings can be translated into clinical
practice.
Acknowledgements
Not applicable.
Funding
Funding: The present study was supported by the Beijing Tongzhou
District Science and Technology Committee Project Fund (grant no.
KJ2024CX027).
Availability of data and materials
The data generated in the present study may be
requested from the corresponding author.
Authors' contributions
NL contributed to the study conceptualization, data
curation, formal data analysis, experimental investigation,
methodology development, validation of the results and writing of
the original draft. YH contributed to the study conceptualization,
project administration, funding acquisition, and reviewing and
editing of the manuscript. JA performed experimental investigations
and validated the experimental results. NL and YH confirm the
authenticity of all the raw data. All authors have read and
approved the final manuscript.
Ethics approval and consent to
participate
This study was conducted in accordance with the
ethical standards of the Declaration of Helsinki and was approved
by the Institutional Review Board of Beijing Luhe Hospital, Capital
Medical University (approval no. 2024-LHKY-107-01). The requirement
for written informed consent was waived by the same ethics
committee due to the retrospective nature of the study.
Patient consent for publication
Not applicable.
Competing interests
The authors declare that they have no competing
interests.
References
|
1
|
Pavel M, Öberg K, Falconi M, Krenning EP,
Sundin A and Perren A: ESMO Guidelines Committee: Electronic
address: clinicalguidelines@esmo.org. Gastroenteropancreatic
neuroendocrine neoplasms: ESMO clinical practice guidelines for
diagnosis, treatment and follow-up. Ann Oncol. 31:844–860.
2020.PubMed/NCBI View Article : Google Scholar
|
|
2
|
Gribble FM and Reimann F: Function and
mechanisms of enteroendocrine cells and gut hormones in metabolism.
Nat Rev Endocrinol. 15:226–237. 2019.PubMed/NCBI View Article : Google Scholar
|
|
3
|
Nagtegaal ID, Odze RD, Klimstra D, Paradis
V, Rugge M, Schirmacher P, Washington KM, Carneiro F and Cree IA:
WHO Classification of Tumours Editorial Board. The 2019 WHO
classification of tumours of the digestive system. Histopathology.
76:182–188. 2020.PubMed/NCBI View Article : Google Scholar
|
|
4
|
Busico A, Maisonneuve P, Prinzi N,
Pusceddu S, Centonze G, Garzone G, Pellegrinelli A, Giacomelli L,
Mangogna A, Paolino C, et al: Gastroenteropancreatic high-grade
neuroendocrine neoplasms: Histology and molecular analysis, two
sides of the same coin. Neuroendocrinology. 110:616–629.
2020.PubMed/NCBI View Article : Google Scholar
|
|
5
|
Milione M, Maisonneuve P, Pellegrinelli A,
Grillo F, Albarello L, Spaggiari P, Vanoli A, Tagliabue G, Pisa E,
Messerini L, et al: Ki67 proliferative index of the neuroendocrine
component drives MANEC prognosis. Endocr Relat Cancer. 25:583–593.
2018.PubMed/NCBI View Article : Google Scholar
|
|
6
|
Tang LH, Untch BR, Reidy DL, O'Reilly E,
Dhall D, Jih L, Basturk O, Allen PJ and Klimstra DS:
Well-differentiated neuroendocrine tumors with a morphologically
apparent high-grade component: A pathway distinct from poorly
differentiated neuroendocrine carcinomas. Clin Cancer Res.
22:1011–1017. 2016.PubMed/NCBI View Article : Google Scholar
|
|
7
|
Sorbye H, Kong G and Grozinsky-Glasberg S:
PRRT in high-grade gastroenteropancreatic neuroendocrine neoplasms
(WHO G3). Endocr Relat Cancer. 27:R67–R77. 2020.PubMed/NCBI View Article : Google Scholar
|
|
8
|
Pellat A and Coriat R: Well differentiated
grade 3 neuroendocrine tumors of the digestive tract: A narrative
review. J Clin Med. 9(1677)2020.PubMed/NCBI View Article : Google Scholar
|
|
9
|
Venizelos A, Elvebakken H, Perren A,
Nikolaienko O, Deng W, Lothe IMB, Couvelard A, Hjortland GO,
Sundlöv A, Svensson J, et al: The molecular characteristics of
high-grade gastroenteropancreatic neuroendocrine neoplasms. Endocr
Relat Cancer. 29:1–14. 2021.PubMed/NCBI View Article : Google Scholar
|
|
10
|
Scarpa A, Chang DK, Nones K, Corbo V,
Patch AM, Bailey P, Lawlor RT, Johns AL, Miller DK, Mafficini A, et
al: Whole-genome landscape of pancreatic neuroendocrine tumours.
Nature. 543:65–71. 2017.PubMed/NCBI View Article : Google Scholar
|
|
11
|
Mafficini A and Scarpa A: Genetics and
epigenetics of gastroenteropancreatic neuroendocrine neoplasms.
Endocr Relat Cancer. 26:R249–R266. 2019.PubMed/NCBI View Article : Google Scholar
|
|
12
|
Jin XF, Spöttl G, Maurer J, Nölting S and
Auernhammer CJ: Antitumoral activity of the MEK inhibitor
trametinib (TMT212) alone and in combination with the CDK4/6
inhibitor ribociclib (LEE011) in neuroendocrine tumor cells in
vitro. Cancers (Basel). 13(1485)2021.PubMed/NCBI View Article : Google Scholar
|
|
13
|
Wang ZJ, An K, Li R, Shen W, Bao MD, Tao
JH, Chen JN, Mei SW, Shen HY, Ma YB, et al: Analysis of 72 patients
with colorectal high-grade neuroendocrine neoplasms from three
chinese hospitals. World J Gastroenterol. 25:5197–5209.
2019.PubMed/NCBI View Article : Google Scholar
|
|
14
|
Uccella S, La Rosa S, Metovic J, Marchiori
D, Scoazec JY, Volante M, Mete O and Papotti M: Genomics of
high-grade neuroendocrine neoplasms: Well-differentiated
neuroendocrine tumor with high-grade features (G3 NET) and
neuroendocrine carcinomas (NEC) of various anatomic sites. Endocr
Pathol. 32:192–210. 2021.PubMed/NCBI View Article : Google Scholar
|
|
15
|
Mitsuhashi K, Yamamoto I, Kurihara H,
Kanno S, Ito M, Igarashi H, Ishigami K, Sukawa Y, Tachibana M,
Takahashi H, et al: Analysis of the molecular features of rectal
carcinoid tumors to identify new biomarkers that predict biological
malignancy. Oncotarget. 6:22114–22125. 2015.PubMed/NCBI View Article : Google Scholar
|
|
16
|
Park HY, Kwon MJ, Kang HS, Kim YJ, Kim NY,
Kim MJ, Min KW, Choi KC, Nam ES, Cho SJ, et al: Targeted
next-generation sequencing of well-differentiated rectal, gastric,
and appendiceal neuroendocrine tumors to identify potential
targets. Hum Pathol. 87:83–94. 2019.PubMed/NCBI View Article : Google Scholar
|
|
17
|
Hijioka S, Hosoda W, Matsuo K, Ueno M,
Furukawa M, Yoshitomi H, Kobayashi N, Ikeda M, Ito T, Nakamori S,
et al: Rb loss and KRAS mutation are predictors of the response to
platinum-based chemotherapy in pancreatic neuroendocrine neoplasm
with grade 3: A japanese multicenter pancreatic NEN-G3 study. Clin
Cancer Res. 23:4625–4632. 2017.PubMed/NCBI View Article : Google Scholar
|
|
18
|
Sorbye H, Baudin E and Perren A: The
problem of high-grade gastroenteropancreatic neuroendocrine
neoplasms. Endocrinol Metab Clin North Am. 47:683–698.
2018.PubMed/NCBI View Article : Google Scholar
|
|
19
|
Patil M, Pabla N and Dong Z: Checkpoint
kinase 1 in DNA damage response and cell cycle regulation. Cell Mol
Life Sci. 70:4009–4021. 2013.PubMed/NCBI View Article : Google Scholar
|
|
20
|
Qiu Z, Oleinick NL and Zhang J: ATR/CHK1
inhibitors and cancer therapy. Radiother Oncol. 126:450–464.
2018.PubMed/NCBI View Article : Google Scholar
|
|
21
|
Hubackova S, Davidova E, Boukalova S,
Kovarova J, Bajzikova M, Coelho A, Terp MG, Ditzel HJ, Rohlena J
and Neuzil J: Replication and ribosomal stress induced by targeting
pyrimidine synthesis and cellular checkpoints suppress
p53-deficient tumors. Cell Death Dis. 11(110)2020.PubMed/NCBI View Article : Google Scholar
|
|
22
|
Jaaks P, Coker EA, Vis DJ, Edwards O,
Carpenter EF, Leto SM, Dwane L, Sassi F, Lightfoot H, Barthorpe S,
et al: Effective drug combinations in breast colon and pancreatic
cancer cells. Nature. 603:166–173. 2022.PubMed/NCBI View Article : Google Scholar
|
|
23
|
Pang YY, Chen ZY, Zeng DT, Li DM, Li Q,
Huang WY, Li B, Luo JY, Chi BT, Huang Q, et al: Checkpoint kinase 1
in colorectal cancer: Upregulation of expression and promotion of
cell proliferation. World J Clin Oncol. 16(101725)2025.PubMed/NCBI View Article : Google Scholar
|
|
24
|
Gu C, Wang W, Tang X, Xu T, Zhang Y, Guo
M, Wei R, Wang Y, Jurczyszyn A, Janz S, et al: CHEK1 and
circCHEK1_246aa evoke chromosomal instability and induce bone
lesion formation in multiple myeloma. Mol Cancer.
20(84)2021.PubMed/NCBI View Article : Google Scholar
|
|
25
|
Sun J, Zhu Z, Li W, Shen M, Cao C, Sun Q,
Guo Z, Liu L and Wu D: UBE2T-regulated H2AX monoubiquitination
induces hepatocellular carcinoma radioresistance by facilitating
CHK1 activation. J Exp Clin Cancer Res. 39(222)2020.PubMed/NCBI View Article : Google Scholar
|
|
26
|
Zuo W, Zhang W, Xu F, Zhou J and Bai W:
Long non-coding RNA LINC00485 acts as a microRNA-195 sponge to
regulate the chemotherapy sensitivity of lung adenocarcinoma cells
to cisplatin by regulating CHEK1. Cancer Cell Int.
19(240)2019.PubMed/NCBI View Article : Google Scholar
|
|
27
|
Sen T, Tong P, Stewart CA, Cristea S,
Valliani A, Shames DS, Redwood AB, Fan YH, Li L, Glisson BS, et al:
CHK1 inhibition in small-cell lung cancer produces single-agent
activity in biomarker-defined disease subsets and combination
activity with cisplatin or olaparib. Cancer Res. 77:3870–3884.
2017.PubMed/NCBI View Article : Google Scholar
|
|
28
|
Booth L, Roberts J, Poklepovic A and Dent
P: The CHK1 inhibitor SRA737 synergizes with PARP1 inhibitors to
kill carcinoma cells. Cancer Biol Ther. 19:786–796. 2018.PubMed/NCBI View Article : Google Scholar
|
|
29
|
Cui Q, Cai CY, Wang JQ, Zhang S, Gupta P,
Ji N, Yang Y, Dong X, Yang DH and Chen ZS: Chk1 inhibitor MK-8776
restores the sensitivity of chemotherapeutics in P-glycoprotein
overexpressing cancer cells. Int J Mol Sci. 20(4095)2019.PubMed/NCBI View Article : Google Scholar
|
|
30
|
Landau HJ, McNeely SC, Nair JS, Comenzo
RL, Asai T, Friedman H, Jhanwar SC, Nimer SD and Schwartz GK: The
checkpoint kinase inhibitor AZD7762 potentiates
chemotherapy-induced apoptosis of p53-mutated multiple myeloma
cells. Mol Cancer Ther. 11:1781–1788. 2012.PubMed/NCBI View Article : Google Scholar
|
|
31
|
Dai Y, Rahmani M, Pei XY, Khanna P, Han
SI, Mitchell C, Dent P and Grant S: Farnesyltransferase inhibitors
interact synergistically with the Chk1 inhibitor UCN-01 to induce
apoptosis in human leukemia cells through interruption of both Akt
and MEK/ERK pathways and activation of SEK1/JNK. Blood.
105:1706–1716. 2005.PubMed/NCBI View Article : Google Scholar
|
|
32
|
Soldevilla B, Lens-Pardo A,
Espinosa-Olarte P, Carretero-Puche C, Molina-Pinelo S, Robles C,
Benavent M, Gomez-Izquierdo L, Fierro-Fernández M, Morales-Burgo P,
et al: MicroRNA signature and integrative omics analyses define
prognostic clusters and key pathways driving prognosis in patients
with neuroendocrine neoplasms. Mol Oncol. 17:582–597.
2023.PubMed/NCBI View Article : Google Scholar
|
|
33
|
Livak KJ and Schmittgen TD: Analysis of
relative gene expression data using real-time quantitative PCR and
the 2(-Delta Delta C(T)) method. Methods. 25:402–408.
2001.PubMed/NCBI View Article : Google Scholar
|
|
34
|
Li N, Hu Y, Wu L and An J:
Clinicopathological correlations in 38 cases of
gastroenteropancreatic high-grade neuroendocrine neoplasms. Front
Oncol. 14(1399079)2024.PubMed/NCBI View Article : Google Scholar
|
|
35
|
Rosery V, Reis H, Savvatakis K, Kowall B,
Stuschke M, Paul A, Dechêne A, Yang J, Zhao B, Borgers A, et al:
Antitumor immune response is associated with favorable survival in
GEP-NEN G3. Endocr Relat Cancer. 28:683–693. 2021.PubMed/NCBI View Article : Google Scholar
|
|
36
|
Konukiewitz B, Schlitter AM, Jesinghaus M,
Pfister D, Steiger K, Segler A, Agaimy A, Sipos B, Zamboni G,
Weichert W, et al: Somatostatin receptor expression related to TP53
and RB1 alterations in pancreatic and extrapancreatic
neuroendocrine neoplasms with a Ki67-index above 20. Mod Pathol.
30:587–598. 2017.PubMed/NCBI View Article : Google Scholar
|
|
37
|
Bellizzi AM: Immunohistochemistry in the
diagnosis and classification of neuroendocrine neoplasms: What can
brown do for you? Hum Pathol. 96:8–33. 2020.PubMed/NCBI View Article : Google Scholar
|
|
38
|
Czeczok TW, Stashek KM, Maxwell JE,
O'Dorisio TM, Howe JR, Hornick JL and Bellizzi AM: Clusterin in
neuroendocrine epithelial neoplasms: Absence of expression in a
well-differentiated tumor suggests a jejunoileal origin. Appl
Immunohistochem Mol Morphol. 26:94–100. 2018.PubMed/NCBI View Article : Google Scholar
|


![Overall analysis of the DEGs. (A)
Volcano plot of the DEGs. Red and blue dots represent significantly
upregulated and downregulated genes, respectively (adjusted P-value
<0.05 and |log2FC|>1). (B) GO and KEGG enrichment
analysis of the DEGs. Bar plots show the top significantly enriched
terms. The x-axis represents the enrichment significance
[-Log10(adjusted P-value)], and numbers in parentheses
indicate gene counts for each term. DEGs, differentially expressed
genes; BP, biological processes; CC, cellular component; MF,
molecular function; KEGG, Kyoto Encyclopedia of Genes and
Genomes.](/article_images/etm/31/1/etm-31-01-13001-g01.jpg)