Introduction
The insulin/insulin-like growth factor 1 (IGF1)
signaling (IIS) pathway plays a notable role in regulating systemic
metabolism, growth and cellular survival; it involves insulin, IGF1
and IGF binding proteins (IGFBPs), which collectively modulate
glucose homeostasis and energy utilization (1,2). In
the central nervous system (CNS), insulin and IGF1 are involved in
neuronal maintenance, synaptic plasticity and myelination via
regulation of metabolic and trophic signaling pathways.
Dysregulation of the IIS pathway is involved in the onset of
several neurodegenerative diseases, such as Alzheimer's disease,
Parkinson's disease and Huntington's disease (3,4).
Spinocerebellar ataxia type 3 (SCA3), also known as
Machado-Joseph disease, is a progressive autosomal dominant
neurodegenerative disorder which is characterized by cerebellar
ataxia, pyramidal signs, peripheral neuropathy and autonomic
dysfunction (5). The disease is
caused by a CAG repeat expansion in the ataxin-3 (ATXN3)
gene, eventually leading to neurodegeneration. Neurofilament light
chain (NfL) has emerged as a reliable blood biomarker reflecting
neuronal injury and ataxia severity (6,7);
however, additional biomarkers capturing metabolic dysfunction or
systemic catabolism remain understudied.
Early studies in SCA3 and other cerebellar ataxias
indicate potential alterations in the IIS pathway, including
reduced circulating insulin and IGFBP1 levels, suggesting an
association between impaired metabolic signaling and disease status
(8,9). IGFBP1, one of the six high-affinity
IGFBPs, plays a central role in modulating IGF1 bioavailability and
insulin sensitivity. Produced primarily in the liver, IGFBP1 is
markedly downregulated by insulin and increased during fasting,
metabolic stress and catabolic states. A study demonstrated that in
contrast to insulin, IGFBP1 exhibited slower kinetics, making it a
more stable indicator of sustained metabolic adaptation (10). Elevated IGFBP1 levels have also
been associated with reduced body mass index (BMI), hepatic
dysfunction and adverse outcomes across chronic diseases, such as
diabetes, chronic liver disease and systemic inflammatory states
(11,12).
Furthermore, animal study using growth hormone
demonstrated transient motor improvement and neuroprotective
effects in SCA3 model (13), while
IGF1 supplementation shows similar effects in both animal models
and patients (14,15). However, these earlier
investigations were limited by small sample sizes, variable
treatment durations and the lack of direct association with
objective biomarkers of neurodegeneration, leaving the relevance of
the IIS pathway, particularly IGFBP1, uncertain in the context of
SCA3 pathophysiology. To address this gap, the present study
investigated whether plasma IGFBP1 levels are associated with
clinical manifestations and neurodegenerative burden in SCA3.
Particularly, the associations among IGFBP1, the Scale for the
Assessment and Rating of Ataxia (SARA) (16), NfL, BMI (17) and insulin were assessed.
Accordingly, a case-control study was performed comparing
individuals with SCA3 with age- and sex-matched healthy controls to
evaluate IGFBP1 as a potential biomarker of ataxia severity.
Materials and methods
Participants
A total of 32 patients with genetically confirmed
SCA3 were recruited from the Changhua Christian Hospital (Changhua,
Taiwan) between May 2021 and February 2022. The study protocol was
approved by the Institutional Review Board of Changhua Christian
Hospital (IRB nos. 200703 and 200730 for healthy control), and
written informed consent was obtained from all participants. The
inclusion criteria were as follows: i) Patients with a confirmed
CAG repeat expansion in the ATXN3 gene; and ii) age 20-80
years. The exclusion criteria included comorbidities that could
affect glucose or insulin metabolism, such as a cancer, stroke,
heart failure, renal failure or diabetes mellitus, and conditions
known to affect insulin or IGF signaling, including marked hepatic,
renal or thyroid dysfunction, based on medical record review.
Medication histories were also screened, verifying no use of drugs
known to affect IGF1 or IGFBP1 levels except coenzyme Q10(18), which was analyzed separately.
Ataxia severity was assessed using SARA (16), a semi-quantitative scale (range,
0-40) evaluating gait, stance, limb coordination and speech
(19). Based on SARA scores,
patients were classified into the following three disease stages
(20,21): Preclinical (SARA <3), stage I
(SARA ≤11) and stage II (SARA >11). The control group consisted
of 36 age- and sex-matched healthy individuals who met the same
exclusion criteria to ensure comparable metabolic and clinical
backgrounds. These participants were recruited from the outpatient
clinics at Changhua Christian Hospital. Basic demographic and
clinical data, including sex, age, BMI, age at onset, disease
duration and CAG repeat number, were recorded for all
participants.
Plasma biochemistry of NfL and IIS
components
All blood samples were collected under standardized
postprandial conditions. Participants consumed a typical
Taiwanese-style lunch (600-700 kcal) with balanced macronutrient
composition (carbohydrates, protein and fat). The meal was
self-selected by the participants and the details of the intake
were self-reported prior to the study measurements to confirm
consistency with the required caloric and macronutrient range. The
participants then followed a fixed sampling schedule, with blood
drawn at ~2:00 p.m., corresponding to a consistent 2-h postprandial
interval. To minimize acute metabolic variability, no additional
food, caffeine, caloric beverages, strenuous physical activity or
nutritional supplementation were allowed between lunch and blood
collection (22). Samples were
drawn in 10 ml BD Vacutainer® EDTA tubes (Becton,
Dickinson and Company), centrifuged at 1,400 x g at 4˚C for 15 min
to obtain plasma and stored at -80˚C until analysis. All
biochemical analyses were performed using plasma to ensure
methodological consistency and minimize clot-related pre-analytical
variability. Plasma NfL levels were quantified using the
Simoa® NF-light™ Advantage Kit (cat. no.
103186) and on the Simoa HD-X ultra-sensitive protein molecular
detection instrument (both Quanterix) (23). Additionally, the plasma levels of
IGF1, IGF2, IGFBP1, IGFBP3, glucose, and insulin were quantified
using the Human IGFI/IGF1 Immunoassay kit (cat. no. DG100b) and the
Human IGF2 Quantikine ELISA Kit (cat. no. DG200) (both R&D
Systems China Co., Ltd.), the Human IGFBP-1 ELISA Kit (cat. no.
ELH-IGFBP; RayBiotech Life), the Human IGFBP3 ELISA Kit (cat. no.
AB100541; Abcam), the Glucose Colorimetric Assay Kit (cat. no.
10009582; Cayman Chemical Company) and the Insulin ELISA Kit (cat.
no. 10-1113-01; Mercodia AB), respectively, according to the
manufacturer's instructions. Free IGF1 levels were estimated using
the IGF1/IGFBP3 ratio, a commonly used surrogate marker for
bioavailable IGF1. This ratio provides an indirect estimate and
does not replace direct measurement of free IGF1. Plasma
glucose-to-insulin ratio (G/I ratio) was calculated as glucose
(mg/dl) divided by insulin (µIU/ml) and used as a practical
surrogate for insulin sensitivity in blood samples obtained 2 h
postprandially, in contrast to fasting-based indices such as the
Homeostatic Model Assessment 2(24) or the Quantitative Insulin
Sensitivity Check Index (25).
Statistical analysis
The normality of data distribution was assessed
using the Shapiro-Wilk test, and most demographic and IIS-related
variables showed non-normal distributions and were therefore
summarized as medians and interquartile ranges (IQRs). Group
differences were compared using the Mann-Whitney U test, and
correlations were assessed using Spearman's rank correlation.
Non-parametric methods were applied throughout the analyses due to
skewed distributions and presence of potential outliers.
Categorical variables, such as sex, were analyzed using the
χ2 test or Fisher's exact test, as appropriate based on
expected cell counts. For IGFBP1, the majority of control samples
displayed optical density values at or below the lower limit of the
standard curve. In the absence of a laboratory-specific detection
limit, the sensitivity of the assay (5 pg/ml) was used as a
surrogate lower limit, and values below this threshold were imputed
as sensitivity/√2 (≈3.5 pg/ml), following established approaches
for handling left-censored biomarker data (26). Receiver operating characteristic
(ROC) curve analyses were performed to evaluate the ability of
IGFBP1 and other IIS markers to discriminate between early and
advanced SCA3 stages, with area under the curve (AUC) values used
to compare their diagnostic performance. Insulin levels were
categorized into tertiles to produce three groups with an
approximately equal number of cases in each group (T1, <3.65
µIU/ml; T2: 3.65-9.35 µIU/ml; T3: >9.35 µIU/ml). Group
differences between insulin tertiles were assessed using the
Kruskal-Wallis test, followed by Dunn's post hoc test. P<0.05
was considered to indicate a statistically significant difference.
All data analyses were performed using IBM Statistical Package for
the Social Sciences for Windows, version 22.0 (IBM Corp.).
Results
Participant characteristics and
baseline differences
A total of 32 genetically confirmed patients with
SCA3 and 36 age- and sex-matched healthy controls were enrolled in
the present study. There were no significant differences in age
[median, 49.0 (IQR, 34.3-54.8) vs. 47.5 (34.8-55.0) years; P=0.754]
or sex distribution (male, 62.5 vs. 61.1%; P=0.906) between groups.
BMI was significantly lower in patients with SCA3 compared with the
healthy controls [21.8 (19.5-25.4) vs. 23.6 (21.8-25.6) kg/m²;
P=0.040]. In addition, plasma NfL levels were significantly
elevated in the SCA3 group compared with the control group [27.8
(20.5-32.5) vs. 6.3 (4.2-7.6) pg/ml; P<0.001; Table I].
 | Table IDemographics and insulin/IGF1 system
of healthy controls (n=36) and patients with SCA3 (n=32). |
Table I
Demographics and insulin/IGF1 system
of healthy controls (n=36) and patients with SCA3 (n=32).
| Parameter | Control | SCA3 | P-value |
|---|
| Demographic | | | |
|
Male
sex | 22 (61.1) | 20 (62.5) | 0.906 |
|
Age,
years | 47.5
(34.8-55.0) | 49.0
(34.3-54.8) | 0.754 |
|
BMI,
kg/m2 | 23.6
(21.8-25.6) | 21.8
(19.5-25.4) | 0.040a |
|
Age at
onset, years | N/A | 35.0
(29.8-45.0) | |
|
Duration,
years | N/A | 10.0
(4.0-12.0) | |
|
CAG repeat
number | N/A | 71.5
(69.3-74.0) | |
|
SARA | N/A | 14.5
(7.4-21.0) | |
|
NfL,
pg/ml | 6.3 (4.2-7.6) | 27.8
(20.5-32.5) |
<0.001a |
| Insulin/IGF1
system | | | |
|
IGF1,
ng/ml | 55.2
(34.0-68.1) | 92.6
(67.9-108.6) |
<0.001a |
|
IGF2,
ng/ml | 312.8
(271.7-361.4) | 336.2
(316.2-395.0) | 0.002a |
|
IGFBP1,
pg/ml | 3.5 (3.5-41.5) | 252.9
(72.8-740.4) |
<0.001a |
|
IGFBP3,
ng/ml | 43.3
(37.8-47.9) | 41.8
(38.1-54.6) | 0.873 |
|
IGF1/IGFBP3
ratio | 1.27
(0.96-1.75) | 1.92
(1.35-2.49) | 0.002a |
|
Glucose,
mg/dl | 95.9
(73.6-116.5) | 98.9
(81.2-112.7) | 0.708 |
|
Insulin,
µIU/ml | 19.0
(8.8-28.1) | 6.1 (2.6-11.0) |
<0.001a |
|
G/I
ratio | 6.0 (3.3-9.3) | 17.1
(8.6-35.0) |
<0.001a |
Elevated IGFBP1, IGF2 and free IGF,
and insufficient insulin levels in patients with SCA3
Patients with SCA3 exhibited a significant increase
in plasma IGFBP1 compared with controls [252.9 (72.8-740.4) vs. 3.5
(3.5-41.5) pg/ml; P<0.001]. Total IGF1 levels were also higher
in the SCA3 group [92.6 (67.9-108.6) vs. 55.2 (34.0-68.1) ng/ml;
P<0.001], as were IGF2 levels [336.2 (316.2-395.0) vs. 312.8
(271.7-361.4) ng/ml; P=0.002]. No significant difference was
observed in IGFBP3 levels (P=0.873); however, the IGF1/IGFBP3
ratio, representing free IGF1, was significantly higher in patients
with SCA3 [1.92 (1.35-2.49) vs. 1.27 (0.96-1.75); P=0.002],
suggesting enhanced IGF1 bioavailability (Table I).
To assess potential confounding by coenzyme Q10
supplementation, all demographic and IIS-related variables were
compared in patients treated (n=17) or not (n=15) with Q10. The
results revealed no significant differences between the two groups
(Table SI).
Given the observed elevation in IGFBP1, upstream
insulin-related parameters were further assessed to explore
potential regulatory mechanisms. Glucose levels were comparable
between the SCA3 and control groups [98.9 (81.2-112.7) vs. 95.9
(73.6-116.5) mg/dl; P=0.708], whereas insulin levels were
significantly decreased in patients with SCA3 [6.1 (2.6-11.0) vs.
19.0 (8.8-28.1) µIU/ml; P<0.001]. Consequently, the G/I ratio, a
surrogate marker of insulin deficiency or sensitivity, was
significantly increased in patients with SCA3 [17.1 (8.6-35.0) vs.
6.0 (3.3-9.3); P<0.001], indicating impaired insulin signaling
(Table I).
IGFBP1 distinguishes ataxia severity
in SCA3
Patients with SCA3 were divided into early-stage
(SARA ≤11) and advanced-stage (SARA >11) groups. Compared with
early-stage patients, those with advanced ataxia exhibited
significantly higher plasma IGFBP1 levels [415.5 (207.9-913.2) vs.
72.5 (13.1-108.1) pg/ml; P=0.003] as well as higher NfL levels
[29.5 (25.1-38.1) vs. 18.8 (17.0-28.3) pg/ml; P=0.002]. These
findings indicate that both IGFBP1 and NfL effectively distinguish
between early and advanced stages of ataxia in SCA3. As expected,
patients in the advanced stage also had longer disease duration
[11.0 (9.0-15.0) vs. 4.0 (0-6.0) years; P<0.001] and lower BMI
[21.2 (18.8-22.9) vs. 25.4 (22.1-26.9) kg/m²; P=0.005], which was
consistent with greater disease burden. Other IIS-related
parameters, including glucose, insulin, the G/I ratio, IGF1, IGF2,
IGFBP3 and the IGF1/IGFBP3 ratio, did not differ significantly
between stages (all P>0.05) (Table
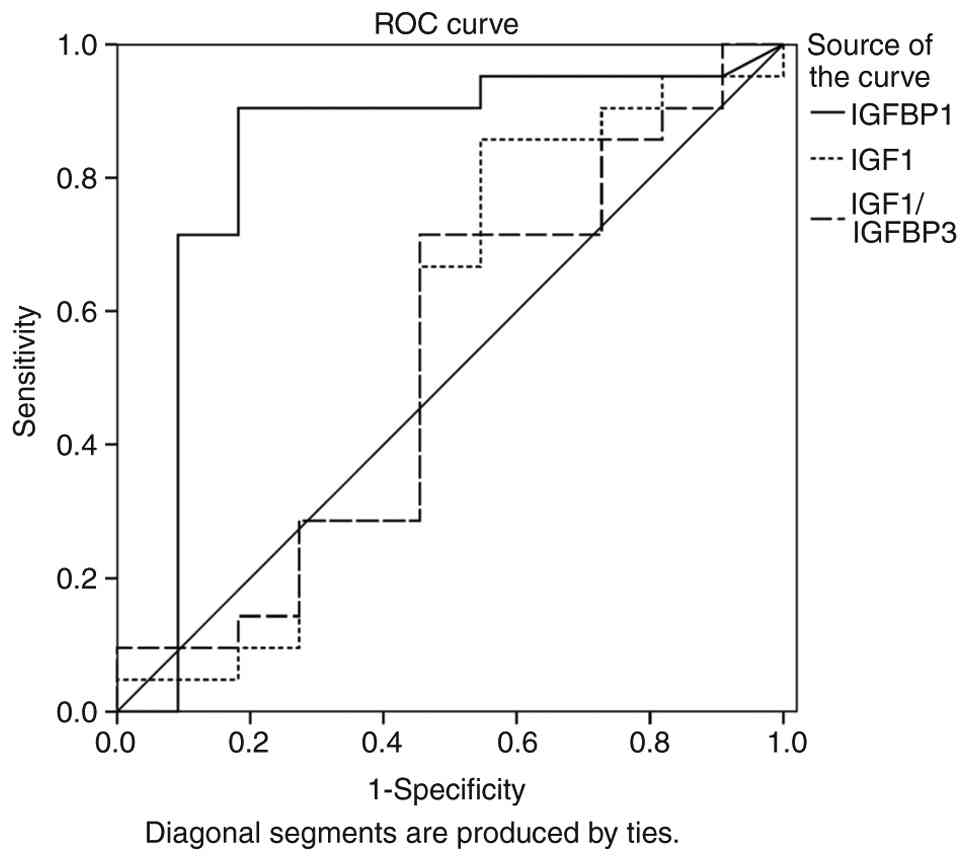
II). Furthermore, ROC curve analysis demonstrated that IGFBP1
had the strongest discriminatory ability for differentiating early
from advanced disease stages (AUC=0.829; 95% CI, 0.646-1.000;
P=0.003). With an optimal cutoff value of 139.1 pg/ml, a
sensitivity of 91% and specificity of 82% was yielded,
outperforming other IIS parameters (AUC range for other parameters,
0.385-0.541) (Fig. 1; Table SII).
| Table IISubgroup analysis of SARA stage I
(n=11) vs. Stage II (n=21) in patients with spinocerebellar ataxia
type 3. |
Table II
Subgroup analysis of SARA stage I
(n=11) vs. Stage II (n=21) in patients with spinocerebellar ataxia
type 3.
| Parameter | Stage I
(SARA≤11) | Stage II
(SARA>11) | P-value |
|---|
| Demographics | | | |
|
Male
sex | 7 (63.6) | 13 (61.9) | >0.999 |
|
Age,
years | 49.0
(29.0-51.0) | 49.0
(41.5-59.5) | 0.150 |
|
BMI,
kg/m2 | 25.4
(22.1-26.9) | 21.2
(18.8-22.9) | 0.005a |
|
Age at
onset, years | 33.0
(28.0-45.0) | 35.0
(32.5-46.5) | 0.945 |
|
Duration,
years | 4.0 (0-6.0) | 11.0
(9.0-15.0) |
<0.001a |
|
CAG repeat
number | 71.0
(68.0-73.0) | 72.0
(70.0-75.0) | 0.402 |
|
SARA | 5.0 (3.0-8.5) | 20.0
(14.5-22.5) |
<0.001a |
|
NfL,
pg/ml | 18.8
(17.0-28.3) | 29.5
(25.1-38.1) | 0.002a |
| Insulin/IGF1
system | | | |
|
IGF1,
ng/ml | 73.0
(59.4-124.8) | 94.2
(76.4-107.1) | 0.577 |
|
IGF2,
ng/ml | 365.7
(320.1-406.9) | 366.7
(310.6-395.0) | 0.996 |
|
IGFBP1,
pg/ml | 48.3
(13.0-137.0) | 415.5
(207.9-913.2) | 0.002a |
|
IGFBP3,
ng/ml | 40.2
(36.4-72.5) | 41.9
(35.8-53.8) | 0.907 |
|
IGF1/IGFBP3
ratio | 1.54
(1.23-3.17) | 1.96
(1.36-2.48) | 0.815 |
|
Glucose,
mg/dl | 99.1
(81.2-104.4) | 98.8
(81.2-124.1) | 0.584 |
|
Insulin,
µIU/ml | 6.0 (4.0-9.3) | 6.9 (2.2-12.2) | 0.969 |
|
G/I
ratio | 18.2
(10.8-21.7) | 16.1
(8.5-38.4) | 0.696 |
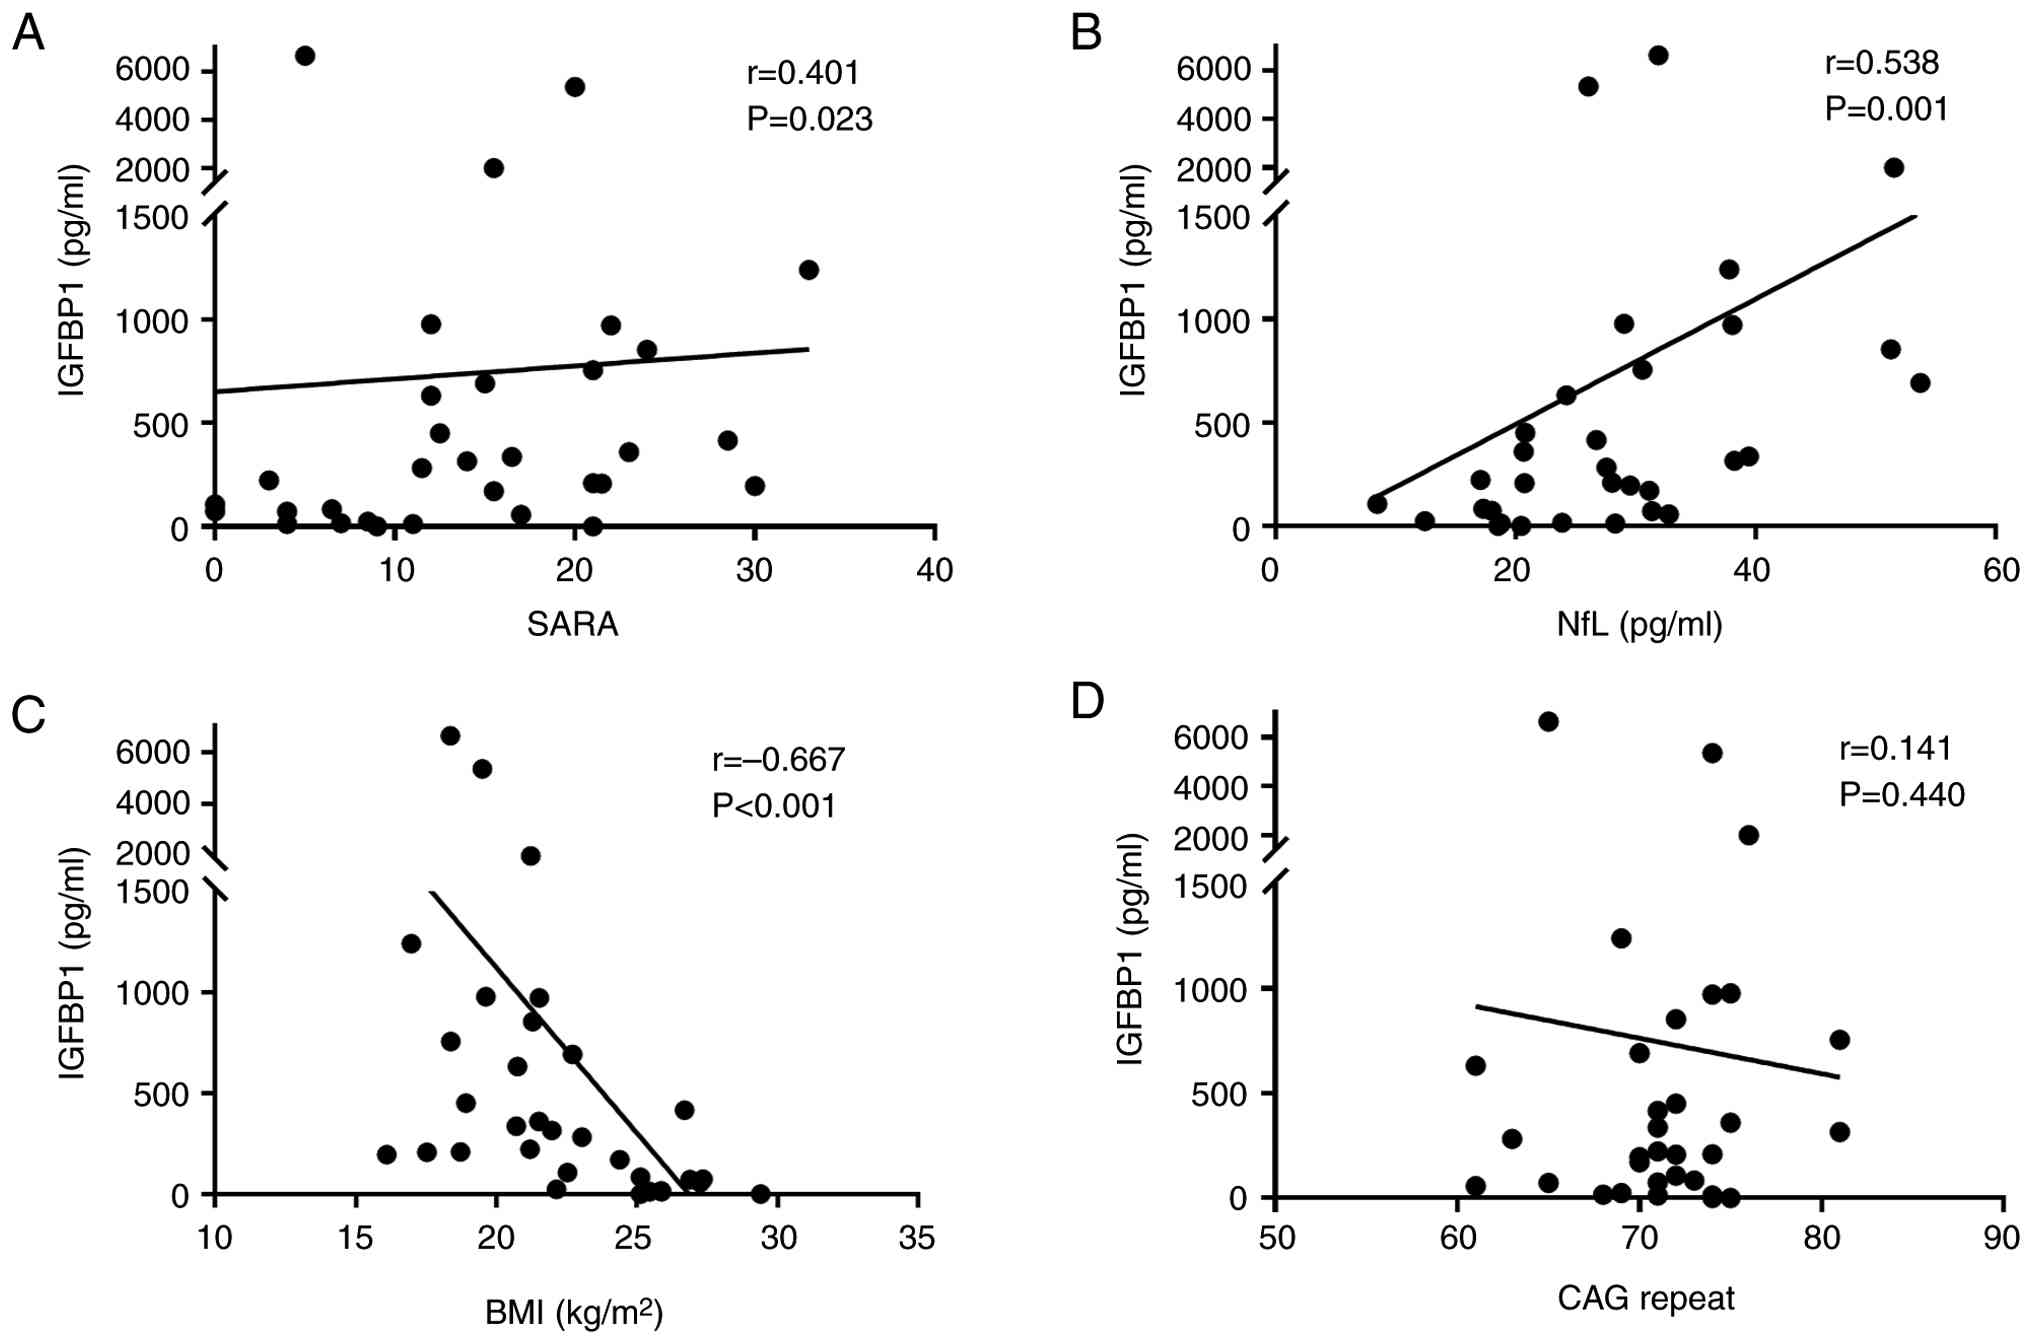
IGFBP1 is associated with clinical
severity and neurodegenerative indicators
In the SCA3 cohort, Spearman's correlation analysis
revealed that IGFBP1 levels were positively correlated with SARA
scores (r=0.401; P=0.023) and NfL (r=0.538; P=0.001), and
negatively correlated with BMI (r=-0.667; P<0.001). No
significant association with CAG repeat length was observed
(r=0.141; P=0.440) (Fig. 2).
Although several higher IGFBP1 values were present, all
measurements were deemed physiologically plausible and therefore no
data points were excluded from the analysis.
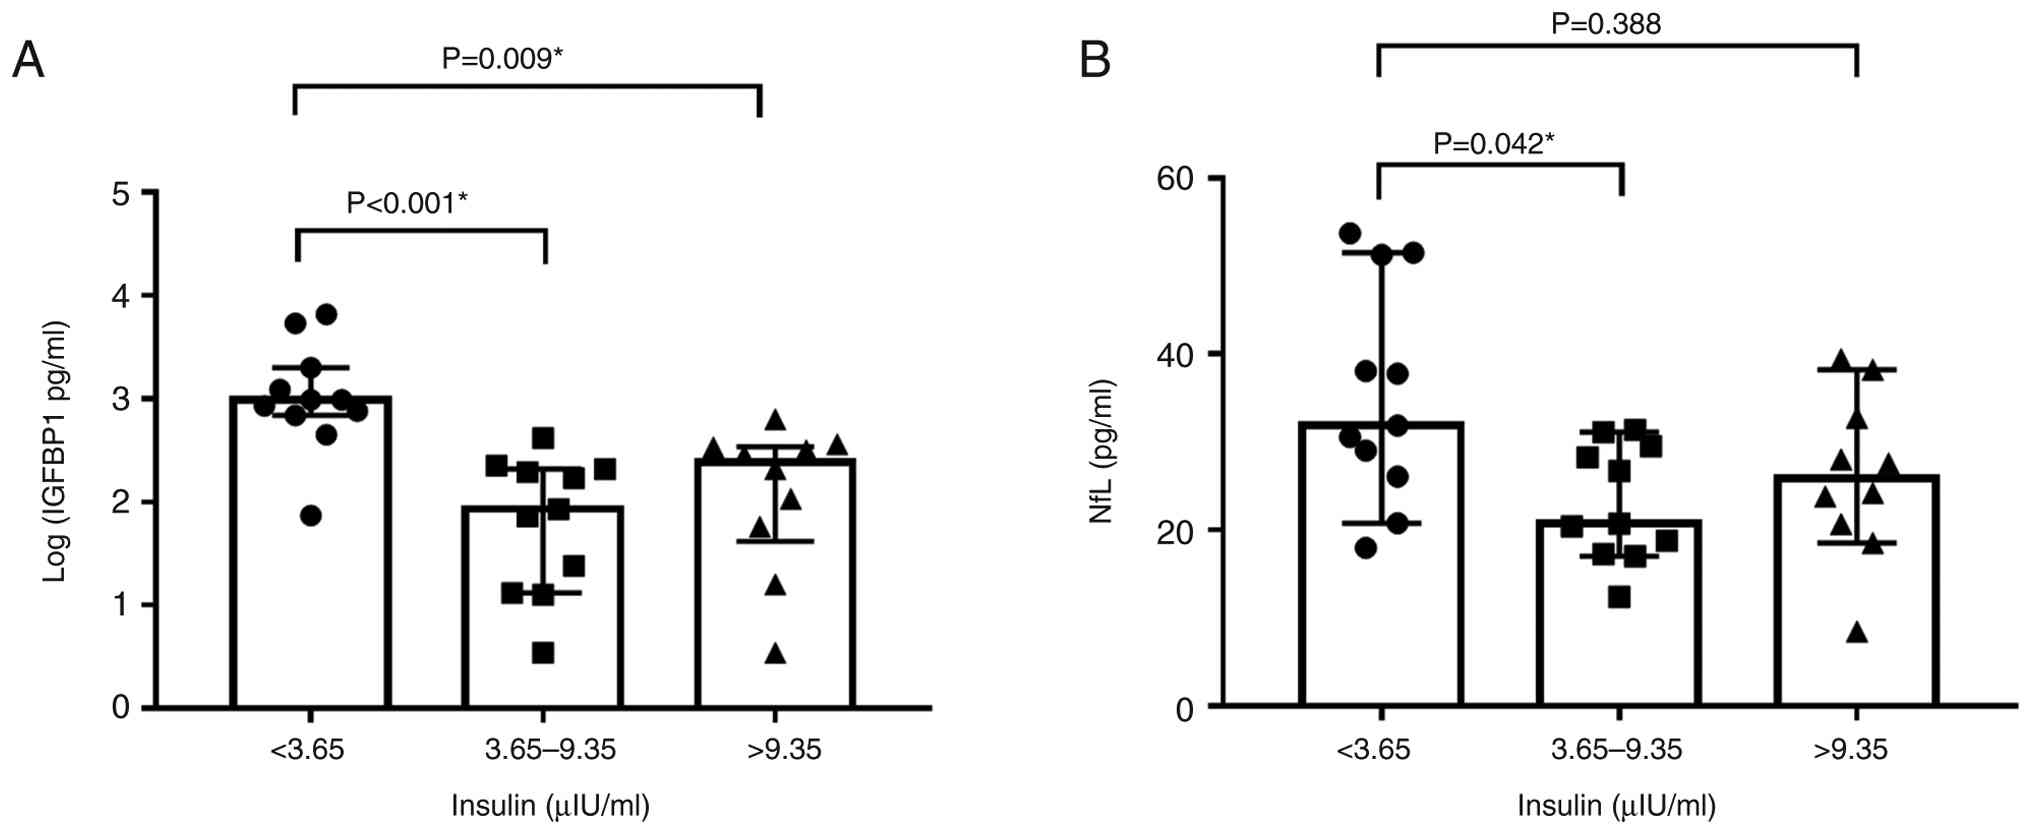
Lower insulin is associated with
elevated IGFBP1 and NfL
To further investigate the interplay between insulin
signaling and neurodegenerative markers, patients with SCA3 were
stratified into tertiles based on baseline plasma insulin levels.
Log-transformed IGFBP1 levels differed significantly among insulin
tertiles (Kruskal-Wallis test, P<0.001). Dunn's post hoc test
revealed that patients in the lowest insulin tertile had
significantly higher IGFBP1 levels than those in the middle
(P<0.001) and highest tertiles (P=0.009), whereas no significant
difference was observed between the middle and highest tertiles.
Similarly, NfL levels also differed among insulin tertiles
(P=0.046), with higher levels in the lowest vs. middle tertile
(P=0.042), but no significant difference vs. the highest tertile
(P=0.388; Fig. 3A and B). These findings suggested that insulin
insufficiency could be associated with increased IGFBP1 expression
and greater neuroaxonal damage. Notably, insulin concentrations
were lowest in the tertile with the highest IGFBP1 and NfL levels,
further supporting an inverse association between insulin signaling
and neurodegenerative indicators. However, the association between
insulin tertiles and IGFBP1 or NfL was not attributed to
differences in ataxia severity or genetic factors, as SARA scores,
age at onset and CAG repeat numbers were comparable across insulin
tertiles (all P>0.05, Fig.
S1).
Discussion
Although alterations in the IIS pathway have been
described in SCA3, the clinical significance of circulating IGFBP1
remains unclear. The present study showed that plasma IGFBP1 levels
were significantly elevated in patients with SCA3 and was
associated with clinical severity (SARA), neurodegeneration (NfL)
and BMI. These associations suggested that IGFBP1 could reflect
disease activity rather than genetic load, providing complementary
information to CAG repeat length. While elevated IGFBP1 in SCA3 has
been previously reported (8), the
present study expanded these earlier findings by linking IGFBP1 to
neurodegeneration biomarkers and directly comparing its performance
with other IIS components. Notably, ROC analysis revealed that
IGFBP1 outperformed other IIS components, including insulin,
total/free IGF1 and IGF2, in distinguishing early from advanced
disease stages, thus highlighting its potential as a clinically
relevant and stage-sensitive biomarker.
Normoglycemic hypoinsulinemia was evident in the
current SCA3 cohort, which was consistent with previous findings
(8). Although this pattern could
arise from pancreatic β-cell dysfunction or altered insulin
kinetics, the present results suggested that reduced insulin
availability could be involved in the upregulation of hepatic
IGFBP1 secretion. The present finding was supported by the
observation that patients with the lowest insulin levels exhibited
the highest IGFBP1 and NfL concentrations, thus indicating that
peripheral insulin insufficiency could exacerbate central
neurodegeneration. Notably, this coordinated elevation of IGFBP1
and NfL occurred even when clinical severity (SARA scores) and
genetic factors (CAG repeat length) were comparable across groups,
thus suggesting that the IGFBP1/NfL association could reflect a
shared underlying biological process linking metabolic stress and
neuroaxonal damage, rather than merely mirroring clinical ataxia
severity. Furthermore, the significantly increased G/I ratio in
patients with SCA3 compared with healthy controls indicated
decreased insulin secretion rather than insulin resistance, despite
the absence of overt hyperglycemia. Notably, this ratio remained
comparable between early-vs. advanced-stage), suggesting that
impaired insulin secretion is a stable metabolic characteristic in
this patient cohort.
IGFBP1 serves a key role in regulating IGF1
availability by binding circulating IGF1 with high affinity,
thereby reducing the fraction of free IGF1 capable of activating
IGF1 receptors (27). Hepatic
IGFBP1 synthesis can be increased under conditions of low insulin,
fasting or metabolic stress, thereby further limiting IGF1
bioactivity (28). As IGFBP1 can
cross the blood-brain barrier (29), elevated peripheral IGFBP1 levels
can be translated into diminished IGF1 signaling within the CNS
(30). Such inhibition could
compromise IGF1-mediated neuroprotective pathways, which are
particularly relevant in SCA3, where myelin and oligodendrocyte
dysfunction can be involved in disease pathogenesis (31,32).
In addition, a previous study demonstrated that IGFBP1 expression
was affected by inflammatory mediators, such as IL-6, which were
increased in the brain tissues of patients with SCA3(33). The catabolic state associated with
advanced SCA3, characterized by lower BMI and potential sarcopenia,
can further drive IGFBP1 upregulation (12,34,35);
therefore, IGFBP1 could not only reflect metabolic stress but could
also exacerbate neurodegeneration by inhibiting IGF1 signaling and
myelination (10,36). Taken together, these data suggested
that IGFBP1 could represent a point of convergence between
peripheral metabolic insufficiency and central neurodegenerative
processes in SCA3. Unlike CAG repeat number, which reflects genetic
risk, IGFBP1 appears to reflect disease activity, thus providing a
sensitive indicator for monitoring disease progression and
therapeutic response. Although, this proposed mechanism, whereby
circulating IGFBP1 could cross the blood-brain barrier and
attenuate central IGF1 signaling, is intriguing, it should be
regarded as a working model rather than a demonstrated pathway.
Direct evidence is still needed to verify whether IGFBP1 could
directly contribute to neurodegeneration or reflect consequences of
disease-related metabolic dysregulation. Future studies
incorporating measurements of IGFBP1 in cerebrospinal fluid or
brain tissues from SCA3 models, as well as experiments exploring
IGF-independent actions that could underly its association with
ataxia severity, should be conducted.
The present study showed elevated circulating IGF2
levels in patients with SCA3, a finding not previously reported.
Although IGF2 was not a primary focus of the present study, its
elevation in SCA3 could reflect a compensatory response to impaired
insulin signaling or enhanced catabolic stress (37). While IGF2 levels did not correlate
with ataxia severity, prior studies in other neurodegenerative
models suggest a potential neuroprotective role for IGF2 (38,39).
These observations raise the possibility that increased IGF2 in
SCA3 could represent an adaptive mechanism to counteract metabolic
or proteostatic imbalance, warranting further investigation.
The present study has several limitations. Firstly,
the sample size, while comparable to previous biomarker studies in
rare neurodegenerative disorders (7,8,40),
remains modest and could limit the statistical power to detect more
subtle associations, including those between IGFBP1 levels and CAG
repeat length. Consequently, the generalizability of the findings
should be interpreted with caution. Future and larger multi-center
studies with more diverse SCA3 cohorts are needed to validate the
results of this study and to further clarify disease-biomarker
associations. Additionally, longitudinal data are also necessary to
establish IGFBP1 as a reliable marker of disease progression over
time. Mechanistic investigations are also warranted to assess
whether IGFBP1 could exert a causal role in neurodegeneration or if
it primarily reflects downstream disease-related metabolic
dysregulation. Finally, therapeutic strategies aimed at modulating
the IIS, through insulin sensitizers, IGF1 supplementation or
IGFBP1 inhibition, warrant further investigation in future
trials.
Overall, the results of the current study suggested
that IGFBP1 could be a promising biomarker for ataxia severity and
neurodegeneration in SCA3; its strong associations with NfL, SARA
and BMI supported its potential clinical utility in disease
monitoring and stratification. IGFBP1 could also represent a
mechanistic link between metabolic dysfunction and CNS pathology in
SCA3.
Supplementary Material
Clinical and genetic characteristics
across insulin tertiles in the spinocerebellar ataxia type 3
cohort. Participants were stratified into tertiles based on plasma
insulin concentrations: First tertile (n=11; <3.65
μIU/ml), second tertile (n=11; 3.65-9.35 μIU/ml), and
third tertile (n=10; >9.35 μIU/ml). (A) SARA scores, (B)
age at onset, and (C) CAG repeat number. SARA, Scale for the
Assessment and Rating of Ataxia.
Comparison of demographic and
insulin/IGF sign aling related variables between participants with
(n=17) and without (n=15) coenzyme Q10 use.
AUC values of IIS components for
differentiating early versus advanced spinocerebellar ataxia type 3
stages.
Acknowledgements
The authors would like to thank Dr Tsung-Han Lee
(Department of Chinese Medicine, Changhua Christian Hospital,
Changhua, Taiwan) for providing assistance in submitting the
required documents to the Institutional Review Board. The authors
would also like to thank Professor. Jui-Chih Chang (Center of
Regenerative Medicine and Tissue Repair, Institute of ATP, Changhua
Christian Hospital, Changhua, Taiwan) for providing suggestions
that aided in refining the presentation of the results and
enhancing the clarity and depth of the discussion, which
contributed meaningfully to the overall quality of the
manuscript.
Funding
Funding: The present study was supported by research grants from
Changhua Christian Hospital, Taiwan (grant nos. 109-CCH-IRP-055 and
110-CCHMST-123). Additional funding was provided by the National
Science and Technology Council, Taiwan (grant nos. NSTC
112-2320-B-039-046 and NSTC 112-2314-B-371-007-MY3), the Ministry
of Science and Technology, Taiwan (grant no. MOST
109-2314-B-371-008-MY3), China Medical University Hospital (grant
no. DMR-112-176) and the Chinese Medicine Research Center, China
Medical University through the Featured Areas Research Center
Program under the Higher Education Sprout Project, Ministry of
Education, Taiwan (grant no. CMRC-CMA-0).
Availability of data and materials
The data generated in the present study may be
requested from the corresponding author.
Authors' contributions
CC, HeC, YC, SS and CLi conceived and designed the
study. CC, WC and TL interpreted the results and wrote the
manuscript. CC, WC, HuC, JC and CLe contributed to sample
collection and data analysis. YC and SS analyzed data. CC, HeC and
CLi confirm the authenticity of all the raw data. All authors have
read and approved the final manuscript.
Ethics approval and consent to
participate
All procedures in this case-control study were
approved by the Independent Ethics Committee of the Changhua
Christian Hospital (approval nos. 200703 and 200730) and written
informed consent was obtained from all participants.
Patient consent for publication
Not applicable.
Competing interests
The authors declare that they have no competing
interests.
References
|
1
|
Sadagurski M and White MF: Integrating
metabolism and longevity through insulin and IGF1 signaling.
Endocrinol Metab Clin North Am. 42:127–148. 2013.PubMed/NCBI View Article : Google Scholar
|
|
2
|
Werner H: The IGF1 signaling pathway: From
basic concepts to therapeutic opportunities. Int J Mol Sci.
24(14882)2023.PubMed/NCBI View Article : Google Scholar
|
|
3
|
Majumder P, Roy K, Bagh S and Mukhopadhyay
D: Receptor tyrosine kinases (RTKs) consociate in regulatory
clusters in Alzheimer's disease and type 2 diabetes. Mol Cell
Biochem. 459:171–182. 2019.PubMed/NCBI View Article : Google Scholar
|
|
4
|
Muddapu VR, Dharshini SAP, Chakravarthy VS
and Gromiha MM: Neurodegenerative diseases-is metabolic deficiency
the root cause? Front Neurosci. 14(213)2020.PubMed/NCBI View Article : Google Scholar
|
|
5
|
Paulson H and Shakkottai V:
Spinocerebellar ataxia type 3. In: GeneReviews®
[Internet]. Adam MP, Bick S, Mirzaa GM, Pagon RA, Wallace SE and
Amemiya A (eds.), Seattle (WA): University of Washington, Seattle,
1993.
|
|
6
|
Chen Y, Jin Y, Hu Z, Qiu M, Li D, Cai Q,
Tao C, Lou D, Qi L, Chen S, et al: Association between serum
neurofilament light chain and neurochemistry deficits in patients
with spinocerebellar ataxia type 3. Cerebellum. 23:92–100.
2024.PubMed/NCBI View Article : Google Scholar
|
|
7
|
Wilke C, Haas E, Reetz K, Faber J,
Garcia-Moreno H, Santana MM, van de Warrenburg B, Hengel H, Lima M,
Filla A, et al: Neurofilaments in spinocerebellar ataxia type 3:
Blood biomarkers at the preataxic and ataxic stage in humans and
mice. EMBO Mol Med. 12(e11803)2020.PubMed/NCBI View Article : Google Scholar
|
|
8
|
Saute JAM, da Silva ACF, Muller AP, Hansel
G, de Mello AS, Maeda F, Vedolin L, Saraiva-Pereira ML, Souza DO,
Arpa J, et al: Serum insulin-like system alterations in patients
with spinocerebellar ataxia type 3. Mov Disord. 26:731–735.
2011.PubMed/NCBI View Article : Google Scholar
|
|
9
|
Torres-Aleman I, Barrios V, Lledo A and
Berciano J: The insulin-like growth factor I system in cerebellar
degeneration. Ann Neurol. 39:335–342. 1996.PubMed/NCBI View Article : Google Scholar
|
|
10
|
Crosby S, Tsigos C, Anderton C, Gordon C,
Young R and White A: Elevated plasma insulin-like growth factor
binding protein-1 levels in type 1 (insulin-dependent) diabetic
patients with peripheral neuropathy. Diabetologia. 35:868–872.
1992.PubMed/NCBI View Article : Google Scholar
|
|
11
|
Busiguina S, Fernandez AM, Barrios V,
Clark R, Tolbert DL, Berciano J and Torres-Aleman I:
Neurodegeneration is associated to changes in serum insulin-like
growth factors. Neurobiol Dis. 7:657–665. 2000.PubMed/NCBI View Article : Google Scholar
|
|
12
|
Lang CH and Frost RA: Role of growth
hormone, insulin-like growth factor-I, and insulin-like growth
factor binding proteins in the catabolic response to injury and
infection. Curr Opin Clin Nutr Metab Care. 5:271–279.
2002.PubMed/NCBI View Article : Google Scholar
|
|
13
|
Wu S, Liu K, Cheng W, Su S, Lin Y, Lin T,
Cheng Y, Chang J, Wu Y and Liu C: Growth hormone rescue cerebellar
degeneration in SCA3 transgenic mice. Biochem Biophys Res Commun.
529:467–473. 2020.PubMed/NCBI View Article : Google Scholar
|
|
14
|
Arpa J, Sanz-Gallego I, Medina-Báez J,
Portela LV, Jardim LB, Torres-Aleman I and Saute JA: Subcutaneous
insulin-like growth factor-1 treatment in spinocerebellar ataxias:
An open label clinical trial. Mov Disord. 26:358–359.
2011.PubMed/NCBI View Article : Google Scholar
|
|
15
|
Lin YS, Cheng WL, Chang JC, Lin TT, Chao
YC and Liu CS: IGF-1 as a potential therapy for spinocerebellar
ataxia type 3. Biomedicines. 10(505)2022.PubMed/NCBI View Article : Google Scholar
|
|
16
|
Schmitz-Hübsch T, du Montcel ST, Baliko L,
Berciano J, Boesch S, Depondt C, Giunti P, Globas C, Infante J,
Kang JS, et al: Scale for the assessment and rating of ataxia:
Development of a new clinical scale. Neurology. 66:1717–1720.
2006.PubMed/NCBI View Article : Google Scholar
|
|
17
|
Yang JS, Chen PP, Lin MT, Qian MZ, Lin HX,
Chen XP, Shang XJ, Wang DN, Chen YC, Jiang B, et al: Association
between body mass index and disease severity in Chinese
spinocerebellar ataxia type 3 patients. Cerebellum. 17:494–498.
2018.PubMed/NCBI View Article : Google Scholar
|
|
18
|
Alehagen U, Johansson P, Aaseth J,
Alexander J and Brismar K: Increase in insulin-like growth factor 1
(IGF-1) and insulin-like growth factor binding protein 1 after
supplementation with selenium and coenzyme Q10. A prospective
randomized double-blind placebo-controlled trial among elderly
Swedish citizens. PLoS One. 12(e0178614)2017.PubMed/NCBI View Article : Google Scholar
|
|
19
|
Zhou J, Lei L, Liao X, Wang J, Jiang H,
Tang B and Shen L: Related factors of ICARS and SARA scores on
spinocerebellar ataxia type 3/Machado-Joseph disease. Zhong Nan Da
Xue Xue Bao Yi Xue Ban. 36:498–503. 2011.PubMed/NCBI View Article : Google Scholar
|
|
20
|
Li QF, Dong Y, Yang L, Xie JJ, Ma Y, Du
YC, Cheng HL, Ni W and Wu ZY: Neurofilament light chain is a
promising serum biomarker in spinocerebellar ataxia type 3. Mol
Neurodegener. 14(39)2019.PubMed/NCBI View Article : Google Scholar
|
|
21
|
Maas RPPWM, van Gaalen J, Klockgether T
and van de Warrenburg BPC: The preclinical stage of spinocerebellar
ataxias. Neurology. 85:96–103. 2015.PubMed/NCBI View Article : Google Scholar
|
|
22
|
Hancox RJ and Landhuis CE: Correlation
between measures of insulin resistance in fasting and non-fasting
blood. Diabetol Metab Syndr. 3(23)2011.PubMed/NCBI View Article : Google Scholar
|
|
23
|
Chiu C, Cheng W, Lin Y, Lin T, Chang H,
Chang Y, Lee C, Chang H and Liu C: A pilot study: Handgrip as a
predictor in the disease progression of SCA3. Orphanet J Rare Dis.
18(317)2023.PubMed/NCBI View Article : Google Scholar
|
|
24
|
Levy JC, Matthews DR and Hermans MP:
Correct homeostasis model assessment (HOMA) evaluation uses the
computer program. Diabetes Care. 21:2191–2192. 1998.PubMed/NCBI View Article : Google Scholar
|
|
25
|
Katz A, Nambi SS, Mather K, Baron AD,
Follmann DA, Sullivan G and Quon MJ: Quantitative insulin
sensitivity check index: A simple, accurate method for assessing
insulin sensitivity in humans. J Clin Endocrinol Metab.
85:2402–2410. 2000.PubMed/NCBI View Article : Google Scholar
|
|
26
|
Molina-Castro M, Rowitz B and Pepino MY:
Glucagon-like peptide-1, fibroblast growth factor 21, and other
endocrine responses to alcohol ingestion in women before and after
metabolic surgery. Front Pharmacol. 16(1575156)2025.PubMed/NCBI View Article : Google Scholar
|
|
27
|
Rajaram S, Baylink DJ and Mohan S:
Insulin-like growth factor-binding proteins in serum and other
biological fluids: Regulation and functions. Endocr Rev.
18:801–831. 1997.PubMed/NCBI View Article : Google Scholar
|
|
28
|
Lee PD, Conover CA and Powell DR:
Regulation and function of insulin-like growth factor-binding
protein-1. Proc Soc Exp Biol Med. 204:4–29. 1993.PubMed/NCBI View Article : Google Scholar
|
|
29
|
Bunn RC, King WD, Winkler MK and Fowlkes
JL: Early developmental changes in IGF-I, IGF-II, IGF binding
protein-1, and IGF binding protein-3 concentration in the
cerebrospinal fluid of children. Pediatr Res. 58:89–93.
2005.PubMed/NCBI View Article : Google Scholar
|
|
30
|
Lewitt MS and Boyd GW: The role of
insulin-like growth factors and insulin-like growth factor-binding
proteins in the nervous system. Biochem Insights.
12(1178626419842176)2019.PubMed/NCBI View Article : Google Scholar
|
|
31
|
Ramani B, Panwar B, Moore LR, Wang B,
Huang R, Guan Y and Paulson HL: Comparison of spinocerebellar
ataxia type 3 mouse models identifies early gain-of-function,
cell-autonomous transcriptional changes in oligodendrocytes. Hum
Mol Genet. 26:3362–3374. 2017.PubMed/NCBI View Article : Google Scholar
|
|
32
|
Schuster KH, Zalon AJ, Zhang H, DiFranco
DM, Stec NR, Haque Z, Blumenstein KG, Pierce AM, Guan Y, Paulson HL
and McLoughlin HS: Impaired oligodendrocyte maturation is an early
feature in SCA3 disease pathogenesis. J Neurosci. 42:1604–1617.
2022.PubMed/NCBI View Article : Google Scholar
|
|
33
|
Evert BO, Vogt IR, Vieira-Saecker AM,
Ozimek L, de Vos RA, Brunt ER, Klockgether T and Wüllner U: Gene
expression profiling in ataxin-3 expressing cell lines reveals
distinct effects of normal and mutant ataxin-3. J Neuropathol Exp
Neurol. 62:1006–1018. 2003.PubMed/NCBI View Article : Google Scholar
|
|
34
|
Nolte AA, Movin M, Lundin H and Salminen
H: IGFBP-1 predicts all-cause mortality in elderly women
independently of IGF-I. Growth Horm IGF Res. 25:281–285.
2015.PubMed/NCBI View Article : Google Scholar
|
|
35
|
Leite CMBA, Schieferdecker MEM, Frehner C,
Munhoz RP, Ashizawa T and Teive HAG: Body composition in
Spinocerebellar ataxia type 3 and 10 patients: Comparative study
with control group. Nutr Neurosci. 23:49–54. 2020.PubMed/NCBI View Article : Google Scholar
|
|
36
|
Ye P, Carson J and D'Ercole AJ: In vivo
actions of insulin-like growth factor-I (IGF-I) on brain
myelination: Studies of IGF-I and IGF binding protein-1 (IGFBP-1)
transgenic mice. J Neurosci. 15:7344–7356. 1995.PubMed/NCBI View Article : Google Scholar
|
|
37
|
Biadgo B, Tamir W and Ambachew S:
Insulin-like growth factor and its therapeutic potential for
diabetes complications-mechanisms and metabolic links: A review.
Rev Diabet Stud. 16:24–34. 2020.PubMed/NCBI View Article : Google Scholar
|
|
38
|
Arcos J, Grunenwald F, Sepulveda D, Jerez
C, Urbina V, Huerta T, Troncoso-Escudero P, Tirado D, Perez A,
Diaz-Espinoza R, et al: IGF2 prevents dopaminergic neuronal loss
and decreases intracellular alpha-synuclein accumulation in
Parkinson's disease models. Cell Death Discov.
9(438)2023.PubMed/NCBI View Article : Google Scholar
|
|
39
|
García-Huerta P, Troncoso-Escudero P, Wu
D, Thiruvalluvan A, Cisternas-Olmedo M, Henríquez DR, Plate L,
Chana-Cuevas P, Saquel C, Thielen P, et al: Insulin-like growth
factor 2 (IGF2) protects against Huntington's disease through the
extracellular disposal of protein aggregates. Acta Neuropathol.
140:737–764. 2020.PubMed/NCBI View Article : Google Scholar
|
|
40
|
Coarelli G, Darios F, Petit E, Dorgham K,
Adanyeguh I, Petit E, Brice A, Mochel F and Durr A: Plasma
neurofilament light chain predicts cerebellar atrophy and clinical
progression in spinocerebellar ataxia. Neurobiol Dis.
153(105311)2021.PubMed/NCBI View Article : Google Scholar
|